detecting kerogen as a biosignature using colocated uv ...€¦ · research article detecting...
TRANSCRIPT
Research Article
Detecting Kerogen as a BiosignatureUsing Colocated UV Time-Gated Raman
and Fluorescence Spectroscopy
Svetlana Shkolyar,1,2* Evan J. Eshelman,3 Jack D. Farmer,1 David Hamilton,3
Michael G. Daly,3 and Cody Youngbull4
Abstract
The Mars 2020 mission will analyze samples in situ and identify any that could have preserved biosignatures inancient habitable environments for later return to Earth. Highest priority targeted samples include aqueouslyformed sedimentary lithologies. On Earth, such lithologies can contain fossil biosignatures as aromatic carbon(kerogen). In this study, we analyzed nonextracted kerogen in a diverse suite of natural, complex samples usingcolocated UV excitation (266 nm) time-gated (UV-TG) Raman and laser-induced fluorescence spectroscopies. Weinterrogated kerogen and its host matrix in samples to (1) explore the capabilities of UV-TG Raman andfluorescence spectroscopies for detecting kerogen in high-priority targets in the search for possible biosignatureson Mars; (2) assess the effectiveness of time gating and UV laser wavelength in reducing fluorescence in Ramanspectra; and (3) identify sample-specific issues that could challenge rover-based identifications of kerogen usingUV-TG Raman spectroscopy. We found that ungated UV Raman spectroscopy is suited to identify diagnostickerogen Raman bands without interfering fluorescence and that UV fluorescence spectroscopy is suited to identifykerogen. These results highlight the value of combining colocated Raman and fluorescence spectroscopies, similarto those obtainable by SHERLOC on Mars 2020, to strengthen the confidence of kerogen detection as a po-tential biosignature in complex natural samples. Key Words: Raman spectroscopy—Laser-induced fluorescencespectroscopy—Mars Sample Return—Mars 2020 mission—Kerogen—Biosignatures. Astrobiology 18, 431–453.
1. Introduction
1.1. Searching for biosignatures in martian samples
The 2011 Planetary Science Decadal Survey
(National Research Council, NRC, 2011) and the 2008NASA Astrobiology Roadmap (Des Marais et al., 2008) as-sign a high priority to searching for past or present life onMars. Both documents recommend that the highest priority forthe coming decade should be to send a mission to Mars tocache a suite of samples containing potential signatures ofpast or present life for later biogenicity analysis on Earthusing multiple lines of evidence from sophisticated labora-tory tools (NanoSIMS for isotopic and elemental distribu-tions, X-ray absorption near edge structure spectroscopy forcarbon bonding and structural information, etc.). As a firststep toward this goal, NASA’s Mars 2020 rover will use adefined instrument suite to select and cache *30 g of sam-ples with a total mass of <500 g (Mustard et al., 2013).
To meet mission goals, there is a need to assess the abilityof in situ techniques selected for the instrument payload toidentify the best samples through realistic terrestrial analogstudies. To maximize the chances of finding biosignatures incollected samples, it is crucial to develop a strategy for in situselection of samples, based on their contextual associationwith past habitable environments and potential to preservebiosignatures (Farmer and Des Marais, 1999; Farmer, 2012).
The largest pool of organic matter on Earth is sedimen-tary reduced organic carbon (Farmer and Des Marais, 1999).After burial, this carbon undergoes degradation (e.g., ther-mal maturation) and alteration into complex mixtures ofmacromolecular amorphous and aromatic carbon, primarilyas polycyclic aromatic hydrocarbons (PAHs), known askerogen. The initial composition, structure, and thermalmaturation pathway will define the aromaticity and finalmakeup of the kerogen. For example, low thermal matu-rity kerogen is typically composed of long chain aliphatic
1School of Earth and Space Exploration, Arizona State University, Tempe, Arizona.2*Current address: Geophysical Laboratory, Carnegie Institution of Washington, Washington, District of Columbia.3The Centre for Research in Earth and Space Science (CRESS), York University, Toronto, Ontario, Canada.4Flathead Lake Biological Station, University of Montana, Polson, Montana.
ASTROBIOLOGYVolume 18, Number 4, 2018ª Mary Ann Liebert, Inc.DOI: 10.1089/ast.2017.1716
431
Dow
nloa
ded
by C
arni
gie
Inst
Of
Was
hing
ton
from
ww
w.li
eber
tpub
.com
at 0
4/09
/18.
For
per
sona
l use
onl
y.
hydrocarbons. See Marshall et al. (2010) for a review ofhow terrestrial organic matter matures to kerogen. On Earth,kerogen represents *1016 tons of C compared with *1012
tons as living biomass (Vandenbroucke and Largeau, 2007).Although there are nonbiological sources for kerogen
(Section 1.2), given biogenic kerogen’s abundance on Earth,one might expect it to be the likeliest biosignature detectable insolid samples on Mars (although Mars 2020 instruments willsearch for organics from other biosignature sources as well).
Terrestrial kerogen is commonly captured and preservedin aqueous lithologies, such as silica (chert), carbonates,sulfates, and mudstones, all of which have been detected onMars. Chert is a dense, highly silicified, fine-grained sedi-mentary rock, whose dense crystalline structure resists che-mical weathering (McIlreath and Morrow, 1990). Its prolongedresidence time in the crust makes it one of the most commonlithotypes in which microbiota are preserved in the Pre-cambrian record on Earth (Farmer and Des Marais, 1999).Chert, its precursor opaline silica, and a low-pressure, high-temperature polymorph, tridymite, have all been detectedrecently at Mars rover landing sites (Skok et al., 2010; Ruffet al., 2011; Morris et al., 2016).
Carbonates such as calcite (CaCO3) and magnesite(MgCO3) are also common host minerals for Earth’s Pre-cambrian fossil record (Farmer and Des Marais, 1999). Car-bonates have been detected on Mars both from orbit (Ehlmannet al., 2008b) and from the surface (Madden et al., 2004;Morris et al., 2010).
Gypsum (CaSO4$H2O), another common lithotype forpreserving kerogenous microfossils, is considered a prom-ising target in the search for past life on Mars (Schopf et al.,2012). Gypsum and other hydrated sulfates have been ob-served both from orbit (Bibring et al., 2006; Glotch andRogers, 2007) and in situ (Squyres et al., 2004, 2012; Glotchet al., 2006) as components of soils and evaporite deposits.
Fine-grained mudstones, particularly those that containhydrated aluminum phyllosilicates (clays), have a high po-tential for capturing and preserving organic matter (Farmer andDes Marais, 1999; Ehlmann et al., 2008a). On Earth, organiccompounds adsorb as molecular monolayers on clay surfaces.Clays, including smectites, have been identified on Mars fromorbit (Ehlmann et al., 2008a; Noe Dobrea et al., 2012) and bythe Mars Science Laboratory rover (Vaniman et al., 2014;Bristow et al., 2015). Furthermore, all of these lithotypes havebeen identified in martian meteorites (Bridges and Grady,2000; Bridges et al., 2001; Steele et al., 2007, 2012a, 2012b).
The above lithotypes have long been considered high-priority targets in the search for a martian fossil record(Farmer and Des Marais, 1999; Schopf et al., 2012) if such arecord exists. Kerogen has not been detected on Mars, but itexemplifies one possible biosignature to search for at thelanding site selected for Mars 2020. For this study, we se-lected seven diverse terrestrial samples (Table 1) that makeup some of the most common lithotypes on Earth to preservekerogen. These samples were analyzed with UV time-gated(UV-TG) Raman and fluorescence spectroscopies.
1.2. Biosignature searches with Raman spectroscopy
Raman spectroscopy was selected for Mars 2020 to iden-tify potential biosignatures and their mineral context in situ tohelp inform decisions in selecting samples for caching. Raman
spectroscopy is a light-scattering, vibrational spectroscopytechnique that is well suited for this task. First, it allows theidentification of both organic and inorganic compounds (in-cluding minerals), even when present together. Second, unlikesimilar in situ techniques, Raman spectroscopy is not de-structive to samples (with low laser energy density). In ad-dition, the technique requires no sample preparation, althoughsurface grinding (e.g., using the Rock Abrasion Tool; Gorevanet al., 2003) optimizes the Raman signal by reducing sampletopography as well as removing surface weathering rinds.
In a Raman spectrum, kerogen is identified by two bands thatrepresent the vibrational modes of macromolecular sp2 carbon,whether or not they are biogenic. With visible laser wavelengthexcitation (lex), these spectral features consist of a D band,or disordered lattice stretching mode of aromatic carbon at*1350 cm-1, and an in-plane C]C stretching mode, the Gband, present between 1560 and *1600 cm-1 (Ferrari andRobertson, 2001; Pasteris and Wopenka, 2003; Marshall et al.,2010).
Additional features of lower intensity may also be presentat *2450, *2695, *2735, *2920–2940, and *3248 cm-1,representing second-order modes of first-order bands that resultfrom overtone or combination scattering, structural ordering,and potential C-H stretching modes associated with kerogenand carbon (Pasteris and Wopenka, 2003; Ferrari and Ro-bertson, 2004; Czaja et al., 2009; Marshall et al., 2010). Dand G bands can be a convolution of multiple additionalbands (Czaja et al., 2009; Marshall et al., 2010).
When interrogated with UV lex, these compounds displayslightly different Raman vibrational modes due to enhancedcross sections of these organic vibrational modes (Section 1.3).With UV lex, the region between 1100 and 1500 cm-1 canconsist of many convolved bands, attributable to C]C‘‘breathing modes’’ in ringed structures such as PAHs, some-times interlinked by polyene chains (Czaja et al., 2009; Abbeyet al., 2017). In the UV, the D band (which can peak between1296 and 1401 cm-1; Abbey et al., 2017) arises only when sp2
carbon sites are in disordered rings and is absent when thosesites are highly graphitic or present in chains of rings (Ferrariand Robertson, 2001).
Raman spectroscopy has long been used to assess thebiogenicity of organic and inorganic materials. For example,extant endolithic biomarkers (Dickensheets et al., 2000;Jorge-Villar and Edwards, 2013 and references therein), pu-tative kerogenous microfossils in *3.5 Ga cherts (Brasieret al., 2002; Schopf et al., 2002; Marshall et al., 2011), andgraphitic carbon in *3.87 Ga samples (Papineau et al., 2011;Bell et al., 2015) have been examined by using Ramanspectroscopy with laser excitation wavelengths between 488and 1064 nm. Raman spectroscopy has also been used, with532 nm laser excitation, to identify D and G bands in abioticmacromolecular carbon (MMC) in many martian meteorites(Steele et al., 2012a, 2012b, 2016).
These analyses emphasize that the use of Raman spec-troscopy for the detection of D or G bands of biogenickerogen can be similar to its use for the detection of thoseof disordered, nonbiogenic MMC, and therefore, Ramandetections of D and G bands alone do not establish bio-genicity (Brasier et al., 2002; Pasteris and Wopenka, 2003;Marshall et al., 2010; Bower et al., 2013).
By extension, on Mars, the detection of D and G bands in aRaman spectrum would be evidence of aromatic carbon, but
432 SHKOLYAR ET AL.
Dow
nloa
ded
by C
arni
gie
Inst
Of
Was
hing
ton
from
ww
w.li
eber
tpub
.com
at 0
4/09
/18.
For
per
sona
l use
onl
y.
it would not distinguish biogenic kerogen from abiotic MMC.Instead, it would indicate a compelling potential biosignatureand favor sample caching. After Earth return, detailed che-mical and biogenicity analyses would be needed.
To make the best caching decisions, it will be essential tounderstand the geological (e.g., microtextural and geochemical)context in which organics are preserved, a primary recom-mendation of the Mars 2020 Science Definition Team (Mustard
et al., 2013). Raman spectroscopy can provide this neededcontext, particularly when combined with microscale imagingand fluorescence spectroscopy, as demonstrated in this study.
1.3. Fluorescence in the Raman spectrum
Raman spectroscopy is challenged by interfering back-ground fluorescence, a type of luminescence often several
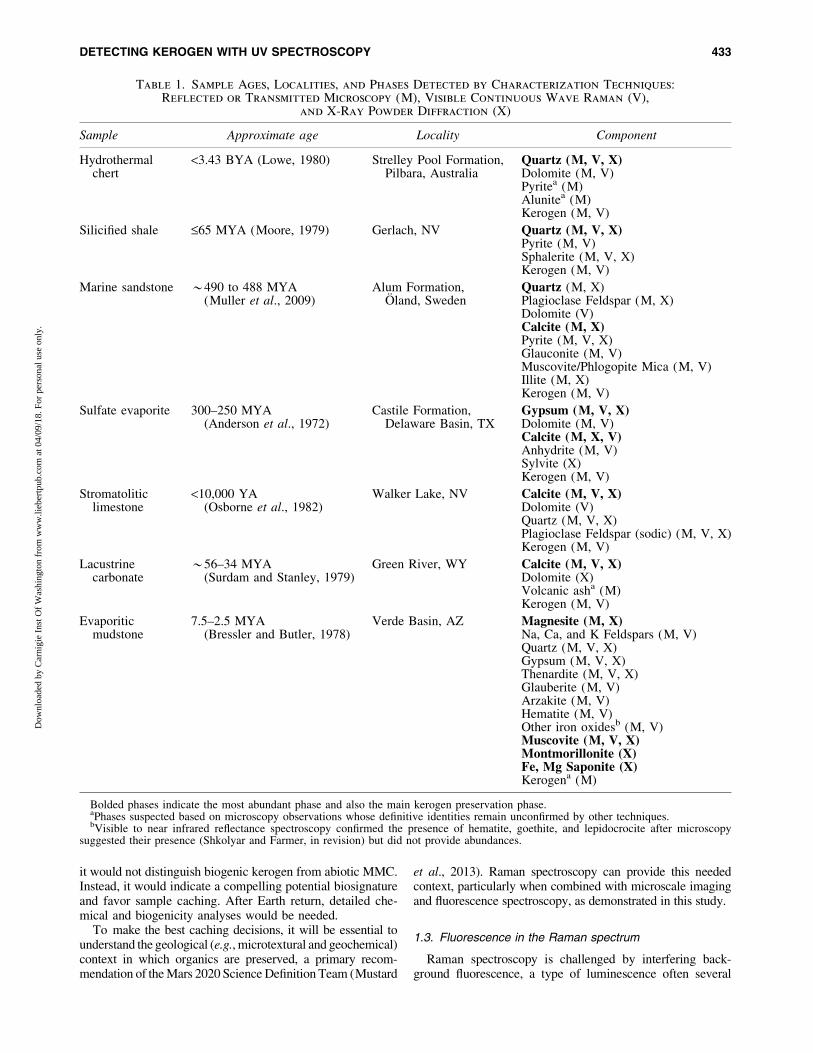
Table 1. Sample Ages, Localities, and Phases Detected by Characterization Techniques:
Reflected or Transmitted Microscopy (M), Visible Continuous Wave Raman (V),
and X-Ray Powder Diffraction (X)
Sample Approximate age Locality Component
Hydrothermalchert
<3.43 BYA (Lowe, 1980) Strelley Pool Formation,Pilbara, Australia
Quartz (M, V, X)Dolomite (M, V)Pyritea (M)Alunitea (M)Kerogen (M, V)
Silicified shale £65 MYA (Moore, 1979) Gerlach, NV Quartz (M, V, X)Pyrite (M, V)Sphalerite (M, V, X)Kerogen (M, V)
Marine sandstone *490 to 488 MYA(Muller et al., 2009)
Alum Formation,Oland, Sweden
Quartz (M, X)Plagioclase Feldspar (M, X)Dolomite (V)Calcite (M, X)Pyrite (M, V, X)Glauconite (M, V)Muscovite/Phlogopite Mica (M, V)Illite (M, X)Kerogen (M, V)
Sulfate evaporite 300–250 MYA(Anderson et al., 1972)
Castile Formation,Delaware Basin, TX
Gypsum (M, V, X)Dolomite (M, V)Calcite (M, X, V)Anhydrite (M, V)Sylvite (X)Kerogen (M, V)
Stromatoliticlimestone
<10,000 YA(Osborne et al., 1982)
Walker Lake, NV Calcite (M, V, X)Dolomite (V)Quartz (M, V, X)Plagioclase Feldspar (sodic) (M, V, X)Kerogen (M, V)
Lacustrinecarbonate
*56–34 MYA(Surdam and Stanley, 1979)
Green River, WY Calcite (M, V, X)Dolomite (X)Volcanic asha (M)Kerogen (M, V)
Evaporiticmudstone
7.5–2.5 MYA(Bressler and Butler, 1978)
Verde Basin, AZ Magnesite (M, X)Na, Ca, and K Feldspars (M, V)Quartz (M, V, X)Gypsum (M, V, X)Thenardite (M, V, X)Glauberite (M, V)Arzakite (M, V)Hematite (M, V)Other iron oxidesb (M, V)Muscovite (M, V, X)Montmorillonite (X)Fe, Mg Saponite (X)Kerogena (M)
Bolded phases indicate the most abundant phase and also the main kerogen preservation phase.aPhases suspected based on microscopy observations whose definitive identities remain unconfirmed by other techniques.bVisible to near infrared reflectance spectroscopy confirmed the presence of hematite, goethite, and lepidocrocite after microscopy
suggested their presence (Shkolyar and Farmer, in revision) but did not provide abundances.
DETECTING KEROGEN WITH UV SPECTROSCOPY 433
Dow
nloa
ded
by C
arni
gie
Inst
Of
Was
hing
ton
from
ww
w.li
eber
tpub
.com
at 0
4/09
/18.
For
per
sona
l use
onl
y.
orders of magnitude stronger than the Raman scattering sig-nal. Fluorescence occurs when an incident photon is absorbedby a molecule or species, exciting it to a higher electronicstate. The molecule then relaxes back to the ground state,emitting a photon. Many minerals and organics exhibit fluo-rescence that can conceal their Raman signatures. Backgroundfluorescence has been shown to hamper the identification ofminerals (Bartholomew, 2012), kerogen and its components(Marshall et al., 2006, 2010; Schopf et al., 2012), and otherbiosignatures targeted for Mars (Dickensheets et al., 2000),both in the laboratory and when using field-deployed Ramansystems (Jehlicka et al., 2010).
Furthermore, the design of Raman systems does not oftenengage the challenges of natural geological materials (e.g.,Bartholomew, 2012, 2014). In prioritizing samples for MarsSample Return (MSR) based on Raman spectra, false neg-ative conclusions about the value of a sample for cachingmay occur if collected background fluorescence hides rele-vant Raman bands that indicate potential biosignatures (e.g.,those described in Section 1.2).
Strategies to mitigate fluorescence signals in Raman spectrainclude (1) tuning the excitation wavelength to the UV, whereit is in resonance with the targeted substance (Asher, 1993;Frosch et al., 2007), (2) using a confocal Raman setup (Brasieret al., 2002; Schopf et al., 2002; Fries and Steele, 2010; Boweret al., 2016), (3) using shifted-excitation Raman differencesystem (Shreve et al., 1992), or (4) using time-gated Ramanspectroscopy. Here, we explore time gating and UV excitation.
Time gating uses pulsed laser excitation and gated detection(i.e., detection of only those photons scattered or emitted intemporal proximity to the laser pulse) to capture the instanta-neous Raman-scattered photons and ‘‘gate out’’ (exclude) thelonger lifetime fluorescence signal in the time domain (Fig. 1;Martyshkin et al., 2004; Gaft and Nagli, 2009). In contrast, withcontinuous wave (CW) Raman spectroscopy, the laser contin-uously irradiates the sample without laser pulsing or gating.
Another fluorescence reduction strategy explored here isthe kex in the UV, which has two advantages. First, a UV kex
causes Raman and fluorescence signals to become energet-ically separated (Tarcea et al., 2007). Second, depending on
the wavelength and targeted compound, a UV kex can in-duce resonance within electronic bands of certain classes oforganics (Hug et al., 2005; Marshall et al., 2010 and ref-erences therein), including complex organics such as kero-gen (Czaja et al., 2009). Resonances can increase scatteringefficiency by orders of magnitude, allowing organic detec-tion limits from ppm (Beegle et al., 2015; Abbey et al.,2017) to ppb levels (Storrie-Lombardi et al., 2001). How-ever, this also means that signals from trace organic con-taminants on the surface, which may have a similar structureto kerogen (i.e., containing PAHs), can also be amplified(Ray et al., 2000; Ferrari and Robertson, 2001).
1.4. Fluorescence spectroscopy
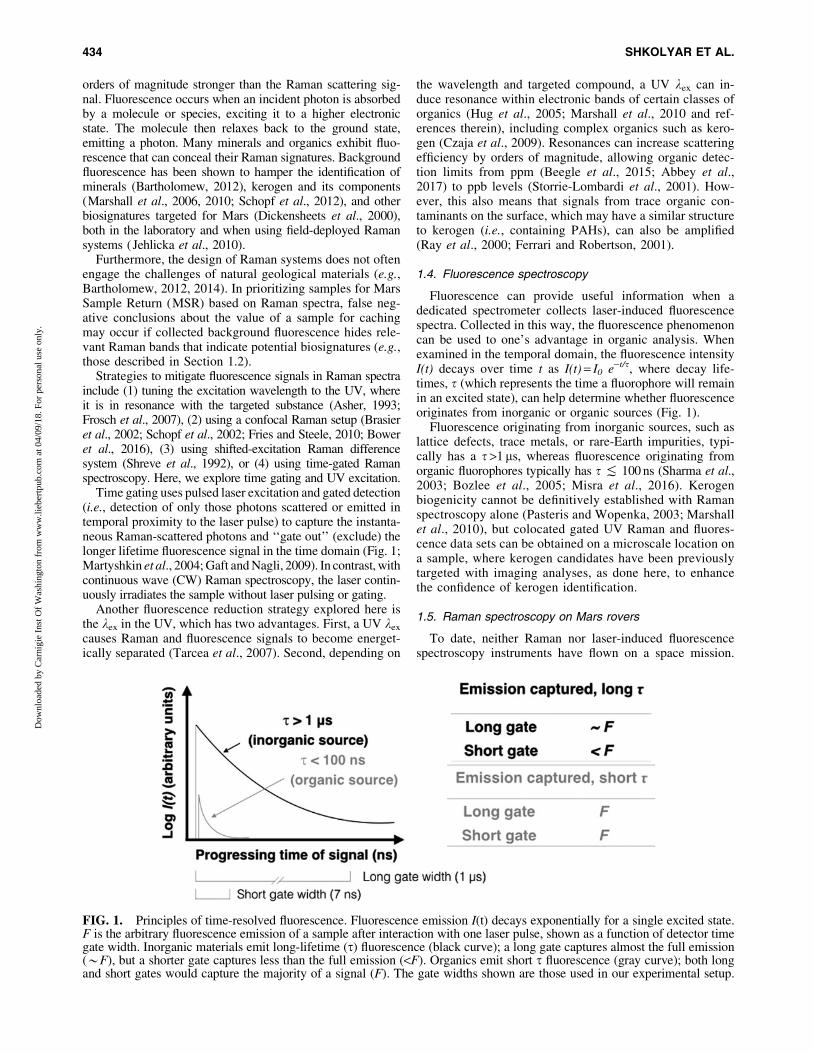
Fluorescence can provide useful information when adedicated spectrometer collects laser-induced fluorescencespectra. Collected in this way, the fluorescence phenomenoncan be used to one’s advantage in organic analysis. Whenexamined in the temporal domain, the fluorescence intensityI(t) decays over time t as I(t) = I0 e-t/s, where decay life-times, s (which represents the time a fluorophore will remainin an excited state), can help determine whether fluorescenceoriginates from inorganic or organic sources (Fig. 1).
Fluorescence originating from inorganic sources, such aslattice defects, trace metals, or rare-Earth impurities, typi-cally has a s >1 ms, whereas fluorescence originating fromorganic fluorophores typically has s ( 100 ns (Sharma et al.,2003; Bozlee et al., 2005; Misra et al., 2016). Kerogenbiogenicity cannot be definitively established with Ramanspectroscopy alone (Pasteris and Wopenka, 2003; Marshallet al., 2010), but colocated gated UV Raman and fluores-cence data sets can be obtained on a microscale location ona sample, where kerogen candidates have been previouslytargeted with imaging analyses, as done here, to enhancethe confidence of kerogen identification.
1.5. Raman spectroscopy on Mars rovers
To date, neither Raman nor laser-induced fluorescencespectroscopy instruments have flown on a space mission.
FIG. 1. Principles of time-resolved fluorescence. Fluorescence emission I(t) decays exponentially for a single excited state.F is the arbitrary fluorescence emission of a sample after interaction with one laser pulse, shown as a function of detector timegate width. Inorganic materials emit long-lifetime (t) fluorescence (black curve); a long gate captures almost the full emission(*F), but a shorter gate captures less than the full emission (<F). Organics emit short t fluorescence (gray curve); both longand short gates would capture the majority of a signal (F). The gate widths shown are those used in our experimental setup.
434 SHKOLYAR ET AL.
Dow
nloa
ded
by C
arni
gie
Inst
Of
Was
hing
ton
from
ww
w.li
eber
tpub
.com
at 0
4/09
/18.
For
per
sona
l use
onl
y.
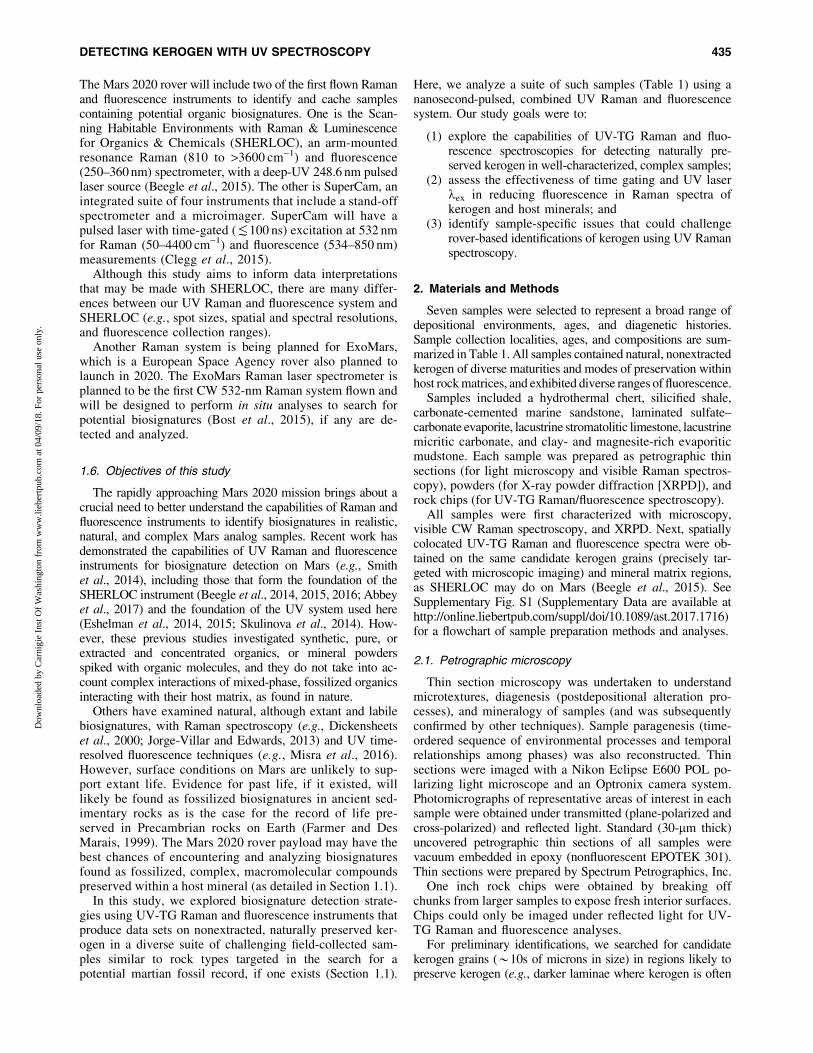
The Mars 2020 rover will include two of the first flown Ramanand fluorescence instruments to identify and cache samplescontaining potential organic biosignatures. One is the Scan-ning Habitable Environments with Raman & Luminescencefor Organics & Chemicals (SHERLOC), an arm-mountedresonance Raman (810 to >3600 cm-1) and fluorescence(250–360 nm) spectrometer, with a deep-UV 248.6 nm pulsedlaser source (Beegle et al., 2015). The other is SuperCam, anintegrated suite of four instruments that include a stand-offspectrometer and a microimager. SuperCam will have apulsed laser with time-gated ((100 ns) excitation at 532 nmfor Raman (50–4400 cm-1) and fluorescence (534–850 nm)measurements (Clegg et al., 2015).
Although this study aims to inform data interpretationsthat may be made with SHERLOC, there are many differ-ences between our UV Raman and fluorescence system andSHERLOC (e.g., spot sizes, spatial and spectral resolutions,and fluorescence collection ranges).
Another Raman system is being planned for ExoMars,which is a European Space Agency rover also planned tolaunch in 2020. The ExoMars Raman laser spectrometer isplanned to be the first CW 532-nm Raman system flown andwill be designed to perform in situ analyses to search forpotential biosignatures (Bost et al., 2015), if any are de-tected and analyzed.
1.6. Objectives of this study
The rapidly approaching Mars 2020 mission brings about acrucial need to better understand the capabilities of Raman andfluorescence instruments to identify biosignatures in realistic,natural, and complex Mars analog samples. Recent work hasdemonstrated the capabilities of UV Raman and fluorescenceinstruments for biosignature detection on Mars (e.g., Smithet al., 2014), including those that form the foundation of theSHERLOC instrument (Beegle et al., 2014, 2015, 2016; Abbeyet al., 2017) and the foundation of the UV system used here(Eshelman et al., 2014, 2015; Skulinova et al., 2014). How-ever, these previous studies investigated synthetic, pure, orextracted and concentrated organics, or mineral powdersspiked with organic molecules, and they do not take into ac-count complex interactions of mixed-phase, fossilized organicsinteracting with their host matrix, as found in nature.
Others have examined natural, although extant and labilebiosignatures, with Raman spectroscopy (e.g., Dickensheetset al., 2000; Jorge-Villar and Edwards, 2013) and UV time-resolved fluorescence techniques (e.g., Misra et al., 2016).However, surface conditions on Mars are unlikely to sup-port extant life. Evidence for past life, if it existed, willlikely be found as fossilized biosignatures in ancient sed-imentary rocks as is the case for the record of life pre-served in Precambrian rocks on Earth (Farmer and DesMarais, 1999). The Mars 2020 rover payload may have thebest chances of encountering and analyzing biosignaturesfound as fossilized, complex, macromolecular compoundspreserved within a host mineral (as detailed in Section 1.1).
In this study, we explored biosignature detection strate-gies using UV-TG Raman and fluorescence instruments thatproduce data sets on nonextracted, naturally preserved ker-ogen in a diverse suite of challenging field-collected sam-ples similar to rock types targeted in the search for apotential martian fossil record, if one exists (Section 1.1).
Here, we analyze a suite of such samples (Table 1) using ananosecond-pulsed, combined UV Raman and fluorescencesystem. Our study goals were to:
(1) explore the capabilities of UV-TG Raman and fluo-rescence spectroscopies for detecting naturally pre-served kerogen in well-characterized, complex samples;
(2) assess the effectiveness of time gating and UV laserlex in reducing fluorescence in Raman spectra ofkerogen and host minerals; and
(3) identify sample-specific issues that could challengerover-based identifications of kerogen using UV Ramanspectroscopy.
2. Materials and Methods
Seven samples were selected to represent a broad range ofdepositional environments, ages, and diagenetic histories.Sample collection localities, ages, and compositions are sum-marized in Table 1. All samples contained natural, nonextractedkerogen of diverse maturities and modes of preservation withinhost rock matrices, and exhibited diverse ranges of fluorescence.
Samples included a hydrothermal chert, silicified shale,carbonate-cemented marine sandstone, laminated sulfate–carbonate evaporite, lacustrine stromatolitic limestone, lacustrinemicritic carbonate, and clay- and magnesite-rich evaporiticmudstone. Each sample was prepared as petrographic thinsections (for light microscopy and visible Raman spectros-copy), powders (for X-ray powder diffraction [XRPD]), androck chips (for UV-TG Raman/fluorescence spectroscopy).
All samples were first characterized with microscopy,visible CW Raman spectroscopy, and XRPD. Next, spatiallycolocated UV-TG Raman and fluorescence spectra were ob-tained on the same candidate kerogen grains (precisely tar-geted with microscopic imaging) and mineral matrix regions,as SHERLOC may do on Mars (Beegle et al., 2015). SeeSupplementary Fig. S1 (Supplementary Data are available athttp://online.liebertpub.com/suppl/doi/10.1089/ast.2017.1716)for a flowchart of sample preparation methods and analyses.
2.1. Petrographic microscopy
Thin section microscopy was undertaken to understandmicrotextures, diagenesis (postdepositional alteration pro-cesses), and mineralogy of samples (and was subsequentlyconfirmed by other techniques). Sample paragenesis (time-ordered sequence of environmental processes and temporalrelationships among phases) was also reconstructed. Thinsections were imaged with a Nikon Eclipse E600 POL po-larizing light microscope and an Optronix camera system.Photomicrographs of representative areas of interest in eachsample were obtained under transmitted (plane-polarized andcross-polarized) and reflected light. Standard (30-mm thick)uncovered petrographic thin sections of all samples werevacuum embedded in epoxy (nonfluorescent EPOTEK 301).Thin sections were prepared by Spectrum Petrographics, Inc.
One inch rock chips were obtained by breaking offchunks from larger samples to expose fresh interior surfaces.Chips could only be imaged under reflected light for UV-TG Raman and fluorescence analyses.
For preliminary identifications, we searched for candidatekerogen grains (*10s of microns in size) in regions likely topreserve kerogen (e.g., darker laminae where kerogen is often
DETECTING KEROGEN WITH UV SPECTROSCOPY 435
Dow
nloa
ded
by C
arni
gie
Inst
Of
Was
hing
ton
from
ww
w.li
eber
tpub
.com
at 0
4/09
/18.
For
per
sona
l use
onl
y.

concentrated; Section 3). Alternating between optical illumi-nation settings (plane- vs. cross-polarized light; transmittedvs. reflected light) was necessary to identify candidatekerogen grains (e.g., kerogen and Fe oxides are opaque inplane-polarized or cross-polarized light, but Fe oxides aredistinguishable based on their reflectivity in reflected light).
Markers were adhered onto thin section and rock chipsurfaces to indicate the precise locations of targeted kerogenas well as mineral regions for further analyses. This markerapproach allowed us to successfully locate the same mi-croscale features for Raman spectroscopy analyses. We thendocumented major and minor mineral components, represen-tative microtextures, and cross-cutting relationships. Ramanand XRPD were used to refine mineral identifications thatwere predicted by using microscopy.
2.2. Visible CW Raman spectroscopy
We used a visible CW Raman spectrometer at ASU’sCenter for Solid State Science to obtain point spectra ofcandidate kerogen grains and minerals in situ. This system isneither optimized for planetary applications nor intended tobe compared with the UV Raman instrument described here.Rather, this system was used to understand the 532 nm laser-induced background fluorescence behavior of kerogen andits host matrix in preparation for UV-TG Raman analyses,with the understanding that Raman and fluorescence signalsoverlap in the visible and become energetically separatedwith UV lex (Tarcea et al., 2007).
This CW Raman system comprises a 532 nm Coherent Sap-phire SF laser source and a Princeton Instruments liquid nitrogencooled charge-coupled device (CCD) detector and Acton 300ispectrograph. The laser was focused onto the sample by using a50X APO Mitutoyo objective. The Raman signal was collectedthrough an Acton 300i spectrograph (1200 lines/mm grating)onto a Princeton Instruments liquid nitrogen cooled CCD. Thesystem had a spectral resolution of *2 cm-1, spatial resolutionof*0.5mm, and an acquisition window from 70 to 2000 cm-1.
Raman point spectra were acquired on previously targetedcandidate kerogen grains and mineral matrices (Section 2.1).A built-in transmitted light microscope was used to locatepreviously targeted regions of interest (shown in Figs. 3–9with the green laser spot on regions interrogated). TheRaman laser spot (<5 mm diameter) was manually focusedon the sample surface. Spectra were acquired over a rangeof integration times, power settings, and depths below thethin section surface to obtain spectra that minimized fluo-rescence and maximized signal to noise (S/N) ratios as wellas spectral band visibility. Acquisitions ranged from one totwenty 10- to 15-s integrations at low energies of 0.75 to6 mW power (or *7.6 · 103 to *6.1 · 104 W/cm2) for eachanalysis (or higher where noted). Sampling depths were *1to 20mm below thin section surfaces.
Raman shift positions were calibrated with a cyclohexanestandard. No spectral postprocessing was applied to Ramanspectra to highlight fluorescence contributions to the totalsignal. Minerals were identified with CrystalSleuth database(Downs, 2006).
For Raman analyses, care was taken to avoid contami-nation. Contamination could arise from thin section epoxy;however, no spectral features from epoxy were seen (Sup-plementary Fig. S2). Contamination arising from marker
adhesive was mitigated by cleaning each thin section (butnot rock chips) with 95% ethanol and distilled water. Inaddition, the micron-scale imaging resolution of the Ramanoptical imaging system allowed us to ensure that the laserspot did not overlap with the adhered markers.
2.3. Visible CW confocal Raman imagingspectroscopy
To elucidate the nature, size, and distribution of organicsin one representative sample, we performed Raman imagingon the stromatolitic limestone sample chip (Fig. 6C–G).
For this analysis, we used a customized WITec a-scanningnear-field optical microscope incorporating confocal Ramanspectroscopic imaging, because it provides exceptional spa-tial (micrometer scale) and spectral resolution (Bower et al.,2016) and reduces the much more intense fluorescence signalthrough the confocal optics used (Fries and Steele, 2010).This instrument is capable of collecting either single spectraor 2D micro-Raman maps. Maps of organic distributions onthe stromatolite surface were generated by using a frequency-doubled solid-state YAG laser (532 nm) operating at 0.01–5 mW output power through a 600 lines/mm grating onto anAndor EMCCD chip. Spectra (with an acquisition range from0 to 3600 cm-1) were taken at each pixel with an integrationtime of 2 s per pixel at 3 mm step sizes. Data processing wasperformed with WITec Control Four 4.1 software.
2.4. X-ray powder diffraction
For XRPD analyses, bulk powdered samples were obtainedfor each sample for confirmation of mineralogy determined bythe mentioned analyses. (Kerogen cannot be identified withXRPD.) Bulk sample fractions were chipped, crushed, groundwith a quartz mortar and pestle, and sieved to <150mm. ASiemens D5000 X-ray Diffractometer with a Ni-filtered Curadiation source was used to identify minerals in bulk samplepowders. Powders were scanned from 5� to 81.759� with a stepsize of 0.016�. Operating conditions were 40 kV at 30 mAusing CuKa (ka1 = 1.5060 A; ka2 = 1.54439 A) with an 8-sdwell time, for an analysis time of 12 h per sample. Back-ground subtraction and mineral identifications were per-formed with the JADE� version 9 (Materials Data, Inc.), withthe International Centre for Diffraction Data database.
2.5. UV-TG Raman and fluorescence spectroscopies
UV radiation absorption by thin section components(glass slides and embedding epoxy) significantly weakensthe Raman signal. Therefore, we used flat rock chips forUV-TG Raman and fluorescence analyses. Sample surfaceswere ground flat with aluminum oxide abrasive paper (400grit; Northon St. Gobain Premium) to reduce surface organiccontamination for all but the hardest samples (chert andsilicified shale). Microscopy confirmed that no abrasivepaper contaminants were present on the ground samplesurfaces. Abraded rock surfaces represent an analogoussample preparation to what will be possible on Mars whenusing a rock abrasion tool (Gorevan et al., 2003).
For each sample, four data sets were obtained on the samemicroscale spot in samples with pretargeted candidate kero-gen grains and mineral matrix regions: (1) Raman spectrum,long gate (to mimic a nongated, CW 266 nm Raman system);
436 SHKOLYAR ET AL.
Dow
nloa
ded
by C
arni
gie
Inst
Of
Was
hing
ton
from
ww
w.li
eber
tpub
.com
at 0
4/09
/18.
For
per
sona
l use
onl
y.
Raman spectrum, short gate (to assess the effectiveness ofgating for fluorescence reduction); (3) fluorescence spectrum,long gate; and (4) fluorescence spectrum, short gate.
Short and long gate widths were 7 ns and 1ms, respectively,determined by using a powdered gypsum tablet standard. Eventhough organic fluorescence can take up to 100 ns to decay(Fig. 1), we chose a short gate of 7 ns to discriminate betweenorganic and mineral fluorescence; in our samples, the majorityof the long-lived fluorescence was rejected and most short-livedfluorescence was emitted in the first 7 ns (Fig. 11B, F). A gatedelay (which coordinates opening the gate with the arrival of thelaser pulse by applying an electronic delay after receiving theexternal trigger signal; Eshelman et al., 2015) of 2 ns was ap-plied to short gate measurements. A total of 12,000 accumu-lations were acquired for all data with an exposure time (whenthe CCD is exposed while pulses are accumulated) of 0.05 s.
For each acquisition, a background spectrum (with the inputfrom the laser to the sample blocked) was acquired, followedby an alanine standard for calibration, and then point spectra ofregions in each sample.
Spectra were obtained with a pulsed, 266 nm laser wave-length excitation Raman combined with a laser-inducedfluorescence system with a gated, intensified CCD detector.The laser spot size was*25 ·*35 mm. A flat field correctionwas performed with an NIST deuterium lamp standard toremove CCD and edge filter irregularities. Raman spectrawere acquired with a 2400 lines/mm grating, allowing aspectral range of 286–3805 cm-1. For fluorescence measure-ments, the Raman spectrometer grating was interchanged with a300 lines/mm grating, allowing an acquisition range of 268–528 nm. The laser was pulsed at 5 kHz with a pulse energy of1.6mJ, resulting in a fluence of *0.2 J/cm2 (2.3 · 105 W/cm2).Other system details were provided by Eshelman et al. (2015).No postprocessing was applied to Raman spectra to highlight thelow fluorescence contributions to the total signal.
To quantify the effect of gating on fluorescence reductionwith UV-TG Raman spectroscopy, we obtained time-resolvedfluorescence spectra and associated fluorescence decay curvesof selected samples. (See Section 3.9 and Fig. 11 for details.)Fluorescence spectra were obtained at increasing gate delaysby accumulating a fluorescence signal and incrementing thegate delay by 0.1 ns steps. This allowed spectra to be obtainedin the intensity I, time t, and wavelength k domains. Spectrawere acquired with a gate width of 3 ns, 40 accumulations perspectrum, and an exposure time of 0.05 s.
All data sets were also acquired on the following mineralstandards (without sterile handling): synthetic silica sand(Barco 49, 99.7% SiO2), natural gypsum (Sigma Aldrich lot#SLBC4109V), natural dolomite (Wards research grade 49-5871 Selasvann, Norway), and natural calcite (Wards researchgrade, 49-5860 Chihuahua, Mexico). For a kerogen standard,1 mg of extracted natural kerogen (94% carbon) was obtained,courtesy of R. Summons and E. Matys (Massachusetts Instituteof Technology).
3. Results
3.1. Archean hydrothermal chert, Strelley PoolFormation, Pilbara, Australia
The Strelley Pool Formation is a stratiform limestone-chert sequence that hosts the oldest known coniform stro-matolites likely deposited in a shallow marine environment
during the Archaean (Lowe, 1980; Hofmann et al., 1999;Van Kranendonk et al., 2003; Allwood et al., 2006). Oursample was collected from a vein of black chert part of ayounger dike system that cross cuts the Strelley Pool For-mation at the Trendall locality.
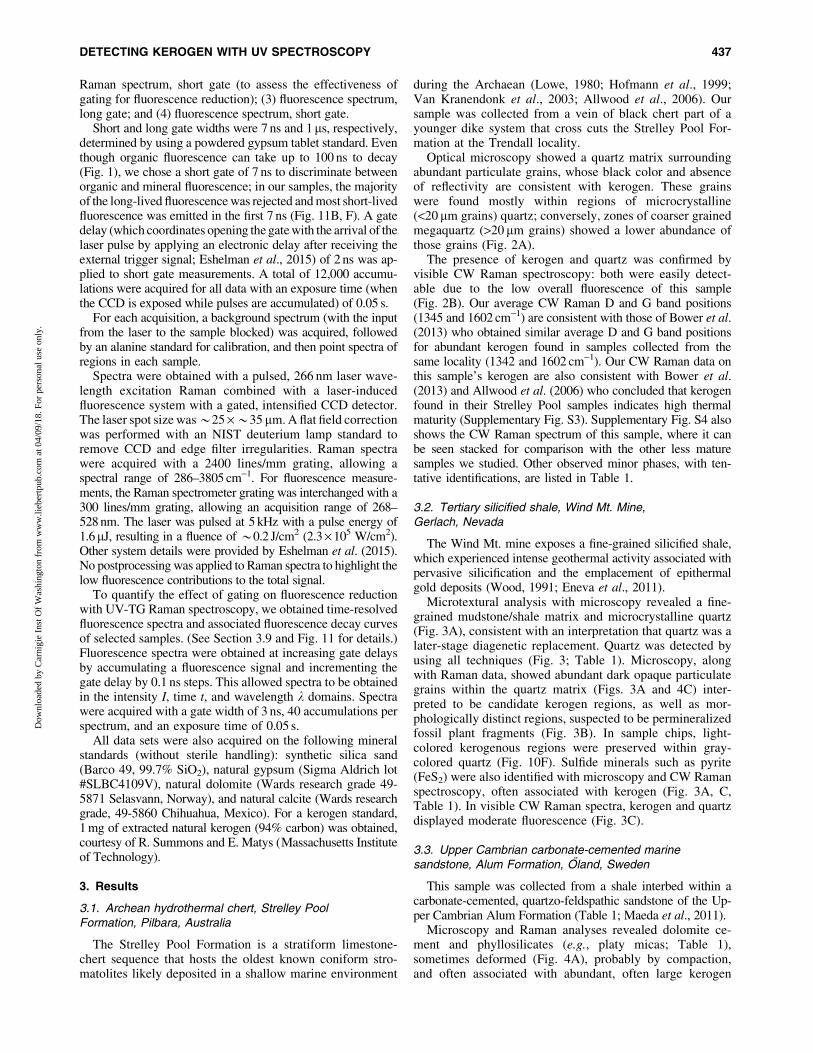
Optical microscopy showed a quartz matrix surroundingabundant particulate grains, whose black color and absenceof reflectivity are consistent with kerogen. These grainswere found mostly within regions of microcrystalline(<20mm grains) quartz; conversely, zones of coarser grainedmegaquartz (>20 mm grains) showed a lower abundance ofthose grains (Fig. 2A).
The presence of kerogen and quartz was confirmed byvisible CW Raman spectroscopy: both were easily detect-able due to the low overall fluorescence of this sample(Fig. 2B). Our average CW Raman D and G band positions(1345 and 1602 cm-1) are consistent with those of Bower et al.(2013) who obtained similar average D and G band positionsfor abundant kerogen found in samples collected from thesame locality (1342 and 1602 cm-1). Our CW Raman data onthis sample’s kerogen are also consistent with Bower et al.(2013) and Allwood et al. (2006) who concluded that kerogenfound in their Strelley Pool samples indicates high thermalmaturity (Supplementary Fig. S3). Supplementary Fig. S4 alsoshows the CW Raman spectrum of this sample, where it canbe seen stacked for comparison with the other less maturesamples we studied. Other observed minor phases, with ten-tative identifications, are listed in Table 1.
3.2. Tertiary silicified shale, Wind Mt. Mine,Gerlach, Nevada
The Wind Mt. mine exposes a fine-grained silicified shale,which experienced intense geothermal activity associated withpervasive silicification and the emplacement of epithermalgold deposits (Wood, 1991; Eneva et al., 2011).
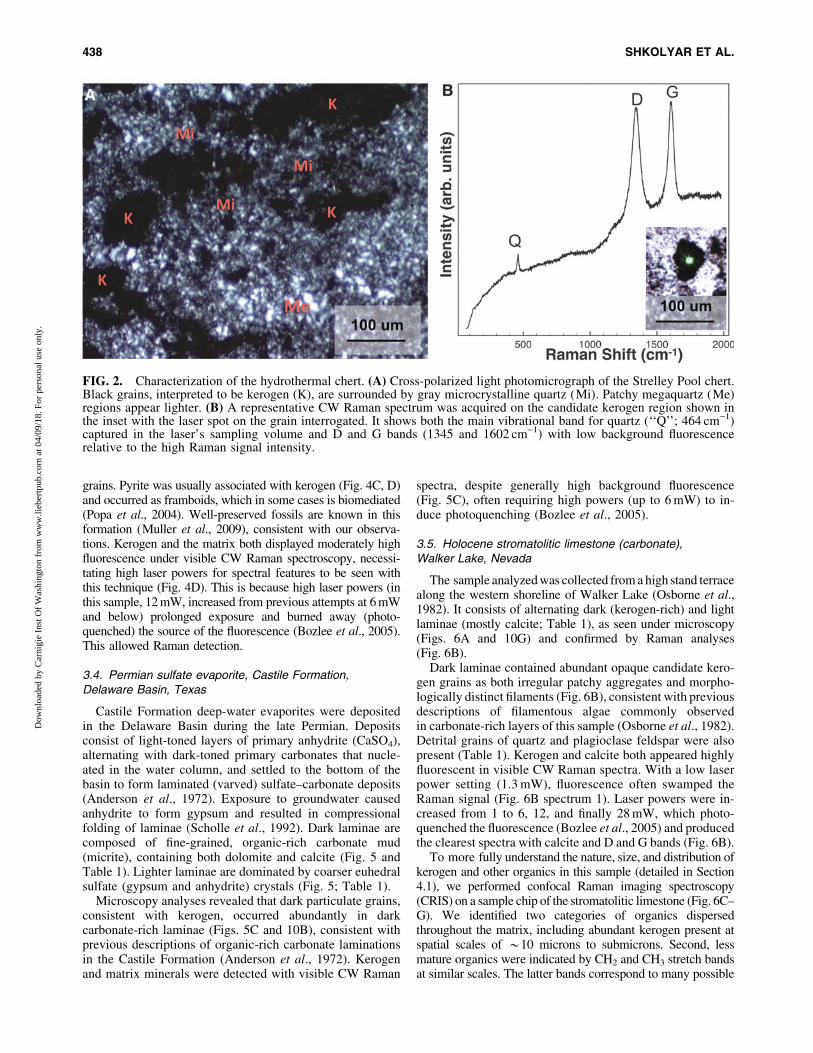
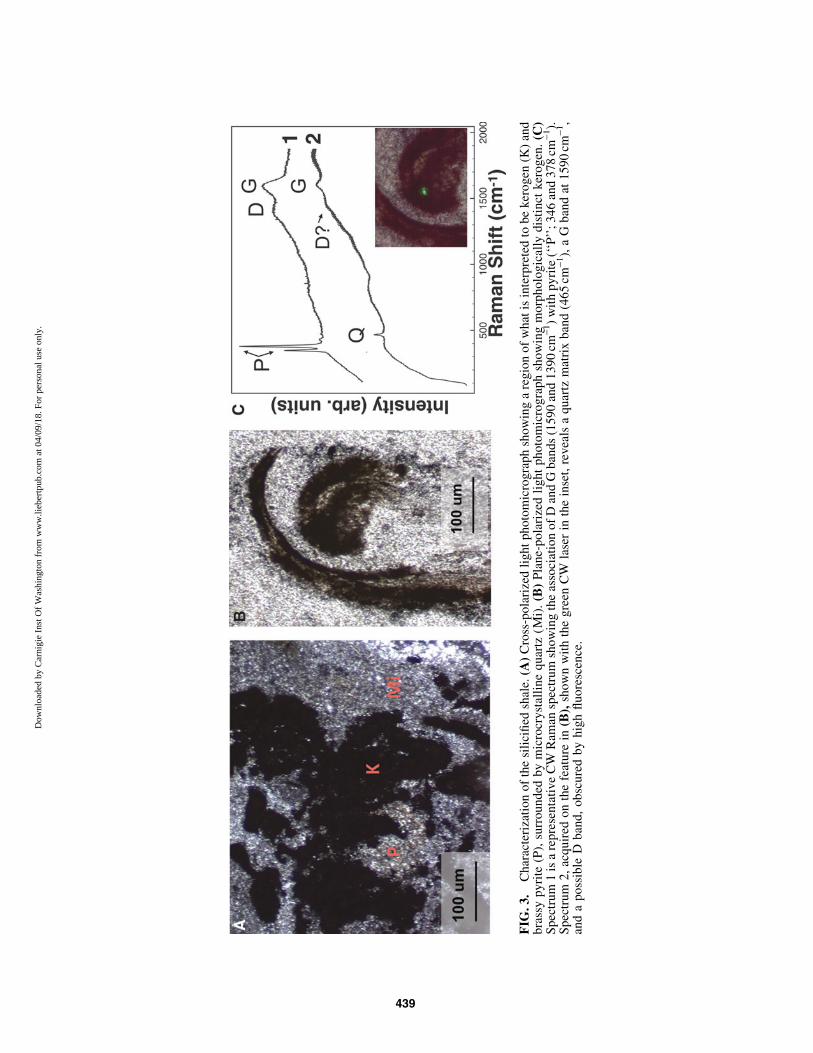
Microtextural analysis with microscopy revealed a fine-grained mudstone/shale matrix and microcrystalline quartz(Fig. 3A), consistent with an interpretation that quartz was alater-stage diagenetic replacement. Quartz was detected byusing all techniques (Fig. 3; Table 1). Microscopy, alongwith Raman data, showed abundant dark opaque particulategrains within the quartz matrix (Figs. 3A and 4C) inter-preted to be candidate kerogen regions, as well as mor-phologically distinct regions, suspected to be permineralizedfossil plant fragments (Fig. 3B). In sample chips, light-colored kerogenous regions were preserved within gray-colored quartz (Fig. 10F). Sulfide minerals such as pyrite(FeS2) were also identified with microscopy and CW Ramanspectroscopy, often associated with kerogen (Fig. 3A, C,Table 1). In visible CW Raman spectra, kerogen and quartzdisplayed moderate fluorescence (Fig. 3C).
3.3. Upper Cambrian carbonate-cemented marinesandstone, Alum Formation, Oland, Sweden
This sample was collected from a shale interbed within acarbonate-cemented, quartzo-feldspathic sandstone of the Up-per Cambrian Alum Formation (Table 1; Maeda et al., 2011).
Microscopy and Raman analyses revealed dolomite ce-ment and phyllosilicates (e.g., platy micas; Table 1),sometimes deformed (Fig. 4A), probably by compaction,and often associated with abundant, often large kerogen
DETECTING KEROGEN WITH UV SPECTROSCOPY 437
Dow
nloa
ded
by C
arni
gie
Inst
Of
Was
hing
ton
from
ww
w.li
eber
tpub
.com
at 0
4/09
/18.
For
per
sona
l use
onl
y.
grains. Pyrite was usually associated with kerogen (Fig. 4C, D)and occurred as framboids, which in some cases is biomediated(Popa et al., 2004). Well-preserved fossils are known in thisformation (Muller et al., 2009), consistent with our observa-tions. Kerogen and the matrix both displayed moderately highfluorescence under visible CW Raman spectroscopy, necessi-tating high laser powers for spectral features to be seen withthis technique (Fig. 4D). This is because high laser powers (inthis sample, 12 mW, increased from previous attempts at 6 mWand below) prolonged exposure and burned away (photo-quenched) the source of the fluorescence (Bozlee et al., 2005).This allowed Raman detection.
3.4. Permian sulfate evaporite, Castile Formation,Delaware Basin, Texas
Castile Formation deep-water evaporites were depositedin the Delaware Basin during the late Permian. Depositsconsist of light-toned layers of primary anhydrite (CaSO4),alternating with dark-toned primary carbonates that nucle-ated in the water column, and settled to the bottom of thebasin to form laminated (varved) sulfate–carbonate deposits(Anderson et al., 1972). Exposure to groundwater causedanhydrite to form gypsum and resulted in compressionalfolding of laminae (Scholle et al., 1992). Dark laminae arecomposed of fine-grained, organic-rich carbonate mud(micrite), containing both dolomite and calcite (Fig. 5 andTable 1). Lighter laminae are dominated by coarser euhedralsulfate (gypsum and anhydrite) crystals (Fig. 5; Table 1).
Microscopy analyses revealed that dark particulate grains,consistent with kerogen, occurred abundantly in darkcarbonate-rich laminae (Figs. 5C and 10B), consistent withprevious descriptions of organic-rich carbonate laminationsin the Castile Formation (Anderson et al., 1972). Kerogenand matrix minerals were detected with visible CW Raman
spectra, despite generally high background fluorescence(Fig. 5C), often requiring high powers (up to 6 mW) to in-duce photoquenching (Bozlee et al., 2005).
3.5. Holocene stromatolitic limestone (carbonate),Walker Lake, Nevada
The sample analyzed was collected from a high stand terracealong the western shoreline of Walker Lake (Osborne et al.,1982). It consists of alternating dark (kerogen-rich) and lightlaminae (mostly calcite; Table 1), as seen under microscopy(Figs. 6A and 10G) and confirmed by Raman analyses(Fig. 6B).
Dark laminae contained abundant opaque candidate kero-gen grains as both irregular patchy aggregates and morpho-logically distinct filaments (Fig. 6B), consistent with previousdescriptions of filamentous algae commonly observedin carbonate-rich layers of this sample (Osborne et al., 1982).Detrital grains of quartz and plagioclase feldspar were alsopresent (Table 1). Kerogen and calcite both appeared highlyfluorescent in visible CW Raman spectra. With a low laserpower setting (1.3 mW), fluorescence often swamped theRaman signal (Fig. 6B spectrum 1). Laser powers were in-creased from 1 to 6, 12, and finally 28 mW, which photo-quenched the fluorescence (Bozlee et al., 2005) and producedthe clearest spectra with calcite and D and G bands (Fig. 6B).
To more fully understand the nature, size, and distribution ofkerogen and other organics in this sample (detailed in Section4.1), we performed confocal Raman imaging spectroscopy(CRIS) on a sample chip of the stromatolitic limestone (Fig. 6C–G). We identified two categories of organics dispersedthroughout the matrix, including abundant kerogen present atspatial scales of *10 microns to submicrons. Second, lessmature organics were indicated by CH2 and CH3 stretch bandsat similar scales. The latter bands correspond to many possible
FIG. 2. Characterization of the hydrothermal chert. (A) Cross-polarized light photomicrograph of the Strelley Pool chert.Black grains, interpreted to be kerogen (K), are surrounded by gray microcrystalline quartz (Mi). Patchy megaquartz (Me)regions appear lighter. (B) A representative CW Raman spectrum was acquired on the candidate kerogen region shown inthe inset with the laser spot on the grain interrogated. It shows both the main vibrational band for quartz (‘‘Q’’; 464 cm-1)captured in the laser’s sampling volume and D and G bands (1345 and 1602 cm-1) with low background fluorescencerelative to the high Raman signal intensity.
438 SHKOLYAR ET AL.
Dow
nloa
ded
by C
arni
gie
Inst
Of
Was
hing
ton
from
ww
w.li
eber
tpub
.com
at 0
4/09
/18.
For
per
sona
l use
onl
y.
FIG
.3.
Char
acte
riza
tion
of
the
sili
cifi
edsh
ale.
(A)
Cro
ss-p
ola
rize
dli
ght
photo
mic
rogra
ph
show
ing
are
gio
nof
what
isin
terp
rete
dto
be
ker
ogen
(K)
and
bra
ssy
pyri
te(P
),su
rrounded
by
mic
rocr
yst
alli
ne
quar
tz(M
i).
(B)
Pla
ne-
pola
rize
dli
ght
photo
mic
rogra
ph
show
ing
morp
holo
gic
ally
dis
tinct
ker
ogen
.(C
)S
pec
trum
1is
are
pre
senta
tive
CW
Ram
ansp
ectr
um
show
ing
the
asso
ciat
ion
of
Dan
dG
ban
ds
(1590
and
1390
cm-1
)w
ith
pyri
te(‘
‘P’’
;346
and
378
cm-1
).S
pec
trum
2,
acquir
edon
the
feat
ure
in(B
),sh
ow
nw
ith
the
gre
enC
Wla
ser
inth
ein
set,
revea
lsa
quar
tzm
atri
xban
d(4
65
cm-1
),a
Gban
dat
1590
cm-1
,an
da
poss
ible
Dban
d,
obsc
ure
dby
hig
hfl
uore
scen
ce.
439
Dow
nloa
ded
by C
arni
gie
Inst
Of
Was
hing
ton
from
ww
w.li
eber
tpub
.com
at 0
4/09
/18.
For
per
sona
l use
onl
y.
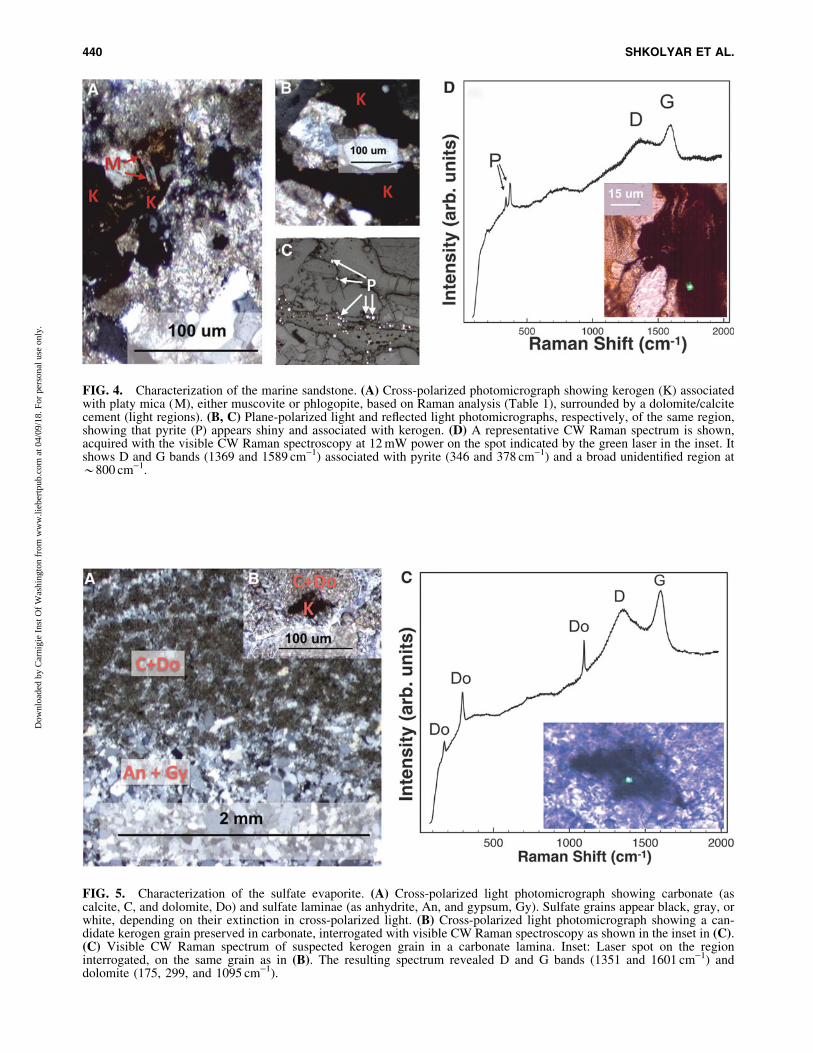
FIG. 4. Characterization of the marine sandstone. (A) Cross-polarized photomicrograph showing kerogen (K) associatedwith platy mica (M), either muscovite or phlogopite, based on Raman analysis (Table 1), surrounded by a dolomite/calcitecement (light regions). (B, C) Plane-polarized light and reflected light photomicrographs, respectively, of the same region,showing that pyrite (P) appears shiny and associated with kerogen. (D) A representative CW Raman spectrum is shown,acquired with the visible CW Raman spectroscopy at 12 mW power on the spot indicated by the green laser in the inset. Itshows D and G bands (1369 and 1589 cm-1) associated with pyrite (346 and 378 cm-1) and a broad unidentified region at*800 cm-1.
FIG. 5. Characterization of the sulfate evaporite. (A) Cross-polarized light photomicrograph showing carbonate (ascalcite, C, and dolomite, Do) and sulfate laminae (as anhydrite, An, and gypsum, Gy). Sulfate grains appear black, gray, orwhite, depending on their extinction in cross-polarized light. (B) Cross-polarized light photomicrograph showing a can-didate kerogen grain preserved in carbonate, interrogated with visible CW Raman spectroscopy as shown in the inset in (C).(C) Visible CW Raman spectrum of suspected kerogen grain in a carbonate lamina. Inset: Laser spot on the regioninterrogated, on the same grain as in (B). The resulting spectrum revealed D and G bands (1351 and 1601 cm-1) anddolomite (175, 299, and 1095 cm-1).
440 SHKOLYAR ET AL.
Dow
nloa
ded
by C
arni
gie
Inst
Of
Was
hing
ton
from
ww
w.li
eber
tpub
.com
at 0
4/09
/18.
For
per
sona
l use
onl
y.
organic functional groups that are less thermally altered andphysically compacted than kerogen, including microfossil cellwall structures (Socrates, 2004; Marshall et al., 2006).
3.6. Eocene lacustrine carbonate, Green RiverFormation, Wyoming
The Green River Formation consists of several membershaving different compositions (e.g., Surdam and Stanley,1979). The sample analyzed here is from a lacustrine limestone
member, formed by precipitation of fine-grained (micritic)carbonate. The carbonate unit precipitated as calcite and do-lomite within the water column and settled to the lake bottom(Desborough, 1978).
We observed both microscopic particulate kerogen (Fig. 7A)and macroscopic well-preserved fossils (not analyzed here).Kerogen is dispersed throughout a carbonate-rich matrix,mainly as calcite and dolomite (Table 1). This description isconsistent with previous descriptions of abundant and diverseorganics (kerogen, coals, more immature algal and mollusk
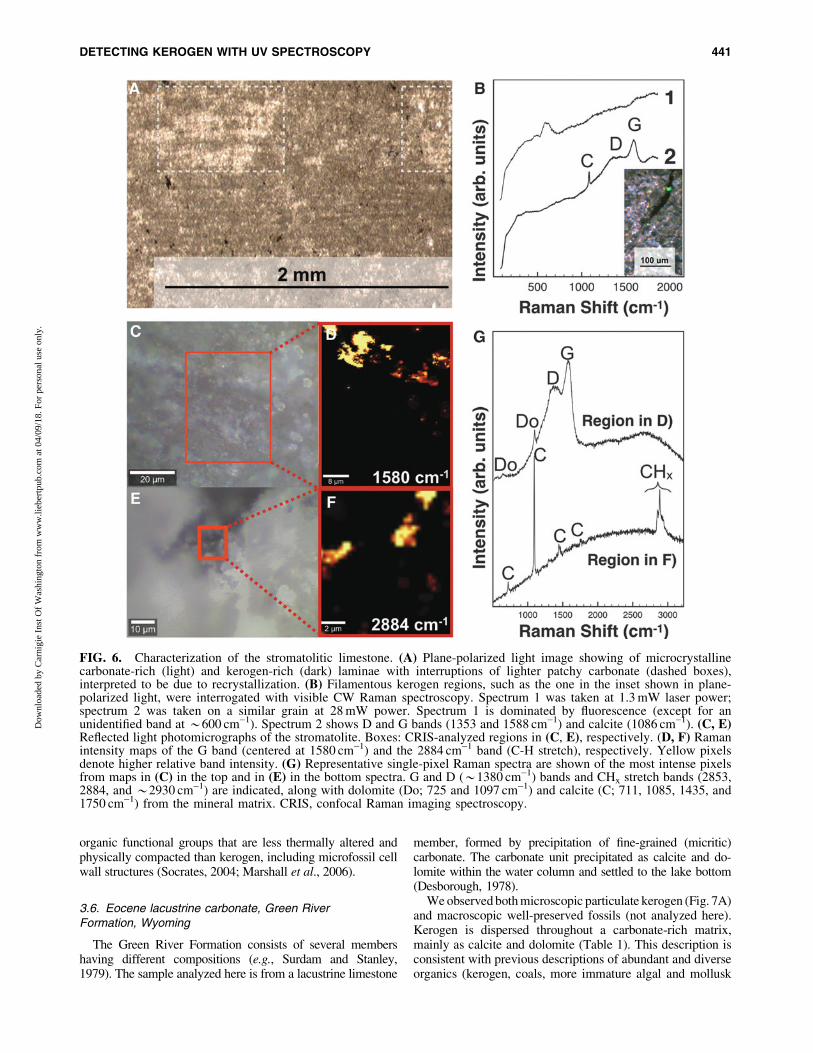
FIG. 6. Characterization of the stromatolitic limestone. (A) Plane-polarized light image showing of microcrystallinecarbonate-rich (light) and kerogen-rich (dark) laminae with interruptions of lighter patchy carbonate (dashed boxes),interpreted to be due to recrystallization. (B) Filamentous kerogen regions, such as the one in the inset shown in plane-polarized light, were interrogated with visible CW Raman spectroscopy. Spectrum 1 was taken at 1.3 mW laser power;spectrum 2 was taken on a similar grain at 28 mW power. Spectrum 1 is dominated by fluorescence (except for anunidentified band at *600 cm-1). Spectrum 2 shows D and G bands (1353 and 1588 cm-1) and calcite (1086 cm-1). (C, E)Reflected light photomicrographs of the stromatolite. Boxes: CRIS-analyzed regions in (C, E), respectively. (D, F) Ramanintensity maps of the G band (centered at 1580 cm-1) and the 2884 cm-1 band (C-H stretch), respectively. Yellow pixelsdenote higher relative band intensity. (G) Representative single-pixel Raman spectra are shown of the most intense pixelsfrom maps in (C) in the top and in (E) in the bottom spectra. G and D (*1380 cm-1) bands and CHx stretch bands (2853,2884, and *2930 cm-1) are indicated, along with dolomite (Do; 725 and 1097 cm-1) and calcite (C; 711, 1085, 1435, and1750 cm-1) from the mineral matrix. CRIS, confocal Raman imaging spectroscopy.
DETECTING KEROGEN WITH UV SPECTROSCOPY 441
Dow
nloa
ded
by C
arni
gie
Inst
Of
Was
hing
ton
from
ww
w.li
eber
tpub
.com
at 0
4/09
/18.
For
per
sona
l use
onl
y.
remains, etc.) found in carbonate-rich members of this for-mation (Surdam and Stanley, 1979). In visible CW Ramanspectra, high fluorescence prevented the detection of the car-bonate matrix (Fig. 7B spectrum 1) but not kerogen preservedwithin it (Fig. 7B spectrum 2).
3.7. Miocene–Pliocene evaporitic mudstone,Verde Basin, AZ
This clay-rich playa evaporite was deposited within theVerde Basin during the Miocene–Pliocene. The evaporiticplaya mudstone sequence was followed by the formation ofa perennial lake during the Pliocene with the deposition ofbasin-wide lacustrine carbonate sediments (Bressler andButler, 1978; Nations et al., 1981). The mudstone is ce-mented primarily by carbonate (as magnesite) and fine-grained clays, especially smectites (Fe- or Mg-rich saponiteand montmorillonite), as confirmed with XRPD (Table 1).
Microscopy revealed other phyllosilicates, present asdetrital grains, along with a variety of other abundant coarseangular grains and evaporite phases present (Fig. 8A, B andTable 1). Thin section microscopy revealed the presence ofclasts with rust-colored alteration rims, suspected to be iron-rich phases, and dark grains in moderate abundance scatteredthroughout the matrix (Fig. 8C), interpreted as kerogen can-didates. Other phases with optical properties consistent withiron oxides were also seen abundantly with microscopy andidentified as hematite with CW Raman analyses (Fig. 8Dspectrum 2) and as goethite and lepidocrocite as identifiedwith other techniques (Table 1). XRPD did not identify anyiron phases (Table 1).
Fossils have been noted in Verde Formation but not in thesequences we sampled (Wadell, 1972). In our analyses, allCW visible Raman spectra of candidate kerogen grains andthe mudstone matrix were overwhelmed by fluorescence,regardless of the acquisition setting (Fig. 8D).
3.8. UV-TG Raman results
UV-TG Raman spectra of kerogen and matrix areas insamples are shown in Fig. 9, along with kerogen and mineralstandards for comparison. In the chert sample, UV-TG Ramanspectroscopy of candidate kerogen regions revealed quartz (at465 cm-1 and less intense bands at 809, 1084, and 1171 cm-1)along with an intense G band (1586 cm-1), plus a convolutionof two second-order bands spanning *2900 to *3300 cm-1
and centered at *3100 cm-1 (Fig. 9A spectrum 1).The lack of the D band in UV Raman spectroscopy is at-
tributed to the sample’s high thermal maturation, which causedhighly graphitic (Ferrari and Robertson, 2001) and thermallymature (Bower et al., 2013) carbon in that sample, which can beseen as the intense G band (see Section 1.2 for details).
The organic bands of the chert’s spectrum are comparablewith those of the kerogen standard (Fig. 9A spectrum 2),including the second-order region at *2900 to *3300 cm-1
(Fig. 9A inset). Similarly, when candidate kerogen regionswere interrogated in the silicified shale, the main quartzmatrix band was identified, along with a G band (rangingfrom 1600 to 1609 cm-1 in spectra of this sample) and abroad D band spanning from *1200 to 1500 cm-1 (Fig. 9Aspectrum 3). Short- and long-gated UV Raman interroga-tions of the same sample’s matrix (Fig. 9B spectra 13–14)both revealed similar spectra: a G band and the main quartzband.
The marine sandstone revealed both G bands (spanningfrom 1586 to 1611 cm-1, respectively) and weaker D bands(centered at *1370 cm-1) in two different candidate kerogenregions. One region (pictured in Fig. 10D) captured dolomite(at 1098 cm-1) in the sampling volume (Fig. 9A spectrum 5),and the other revealed both D and G bands in both long- andshort-gated spectra (Fig. 9B spectra 15–16). Fluorescence (es-pecially >2000 cm-1) was higher in the region containing or-ganics with dolomite captured in the sampling volume (Fig. 9A
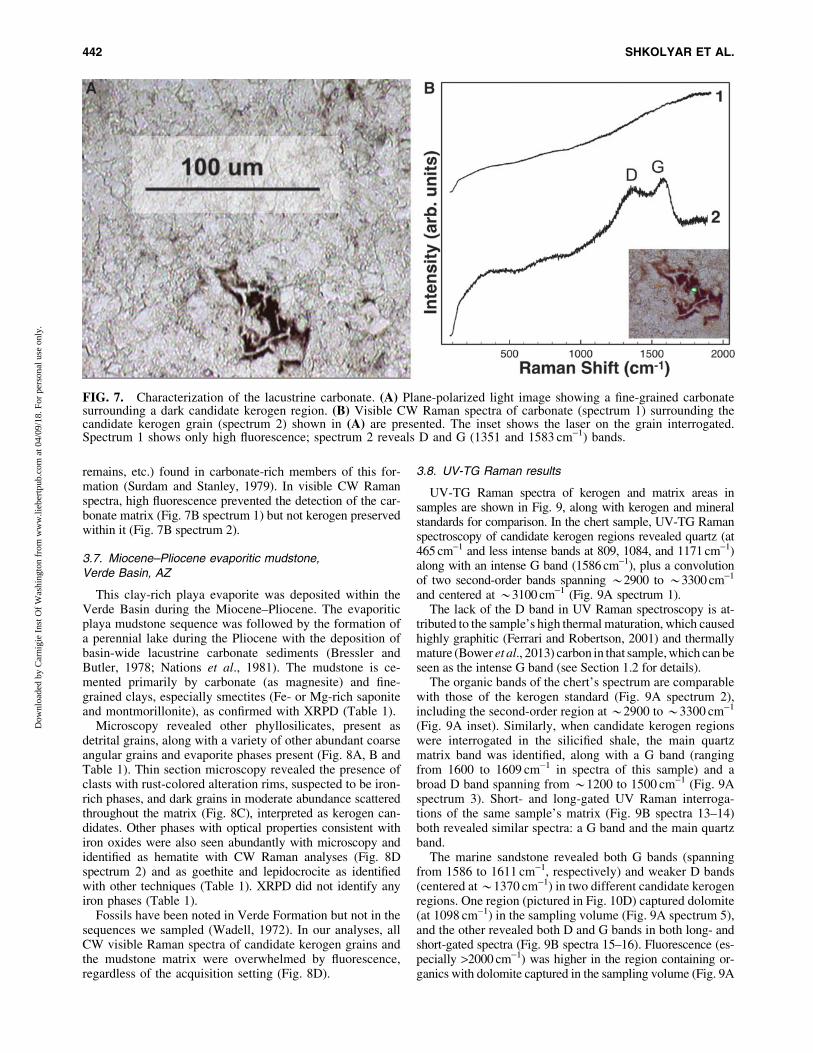
FIG. 7. Characterization of the lacustrine carbonate. (A) Plane-polarized light image showing a fine-grained carbonatesurrounding a dark candidate kerogen region. (B) Visible CW Raman spectra of carbonate (spectrum 1) surrounding thecandidate kerogen grain (spectrum 2) shown in (A) are presented. The inset shows the laser on the grain interrogated.Spectrum 1 shows only high fluorescence; spectrum 2 reveals D and G (1351 and 1583 cm-1) bands.
442 SHKOLYAR ET AL.
Dow
nloa
ded
by C
arni
gie
Inst
Of
Was
hing
ton
from
ww
w.li
eber
tpub
.com
at 0
4/09
/18.
For
per
sona
l use
onl
y.
spectrum 5) than in the region containing kerogen features alone(Fig. 9B spectra 15 and 16).
In the stromatolite sample (Fig. 9A spectrum 7), UV-TGRaman spectroscopy revealed calcite (1086, 1430, and1750 cm-1) and a G band (*1606 cm-1), with moderate fluo-rescence visible past 2000 cm-1 in a candidate kerogen region. Atentative D band seemed to be masked by an overlapping1430 cm-1 calcite band.
In contrast, in the lacustrine carbonate sample (Fig. 9Aspectrum 8), the D band, although likely convolved with asharp calcite band (‘‘C+D’’), was more clearly visible, alongwith second-order features in a targeted candidate kerogengrain. The G band was centered at 1594–1608 cm-1 in UV-TG Raman spectra of the lacustrine carbonate. Comparinglong- and short-gated spectra of the lacustrine carbonatematrix (Fig. 9B spectra 11–12), fluorescence past 2000 cm-1
was slightly reduced with short gating and revealed a weaksharp calcite band at 1430 cm-1 and second-order kerogenbands at 2920 and 3250 cm-1 that were not seen with longgating.
In the sulfate evaporite sample (Fig. 9C), calcite(1086 cm-1) and/or gypsum (412, 493, 612, 672, 1008, and1140 cm-1) could be identified when regions without kerogenwithin both laminae were interrogated (Figs. 10G and 9Cspectra 17–21). With long gating (Fig. 9C spectrum 17), it wasambiguous whether the calcite band was present at 1750 cm-1,but with short gating, calcite was seen clearly (Fig. 9C spec-trum 18). The G band was present in all cases (at 1590 cm-1),and the D and G bands appeared when a candidate kerogengrain (the same one pictured in Fig. 10E) was interrogatedwith UV-TG Raman spectroscopy (Fig. 9C spectrum 21).
The evaporitic mudstone was the only sample in whichUV-TG Raman analyses did not yield any compositionalinformation (Fig. 9A spectrum 10) when both matrix regions(shown in Fig. 10H) and suspected kerogen regions weretargeted for analysis.
3.9. UV-TG fluorescence results
Short- and long-gated fluorescence spectra of kerogen andmatrix areas, as well as kerogen and mineral standards, areshown in Fig. 10A–C. These spectra can be broadly groupedinto two categories: Types 1 and 2.
Type 1 spectra (Fig. 10A, spectra 1–4), as well as the ker-ogen standard (spectrum 5), show a very broad feature (likely aconvolution of multiple features) centered around *430 nm,spanning from *300 to >500 nm. These spectra were acquiredon kerogen grains targeted with microscopy (Fig. 10D–F).
Type 2 fluorescence spectra (Fig. 10B, spectra 6–10) showa convolution of two or more bands between *400 and*500 nm, with peaks at *415 nm and slightly less intenselyat *430 nm. These spectra were acquired in regions wherekerogen was not targeted for analysis and not visible on thesample surface with microscopy. These spectra are distinctlydifferent from Type 1 spectra (Fig. 10A). (Spectrum 1 inFig. 10A is an exception; it was acquired on a matrix regionof a highly kerogenous sample and is addressed in Section4.1.) A spectrum acquired on a sticker marker (Fig. 10B,spectrum 11) displays features similar to Type 2 spectra withthe addition of a feature at *515 nm.
We also acquired fluorescence spectra of mineral stan-dards (Fig. 10C) reflecting the major matrix minerals in our
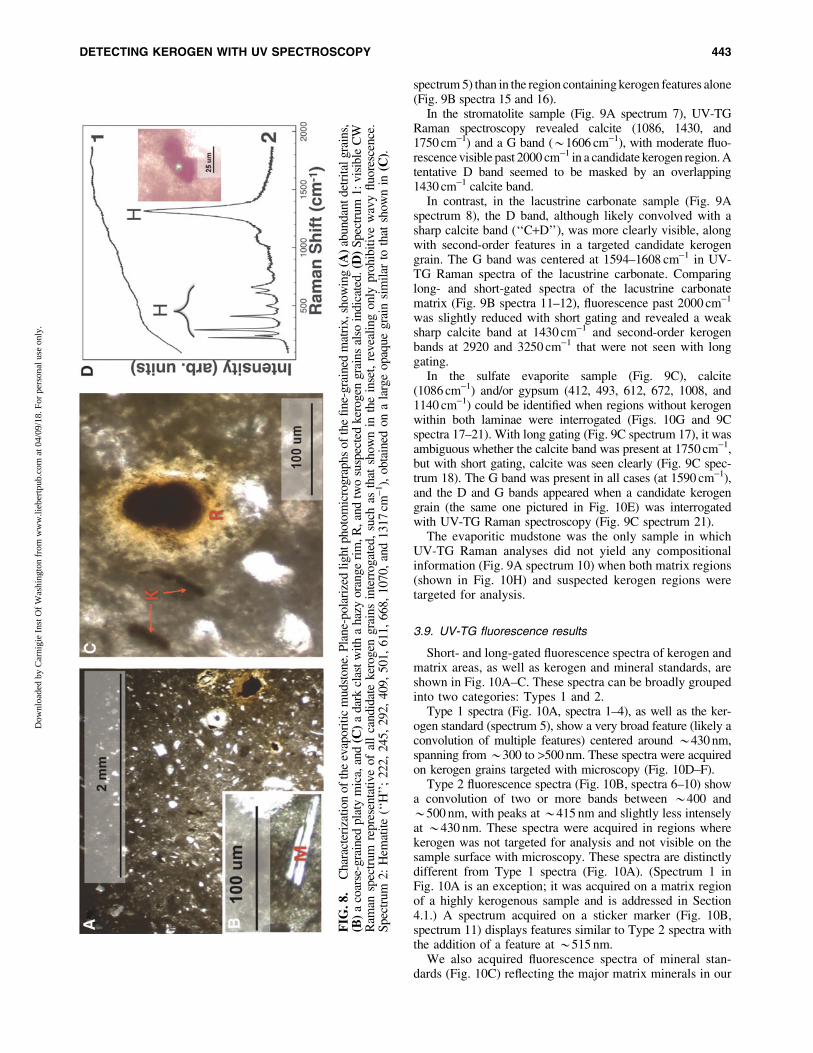
FIG
.8.
Char
acte
riza
tion
of
the
evap
ori
tic
mudst
one.
Pla
ne-
pola
rize
dli
ght
photo
mic
rogra
phs
of
the
fine-
gra
ined
mat
rix,sh
ow
ing
(A)
abundan
tdet
rita
lgra
ins,
(B)
aco
arse
-gra
ined
pla
tym
ica,
and
(C)
adar
kcl
ast
wit
ha
haz
yora
nge
rim
,R
,an
dtw
osu
spec
ted
ker
ogen
gra
ins
also
indic
ated
.(D
)S
pec
trum
1:
vis
ible
CW
Ram
ansp
ectr
um
repre
senta
tive
of
all
candid
ate
ker
ogen
gra
ins
inte
rrogat
ed,
such
asth
atsh
ow
nin
the
inse
t,re
vea
ling
only
pro
hib
itiv
ew
avy
fluore
scen
ce.
Spec
trum
2:
Hem
atit
e(‘
‘H’’
;222,
245,
292,
409,
501,
611,
668,
1070,
and
1317
cm-1
),obta
ined
on
ala
rge
opaq
ue
gra
insi
mil
arto
that
show
nin
(C).
DETECTING KEROGEN WITH UV SPECTROSCOPY 443
Dow
nloa
ded
by C
arni
gie
Inst
Of
Was
hing
ton
from
ww
w.li
eber
tpub
.com
at 0
4/09
/18.
For
per
sona
l use
onl
y.
FIG
.9.
Rep
rese
nta
tive
UV
-TG
Ram
ansp
ectr
aof
sam
ple
san
dst
andar
ds.
(A)
Short
-gat
edR
aman
spec
tra
of
(1)
targ
eted
ker
ogen
gra
inin
cher
t,(2
)ker
ogen
stan
dar
d,
(3)
targ
eted
ker
ogen
gra
inin
sili
cifi
edsh
ale,
(4)
sili
casa
nd
stan
dar
d,(5
)ta
rget
edker
ogen
gra
inin
mar
ine
sandst
one,
(6)
dolo
mit
est
andar
d,(7
)ta
rget
edker
ogen
gra
inin
light
lam
ina
of
stro
mat
oli
tic
lim
esto
ne,
(8)
targ
eted
ker
ogen
gra
inin
lacu
stri
ne
carb
onat
e,(9
)ca
lcit
est
andar
d,
(10)
evap
ori
tic
mudst
one,
repre
senta
tive
of
both
targ
eted
ker
ogen
and
min
eral
mat
rix
regio
ns.
Inse
t:m
agnifi
ed2K
ban
ds
inth
ech
ert
and
ker
ogen
stan
dar
d.
Quar
tzobje
ctiv
ein
terf
eren
ceap
pea
rsas
abro
adban
d<5
00
cm-1
(spec
tra
7an
d10).
(B)
Spec
tral
pai
rsac
quir
edon
the
sam
ere
gio
nin
long
(bla
ck)
and
short
(gra
y)
gat
edm
odes
.S
pec
tra
11–12:
lacu
stri
ne
carb
onat
e,m
atri
xre
gio
n;
spec
tra
13–14:
sili
cifi
edsh
ale,
mat
rix
regio
n;
spec
tra
15–16:
mar
ine
sandst
one,
candid
ate
ker
ogen
gra
in.
(C)
Sulf
ate
evap
ori
tesp
ectr
a,sh
ow
nse
par
atel
yfo
rcl
arit
ydue
todif
fere
nt
inte
nsi
tysc
ales
.L
ong
(bla
ck)
and
short
(gra
y)
gat
edsp
ectr
aac
quir
edon
the
sam
ere
gio
nof
aca
rbonat
ela
min
a(s
pec
tra
17–18)
and
asu
lfat
ela
min
a(s
pec
tra
19–20).
Spec
trum
21
isa
short
-gat
edac
quis
itio
nof
aca
ndid
ate
ker
ogen
gra
in.S
pec
tra
in(C
)sh
ow
gypsu
mban
ds
(‘‘G
y’’
;1009
and
1135
cm-1
)an
dH
2O
stre
tch
modes
(‘‘H
’’;*
3400
and*
3500
cm-1
),co
mm
on
inhydra
ted
sulf
ates
(Wan
get
al.
,2006).
N2
indic
ates
atm
osp
her
icnit
rogen
at2331
cm-1
;O
2in
dic
ates
atm
osp
her
icoxygen
at1556
cm-1
(Hug
etal.
,2005),
appea
ring
inso
me
spec
tra
asco
nvolv
edw
ith
the
Gban
d.
Oth
ersy
mbols
are
asin
pre
vio
us
figure
s.A
llsp
ectr
aar
enorm
aliz
edto
the
stro
nges
tpea
kan
doff
set
for
com
par
ison.
444
Dow
nloa
ded
by C
arni
gie
Inst
Of
Was
hing
ton
from
ww
w.li
eber
tpub
.com
at 0
4/09
/18.
For
per
sona
l use
onl
y.
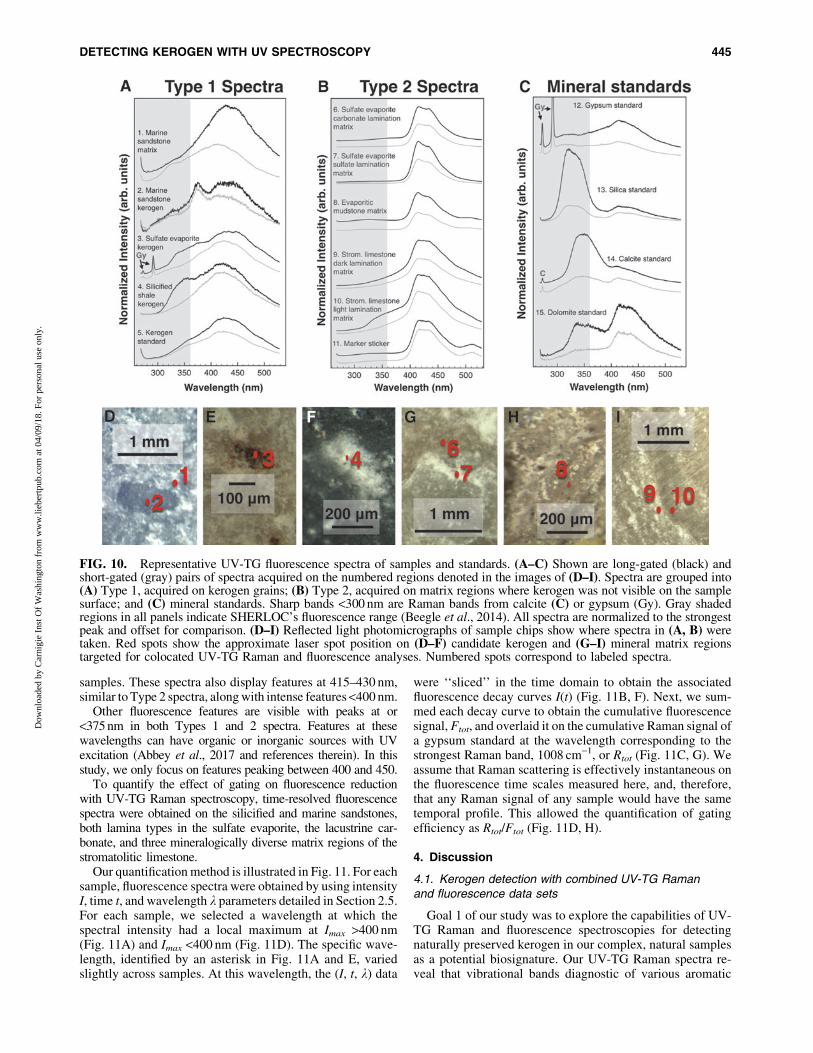
samples. These spectra also display features at 415–430 nm,similar to Type 2 spectra, along with intense features <400 nm.
Other fluorescence features are visible with peaks at or<375 nm in both Types 1 and 2 spectra. Features at thesewavelengths can have organic or inorganic sources with UVexcitation (Abbey et al., 2017 and references therein). In thisstudy, we only focus on features peaking between 400 and 450.
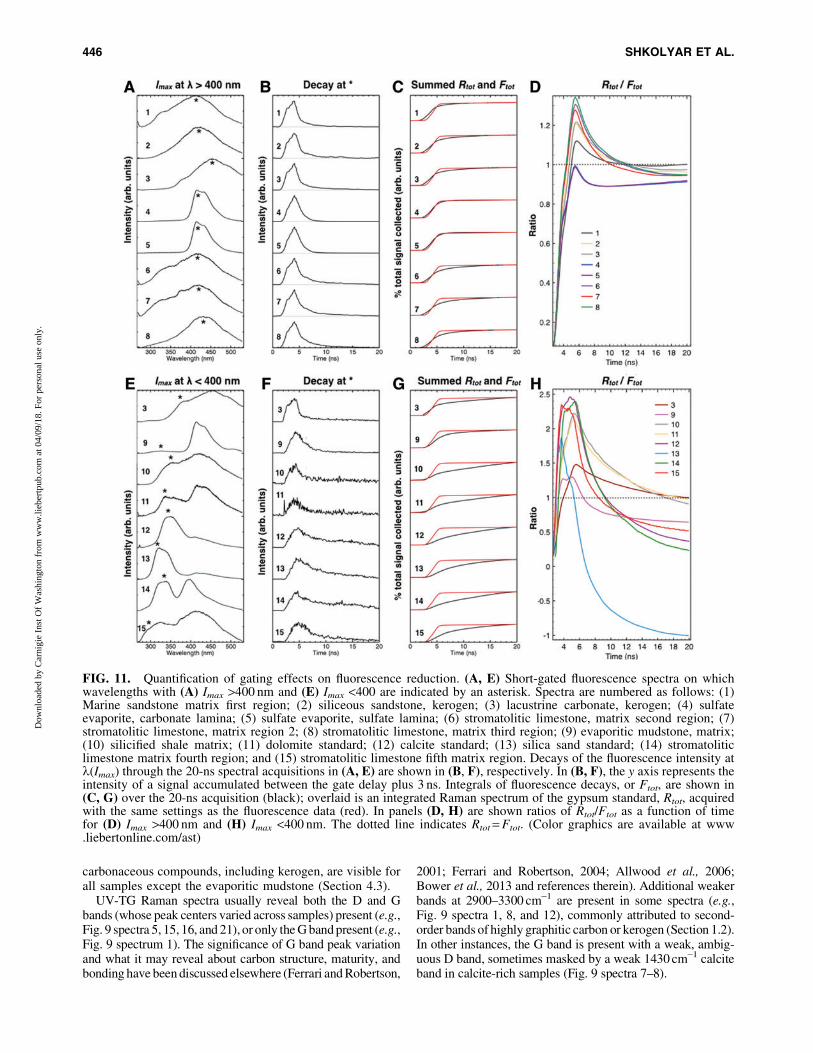
To quantify the effect of gating on fluorescence reductionwith UV-TG Raman spectroscopy, time-resolved fluorescencespectra were obtained on the silicified and marine sandstones,both lamina types in the sulfate evaporite, the lacustrine car-bonate, and three mineralogically diverse matrix regions of thestromatolitic limestone.
Our quantification method is illustrated in Fig. 11. For eachsample, fluorescence spectra were obtained by using intensityI, time t, and wavelength k parameters detailed in Section 2.5.For each sample, we selected a wavelength at which thespectral intensity had a local maximum at Imax >400 nm(Fig. 11A) and Imax <400 nm (Fig. 11D). The specific wave-length, identified by an asterisk in Fig. 11A and E, variedslightly across samples. At this wavelength, the (I, t, k) data
were ‘‘sliced’’ in the time domain to obtain the associatedfluorescence decay curves I(t) (Fig. 11B, F). Next, we sum-med each decay curve to obtain the cumulative fluorescencesignal, Ftot, and overlaid it on the cumulative Raman signal ofa gypsum standard at the wavelength corresponding to thestrongest Raman band, 1008 cm-1, or Rtot (Fig. 11C, G). Weassume that Raman scattering is effectively instantaneous onthe fluorescence time scales measured here, and, therefore,that any Raman signal of any sample would have the sametemporal profile. This allowed the quantification of gatingefficiency as Rtot/Ftot (Fig. 11D, H).
4. Discussion
4.1. Kerogen detection with combined UV-TG Ramanand fluorescence data sets
Goal 1 of our study was to explore the capabilities of UV-TG Raman and fluorescence spectroscopies for detectingnaturally preserved kerogen in our complex, natural samplesas a potential biosignature. Our UV-TG Raman spectra re-veal that vibrational bands diagnostic of various aromatic
FIG. 10. Representative UV-TG fluorescence spectra of samples and standards. (A–C) Shown are long-gated (black) andshort-gated (gray) pairs of spectra acquired on the numbered regions denoted in the images of (D–I). Spectra are grouped into(A) Type 1, acquired on kerogen grains; (B) Type 2, acquired on matrix regions where kerogen was not visible on the samplesurface; and (C) mineral standards. Sharp bands <300 nm are Raman bands from calcite (C) or gypsum (Gy). Gray shadedregions in all panels indicate SHERLOC’s fluorescence range (Beegle et al., 2014). All spectra are normalized to the strongestpeak and offset for comparison. (D–I) Reflected light photomicrographs of sample chips show where spectra in (A, B) weretaken. Red spots show the approximate laser spot position on (D–F) candidate kerogen and (G–I) mineral matrix regionstargeted for colocated UV-TG Raman and fluorescence analyses. Numbered spots correspond to labeled spectra.
DETECTING KEROGEN WITH UV SPECTROSCOPY 445
Dow
nloa
ded
by C
arni
gie
Inst
Of
Was
hing
ton
from
ww
w.li
eber
tpub
.com
at 0
4/09
/18.
For
per
sona
l use
onl
y.
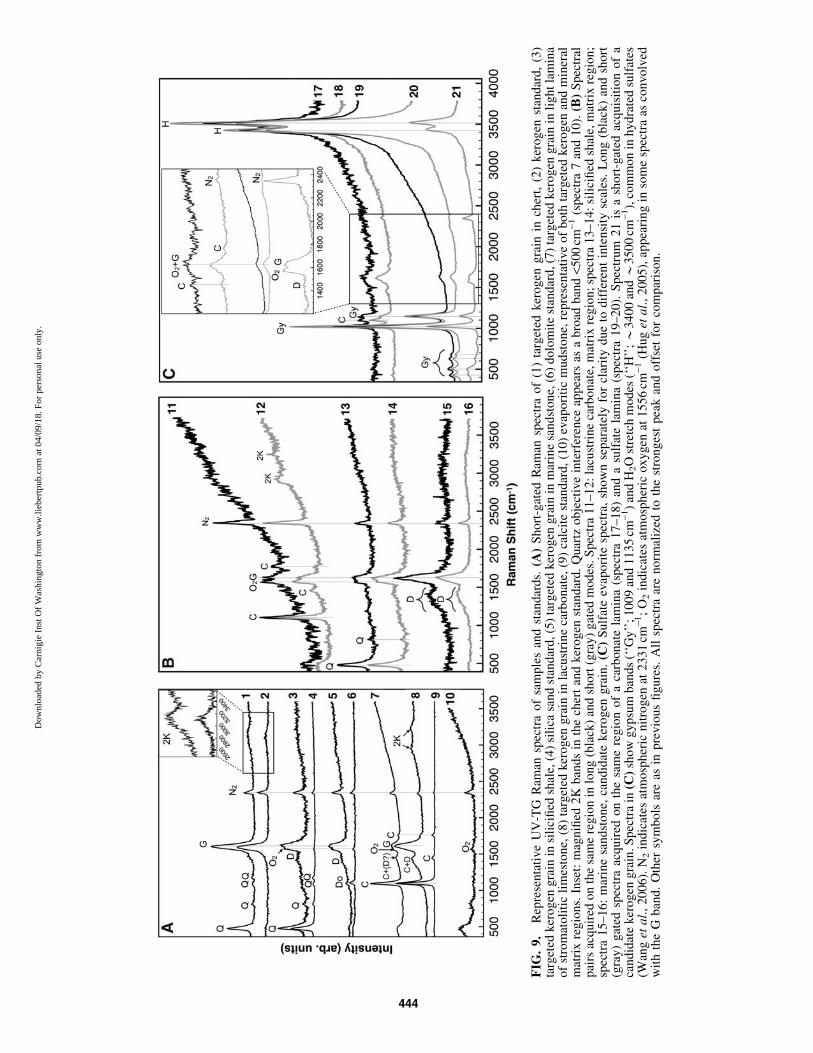
carbonaceous compounds, including kerogen, are visible forall samples except the evaporitic mudstone (Section 4.3).
UV-TG Raman spectra usually reveal both the D and Gbands (whose peak centers varied across samples) present (e.g.,Fig. 9 spectra 5, 15, 16, and 21), or only the G band present (e.g.,Fig. 9 spectrum 1). The significance of G band peak variationand what it may reveal about carbon structure, maturity, andbonding have been discussed elsewhere (Ferrari and Robertson,
2001; Ferrari and Robertson, 2004; Allwood et al., 2006;Bower et al., 2013 and references therein). Additional weakerbands at 2900–3300 cm-1 are present in some spectra (e.g.,Fig. 9 spectra 1, 8, and 12), commonly attributed to second-order bands of highly graphitic carbon or kerogen (Section 1.2).In other instances, the G band is present with a weak, ambig-uous D band, sometimes masked by a weak 1430 cm-1 calciteband in calcite-rich samples (Fig. 9 spectra 7–8).
FIG. 11. Quantification of gating effects on fluorescence reduction. (A, E) Short-gated fluorescence spectra on whichwavelengths with (A) Imax >400 nm and (E) Imax <400 are indicated by an asterisk. Spectra are numbered as follows: (1)Marine sandstone matrix first region; (2) siliceous sandstone, kerogen; (3) lacustrine carbonate, kerogen; (4) sulfateevaporite, carbonate lamina; (5) sulfate evaporite, sulfate lamina; (6) stromatolitic limestone, matrix second region; (7)stromatolitic limestone, matrix region 2; (8) stromatolitic limestone, matrix third region; (9) evaporitic mudstone, matrix;(10) silicified shale matrix; (11) dolomite standard; (12) calcite standard; (13) silica sand standard; (14) stromatoliticlimestone matrix fourth region; and (15) stromatolitic limestone fifth matrix region. Decays of the fluorescence intensity atl(Imax) through the 20-ns spectral acquisitions in (A, E) are shown in (B, F), respectively. In (B, F), the y axis represents theintensity of a signal accumulated between the gate delay plus 3 ns. Integrals of fluorescence decays, or Ftot, are shown in(C, G) over the 20-ns acquisition (black); overlaid is an integrated Raman spectrum of the gypsum standard, Rtot, acquiredwith the same settings as the fluorescence data (red). In panels (D, H) are shown ratios of Rtot/Ftot as a function of timefor (D) Imax >400 nm and (H) Imax <400 nm. The dotted line indicates Rtot = Ftot. (Color graphics are available at www.liebertonline.com/ast)
446 SHKOLYAR ET AL.
Dow
nloa
ded
by C
arni
gie
Inst
Of
Was
hing
ton
from
ww
w.li
eber
tpub
.com
at 0
4/09
/18.
For
per
sona
l use
onl
y.
D and/or G bands (and second-order bands) were alwaysdetected on grains suspected to be kerogen based on priormicroscopy, whereas when mineral standards were interro-gated, these vibrational bands were always absent (e.g.,Fig. 9 spectra 4, 6, 9). But why was a G band usually presentwhen mineral matrices were interrogated? UV-TG Ramanspectra did not enable us to distinguish C = C aromaticcomponents in kerogen, other types of organics (e.g., traceintracrystalline organics in the matrix), even if they are alsopotential biosignatures, or similarly structured abiogeniccontaminants (deposited on the sample surface).
Our confidence in identifying UV-TG Raman bandscaused by kerogen was strengthened only after examiningcolocated UV-TG fluorescence data acquired on candidateregions preselected by microscopy. UV-TG fluorescenceresults reveal two broad types of fluorescence features in allsamples (Fig. 10A, B), although there are additional variationsacross each type. Both types of fluorescence are interpreted tobe organic because they are present in both long- and short-gated spectra, suggesting that their decay lifetimes are shortand consistent with organic sources (Section 1.4).
We interpret Type 1 fluorescence features, combined withD, G, and/or second-order UV-TG Raman bands on colocatedmicroscale regions, as being due to organics contained inkerogen, such as hydrogenated amorphous carbon com-pounds, primarily PAHs, for the following reasons.
First, Type 1 fluorescence spectral features were obtainedon spots in which candidate kerogen regions were previ-ously targeted with microscopy analyses (Fig. 10D–F).
Second, the *300–500 nm feature in Type 1 spectra has acomparable morphology with the kerogen standard(Fig. 10A spectrum 5), likely because kerogen contains acomplex mixture of many PAHs, which commonly havefluorescence features peaking in the *300–500 nm range atlex = 266 nm (Apicella et al., 2004).
Third, these UV-TG Raman spectra are similar to spectracontaining both D and G bands of kerogen-containing fossilferns (Czaja et al., 2009), and to spectra of amorphous andhydrogenated amorphous carbon, which is compositionallysimilar to kerogen (Ferrari and Robertson, 2004), both atUV excitation (kex = 244 nm).
Type 1 spectra correspond to sample spots whose UV-TGRaman spectra contain both D and G bands. The chert is anexception, lacking the D band, but the presence of both a Gband and second-order Raman bands is consistent with highlygraphitic, thermally mature kerogen, common in that sample,and closely matches the Raman spectrum of the kerogenstandard (compare Fig. 9 spectra 1 and 2). Another exceptionis one region in the marine sandstone matrix (Fig. 10A spec-trum 1), where a kerogen spot not visible with microscopy waslikely captured in the laser sampling volume.
Conversely, spots that revealed Type 2 spectra wereusually associated with a weak G band in UV-TG Ramanspectra and lacked a D band or second-order bands (Fig. 9spectra 11–12, 17–20). The D band may have been presentbut undetectable in these cases since the G band was weak.We interpret Type 2 spectra and colocated UV-TG Ramanspectra containing only G bands as caused by organics un-associated with our targeted biosignature (preserved kero-gen) for two reasons. First, Type 2 fluorescence spectra(Fig. 10B) were obtained solely on matrix regions wherekerogen was not visible with microscopy (Fig. 10G–I).
Second, these spectra show a convolution of fluorescencefeatures that significantly differ from those of the kerogenstandard (Fig. 10A spectrum 5).
What is the origin of the organics revealing both Type 2fluorescence and G bands in colocated UV-TG Ramanspectra? We hypothesize that various micron-sized, thermallyimmature organic compounds were present in the mineralmatrix of such samples and were undetectable at the res-olution of our petrographic microscope or UV-TG Ramanand fluorescence imaging systems (and unlikely to be de-tectable by a rover imager on Mars).
One possible source for these organics may be fulvicacids, a class of compounds often associated with carbonatenucleation (Van Beynen et al., 2001; Neuweiler et al., 2003).Fulvic acids can be the dominant organic fluorophore causingcarbonate fluorescence and can produce spectral features thatare similar to Type 2 features (Sierra et al., 1994; Neuweileret al., 2003). It is notable that Type 2 features were visiblemainly in carbonate-rich samples. This interpretation is alsoconsistent with the fact that carbonate mineral standards(naturally derived dolomite and calcite; Fig. 10C) also con-tained weak Type 2 features.
In one carbonate sample displaying Type 2 fluorescencefeatures, we performed CRIS to elucidate the nature, size,and distribution of organics it preserved. Two categories ofmicron to submicron-sized organics dispersed throughoutthe matrix were identified (Fig. 6C–G): (1) kerogen and (2)less mature organics corresponding to many possible or-ganic functional groups, including microfossil cell wallstructures (Socrates, 2004; Marshall et al., 2006). By ex-tension, such organics can also exist in other samples.
Neither category is likely to be a surface contaminant, sincethe sample was abraded (Section 2.5) and since organics wereseen uniformly distributed throughout the sample. Neithertype of micron-scale feature would be resolvable with thepetrographic microscope or the UV-TG system. These or-ganics may be composed of a variety of organic speciestrapped into an intracrystalline organic fraction during min-eral precipitation (e.g., Neuweiler et al., 2003). The ambig-uous origin of Type 2 features further highlights that naturalgeological samples preserve complex biosignatures that arenot as easy to identify as pure organics.
Our interpretations are consistent with previous reportsof organics preserved in our samples. For instance, in AlumFormation marine sandstone, researchers have documentedwell-preserved fossils thought to originate from fossil arthro-pods (Muller et al., 2009), consistent with our observations ofabundant and quite large kerogen grains (Fig. 10D) and kero-genous Type 1 spectra in this sample (Fig. 10A spectra 1–2).Verde Formation evaporites are generally fossil poor (Wadell,1972), consistent with our observation of nonkerogenous Type2 fluorescence in that sample (Fig. 10B spectrum 8). In theCastile Formation sulfate evaporite, the presence of kerogenousand nonkerogenous organics mainly in the carbonate laminae(Figs. 9C and 10B, spectrum 6, and Fig. 10A, spectrum 3) isconsistent with the literature (Anderson et al., 1972), whichsuggests that this is due to phytoplankton production during thecarbonate deposition season. This is also true in the WalkerLake stromatolitic limestone’s carbonate laminae (Osborneet al., 1982) and consistent with our observations of kerogenousand nonkerogenous organics in that sample’s carbonate lami-nae (Type 2 organics, Fig. 10B spectra 9–10; Fig. 6).
DETECTING KEROGEN WITH UV SPECTROSCOPY 447
Dow
nloa
ded
by C
arni
gie
Inst
Of
Was
hing
ton
from
ww
w.li
eber
tpub
.com
at 0
4/09
/18.
For
per
sona
l use
onl
y.
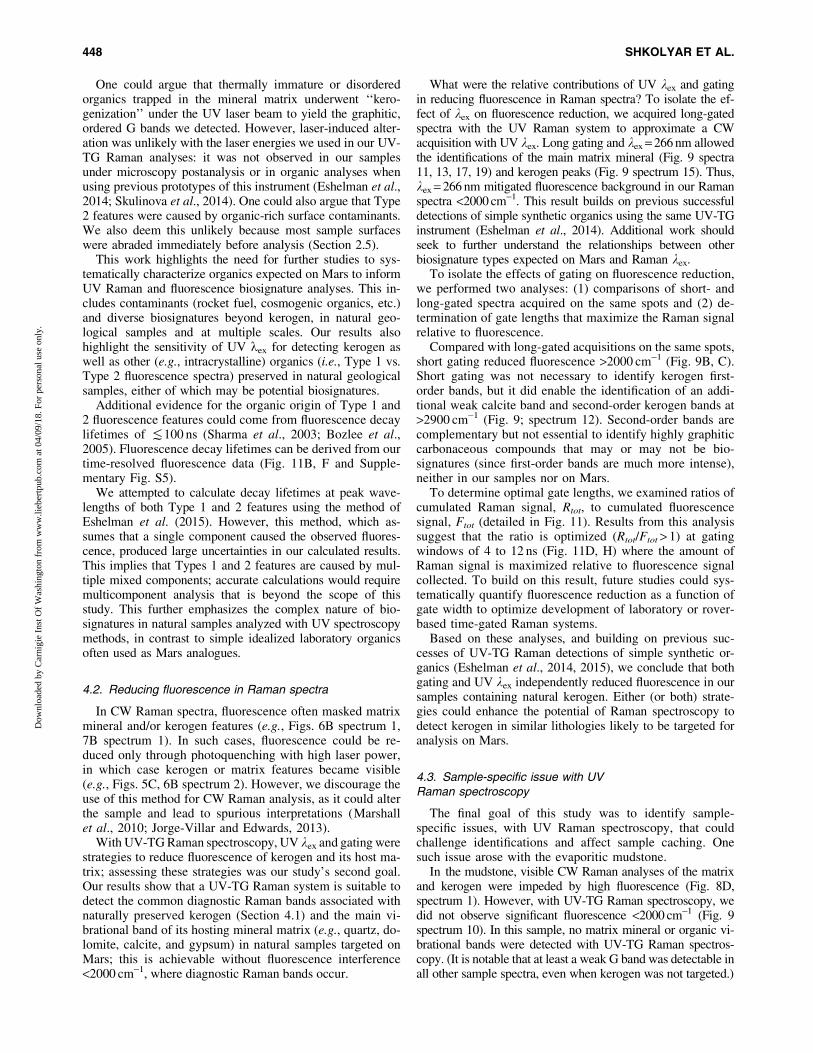
One could argue that thermally immature or disorderedorganics trapped in the mineral matrix underwent ‘‘kero-genization’’ under the UV laser beam to yield the graphitic,ordered G bands we detected. However, laser-induced alter-ation was unlikely with the laser energies we used in our UV-TG Raman analyses: it was not observed in our samplesunder microscopy postanalysis or in organic analyses whenusing previous prototypes of this instrument (Eshelman et al.,2014; Skulinova et al., 2014). One could also argue that Type2 features were caused by organic-rich surface contaminants.We also deem this unlikely because most sample surfaceswere abraded immediately before analysis (Section 2.5).
This work highlights the need for further studies to sys-tematically characterize organics expected on Mars to informUV Raman and fluorescence biosignature analyses. This in-cludes contaminants (rocket fuel, cosmogenic organics, etc.)and diverse biosignatures beyond kerogen, in natural geo-logical samples and at multiple scales. Our results alsohighlight the sensitivity of UV lex for detecting kerogen aswell as other (e.g., intracrystalline) organics (i.e., Type 1 vs.Type 2 fluorescence spectra) preserved in natural geologicalsamples, either of which may be potential biosignatures.
Additional evidence for the organic origin of Type 1 and2 fluorescence features could come from fluorescence decaylifetimes of (100 ns (Sharma et al., 2003; Bozlee et al.,2005). Fluorescence decay lifetimes can be derived from ourtime-resolved fluorescence data (Fig. 11B, F and Supple-mentary Fig. S5).
We attempted to calculate decay lifetimes at peak wave-lengths of both Type 1 and 2 features using the method ofEshelman et al. (2015). However, this method, which as-sumes that a single component caused the observed fluores-cence, produced large uncertainties in our calculated results.This implies that Types 1 and 2 features are caused by mul-tiple mixed components; accurate calculations would requiremulticomponent analysis that is beyond the scope of thisstudy. This further emphasizes the complex nature of bio-signatures in natural samples analyzed with UV spectroscopymethods, in contrast to simple idealized laboratory organicsoften used as Mars analogues.
4.2. Reducing fluorescence in Raman spectra
In CW Raman spectra, fluorescence often masked matrixmineral and/or kerogen features (e.g., Figs. 6B spectrum 1,7B spectrum 1). In such cases, fluorescence could be re-duced only through photoquenching with high laser power,in which case kerogen or matrix features became visible(e.g., Figs. 5C, 6B spectrum 2). However, we discourage theuse of this method for CW Raman analysis, as it could alterthe sample and lead to spurious interpretations (Marshallet al., 2010; Jorge-Villar and Edwards, 2013).
With UV-TG Raman spectroscopy, UV kex and gating werestrategies to reduce fluorescence of kerogen and its host ma-trix; assessing these strategies was our study’s second goal.Our results show that a UV-TG Raman system is suitable todetect the common diagnostic Raman bands associated withnaturally preserved kerogen (Section 4.1) and the main vi-brational band of its hosting mineral matrix (e.g., quartz, do-lomite, calcite, and gypsum) in natural samples targeted onMars; this is achievable without fluorescence interference<2000 cm-1, where diagnostic Raman bands occur.
What were the relative contributions of UV kex and gatingin reducing fluorescence in Raman spectra? To isolate the ef-fect of kex on fluorescence reduction, we acquired long-gatedspectra with the UV Raman system to approximate a CWacquisition with UV kex. Long gating and kex = 266 nm allowedthe identifications of the main matrix mineral (Fig. 9 spectra11, 13, 17, 19) and kerogen peaks (Fig. 9 spectrum 15). Thus,kex = 266 nm mitigated fluorescence background in our Ramanspectra <2000 cm-1. This result builds on previous successfuldetections of simple synthetic organics using the same UV-TGinstrument (Eshelman et al., 2014). Additional work shouldseek to further understand the relationships between otherbiosignature types expected on Mars and Raman kex.
To isolate the effects of gating on fluorescence reduction,we performed two analyses: (1) comparisons of short- andlong-gated spectra acquired on the same spots and (2) de-termination of gate lengths that maximize the Raman signalrelative to fluorescence.
Compared with long-gated acquisitions on the same spots,short gating reduced fluorescence >2000 cm-1 (Fig. 9B, C).Short gating was not necessary to identify kerogen first-order bands, but it did enable the identification of an addi-tional weak calcite band and second-order kerogen bands at>2900 cm-1 (Fig. 9; spectrum 12). Second-order bands arecomplementary but not essential to identify highly graphiticcarbonaceous compounds that may or may not be bio-signatures (since first-order bands are much more intense),neither in our samples nor on Mars.
To determine optimal gate lengths, we examined ratios ofcumulated Raman signal, Rtot, to cumulated fluorescencesignal, Ftot (detailed in Fig. 11). Results from this analysissuggest that the ratio is optimized (Rtot/Ftot > 1) at gatingwindows of 4 to 12 ns (Fig. 11D, H) where the amount ofRaman signal is maximized relative to fluorescence signalcollected. To build on this result, future studies could sys-tematically quantify fluorescence reduction as a function ofgate width to optimize development of laboratory or rover-based time-gated Raman systems.
Based on these analyses, and building on previous suc-cesses of UV-TG Raman detections of simple synthetic or-ganics (Eshelman et al., 2014, 2015), we conclude that bothgating and UV kex independently reduced fluorescence in oursamples containing natural kerogen. Either (or both) strate-gies could enhance the potential of Raman spectroscopy todetect kerogen in similar lithologies likely to be targeted foranalysis on Mars.
4.3. Sample-specific issue with UVRaman spectroscopy
The final goal of this study was to identify sample-specific issues, with UV Raman spectroscopy, that couldchallenge identifications and affect sample caching. Onesuch issue arose with the evaporitic mudstone.
In the mudstone, visible CW Raman analyses of the matrixand kerogen were impeded by high fluorescence (Fig. 8D,spectrum 1). However, with UV-TG Raman spectroscopy, wedid not observe significant fluorescence <2000 cm-1 (Fig. 9spectrum 10). In this sample, no matrix mineral or organic vi-brational bands were detected with UV-TG Raman spectros-copy. (It is notable that at least a weak G band was detectable inall other sample spectra, even when kerogen was not targeted.)
448 SHKOLYAR ET AL.
Dow
nloa
ded
by C
arni
gie
Inst
Of
Was
hing
ton
from
ww
w.li
eber
tpub
.com
at 0
4/09
/18.
For
per
sona
l use
onl
y.
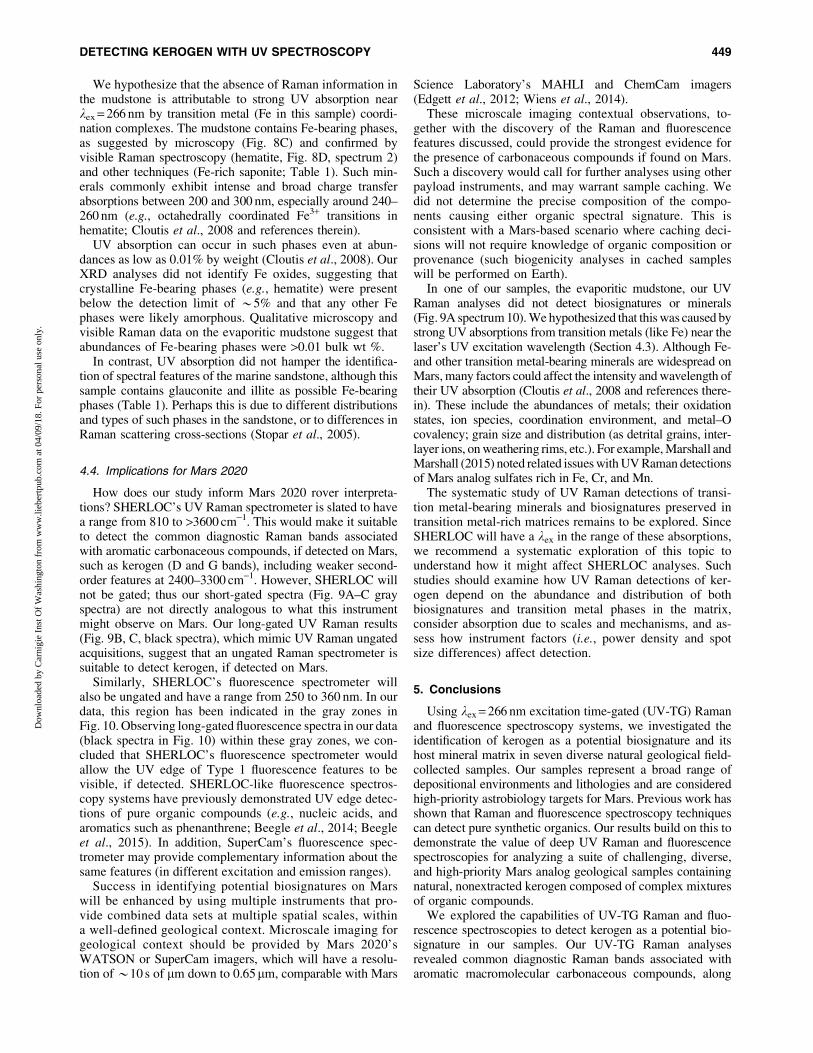
We hypothesize that the absence of Raman information inthe mudstone is attributable to strong UV absorption nearkex = 266 nm by transition metal (Fe in this sample) coordi-nation complexes. The mudstone contains Fe-bearing phases,as suggested by microscopy (Fig. 8C) and confirmed byvisible Raman spectroscopy (hematite, Fig. 8D, spectrum 2)and other techniques (Fe-rich saponite; Table 1). Such min-erals commonly exhibit intense and broad charge transferabsorptions between 200 and 300 nm, especially around 240–260 nm (e.g., octahedrally coordinated Fe3+ transitions inhematite; Cloutis et al., 2008 and references therein).
UV absorption can occur in such phases even at abun-dances as low as 0.01% by weight (Cloutis et al., 2008). OurXRD analyses did not identify Fe oxides, suggesting thatcrystalline Fe-bearing phases (e.g., hematite) were presentbelow the detection limit of *5% and that any other Fephases were likely amorphous. Qualitative microscopy andvisible Raman data on the evaporitic mudstone suggest thatabundances of Fe-bearing phases were >0.01 bulk wt %.
In contrast, UV absorption did not hamper the identifica-tion of spectral features of the marine sandstone, although thissample contains glauconite and illite as possible Fe-bearingphases (Table 1). Perhaps this is due to different distributionsand types of such phases in the sandstone, or to differences inRaman scattering cross-sections (Stopar et al., 2005).
4.4. Implications for Mars 2020
How does our study inform Mars 2020 rover interpreta-tions? SHERLOC’s UV Raman spectrometer is slated to havea range from 810 to >3600 cm-1. This would make it suitableto detect the common diagnostic Raman bands associatedwith aromatic carbonaceous compounds, if detected on Mars,such as kerogen (D and G bands), including weaker second-order features at 2400–3300 cm-1. However, SHERLOC willnot be gated; thus our short-gated spectra (Fig. 9A–C grayspectra) are not directly analogous to what this instrumentmight observe on Mars. Our long-gated UV Raman results(Fig. 9B, C, black spectra), which mimic UV Raman ungatedacquisitions, suggest that an ungated Raman spectrometer issuitable to detect kerogen, if detected on Mars.
Similarly, SHERLOC’s fluorescence spectrometer willalso be ungated and have a range from 250 to 360 nm. In ourdata, this region has been indicated in the gray zones inFig. 10. Observing long-gated fluorescence spectra in our data(black spectra in Fig. 10) within these gray zones, we con-cluded that SHERLOC’s fluorescence spectrometer wouldallow the UV edge of Type 1 fluorescence features to bevisible, if detected. SHERLOC-like fluorescence spectros-copy systems have previously demonstrated UV edge detec-tions of pure organic compounds (e.g., nucleic acids, andaromatics such as phenanthrene; Beegle et al., 2014; Beegleet al., 2015). In addition, SuperCam’s fluorescence spec-trometer may provide complementary information about thesame features (in different excitation and emission ranges).
Success in identifying potential biosignatures on Marswill be enhanced by using multiple instruments that pro-vide combined data sets at multiple spatial scales, withina well-defined geological context. Microscale imaging forgeological context should be provided by Mars 2020’sWATSON or SuperCam imagers, which will have a resolu-tion of *10 s of mm down to 0.65mm, comparable with Mars
Science Laboratory’s MAHLI and ChemCam imagers(Edgett et al., 2012; Wiens et al., 2014).
These microscale imaging contextual observations, to-gether with the discovery of the Raman and fluorescencefeatures discussed, could provide the strongest evidence forthe presence of carbonaceous compounds if found on Mars.Such a discovery would call for further analyses using otherpayload instruments, and may warrant sample caching. Wedid not determine the precise composition of the compo-nents causing either organic spectral signature. This isconsistent with a Mars-based scenario where caching deci-sions will not require knowledge of organic composition orprovenance (such biogenicity analyses in cached sampleswill be performed on Earth).
In one of our samples, the evaporitic mudstone, our UVRaman analyses did not detect biosignatures or minerals(Fig. 9A spectrum 10). We hypothesized that this was caused bystrong UV absorptions from transition metals (like Fe) near thelaser’s UV excitation wavelength (Section 4.3). Although Fe-and other transition metal-bearing minerals are widespread onMars, many factors could affect the intensity and wavelength oftheir UV absorption (Cloutis et al., 2008 and references there-in). These include the abundances of metals; their oxidationstates, ion species, coordination environment, and metal–Ocovalency; grain size and distribution (as detrital grains, inter-layer ions, on weathering rims, etc.). For example, Marshall andMarshall (2015) noted related issues with UV Raman detectionsof Mars analog sulfates rich in Fe, Cr, and Mn.
The systematic study of UV Raman detections of transi-tion metal-bearing minerals and biosignatures preserved intransition metal-rich matrices remains to be explored. SinceSHERLOC will have a kex in the range of these absorptions,we recommend a systematic exploration of this topic tounderstand how it might affect SHERLOC analyses. Suchstudies should examine how UV Raman detections of ker-ogen depend on the abundance and distribution of bothbiosignatures and transition metal phases in the matrix,consider absorption due to scales and mechanisms, and as-sess how instrument factors (i.e., power density and spotsize differences) affect detection.
5. Conclusions
Using kex = 266 nm excitation time-gated (UV-TG) Ramanand fluorescence spectroscopy systems, we investigated theidentification of kerogen as a potential biosignature and itshost mineral matrix in seven diverse natural geological field-collected samples. Our samples represent a broad range ofdepositional environments and lithologies and are consideredhigh-priority astrobiology targets for Mars. Previous work hasshown that Raman and fluorescence spectroscopy techniquescan detect pure synthetic organics. Our results build on this todemonstrate the value of deep UV Raman and fluorescencespectroscopies for analyzing a suite of challenging, diverse,and high-priority Mars analog geological samples containingnatural, nonextracted kerogen composed of complex mixturesof organic compounds.
We explored the capabilities of UV-TG Raman and fluo-rescence spectroscopies to detect kerogen as a potential bio-signature in our samples. Our UV-TG Raman analysesrevealed common diagnostic Raman bands associated witharomatic macromolecular carbonaceous compounds, along
DETECTING KEROGEN WITH UV SPECTROSCOPY 449
Dow
nloa
ded
by C
arni
gie
Inst
Of
Was
hing
ton
from
ww
w.li
eber
tpub
.com
at 0
4/09
/18.
For
per
sona
l use
onl
y.
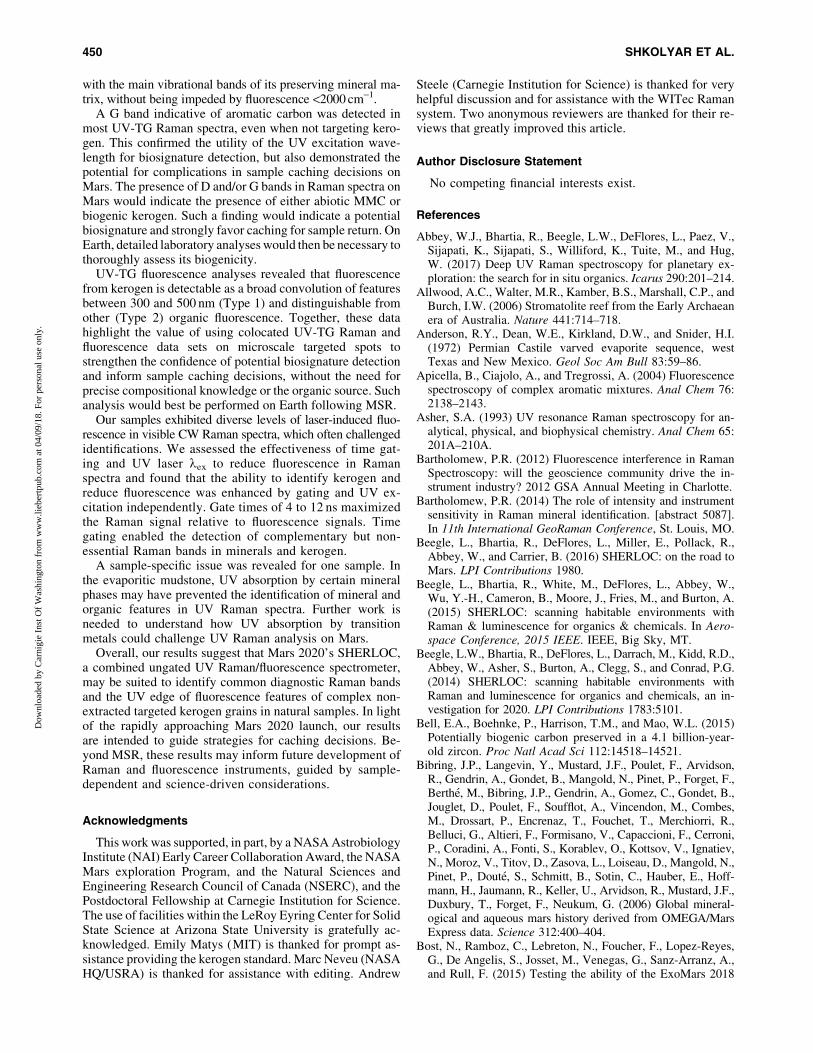
with the main vibrational bands of its preserving mineral ma-trix, without being impeded by fluorescence <2000 cm-1.
A G band indicative of aromatic carbon was detected inmost UV-TG Raman spectra, even when not targeting kero-gen. This confirmed the utility of the UV excitation wave-length for biosignature detection, but also demonstrated thepotential for complications in sample caching decisions onMars. The presence of D and/or G bands in Raman spectra onMars would indicate the presence of either abiotic MMC orbiogenic kerogen. Such a finding would indicate a potentialbiosignature and strongly favor caching for sample return. OnEarth, detailed laboratory analyses would then be necessary tothoroughly assess its biogenicity.
UV-TG fluorescence analyses revealed that fluorescencefrom kerogen is detectable as a broad convolution of featuresbetween 300 and 500 nm (Type 1) and distinguishable fromother (Type 2) organic fluorescence. Together, these datahighlight the value of using colocated UV-TG Raman andfluorescence data sets on microscale targeted spots tostrengthen the confidence of potential biosignature detectionand inform sample caching decisions, without the need forprecise compositional knowledge or the organic source. Suchanalysis would best be performed on Earth following MSR.
Our samples exhibited diverse levels of laser-induced fluo-rescence in visible CW Raman spectra, which often challengedidentifications. We assessed the effectiveness of time gat-ing and UV laser lex to reduce fluorescence in Ramanspectra and found that the ability to identify kerogen andreduce fluorescence was enhanced by gating and UV ex-citation independently. Gate times of 4 to 12 ns maximizedthe Raman signal relative to fluorescence signals. Timegating enabled the detection of complementary but non-essential Raman bands in minerals and kerogen.
A sample-specific issue was revealed for one sample. Inthe evaporitic mudstone, UV absorption by certain mineralphases may have prevented the identification of mineral andorganic features in UV Raman spectra. Further work isneeded to understand how UV absorption by transitionmetals could challenge UV Raman analysis on Mars.
Overall, our results suggest that Mars 2020’s SHERLOC,a combined ungated UV Raman/fluorescence spectrometer,may be suited to identify common diagnostic Raman bandsand the UV edge of fluorescence features of complex non-extracted targeted kerogen grains in natural samples. In lightof the rapidly approaching Mars 2020 launch, our resultsare intended to guide strategies for caching decisions. Be-yond MSR, these results may inform future development ofRaman and fluorescence instruments, guided by sample-dependent and science-driven considerations.
Acknowledgments
This work was supported, in part, by a NASA AstrobiologyInstitute (NAI) Early Career Collaboration Award, the NASAMars exploration Program, and the Natural Sciences andEngineering Research Council of Canada (NSERC), and thePostdoctoral Fellowship at Carnegie Institution for Science.The use of facilities within the LeRoy Eyring Center for SolidState Science at Arizona State University is gratefully ac-knowledged. Emily Matys (MIT) is thanked for prompt as-sistance providing the kerogen standard. Marc Neveu (NASAHQ/USRA) is thanked for assistance with editing. Andrew
Steele (Carnegie Institution for Science) is thanked for veryhelpful discussion and for assistance with the WITec Ramansystem. Two anonymous reviewers are thanked for their re-views that greatly improved this article.
Author Disclosure Statement
No competing financial interests exist.
References
Abbey, W.J., Bhartia, R., Beegle, L.W., DeFlores, L., Paez, V.,Sijapati, K., Sijapati, S., Williford, K., Tuite, M., and Hug,W. (2017) Deep UV Raman spectroscopy for planetary ex-ploration: the search for in situ organics. Icarus 290:201–214.
Allwood, A.C., Walter, M.R., Kamber, B.S., Marshall, C.P., andBurch, I.W. (2006) Stromatolite reef from the Early Archaeanera of Australia. Nature 441:714–718.
Anderson, R.Y., Dean, W.E., Kirkland, D.W., and Snider, H.I.(1972) Permian Castile varved evaporite sequence, westTexas and New Mexico. Geol Soc Am Bull 83:59–86.
Apicella, B., Ciajolo, A., and Tregrossi, A. (2004) Fluorescencespectroscopy of complex aromatic mixtures. Anal Chem 76:2138–2143.
Asher, S.A. (1993) UV resonance Raman spectroscopy for an-alytical, physical, and biophysical chemistry. Anal Chem 65:201A–210A.
Bartholomew, P.R. (2012) Fluorescence interference in RamanSpectroscopy: will the geoscience community drive the in-strument industry? 2012 GSA Annual Meeting in Charlotte.
Bartholomew, P.R. (2014) The role of intensity and instrumentsensitivity in Raman mineral identification. [abstract 5087].In 11th International GeoRaman Conference, St. Louis, MO.
Beegle, L., Bhartia, R., DeFlores, L., Miller, E., Pollack, R.,Abbey, W., and Carrier, B. (2016) SHERLOC: on the road toMars. LPI Contributions 1980.
Beegle, L., Bhartia, R., White, M., DeFlores, L., Abbey, W.,Wu, Y.-H., Cameron, B., Moore, J., Fries, M., and Burton, A.(2015) SHERLOC: scanning habitable environments withRaman & luminescence for organics & chemicals. In Aero-space Conference, 2015 IEEE. IEEE, Big Sky, MT.
Beegle, L.W., Bhartia, R., DeFlores, L., Darrach, M., Kidd, R.D.,Abbey, W., Asher, S., Burton, A., Clegg, S., and Conrad, P.G.(2014) SHERLOC: scanning habitable environments withRaman and luminescence for organics and chemicals, an in-vestigation for 2020. LPI Contributions 1783:5101.
Bell, E.A., Boehnke, P., Harrison, T.M., and Mao, W.L. (2015)Potentially biogenic carbon preserved in a 4.1 billion-year-old zircon. Proc Natl Acad Sci 112:14518–14521.
Bibring, J.P., Langevin, Y., Mustard, J.F., Poulet, F., Arvidson,R., Gendrin, A., Gondet, B., Mangold, N., Pinet, P., Forget, F.,Berthe, M., Bibring, J.P., Gendrin, A., Gomez, C., Gondet, B.,Jouglet, D., Poulet, F., Soufflot, A., Vincendon, M., Combes,M., Drossart, P., Encrenaz, T., Fouchet, T., Merchiorri, R.,Belluci, G., Altieri, F., Formisano, V., Capaccioni, F., Cerroni,P., Coradini, A., Fonti, S., Korablev, O., Kottsov, V., Ignatiev,N., Moroz, V., Titov, D., Zasova, L., Loiseau, D., Mangold, N.,Pinet, P., Doute, S., Schmitt, B., Sotin, C., Hauber, E., Hoff-mann, H., Jaumann, R., Keller, U., Arvidson, R., Mustard, J.F.,Duxbury, T., Forget, F., Neukum, G. (2006) Global mineral-ogical and aqueous mars history derived from OMEGA/MarsExpress data. Science 312:400–404.
Bost, N., Ramboz, C., Lebreton, N., Foucher, F., Lopez-Reyes,G., De Angelis, S., Josset, M., Venegas, G., Sanz-Arranz, A.,and Rull, F. (2015) Testing the ability of the ExoMars 2018
450 SHKOLYAR ET AL.
Dow
nloa
ded
by C
arni
gie
Inst
Of
Was
hing
ton
from
ww
w.li
eber
tpub
.com
at 0
4/09
/18.
For
per
sona
l use
onl
y.
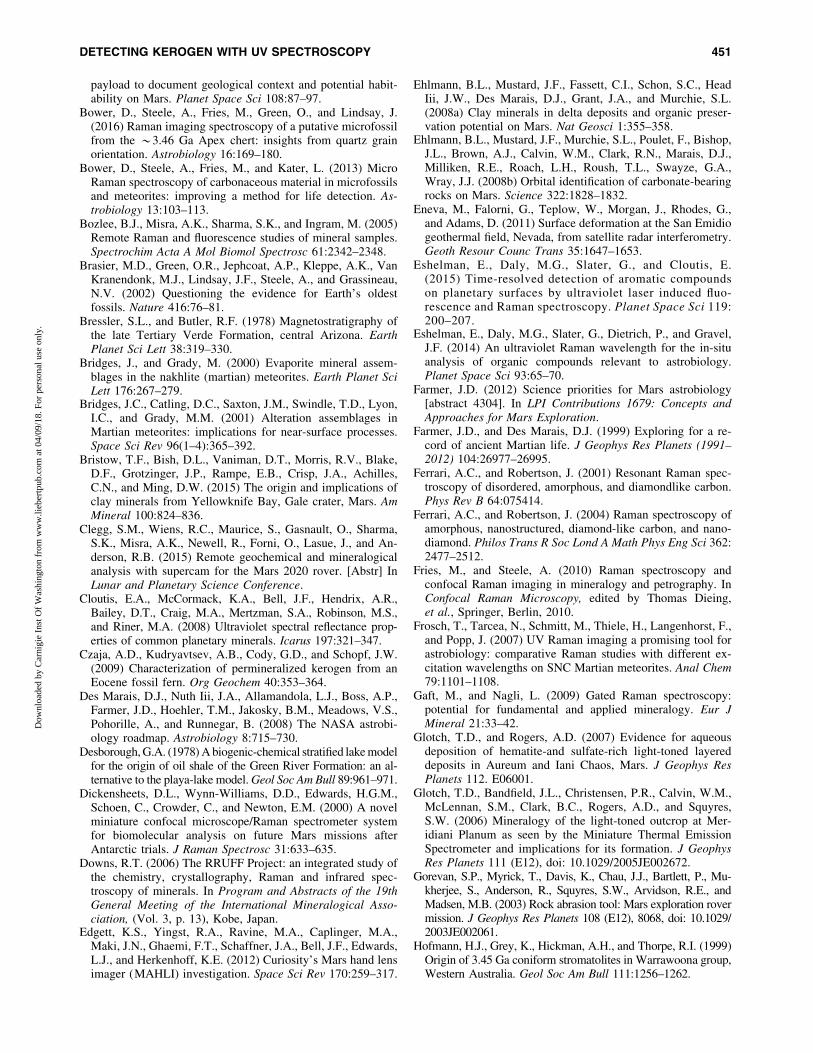
payload to document geological context and potential habit-ability on Mars. Planet Space Sci 108:87–97.
Bower, D., Steele, A., Fries, M., Green, O., and Lindsay, J.(2016) Raman imaging spectroscopy of a putative microfossilfrom the *3.46 Ga Apex chert: insights from quartz grainorientation. Astrobiology 16:169–180.
Bower, D., Steele, A., Fries, M., and Kater, L. (2013) MicroRaman spectroscopy of carbonaceous material in microfossilsand meteorites: improving a method for life detection. As-trobiology 13:103–113.
Bozlee, B.J., Misra, A.K., Sharma, S.K., and Ingram, M. (2005)Remote Raman and fluorescence studies of mineral samples.Spectrochim Acta A Mol Biomol Spectrosc 61:2342–2348.
Brasier, M.D., Green, O.R., Jephcoat, A.P., Kleppe, A.K., VanKranendonk, M.J., Lindsay, J.F., Steele, A., and Grassineau,N.V. (2002) Questioning the evidence for Earth’s oldestfossils. Nature 416:76–81.
Bressler, S.L., and Butler, R.F. (1978) Magnetostratigraphy ofthe late Tertiary Verde Formation, central Arizona. EarthPlanet Sci Lett 38:319–330.
Bridges, J., and Grady, M. (2000) Evaporite mineral assem-blages in the nakhlite (martian) meteorites. Earth Planet SciLett 176:267–279.
Bridges, J.C., Catling, D.C., Saxton, J.M., Swindle, T.D., Lyon,I.C., and Grady, M.M. (2001) Alteration assemblages inMartian meteorites: implications for near-surface processes.Space Sci Rev 96(1–4):365–392.
Bristow, T.F., Bish, D.L., Vaniman, D.T., Morris, R.V., Blake,D.F., Grotzinger, J.P., Rampe, E.B., Crisp, J.A., Achilles,C.N., and Ming, D.W. (2015) The origin and implications ofclay minerals from Yellowknife Bay, Gale crater, Mars. AmMineral 100:824–836.
Clegg, S.M., Wiens, R.C., Maurice, S., Gasnault, O., Sharma,S.K., Misra, A.K., Newell, R., Forni, O., Lasue, J., and An-derson, R.B. (2015) Remote geochemical and mineralogicalanalysis with supercam for the Mars 2020 rover. [Abstr] InLunar and Planetary Science Conference.
Cloutis, E.A., McCormack, K.A., Bell, J.F., Hendrix, A.R.,Bailey, D.T., Craig, M.A., Mertzman, S.A., Robinson, M.S.,and Riner, M.A. (2008) Ultraviolet spectral reflectance prop-erties of common planetary minerals. Icarus 197:321–347.
Czaja, A.D., Kudryavtsev, A.B., Cody, G.D., and Schopf, J.W.(2009) Characterization of permineralized kerogen from anEocene fossil fern. Org Geochem 40:353–364.
Des Marais, D.J., Nuth Iii, J.A., Allamandola, L.J., Boss, A.P.,Farmer, J.D., Hoehler, T.M., Jakosky, B.M., Meadows, V.S.,Pohorille, A., and Runnegar, B. (2008) The NASA astrobi-ology roadmap. Astrobiology 8:715–730.
Desborough, G.A. (1978) A biogenic-chemical stratified lake modelfor the origin of oil shale of the Green River Formation: an al-ternative to the playa-lake model. Geol Soc Am Bull 89:961–971.
Dickensheets, D.L., Wynn-Williams, D.D., Edwards, H.G.M.,Schoen, C., Crowder, C., and Newton, E.M. (2000) A novelminiature confocal microscope/Raman spectrometer systemfor biomolecular analysis on future Mars missions afterAntarctic trials. J Raman Spectrosc 31:633–635.
Downs, R.T. (2006) The RRUFF Project: an integrated study ofthe chemistry, crystallography, Raman and infrared spec-troscopy of minerals. In Program and Abstracts of the 19thGeneral Meeting of the International Mineralogical Asso-ciation, (Vol. 3, p. 13), Kobe, Japan.
Edgett, K.S., Yingst, R.A., Ravine, M.A., Caplinger, M.A.,Maki, J.N., Ghaemi, F.T., Schaffner, J.A., Bell, J.F., Edwards,L.J., and Herkenhoff, K.E. (2012) Curiosity’s Mars hand lensimager (MAHLI) investigation. Space Sci Rev 170:259–317.
Ehlmann, B.L., Mustard, J.F., Fassett, C.I., Schon, S.C., HeadIii, J.W., Des Marais, D.J., Grant, J.A., and Murchie, S.L.(2008a) Clay minerals in delta deposits and organic preser-vation potential on Mars. Nat Geosci 1:355–358.
Ehlmann, B.L., Mustard, J.F., Murchie, S.L., Poulet, F., Bishop,J.L., Brown, A.J., Calvin, W.M., Clark, R.N., Marais, D.J.,Milliken, R.E., Roach, L.H., Roush, T.L., Swayze, G.A.,Wray, J.J. (2008b) Orbital identification of carbonate-bearingrocks on Mars. Science 322:1828–1832.
Eneva, M., Falorni, G., Teplow, W., Morgan, J., Rhodes, G.,and Adams, D. (2011) Surface deformation at the San Emidiogeothermal field, Nevada, from satellite radar interferometry.Geoth Resour Counc Trans 35:1647–1653.
Eshelman, E., Daly, M.G., Slater, G., and Cloutis, E.(2015) Time-resolved detection of aromatic compoundson planetary surfaces by ultraviolet laser induced fluo-rescence and Raman spectroscopy. Planet Space Sci 119:200–207.
Eshelman, E., Daly, M.G., Slater, G., Dietrich, P., and Gravel,J.F. (2014) An ultraviolet Raman wavelength for the in-situanalysis of organic compounds relevant to astrobiology.Planet Space Sci 93:65–70.
Farmer, J.D. (2012) Science priorities for Mars astrobiology[abstract 4304]. In LPI Contributions 1679: Concepts andApproaches for Mars Exploration.
Farmer, J.D., and Des Marais, D.J. (1999) Exploring for a re-cord of ancient Martian life. J Geophys Res Planets (1991–2012) 104:26977–26995.
Ferrari, A.C., and Robertson, J. (2001) Resonant Raman spec-troscopy of disordered, amorphous, and diamondlike carbon.Phys Rev B 64:075414.
Ferrari, A.C., and Robertson, J. (2004) Raman spectroscopy ofamorphous, nanostructured, diamond-like carbon, and nano-diamond. Philos Trans R Soc Lond A Math Phys Eng Sci 362:2477–2512.
Fries, M., and Steele, A. (2010) Raman spectroscopy andconfocal Raman imaging in mineralogy and petrography. InConfocal Raman Microscopy, edited by Thomas Dieing,et al., Springer, Berlin, 2010.
Frosch, T., Tarcea, N., Schmitt, M., Thiele, H., Langenhorst, F.,and Popp, J. (2007) UV Raman imaging a promising tool forastrobiology: comparative Raman studies with different ex-citation wavelengths on SNC Martian meteorites. Anal Chem79:1101–1108.
Gaft, M., and Nagli, L. (2009) Gated Raman spectroscopy:potential for fundamental and applied mineralogy. Eur JMineral 21:33–42.
Glotch, T.D., and Rogers, A.D. (2007) Evidence for aqueousdeposition of hematite-and sulfate-rich light-toned layereddeposits in Aureum and Iani Chaos, Mars. J Geophys ResPlanets 112. E06001.
Glotch, T.D., Bandfield, J.L., Christensen, P.R., Calvin, W.M.,McLennan, S.M., Clark, B.C., Rogers, A.D., and Squyres,S.W. (2006) Mineralogy of the light-toned outcrop at Mer-idiani Planum as seen by the Miniature Thermal EmissionSpectrometer and implications for its formation. J GeophysRes Planets 111 (E12), doi: 10.1029/2005JE002672.
Gorevan, S.P., Myrick, T., Davis, K., Chau, J.J., Bartlett, P., Mu-kherjee, S., Anderson, R., Squyres, S.W., Arvidson, R.E., andMadsen, M.B. (2003) Rock abrasion tool: Mars exploration rovermission. J Geophys Res Planets 108 (E12), 8068, doi: 10.1029/2003JE002061.
Hofmann, H.J., Grey, K., Hickman, A.H., and Thorpe, R.I. (1999)Origin of 3.45 Ga coniform stromatolites in Warrawoona group,Western Australia. Geol Soc Am Bull 111:1256–1262.
DETECTING KEROGEN WITH UV SPECTROSCOPY 451
Dow
nloa
ded
by C
arni
gie
Inst
Of
Was
hing
ton
from
ww
w.li
eber
tpub
.com
at 0
4/09
/18.
For
per
sona
l use
onl
y.
Hug, W.F., Bhartia, R., Taspin, A., Lane, A., Conrad, P., Si-japati, K., and Reid, R.D. (2005) Status of miniature inte-grated UV resonance fluorescence and Raman sensors fordetection and identification of biochemical warfare agents.Opt East 2005:59940J-59940J-12.
Jehlicka, J., Edwards, H.G., and Culka, A. (2010) Using por-table Raman spectrometers for the identification of organiccompounds at low temperatures and high altitudes: exobio-logical applications. Philos Trans R Soc A 368:3109–3125.
Jorge-Villar, S.E., and Edwards, H.G.M. (2013) Microorganismresponse to stressed terrestrial environments: a Raman spec-troscopic perspective of extremophilic life strategies. Life 3:276–294.
Lowe, D.R. (1980) Stromatolites 3,400-myr old from the ar-chean of Western Australia. Nature 284:441–443.
Madden, M.E.E., Bodnar, R.J., and Rimstidt, J.D. (2004) Jar-osite as an indicator of water-limited chemical weathering onMars. Nature 431:821–823.
Maeda, H., Tanaka, G., Shimobayashi, N., Ohno, T., andMatsuoka, H. (2011) Cambrian Orsten Lagerstatte from theAlum Shale Formation: fecal pellets as a probable source ofphosphorus preservation. Palaios 26:225–231.
Marshall, C.P., Carter, E.A., Leuko, S., and Javaux, E.J. (2006)Vibrational spectroscopy of extant and fossil microbes: rel-evance for the astrobiological exploration of Mars. VibSpectrosc 41:182–189.
Marshall, C.P., Edwards, H.G.M., and Jehlicka, J. (2010) Un-derstanding the application of Raman spectroscopy to thedetection of traces of life. Astrobiology 10:229–243.
Marshall, C.P., Emry, J.R., and Marshall, A.O. (2011) Hae-matite pseudomicrofossils present in the 3.5-billion-year-oldApex Chert. Nat Geosci 4:240–243.
Marshall, C.P., and Marshall, A.O. (2015) Challenges analyzinggypsum on Mars by Raman spectroscopy. Astrobiology 15:761–769.
Martyshkin, D.V., Ahuja, R.C., Kudriavtsev, A., and Mirov,S.B. (2004) Effective suppression of fluorescence light inRaman measurements using ultrafast time gated charge cou-pled device camera. Rev Sci Instrum 75:630–635.
McIlreath, I.A., and Morrow, D.W. (1990) Diagenesis. Geolo-gical Association of Canada.
Misra, A.K., Acosta-Maeda, T.E., Sharma, S.K., McKay, C.P.,Gasda, P.J., Taylor, G.J., Lucey, P.G., Flynn, L., Abedin,M.N., and Clegg, S.M. (2016) ‘‘Standoff biofinder’’ for fast,noncontact, nondestructive, large-area detection of biologicalmaterials for planetary exploration. Astrobiology 16:715–729.
Moore, J.N. (1979) Geology map of the San Emidio, Nevadageothermal area (No. DOE/ET/28392-33). University of UtahResearch Institute, Earth Science Laboratory, Salt Lake City(USA).
Morris, R.V., Ruff, S.W., Gellert, R., Ming, D.W., Arvidson,R.E., Clark, B.C., Golden, D.C., Siebach, K., Klingelhofer,G., Schroder, C., Fleischer, I., Yen, A.S., Squyres, S.W.(2010) Identification of carbonate-rich outcrops on Mars bythe Spirit rover. Science 329:421–424.
Morris, R.V., Vaniman, D.T., Blake, D.F., Gellert, R., Chipera,S.J., Rampe, E.B., Ming, D.W., Morrison, S.M., Downs, R.T.,and Treiman, A.H. (2016) Silicic volcanism on Mars evi-denced by tridymite in high-SiO2 sedimentary rock at Galecrater. Proc Natl Acad Sci 201607098.
Muller, K., Waloszek, D., and Maas, A. (2009) Fossils andStrata, Morphology, Ontogeny and Phylogeny of the Phos-phatocopina (Crustacea) from the Upper Cambrian Orsten ofSweden. John Wiley & Sons.
Mustard, J.F., Adler, M., Allwood, A., Bass, D.S., Beaty, D.W.,Bell Iii, J.F., Brinckerhoff, W.B., Carr, M., Des Marais, D.J.,and Drake, B. (2013) Report of the Mars 2020 ScienceDefinition Team, 154 pp., posted July, 2013, by the MarsExploration Program Analysis Group (MEPAG). Availableonline at https://mars.nasa.gov/mars2020/files/mars2020/SDT-Report Finalv6.pdf.
National Research Council, NRC. (2011) Vision and Voyages:For Planetary Science in the Decade 2013–2022. NationalAcademies Press, Washington, DC.
Nations, J.D., Hevly, R.H., Blinn, D.W., and Landye, J.J.(1981) Paleontology, paleoecology, and depositional historyof the Miocene-Pliocene Verde Formation, vol 13. ArizonaGeological Society Digest, Yavapai County, Arizona, pp133–149.
Neuweiler, F., d’Orazio, V., Immenhauser, A., Geipel, G.,Heise, K.-H., Cocozza, C., and Miano, T.M. (2003) Fulvicacid–like organic compounds control nucleation of marinecalcite under suboxic conditions. Geology 31:681–684.
Noe Dobrea, E.Z., Wray, J.J., Calef, F.J., Parker, T.J., andMurchie, S.L. (2012) Hydrated minerals on Endeavour Cra-ter’s rim and interior, and surrounding plains: new insightsfrom CRISM data. Geophys Res Lett 39. L23201.
Osborne, R.H., Licari, G.R., and Link, M.H. (1982) Modernlacustrine stromatolites, Walker Lake, Nevada. SedimentGeol 32:39–61.
Papineau, D., De Gregorio, B., Cody, G., O’Neil, J., Steele, A.,Stroud, R., and Fogel, M. (2011) Young poorly crystallinegraphite in the >3.8-Gyr-old Nuvvuagittuq banded iron for-mation. Nat Geosci 4:376–379.
Pasteris, J.D., and Wopenka, B. (2003) Necessary, but notsufficient: Raman identification of disordered carbon as asignature of ancient life. Astrobiology 3:727–738.
Popa, R., Kinkle, B.K., and Badescu, A. (2004) Pyrite framboids asbiomarkers for iron-sulfur systems. Geomicrobiol J 21:193–206.
Ray, M.D., Sedlacek, A.J., and Wu, M. (2000) Ultraviolet mini-Raman lidar for stand-off, in situ identification of chemicalsurface contaminants. Rev Sci Instrum 71:3485–3489.
Ruff, S.W., Farmer, J.D., Calvin, W.M., Herkenhoff, K.E.,Johnson, J.R., Morris, R.V., Rice, M.S., Arvidson, R.E., Bell,J.F., and Christensen, P.R. (2011) Characteristics, distribu-tion, origin, and significance of opaline silica observed by theSpirit rover in Gusev crater, Mars. J Geophys Res Planets(1991–2012) 116, E00F23, doi: 10.1029/2010JE003767.
Scholle, P.A., Ulmer, D.S., and Melim, L.A. (1992) Late-stagecalcites in the Permian Capitan Formation and its equivalents,Delaware Basin margin, west Texas and New Mexico: evi-dence for replacement of precursor evaporites. Sedimentology39:207–234.
Schopf, J.W., Farmer, J.D., Foster, I.S., Kudryavtsev, A.B., Gal-lardo, V.A., and Espinoza, C. (2012) Gypsum-permineralizedmicrofossils and their relevance to the search for life on Mars.Astrobiology 12:619–633.
Schopf, J.W., Kudryavtsev, A.B., Agresti, D.G., Wdowiak, T.J.,and Czaja, A.D. (2002) Laser-Raman imagery of Earth’searliest fossils. Nature 416:73–76.
Sharma, S.K., Lucey, P.G., Ghosh, M., Hubble, H.W., andHorton, K.A. (2003) Stand-off Raman spectroscopic detec-tion of minerals on planetary surfaces. Spectrochim Acta AMol Biomol Spectrosc 59:2391–2407.
Shreve, A.P., Cherepy, N.J., and Mathies, R.A. (1992) Effectiverejection of fluorescence interference in Raman spectroscopyusing a shifted excitation difference technique. Appl Spec-trosc 46:707–711.
452 SHKOLYAR ET AL.
Dow
nloa
ded
by C
arni
gie
Inst
Of
Was
hing
ton
from
ww
w.li
eber
tpub
.com
at 0
4/09
/18.
For
per
sona
l use
onl
y.
Sierra, M.D.S., Donard, O., Lamotte, M., Belin, C., and Ewald,M. (1994) Fluorescence spectroscopy of coastal and marinewaters. Mar Chem 47:127–144.
Skok, J.R., Mustard, J.F., Ehlmann, B.L., Milliken, R.E., andMurchie, S.L. (2010) Silica deposits in the Nili Patera calderaon the Syrtis Major volcanic complex on Mars. NatureGeosci 3:838–841.
Skulinova, M., Lefebvre, C., Sobron, P., Eshelman, E., Daly, M.,Gravel, J.F., Cormier, J.F., Chateauneuf, F., Slater, G., andZheng, W. (2014) Time-resolved stand-off UV-Raman spec-troscopy for planetary exploration. Planet Space Sci 92:88–100.
Smith, H.D., McKay, C.P., Duncan, A.G., Sims, R.C., Ander-son, A.J., and Grossl, P.R. (2014) An instrument design fornon-contact detection of biomolecules and minerals on Marsusing fluorescence. J Biol Eng 8:16.
Socrates, G. (2004) Infrared and Raman Characteristic GroupFrequencies: Tables and Charts. John Wiley & Sons, WestSussex.
Squyres, S.W., Arvidson, R.E., Bell, J.F., 3rd, Calef, F., 3rd,Clark, B.C., Cohen, B.A., Crumpler, L.A., de Souza, P.A., Jr.,Farrand, W.H., Gellert, R., Grant, J., Herkenhoff, K.E.,Hurowitz, J.A., Johnson, J.R., Jolliff, B.L., Knoll, A.H., Li,R., McLennan, S.M., Ming, D.W., Mittlefehldt, D.W., Parker,T.J., Paulsen, G., Rice, M.S., Ruff, S.W., Schroder, C., Yen,A.S., Zacny. K. (2012) Ancient impact and aqueous processesat Endeavour Crater, Mars. Science 336:570–576.
Squyres, S.W., Grotzinger, J.P., Arvidson, R.E., Bell, J.F., 3rd,Calvin, W., Christensen, P.R., Clark, B.C., Crisp, J.A., Far-rand, W.H., Herkenhoff, K.E., Johnson, J.R., Klingelhofer,G., Knoll, A.H., McLennan, S.M., McSween, H.Y., Jr.,Morris, R.V., Rice, J.W., Jr., Rieder, R., Soderblom, L.A.(2004) In situ evidence for an ancient aqueous environment atMeridiani Planum, Mars. Science 306:1709–1714.
Steele, A., Fries, M., Amundsen, H., Mysen, B., Fogel, M.,Schweizer, M., and Boctor, N. (2007) Comprehensive im-aging and Raman spectroscopy of carbonate globules fromMartian meteorite ALH 84001 and a terrestrial analogue fromSvalbard. Meteorit Planet Sci 42:1549–1566.
Steele, A., McCubbin, F., Fries, M., Kater, L., Boctor, N., Fo-gel, M., Conrad, P., Glamoclija, M., Spencer, M., and Mor-row, A. (2012a) A reduced organic carbon component inmartian basalts. Science 337:212–215.
Steele, A., McCubbin, F.M., and Fries, M.D. (2016) The prov-enance, formation, and implications of reduced carbon phasesin Martian meteorites. Meteorit Planet Sci 51:2203–2225.
Steele, A., McCubbin, F.M., Fries, M.D., Golden, D., Ming,D.W., and Benning, L.G. (2012b) Graphite in the martianmeteorite Allan Hills 84001. Am Mineral 97:1256–1259.
Stopar, J.D., Lucey, P.G., Sharma, S.K., Misra, A.K., Taylor,G.J., and Hubble, H.W. (2005) Raman efficiencies of naturalrocks and minerals: performance of a remote Raman systemfor planetary exploration at a distance of 10 meters. Spec-trochim Acta A Mol Biomol Spectrosc 61:2315–2323.
Storrie-Lombardi, M.C., Hug, W.F., McDonald, G.D., Tsapin,A.I., and Nealson, K.H. (2001) Hollow cathode ion lasers fordeep ultraviolet Raman spectroscopy and fluorescence im-aging. Rev Sci Instrum 72:4452–4459.
Surdam, R.C., and Stanley, K.O. (1979) Lacustrine sedimentationduring the culminating phase of Eocene lake Gosiute, Wyom-ing (Green River Formation). Geol Soc Am Bull 90:93–110.
Tarcea, N., Harz, M., Rosch, P., Frosch, T., Schmitt, M., Thiele,H., Hochleitner, R., and Popp, J. (2007) UV Raman spec-troscopy—a technique for biological and mineralogical
in situ planetary studies. Spectrochim Acta A Mol BiomolSpectrosc 68:1029–1035.
Van Beynen, P., Bourbonniere, R., Ford, D., and Schwarcz, H.(2001) Causes of colour and fluorescence in speleothems.Chem Geol 175:319–341.
Van Kranendonk, M.J., Webb, G.E., and Kamber, B.S. (2003)Geological and trace element evidence for a marine sedi-mentary environment of deposition and biogenicity of 3.45Ga stromatolitic carbonates in the Pilbara Craton, and supportfor a reducing Archaean ocean. Geobiology 1:91–108.
Vandenbroucke, M., and Largeau, C. (2007) Kerogen origin,evolution and structure. Org Geochem 38:719–833.
Vaniman, D.T., Bish, D.L., Ming, D.W., Bristow, T.F., Morris, R.V.,Blake, D.F., Chipera, S.J., Morrison, S.M., Treiman, A.H., Rampe,E.B., Rice, M., Achilles, C.N., Grotzinger, J.P., McLennan, S.M.,Williams, J., Bell, J.F., 3rd, Newsom, H.E., Downs, R.T., Maurice,S., Sarrazin, P., Yen, A.S., Morookian, J.M., Farmer, J.D., Stack,K., Milliken, R.E., Ehlmann, B.L., Sumner, D.Y., Berger, G.,Crisp, J.A., Hurowitz, J.A., Anderson, R., Des Marais, D.J., Stol-per, E.M., Edgett, K.S., Gupta, S., Spanovich, N.; MSL ScienceTeam. (2014) Mineralogy of a mudstone at Yellowknife Bay, Galecrater, Mars. Science 343:1243480.
Wadell, J. (1972) Sedimentation and stratigraphy of the VerdeFormation (Pliocene). Master’s Thesis, Tempe, Arizona, ASU.
Wang, A., Freeman, J.J., Jolliff, B.L., and Chou, I.M. (2006)Sulfates on Mars: a systematic Raman spectroscopic study ofhydration states of magnesium sulfates. Geochim CosmochimActa 70:6118–6135.
Wiens, R.C., Maurice, S., Johnson, J.R., Clegg, S.M., Sharma, S.K.,Rull, F., Montmessin, F., Anderson, R.B., Beyssac, O., Bonal, L.,and Deflores, L. (2014) The SuperCam remote sensing suite forMars 2020: co-aligned LIBS, Raman, and near-IR spectroscopies,and color micro-imaging [abstract 1086]. In InternationalWorkshop on Instrumentation for Planetary Missions (IPM-2014), NASA Goddard Space Flight Center, Greenbelt, MD.
Wood, J.D. (1991) Geology of the Wind Mountain gold deposit,Washoe County, Nevada. In: Geology and Ore Deposits ofthe Great Basin. Symposium proceedings: Geological So-ciety of Nevada, Reno.
Address correspondence to:Svetlana Shkolyar
Geophysical LaboratoryCarnegie Institution for Science
5251 Broad Branch Road NWWashington, DC 20015
E-mail: [email protected]
Submitted 6 July 2017Accepted 3 November 2017
Abbreviations Used
CRIS¼ confocal Raman imaging spectroscopyCW¼ continuous wave
MMC¼macromolecular carbonMSR¼Mars sample return
PAHs¼ polycyclic aromatic hydrocarbonsUV-TG¼UV time-gatedXRPD¼X-ray powder diffraction
DETECTING KEROGEN WITH UV SPECTROSCOPY 453
Dow
nloa
ded
by C
arni
gie
Inst
Of
Was
hing
ton
from
ww
w.li
eber
tpub
.com
at 0
4/09
/18.
For
per
sona
l use
onl
y.