detecting bubbles in hong kong residential property...
TRANSCRIPT

- 1 -
DETECTING BUBBLES IN HONG KONG RESIDENTIAL PROPERTY MARKET
Matthew S. Yiu†
ASEAN + 3 Macroeconomic Research Office
Jun Yu*
Singapore Management University
Lu Jin
Hong Kong Monetary Authority
March, 2013
Abstract
This study uses a newly developed bubble detection method (Phillips, Shi and Yu, 2011) to identify real estate bubbles in the Hong Kong residential property market. Our empirical results reveal several positive bubbles in the Hong Kong residential property market, including one in 1995, a stronger one in 1997, yet another one in 2004, and a more recent one in 2008. In addition, the method identifies two negative bubbles in the data, one in 2000 and the other one in 2001. These empirical results continue to be valid for the mass segment and the luxury segment. However, this method has also found a bubble in early 2011 in the overall market, and in the mass segment but not in the luxury segment. This result suggests that the bubble in early 2011 in the Hong Kong real estate market was caused primarily by the mass segment under the demand pressure from end-users of small-to-medium sized apartments.
† We thank Peter Phillips, He Dong, Cho-hoi Hui, Charles Leung, two referees, the participants of the 2012 SKBI Annual Conference, and the participants of the 27th FEG – ACAES Conference for their comments on the paper.
*Jun Yu would like to acknowledge the financial support from Singapore Ministry of Education Academic Research Fund Tier 2 under the grant number MOE2011-T2-2-096.
- 2 -
JEL Classification Numbers: C22, G12, R31
Keywords: asset bubble; residential property prices; right-tailed unit root test; explosive behaviour; price-to-rent ratio
Author’s E-Mail Address:
[email protected]; [email protected]; [email protected]
The views and analysis expressed in this paper are those of the authors, and do not necessarily represent the views of the Hong Kong Monetary Authority.
- 3 -
1. INTRODUCTION
Over the last 15 years, both advanced economies and emerging economies have suffered severe financial crises, including the Asian financial crisis, the Dot-Com crisis, the global financial crisis and the European debt crisis. All these crises were triggered by the collapse of price bubbles in asset markets, such as foreign exchange markets, equity markets and property markets. Not surprisingly, the former vice chairman of the U.S. Federal Reserve Board, Donald Kohn, argued that “Federal Reserve policymakers should deepen their understanding about how to combat speculative bubbles to reduce the chances of another financial crisis.” Given the adverse effects of these bubbles and the associated crises, economists and policymakers have been searching for ways to detect bubble formation empirically in order to take appropriate measures to deflate bubbles before they burst.
A very important asset class is property. Housing is an important form of wealth to Asian economies, and real estate investment is a significant component for Asian investors. Moreover, it is widely believed that housing prices and transaction volumes in eastern Asian economies may potentially impact global financial stability. However, it is believed that many investors in the Asian real estate markets generally buy in the expectation of further price appreciation, rather than simply for dwelling purposes. Not surprisingly, real estate bubbles have constantly been on the radar of the regulators of Asian economies, including China, Hong Kong, Malaysia, the Philippines, Singapore and Thailand, thus an early warning detection system of real estate bubbles is critical to these economies.
A necessary and sufficient condition for the presence of a bubble is the divergence of the actual efficient asset price from the fundamental value of that same asset. This approach to bubble detection makes it necessary to obtain the fundamental value of the asset. Unfortunately, it is often unclear and sometimes impossible to determine the fundamental variables, and how to calculate the fundamental value from the fundamental variables. Instead of looking for a necessary and sufficient condition, in a recent paper, Phillips, Shi and Yu (2011) propose to find a sufficient condition for identifying bubbles. The idea is to find explosiveness in the dynamic behaviour of the asset price after the fundamental value is taken into account.
The objective of this study is to use a recent econometric method developed by Phillips, Shi and Yu (2011) to identify asset price bubbles, and to provide real time estimate of the origination date and the conclusion date of all the bubbles in the Hong Kong residential property market. Hong Kong's property market is of interest to us because it is one of the most volatile real estate markets in the world, having experienced a few interesting episodes over the last 20 years. For example, there was a significant rise in price in 1997. In more recent years, since
- 4 -
mid-2009, another significant rise in price was noted and hence, it is important, from the policy perspective, to see if there is a bubble in this particular recent period.
This paper is organized as follows. Section 2 briefly reviews the two literatures, econometric identification of bubbles and Asian property markets. Section 3 briefly explains the method proposed in Phillips, Shi and Yu (2011). Section 4 talks about the Hong Kong residential property market. Section 5 reports the empirical results. Finally, a conclusion is provided in Section 6.
2. Literature Review
Bubble detection has been extensively studied in the literature. Perhaps the most commonly used detection methods are developed upon the present value model and the rational bubble assumption. The present value model states that the price of an asset is the sum of all its discounted future incomes in the absence of a bubble condition. Blanchard and Watson (1982) show that by solving consumers' optimization problem and assuming no rational bubble and no-arbitrage, the price of a financial asset (e.g. the price of a housing property) is the present value of the future incomes (e.g. the future rental income stream); see also Gurkaynak (2008) for an overview of the literature. This is often referred to as the fundamental part of the price of an asset. Rational bubbles arise when investors are willing to pay more than the fundamental value to buy an asset in the anticipation that the asset price will significantly exceed its fundamental value in the future. When rational bubbles are present, the asset price is composed of the fundamental component and the bubble component.1
An earlier method of detecting rational bubbles is the variance bounds test proposed by Shiller (1981). The idea is that, if a rational bubble exists, the variance of observed asset price will exceed the bound imposed by the variance of the fundamental value. However, this test attracts strong criticism for having little structure on the bubble part and the indication of bubbles from the test can be ruled out by other reasonable factors. Another earlier method is the two-step test proposed by West (1987) which requires a detailed specification of an underlying equilibrium model of asset prices. Basically, the test compares the respective
1 From a theoretical perspective, the “bubble” explanation of the housing price dynamics is not satisfactory, as argued by Montrucchio and Privileggi (2001) and Leung (2004). Furthermore, from an empirical perspective, it may be difficult to differentiate the bubble dynamics from the dynamics generated by the regime switching process; see Chen (2001), Chang et al (2011a, b), and Driffill and Sola (1998).
- 5 -
estimates of the impact of the fundamental value on the asset price in the underlying equilibrium model in the context of a simple linear model which assumes no bubble component. If the estimate from the linear model is similar to that of the underlying equilibrium model, it suggests no bubble exists. Any discrepancy between the two estimates may suggest the presence of a bubble component. However, the power of this test depends on the strength of the equilibrium model, and therefore, the rejection of the no bubble hypothesis may be due to the model misspecification rather than the existence of bubbles.
To deal with the deficiencies in the variance bounds test and in the two-steps test of West, Campbell and Shiller (1987) propose an alternative method based on the idea that the gap between the asset price and the fundamental value will exhibit explosive behaviour during a bubble-formation process. In particular, Campbell and Shiller (1987) put forward a unit root test as the first step to test the explosiveness and the presence of a bubble. If a bubble exists, the asset price and the fundamental value can be characterized in two possible cases.2 In case one, the asset price is non-stationary but the fundamental value is stationary. In case two, both the asset price and fundamental value are non-stationary. However, the second case is not sufficient evidence for the presence of a bubble, and hence, a co-integration test is called for as the second step. If a bubble is present, the asset price and its associated fundamental value cannot be co-integrated. Diba and Grossman (1988) further point out that the explosiveness in the gap between the asset price and the fundamental price is sufficient for bubble detection, and the unit root and co-integration tests are the tools for the identification of the explosiveness. Since their proposal, the left-tailed unit root tests and the co-integration tests on the price series and fundamental value series have been widely used for detecting asset bubbles.
The unit root and co-integration tests have been applied to detect property market bubbles in different economies over the last two decades. For example, Drake (1993) uses this method to study the price boom in the mid-1980s in the UK property market and Arshanapalli and Nelson (2008) employ the co-integration test to identify the housing bubble in the mid-2000s in the US housing market. With respect to Hong Kong’s real estate market, Peng (2002) used this method to detect the 1997 bubble in the residential property market. The test
2 There are four possible scenarios when a unit root test is applied to the asset price and the fundamental value series: (A) the asset price and the fundamental value are both stationary; (B) the asset price is stationary but the fundamental value is non-stationary; (C) the asset price is non-stationary and the fundamental value is stationary; (D) the asset price and the fundamental value are both non-stationary. Scenario (A) indicates no bubble; Scenario (B) is not compatible with the rational bubble model; Scenario (C) suggests the presence of bubbles in the asset price; and Scenario (D) suggests that a co-integration test is needed to detect a co-integrated relation between the asset price and the fundamental.
- 6 -
has also been extended in different ways over time, such as using panel data and regime switching techniques.3
Although the unit root and co-integration tests have been widely used in empirical research, there is a serious limitation within the methodology as pointed out by Evans (1991) who has demonstrated that the unit root and co-integration tests are not capable of detecting explosive bubbles when there are periodically collapsing bubbles in the sample (Blanchard, 1979). Collapsing bubbles break the nonlinearity in the dynamic structure and substantially decrease the power of the test. Using simulated data, Evans (1991) examines the power of the unit root and co-integration tests and confirms his argument. In a mildly explosive process with a collapse, Phillips and Yu (2009) show that the DF statistics diverge to minus infinity when they are obtained from the full sample. This is why the standard unit root and co-integration tests fail to detect the explosiveness in the data covering the sample period where bubbles collapse. To deal with the Evans critique, a number of methods have been recently proposed that have some power in detecting periodically collapsing bubbles.
The approach adopted by Phillips, Wu and Yu (PWY, hereafter, 2011) uses a sup Dickey-Fuller (DF) test (or forward recursive right-tailed DF test).4 PWY suggest implementing the right-tailed DF test repeatedly on a forward expanding sample sequence and performing inferences based on the sup value of the corresponding DF statistic sequence. They show that the sup DF (SADF) test significantly improves power compared with the conventional unit root and co-integration tests. An additional advantage relative to the conventional unit root and co-integration tests is that this method also provides real time estimates of the origination date and the termination date of a bubble. When there is a single bubble in the data, it is known that this dating strategy is consistent, as shown by Phillips and Yu (2009). Phillips and Yu (2012) have successfully identified asset price bubbles in different assets before and after the global financial crisis, using the PWY method.
Testing procedures which are designed to test for structural breaks, such as Chow tests, model selection, and CUSUM tests may also be used to estimate the origination date and the termination date of a bubble. Extensive simulations conducted by Homm and Breitung (2012) indicate that the PWY procedure works satisfactorily compared with other recursive (as distinct
3 For example, based on the panel unit root and co-integration tests, Mikhed and Zemcik (2009) used US metropolitan data and Tsai and Peng (2011) used data of four major cities in Taiwan to detect property bubbles.
4 PWY method can be used in connection to any other unit root tests.
- 7 -
from full sample) procedures for structural breaks, and is particularly effective as a real time bubble detection algorithm.
A limitation in the PWY methodology is that it is designed to analyse a single bubble episode. Phillips, Shi and Yu (PSY, hereafter, 2011) show that if there are two bubbles in a time series of which the duration of the second bubble is less than that of the first one, the PWY procedure cannot consistently estimate the origination date and the termination date of the bubble. This observation also applies to the case of multiple bubbles. Although many interest datasets in economics and finance involve only one bubble, the phenomenon of multiple bubbles is inevitable if one examines a long enough time series.
To overcome this weakness in PWY, PSY (2011) propose an alternative approach named the supsup DF test, which is also based on the idea of repeatedly implementing a right-tailed DF test.5 However, rather than fixing the starting point of each regression window to be the first observation of the full sample, the PSY procedure extends the sample sequence by varying both the starting point and the ending point of the sample over a feasible range of flexible windows. Compared with the PWY procedure, the PSY procedure covers more subsamples of the data and has greater flexibility in choosing a subsample that contains a bubble episode. It was shown in PSY that their estimates of the origination date and the termination date of all the bubbles are consistent. Like the PWY method, PSY also provides real time estimates of the origination date and the termination date of a bubble.
While the literature on bubble detection is rapidly being developed, the number of studies on Asia property markets is growing as well. This is because housing is an important form of wealth in Asian economies, such as in China, Hong Kong, Korea Malaysia, the Philippines, Singapore, and Thailand. Furthermore, the recent rapid rise of property prices, following the aggressive quantitative monetary easing programs adopted by advanced economies to deal with the impact of global financial crisis, has been a major concern to the Asian authorities in the context of financial and macroeconomic stability.
The most common approach to understanding the dynamics of house prices is to develop a model utilizing economic fundamentals and short-term factors. Glindro et al (2008) investigate what determines the fundamental values and short-term dynamics of house prices in nine Asia-Pacific economies. Ahuja et al (2010) also use a fundamental model to investigate whether house prices are rising too fast in China. Also based on economic fundamentals, Ahuja
5 PSY method can be used in connection to any other unit root tests.
- 8 -
and Porter (2010) and Craig and Hua (2011) study the determinants of property prices in Hong Kong and the question of whether house prices are rising too fast in Hong Kong respectively.
Another approach to studying house price dynamics in Asian property markets is the use of a dataset of fundamental indicators. Leung et al (2008) apply a cluster analysis approach to formulate a simple characterisation of the Hong Kong property market from 1996 to 2008, using a variety of demand-side variables. Using the same methodology and similar indicators, Chan et al (2010) investigate the price changes in the Singapore private residential market in the period from 1996 to 2010. Basically, the cluster analysis provides a set of quick summary statistics of the state of the market, as explained by a combination of indicators.
The two commonly used approaches above have been used to indicate overvaluation/bubbles in house prices, i.e. the deviations of current prices from fundamentals. However, both of them have their own limitations. For the fundamental model approach, the correct specification of fundamental variables is crucial to the reliable estimates of price deviation from equilibrium since the overvaluation/bubble part is the residual part that cannot be explained by the list of fundamental variables. For the cluster analysis approach, the limitation is that results are sensitive to the initial allocations and data updates.
Both the fundamental model approach and cluster analysis approach have constraints for real time detection of bubble formation since they need fundamental variables/indicators, and some of them are only of quarterly frequency. On the other hand, the PSY method can be applied to data at any frequency. Furthermore, the PSY method is a formal statistical test of bubble existence whereas the other two approaches rely on subjective judgement on the deviations from fundamentals or from moderate states. Consequently, the PSY method is the more objective tool for real time bubble detection for policy makers.
3. PHILLIPS, SHI AND YU (PSY) METHOD
Based on the present value model, rational bubble assumption and nonlinear explosive characteristic, PWY (2011) and PSY (2011) have devised a procedure to identify the bubble-type behaviour in asset prices in subsamples with a flexible initial observation as well as a flexible window size. In the context of DF test, the method is based on the follow regression:
- 9 -
ttt ff ερµ +−+=∆ −1)1( (1)
where tf is the time series of the asset price with the fundamental value been taken into
account (in the present paper it is the ratio of real price to real rent), and tε is the error term. In
the test, the null hypothesis is 1:0 =ρH (unit root behaviour) and the alternative hypothesis is
1:1 >ρH (explosive behaviour). Different from the standard left-tailed unit root test where the
alternative hypothesis is stationary, both the PSY test and the PWY test look directly for evidence of nonlinear explosive behaviour. The idea is motivated from the fact that if there is a bubble in the asset market, explosiveness must manifest in the dynamics of the asset price, even after the fundamental value is accounted for, according to the present value model (Blanchard and Watson, 1982).
The innovation in the PWY method is that it calculates the right-tailed DF statistics in forward recursive regressions, that is, the initial observation of each regression is fixed to be the first observation of the full sample but the number of observations used in each regression expands until the full sample is utilized. The DF statistic is computed recursively from each regression, and the sup DF statistic is then used to detect the presence of bubble. In order to identify the origination and collapse dates of a bubble, the recursive DF statistic can be matched against the critical value sequence. The origination of a bubble is dated as the first recursion for which the value of the DF statistic of estimated ρ is equal to or larger than the right side critical
value, and the collapse date is identified as the first subsequent recursion for which the DF statistic drops back to or below the critical value.
A limitation in the PWY method is that, while it is effective when there is only one bubble in the sample, and also effective in time stamping the first bubble when there are multiple bubbles in the sample, they are less useful to time stamp the subsequent bubbles, as shown in PSY (2011). However, the economists and policy makers are often interested in knowing whether or not there are subsequent bubbles in the sample, and if so, how to estimate the origination date and the collapse date of the subsequent bubbles. To time stamp the subsequent bubbles, in the context of DF test, the PSY method is also based on the regression model (1),
testing 1:0 =ρH against 1:1 >ρH . The difference is that it calculates the right-tailed DF
statistics in more flexible recursive regressions, not only varying the number of observations but also varying the initial observation of each regression. The supsup DF statistic is then used to detect the presence of bubbles. To identify the origination and collapse dates of a bubble, the sup DF statistic, where the supremum is taken with respect to the number of observations with the last observation being anchored, is matched against the critical value.
- 10 -
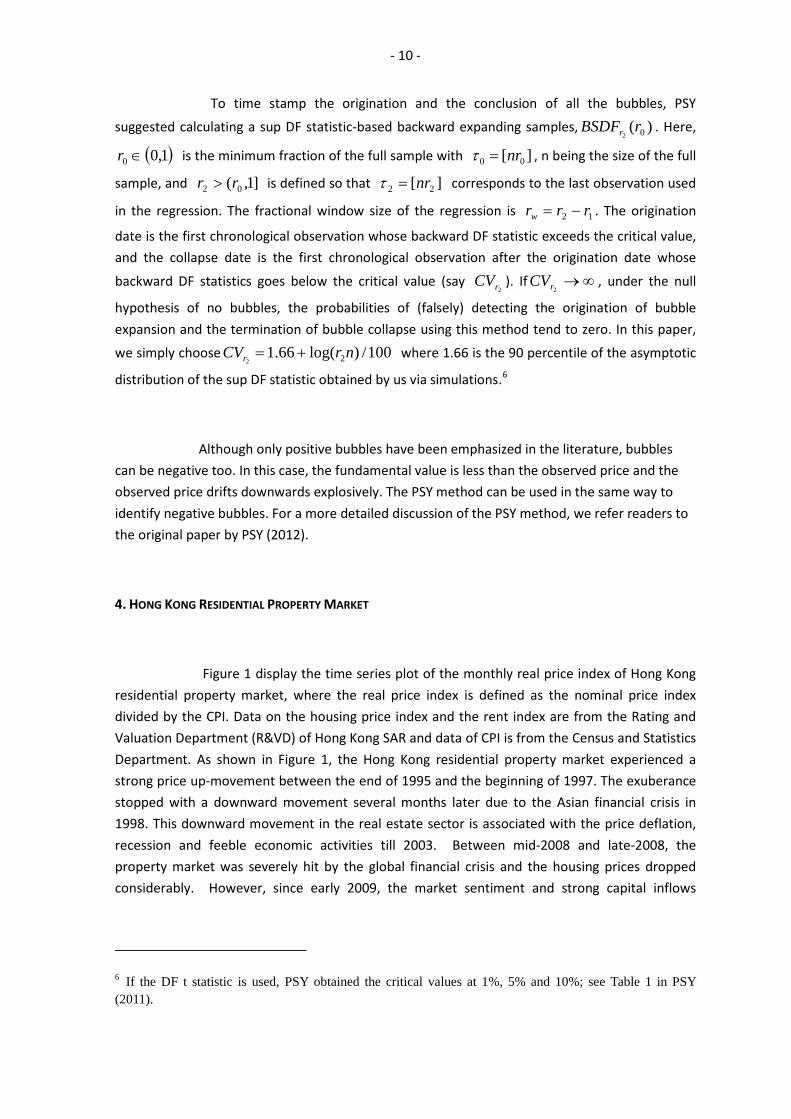
To time stamp the origination and the conclusion of all the bubbles, PSY
suggested calculating a sup DF statistic-based backward expanding samples, )( 02rBSDFr . Here,
( )1,00 ∈r is the minimum fraction of the full sample with ][ 00 nr=τ , n being the size of the full
sample, and ]1,( 02 rr > is defined so that ][ 22 nr=τ corresponds to the last observation used
in the regression. The fractional window size of the regression is 12 rrrw −= . The origination
date is the first chronological observation whose backward DF statistic exceeds the critical value, and the collapse date is the first chronological observation after the origination date whose
backward DF statistics goes below the critical value (say 2r
CV ). If ∞→2r
CV , under the null
hypothesis of no bubbles, the probabilities of (falsely) detecting the origination of bubble expansion and the termination of bubble collapse using this method tend to zero. In this paper,
we simply choose 100/)log(66.1 22nrCVr += where 1.66 is the 90 percentile of the asymptotic
distribution of the sup DF statistic obtained by us via simulations.6
Although only positive bubbles have been emphasized in the literature, bubbles can be negative too. In this case, the fundamental value is less than the observed price and the observed price drifts downwards explosively. The PSY method can be used in the same way to identify negative bubbles. For a more detailed discussion of the PSY method, we refer readers to the original paper by PSY (2012).
4. HONG KONG RESIDENTIAL PROPERTY MARKET
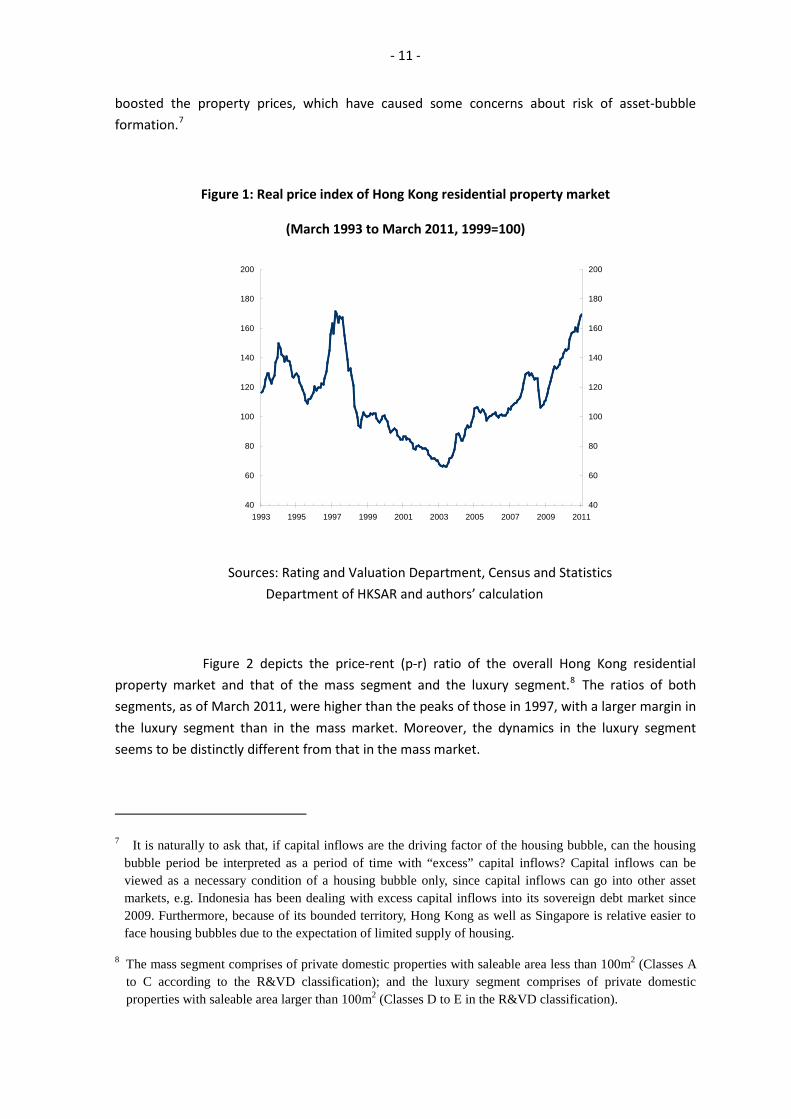
Figure 1 display the time series plot of the monthly real price index of Hong Kong residential property market, where the real price index is defined as the nominal price index divided by the CPI. Data on the housing price index and the rent index are from the Rating and Valuation Department (R&VD) of Hong Kong SAR and data of CPI is from the Census and Statistics Department. As shown in Figure 1, the Hong Kong residential property market experienced a strong price up-movement between the end of 1995 and the beginning of 1997. The exuberance stopped with a downward movement several months later due to the Asian financial crisis in 1998. This downward movement in the real estate sector is associated with the price deflation, recession and feeble economic activities till 2003. Between mid-2008 and late-2008, the property market was severely hit by the global financial crisis and the housing prices dropped considerably. However, since early 2009, the market sentiment and strong capital inflows
6 If the DF t statistic is used, PSY obtained the critical values at 1%, 5% and 10%; see Table 1 in PSY (2011).
- 11 -
boosted the property prices, which have caused some concerns about risk of asset-bubble formation.7
Figure 1: Real price index of Hong Kong residential property market
(March 1993 to March 2011, 1999=100)
40
60
80
100
120
140
160
180
200
1993 1995 1997 1999 2001 2003 2005 2007 2009 201140
60
80
100
120
140
160
180
200
Sources: Rating and Valuation Department, Census and Statistics Department of HKSAR and authors’ calculation
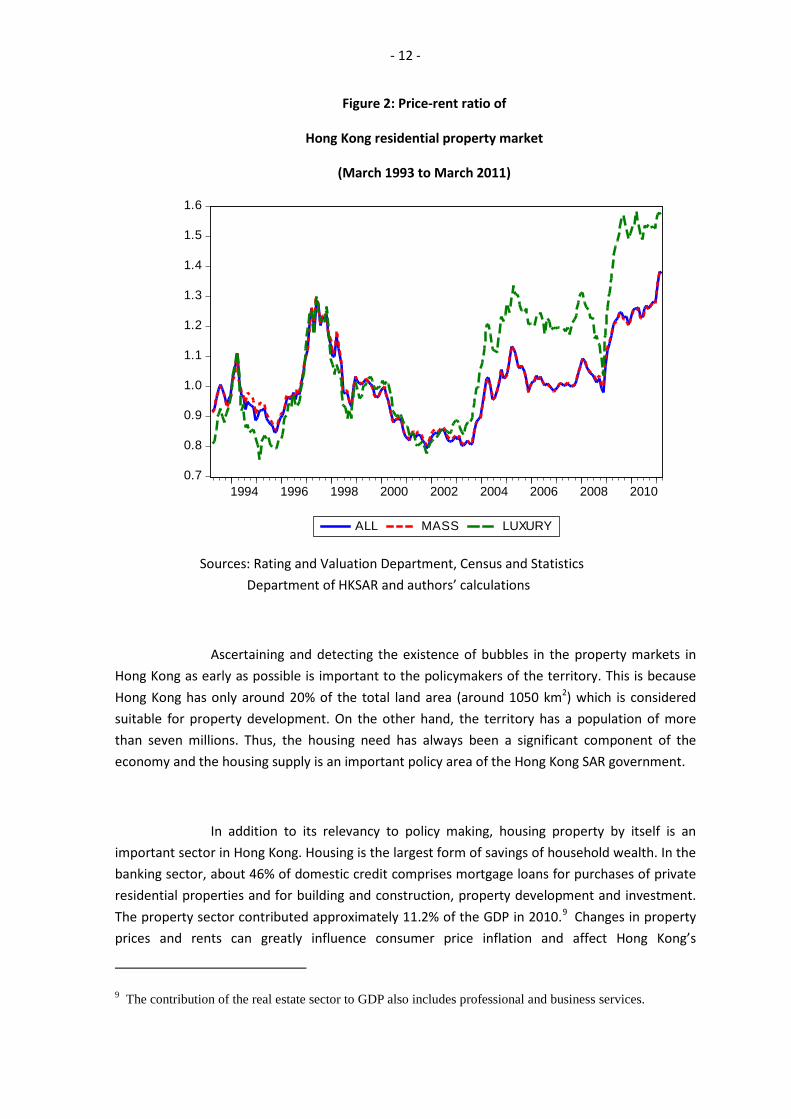
Figure 2 depicts the price-rent (p-r) ratio of the overall Hong Kong residential property market and that of the mass segment and the luxury segment.8 The ratios of both segments, as of March 2011, were higher than the peaks of those in 1997, with a larger margin in the luxury segment than in the mass market. Moreover, the dynamics in the luxury segment seems to be distinctly different from that in the mass market.
7 It is naturally to ask that, if capital inflows are the driving factor of the housing bubble, can the housing bubble period be interpreted as a period of time with “excess” capital inflows? Capital inflows can be viewed as a necessary condition of a housing bubble only, since capital inflows can go into other asset markets, e.g. Indonesia has been dealing with excess capital inflows into its sovereign debt market since 2009. Furthermore, because of its bounded territory, Hong Kong as well as Singapore is relative easier to face housing bubbles due to the expectation of limited supply of housing.
8 The mass segment comprises of private domestic properties with saleable area less than 100m2 (Classes A to C according to the R&VD classification); and the luxury segment comprises of private domestic properties with saleable area larger than 100m2 (Classes D to E in the R&VD classification).
- 12 -
Figure 2: Price-rent ratio of
Hong Kong residential property market
(March 1993 to March 2011)
0.7
0.8
0.9
1.0
1.1
1.2
1.3
1.4
1.5
1.6
1994 1996 1998 2000 2002 2004 2006 2008 2010
ALL MASS LUXURY
Sources: Rating and Valuation Department, Census and Statistics Department of HKSAR and authors’ calculations
Ascertaining and detecting the existence of bubbles in the property markets in Hong Kong as early as possible is important to the policymakers of the territory. This is because Hong Kong has only around 20% of the total land area (around 1050 km2) which is considered suitable for property development. On the other hand, the territory has a population of more than seven millions. Thus, the housing need has always been a significant component of the economy and the housing supply is an important policy area of the Hong Kong SAR government.
In addition to its relevancy to policy making, housing property by itself is an important sector in Hong Kong. Housing is the largest form of savings of household wealth. In the banking sector, about 46% of domestic credit comprises mortgage loans for purchases of private residential properties and for building and construction, property development and investment. The property sector contributed approximately 11.2% of the GDP in 2010.9 Changes in property prices and rents can greatly influence consumer price inflation and affect Hong Kong’s
9 The contribution of the real estate sector to GDP also includes professional and business services.
- 13 -
competitiveness. Lastly, land sales and stamp duties on property transaction accounted for more than 20% of total government revenue in FY2010/2011.
5. EMPIRICAL RESULTS
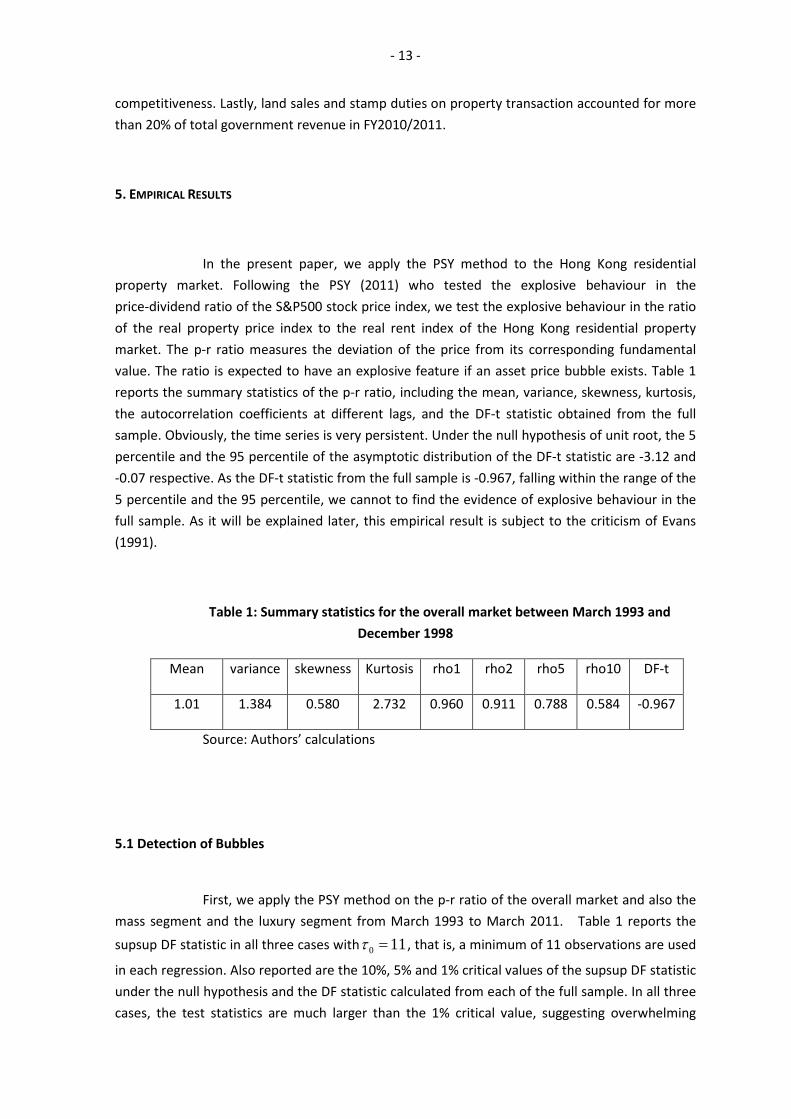
In the present paper, we apply the PSY method to the Hong Kong residential property market. Following the PSY (2011) who tested the explosive behaviour in the price-dividend ratio of the S&P500 stock price index, we test the explosive behaviour in the ratio of the real property price index to the real rent index of the Hong Kong residential property market. The p-r ratio measures the deviation of the price from its corresponding fundamental value. The ratio is expected to have an explosive feature if an asset price bubble exists. Table 1 reports the summary statistics of the p-r ratio, including the mean, variance, skewness, kurtosis, the autocorrelation coefficients at different lags, and the DF-t statistic obtained from the full sample. Obviously, the time series is very persistent. Under the null hypothesis of unit root, the 5 percentile and the 95 percentile of the asymptotic distribution of the DF-t statistic are -3.12 and -0.07 respective. As the DF-t statistic from the full sample is -0.967, falling within the range of the 5 percentile and the 95 percentile, we cannot to find the evidence of explosive behaviour in the full sample. As it will be explained later, this empirical result is subject to the criticism of Evans (1991).
Table 1: Summary statistics for the overall market between March 1993 and December 1998
Mean variance skewness Kurtosis rho1 rho2 rho5 rho10 DF-t
1.01 1.384 0.580 2.732 0.960 0.911 0.788 0.584 -0.967
Source: Authors’ calculations
5.1 Detection of Bubbles
First, we apply the PSY method on the p-r ratio of the overall market and also the mass segment and the luxury segment from March 1993 to March 2011. Table 1 reports the
supsup DF statistic in all three cases with 110 =τ , that is, a minimum of 11 observations are used
in each regression. Also reported are the 10%, 5% and 1% critical values of the supsup DF statistic under the null hypothesis and the DF statistic calculated from each of the full sample. In all three cases, the test statistics are much larger than the 1% critical value, suggesting overwhelming
- 14 -
evidence of bubbles in these three markets. Interestingly, the test statistic for the luxury segment is the lowest, although the largest margin between the price and the rent was observed in the luxury segment. This difference occurs because our test statistic depends on the dynamic property of the gap, not on the level of the gap. However, if one simply applies the standard unit root test to the full samples, he will not be able to identify a bubble in the overall market and the mass market at the 5% level (the 95 percentile of the asymptotic distribution of the DF coefficient statistic is -0.13). This clearly indicates the weakness of the standard unit root test for detecting the presence of bubbles when bubbles are subject to crash.
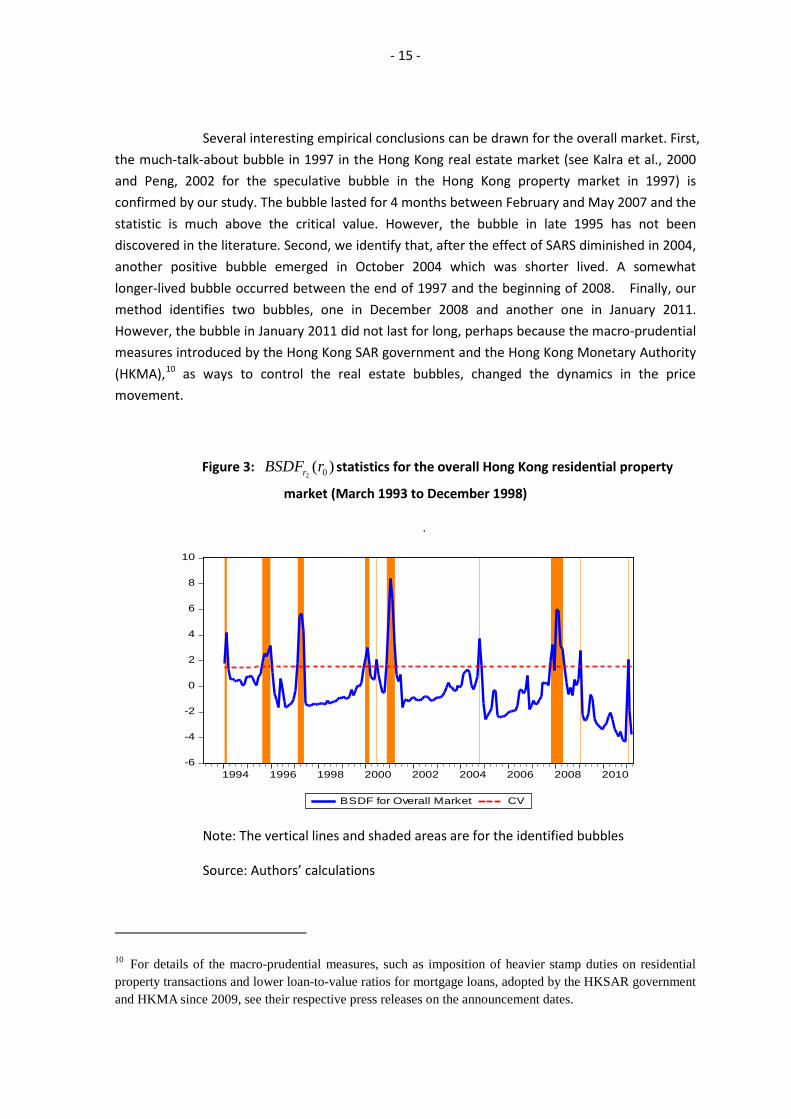
5.2 Time Stamping Bubbles in the Overall Market
To locate specific bubble periods in the overall market, we compare the BSDF
statistics with a critical sequence. Figure 3 plots the )( 02rBSDFr statistics against
100/)log(66.1 22nrCVr += for the overall market. The vertical lines and shaded areas are for
the identified bubbles. In total, the PSY method has found 10 bubbles. The identified periods with a positive or negative bubble include 1994M01-M02, 1995M08-M12, 1997M02-M05, 1999M12-2000M02, 2000M06, 2000M11-2001M03, 2004M10, 2007M10-2008M04, 2009M01 and 2011M01. Among these bubble episodes, two periods involve negative bubbles, namely,
2000M06 and 2000M11-2001M03. The largest )( 02rBSDFr , when there is a positive bubble,
occurred in January 2008, with a value of 5.985. The size of the bubble in 1997 is similar with the test statistic of 5.675. Note that since the PSY method is based on recursive regressions, the estimation of the bubble origination and conclusion dates is conducted in real time although the full sample of data is available. The real time feature of the PSY method makes it appealing to policy makers for the purpose of early warning detection.
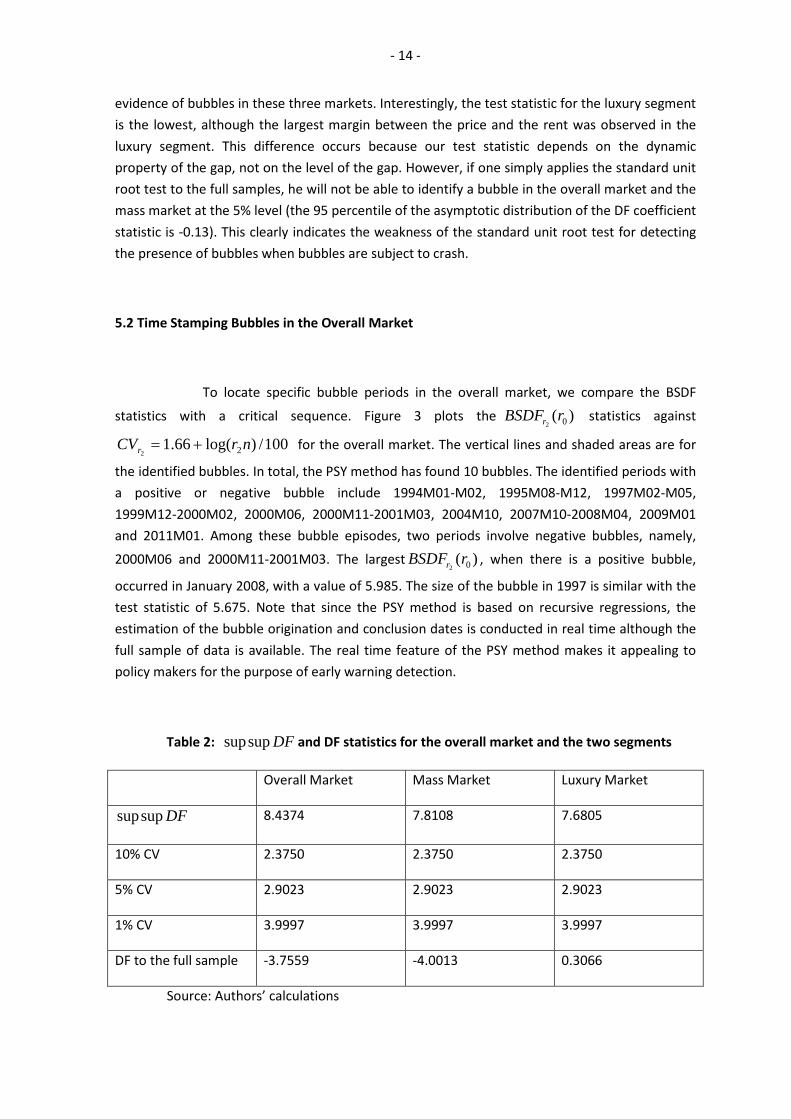
Table 2: DFsupsup and DF statistics for the overall market and the two segments
Overall Market Mass Market Luxury Market
DFsupsup 8.4374 7.8108 7.6805
10% CV 2.3750 2.3750 2.3750
5% CV 2.9023 2.9023 2.9023
1% CV 3.9997 3.9997 3.9997
DF to the full sample -3.7559 -4.0013 0.3066
Source: Authors’ calculations
- 15 -
Several interesting empirical conclusions can be drawn for the overall market. First, the much-talk-about bubble in 1997 in the Hong Kong real estate market (see Kalra et al., 2000 and Peng, 2002 for the speculative bubble in the Hong Kong property market in 1997) is confirmed by our study. The bubble lasted for 4 months between February and May 2007 and the statistic is much above the critical value. However, the bubble in late 1995 has not been discovered in the literature. Second, we identify that, after the effect of SARS diminished in 2004, another positive bubble emerged in October 2004 which was shorter lived. A somewhat longer-lived bubble occurred between the end of 1997 and the beginning of 2008. Finally, our method identifies two bubbles, one in December 2008 and another one in January 2011. However, the bubble in January 2011 did not last for long, perhaps because the macro-prudential measures introduced by the Hong Kong SAR government and the Hong Kong Monetary Authority (HKMA),10 as ways to control the real estate bubbles, changed the dynamics in the price movement.
Figure 3: )( 02rBSDFr statistics for the overall Hong Kong residential property
market (March 1993 to December 1998)
.
-6
-4
-2
0
2
4
6
8
10
1994 1996 1998 2000 2002 2004 2006 2008 2010
BSDF for Overall Market CV
Note: The vertical lines and shaded areas are for the identified bubbles
Source: Authors’ calculations
10 For details of the macro-prudential measures, such as imposition of heavier stamp duties on residential property transactions and lower loan-to-value ratios for mortgage loans, adopted by the HKSAR government and HKMA since 2009, see their respective press releases on the announcement dates.
- 16 -
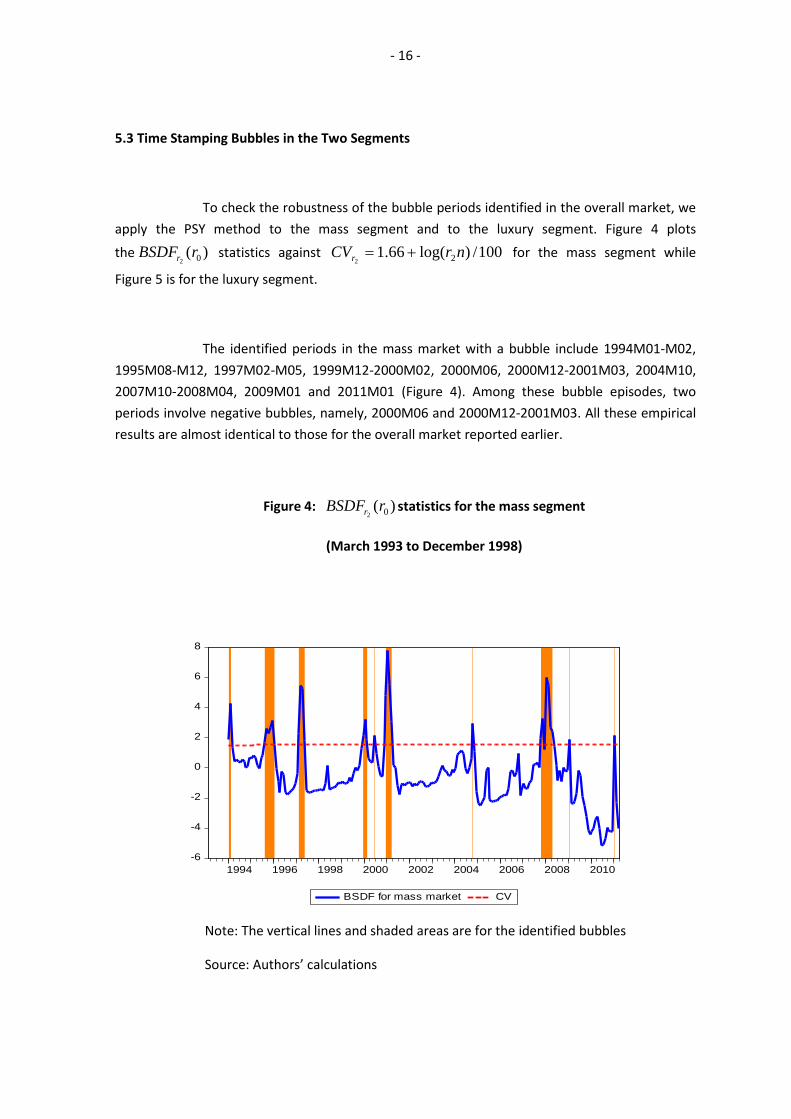
5.3 Time Stamping Bubbles in the Two Segments
To check the robustness of the bubble periods identified in the overall market, we apply the PSY method to the mass segment and to the luxury segment. Figure 4 plots
the )( 02rBSDFr statistics against 100/)log(66.1 22
nrCVr += for the mass segment while
Figure 5 is for the luxury segment.
The identified periods in the mass market with a bubble include 1994M01-M02, 1995M08-M12, 1997M02-M05, 1999M12-2000M02, 2000M06, 2000M12-2001M03, 2004M10, 2007M10-2008M04, 2009M01 and 2011M01 (Figure 4). Among these bubble episodes, two periods involve negative bubbles, namely, 2000M06 and 2000M12-2001M03. All these empirical results are almost identical to those for the overall market reported earlier.
Figure 4: )( 02rBSDFr statistics for the mass segment
(March 1993 to December 1998)
-6
-4
-2
0
2
4
6
8
1994 1996 1998 2000 2002 2004 2006 2008 2010
BSDF for mass market CV
Note: The vertical lines and shaded areas are for the identified bubbles
Source: Authors’ calculations
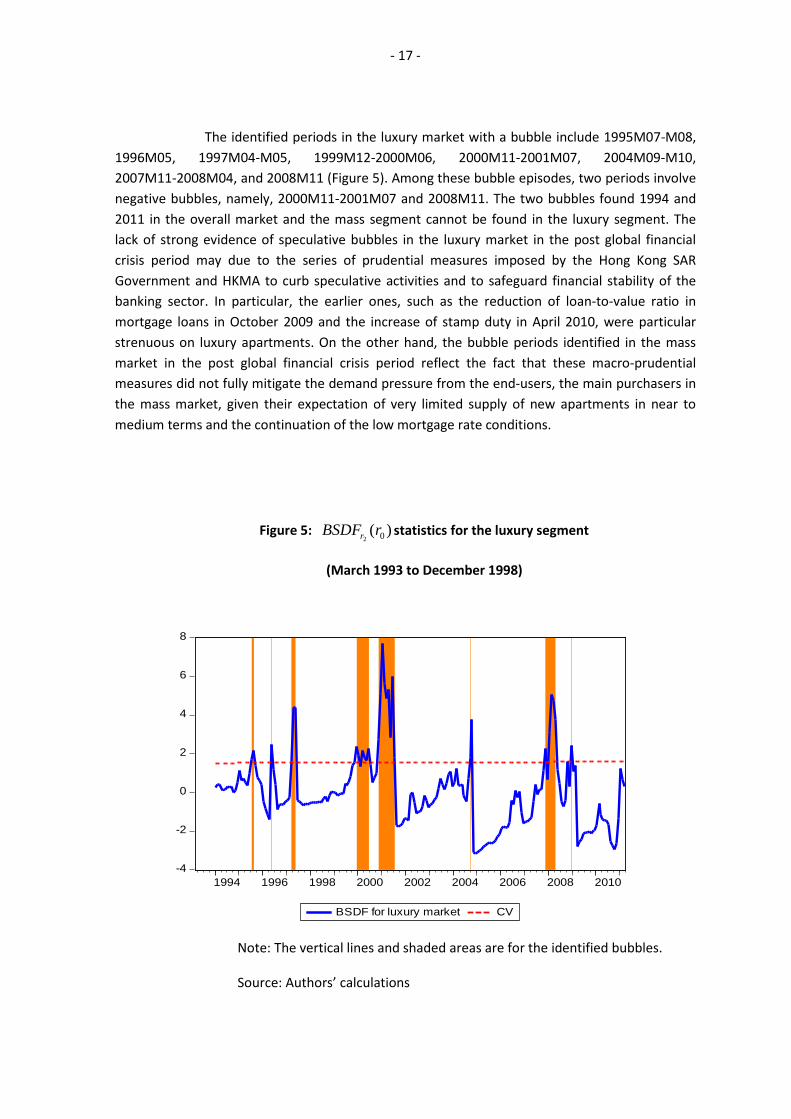
- 17 -
The identified periods in the luxury market with a bubble include 1995M07-M08, 1996M05, 1997M04-M05, 1999M12-2000M06, 2000M11-2001M07, 2004M09-M10, 2007M11-2008M04, and 2008M11 (Figure 5). Among these bubble episodes, two periods involve negative bubbles, namely, 2000M11-2001M07 and 2008M11. The two bubbles found 1994 and 2011 in the overall market and the mass segment cannot be found in the luxury segment. The lack of strong evidence of speculative bubbles in the luxury market in the post global financial crisis period may due to the series of prudential measures imposed by the Hong Kong SAR Government and HKMA to curb speculative activities and to safeguard financial stability of the banking sector. In particular, the earlier ones, such as the reduction of loan-to-value ratio in mortgage loans in October 2009 and the increase of stamp duty in April 2010, were particular strenuous on luxury apartments. On the other hand, the bubble periods identified in the mass market in the post global financial crisis period reflect the fact that these macro-prudential measures did not fully mitigate the demand pressure from the end-users, the main purchasers in the mass market, given their expectation of very limited supply of new apartments in near to medium terms and the continuation of the low mortgage rate conditions.
Figure 5: )( 02rBSDFr statistics for the luxury segment
(March 1993 to December 1998)
-4
-2
0
2
4
6
8
1994 1996 1998 2000 2002 2004 2006 2008 2010
BSDF for luxury market CV
Note: The vertical lines and shaded areas are for the identified bubbles.
Source: Authors’ calculations
- 18 -
The empirical results from the PSY method indicate the possibility of existence of two hidden states in the Hong Kong property market—the normal state versus the speculative bubble state. Speculative bubbles arise because of uncertainties surrounding the assessment of fundamental prices and there may exist profit opportunities to explore. For many investors, the Hong Kong property market is considered to be inefficient. Prices do not reflect well all relevant information, because Hong Kong has limited land supply due to its city state and because the land supply is mainly controlled by the government. The above empirical results reveal that, to certain extent, the Hong Kong property market can become irrational.11 Furthermore, our results show that the macro-prudential measures adopted by the government and HKMA may only be able to temporarily alter investors’ expectation on profit opportunity. This empirical result is consistent with that from a recent IMF study on the effectiveness of macro-prudential measures in the Hong Kong property market.12
6. CONCLUSION
We have applied the newly developed PSY method for identifying asset price bubbles in the Hong Kong residential property market. The method identifies the well-known real estate bubble in 1997. In addition, it identifies nine other bubbles between 1994 and 2011, including two periods with a negative bubble. In the pre- and post-2008 global financial crisis periods, the PSY method is able to detect two positive bubbles in the overall market and the mass segment, one in early 2008 and another one in 2011. However, both bubbles are very short lived. For the luxury segment we cannot identify any positive bubble in 2011. These results suggest that the recent bubble in the Hong Kong real estate market comes primarily from the mass segment under the demand pressure of end-users and the imposition of various macro-prudential policies by the Hong Kong SAR government and HKMA were perhaps effective in changing the dynamics of the price movement, particularly in the luxury segment.
11 Xiao and Liu (2010) investigate whether the residential market of Hong Kong is rational or irrational and their results do not provide strong evidence to exclude the existence of irrationality.
12 Details can be found in Ahuja and Nabor (2011).
- 19 -
REFERENCES
Ahuja, A., L. Cheung, H. Genberg, N. Porter and W. Zhang, 2010, “Are house prices rising too fast in China?”, HKMA Working Paper 08/2010.Ahuja, A. and M. Nabar, 2011, “Safeguarding banks and containing property booms: cross-country evidence on macro-prudential policies and lessons from Hong Kong SAR”, IMF Working Paper, WP/11/284.
Ahuja, A., N. Porter, 2010, “Are house prices rising too fast in Hong Kong?”, IMF Working Paper, WP/10/273.
Arshanapalli, B. and W. Nelson, 2008, “A co-integration test to verify the housing bubble”, The International Journal of Business and Finance Research, 2, No. 2, pp. 35-43.
Blanchard, O. J. 1979. “Speculative bubbles, crashes and rational expectations,” Economics Letters, 3, pp. 387-389.
Blanchard, O. and Watson, M. (1982), “Bubbles, Rational Expectations, and Financial Markets”, in Paul Wachter (ed.) Crises in the Economic and Financial Structure, Lexington, MA: Lexington Books, pp. 295 – 315.
Campbell, J. and R. Shiller, 1987, “Co-integration and tests of present value models”, Journal of Political Economy, 95, pp. 1062-1088.
Chan L., H. Ng and R. Ramchand, 2012, “A cluster analysis approach to examining Singapore’s property market”, BIS Paper No.64, pp. 43-53.
Chang K., N. Chen and C. Leung (2011a), “The dynamics of housing returns in Singapore: How important are the international transmission mechanisms?” Regional Science and Urban Economics, forthcoming.
Chang K., N. Chen and C. Leung (2011b), “In the shadow of the United States: The international transmission effect of asset returns”, Pacific Economic Review, forthcoming.
Chen, K. (2001), “Asset price fluctuations in Taiwan: Evidence from stock and real estate prices during 1972-1992”, Journal of Asian Economics, 12, pp. 215-232.
Craig, R.S. and C. Hua, 2011, “Determinants of property prices in Hong Kong SAR: Implications for policy”, IMF Working Paper, WP/11/277.
Diba, B. and H. Grossman, 1988, “Explosive rational bubbles in stock prices”, American Economic Review, 78, pp. 520-530.
Drake, L., 1993, “Modelling UK house prices using co-integration: An application of the Johansen technique”, Applied Economics, 25, pp. 1225-1228.
- 20 -
Driffill, J. and M. Sola (1998), “Intrinsic bubbles and regime-switching”, Journal of Monetary Economics, 42, pp. 351-385.
Evans, G., 1991, “Pitfalls in testing for explosive bubbles in asset prices”, American Economic Review, 81, pp. 922-930.
Gilbert, C., 2010, “Speculative influences on commodity futures prices 2006-08”, United Nations Conference on Trade and Development, Discussion Paper No. 197.
Glindro, El, T. Subhanij, J. Szeto and H. Zhu (2008), “Determinants of house prices in nine Asia-Pacific economies”, BIS Paper No.52, pp. 340-370.
Gurkaynak, R., 2008, “Econometric tests of asset price bubbles: taking stock”, Journal of Economic Surveys, 22, pp. 166-186.
Homm U. and Breitung, J., 2012, “Testing for Speculative Bubbles in Stock Markets: A Comparison of Alternative Methods”, Journal of Financial Econometrics, 10, 198 - 231.
Kalra, S., D. Mihaljek, and Duenwald, C. 2000, “Property prices and speculative bubbles: Evidence from Hong Kong SAR”, Working Paper No. WP/00/2, International Monetary Fund.
Leung, C. (2004), “Macroeconomics and housing: A review of the literature”, Journal of Housing Economics, 13, pp. 249-267.
Leung, F., K. Chow and H. Genberg, 2008, “Long-term and short-term determinants of property prices in Hong Kong”, HKMA Working Paper 15/2008.
Mikhed, V. and P. Zemcik, 2009, “Testing for bubbles in housing markets: A panel data approach”, Journal of Real Estate Finance and Economics, 38, pp. 366-386.
Montrucchio, L. and F. Privileggi (2001), “On fragility of bubbles in equilibrium asset pricing models of Lucas-type”, Journal of Economic Theory, 101, pp. 158-188.
Peng, W., 2002, “What drives the property price in Hong Kong”, Hong Kong Monetary Authority, Quarterly Bulletin, August 2002, pp. 19-33.
Phillips, P.C.B., S. Shi, and Yu, J., 2011, “Testing for multiple bubbles”. Singapore Management University, Unpublished Manuscript.
Phillips, P.C.B., Y. Wu and J. Yu, 2011, “Explosive Behaviour in the 1990s NASDAQ: When did exuberance escalate asset values?” International Economic Review, 52, pp. 201-226.
Phillips, P.C.B., and Yu, J., 2009, “Limit theory for dating the origination and collapse of mildly explosive periods in time series data”. Singapore Management University, Unpublished Manuscript.
- 21 -
Phillips, P.C.B., and Yu, J., 2011, “Dating the timeline of financial bubbles during the subprime crisis”, Quantitative Economics, 2, 455-491.
Shiller, R., 1981, “Do stock prices move too much to be justified by subsequent changes in dividends?” American Economic Review, 71, pp. 421-436.
Tsai, I. and C. Peng, 2011, “Bubbles in the Taiwan housing market: The determinants and effects”, Habitat International, 35, pp.379-390.
West, K., 1987, “A specification test for speculative bubbles”, The Quarterly Journal of Economics, 102, pp. 553-580.
Xiao, Q., and Y. Liu, 2010, “The residential market of Hong Kong: rational or irrational?”, Applied Economics, 42:7, pp. 923-933.