detailed assessment of air quality along a281, shalford
TRANSCRIPT
Detailed Assessment of
Air Quality along A281,
Shalford for Guildford
Borough Council
February 2019
Page 199

Detailed Assessment of Air Quality A281, Shalford, Guildford
Air Quality Consultants Ltd 23 Coldharbour Road, Bristol BS6 7JT Tel: 0117 974 1086 119 Marylebone Road, London NW1 5PU Tel: 020 3873 4780 [email protected]
Registered Office: 23 Coldharbour Road, Bristol BS6 7JT Companies House Registration No: 2814570
Document Control
Client Guildford Borough Council Principal Contact Gary Durrant
Report Prepared By: Reuben Sadler and Dr Clare Beattie
Document Status and Review Schedule
Report No. Date Status Reviewed by
J3353A/1/D2 12 February 2019 Draft Chris Whall (Managing Director)
This report has been prepared by Air Quality Consultants Ltd on behalf of the Client, taking into account the agreed scope of works.
Unless otherwise agreed, this document and all other Intellectual Property Rights remain the property of Air Quality Consultants
Ltd.
In preparing this report, Air Quality Consultants Ltd has exercised all reasonable skill and care, taking into account the objectives
and the agreed scope of works. Air Quality Consultants Ltd does not accept any liability in negligence for any matters arising
outside of the agreed scope of works. The Company operates a formal Quality Management System, which is certified to ISO
9001:2015, and a formal Environmental Management System, certified to ISO 14001:2015.
When issued in electronic format, Air Quality Consultants Ltd does not accept any responsibility for any unauthorised changes
made by others.
When printed by Air Quality Consultants Ltd, this report will be on Evolve Office, 100% Recycled paper.
Job Number J3353
Page 200
Detailed Assessment of Air Quality A281, Shalford, Guildford
J3353 1 of 28 February 2019
Contents
1 Introduction ....................................................................................................... 3
2 Assessment Methodology ................................................................................. 6
3 Results .............................................................................................................. 9
4 Source Apportionment ..................................................................................... 13
5 Conclusions and Recommendations ............................................................... 18
6 References ...................................................................................................... 19
7 Glossary .......................................................................................................... 20
8 Appendices ..................................................................................................... 21
A1 Dispersion Modelling Methodology .................................................................. 22
A2 Adjustment of Short-Term 2018 Data to 2017 Annual Mean ............................ 27
A3 Contour ........................................................................................................... 28
Tables
Table 1: Estimated Annual Mean Background Pollutant Concentrations in 2017 (µg/m3) a
8
Table 2: Summary of Nitrogen Dioxide (NO2) Monitoring (2016-2018) a, b ....................... 9
Table 3: Modelled Annual Mean Nitrogen Dioxide Concentrations at Specific Receptors in 2017 ............................................................................................................ 10
Table 4: Improvement in Annual Mean Nitrogen Dioxide Concentrations and Nitrogen Oxides Concentrations Required in 2017 to Meet the Objective ...................... 12
Table 5: Contributions of Different Sources to Total Predicted Annual Mean Nitrogen Dioxide Concentrations (µg/m3) in 2017 .......................................................... 14
Table 6: Percentage Contributions of Different Sources to Total Predicted Annual Mean Nitrogen Dioxide Concentrations in 2017 ........................................................ 16
Table A1.1: Summary of Traffic Data used in the Assessment (AADT Flows) a ............ 22
Table A2.1: Data used to Adjust Short-term Monitoring Data from SH2 to 2017 Annual Mean Equivalent ............................................................................................. 27
Figures
Figure 1: Monitoring Locations ......................................................................................... 6
Figure 2: Receptor Locations ........................................................................................... 7
Figure 3: Recommended AQMA .................................................................................... 11
Figure 4: Contributions of Different Sources to Total Predicted Annual Mean Nitrogen Dioxide Concentration (µg/m3) at Each Receptor in 2017 ................................ 15
Page 201

Detailed Assessment of Air Quality A281, Shalford, Guildford
J3353 2 of 28 February 2019
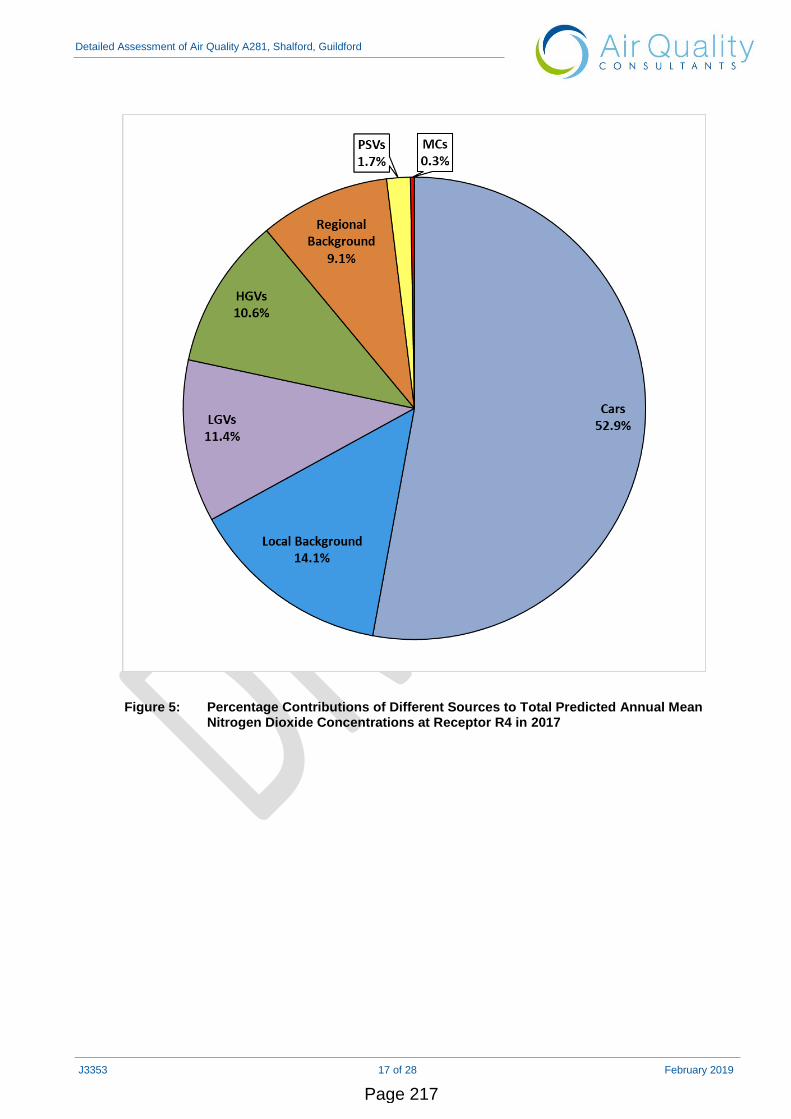
Figure 5: Percentage Contributions of Different Sources to Total Predicted Annual Mean Nitrogen Dioxide Concentrations at Receptor R4 in 2017 ................................ 17
Figure A1.1: Modelled Road Network ........................................................................... 23
Figure A1.2: Comparison of Measured Road NOx to Unadjusted Modelled Road NOx Concentrations. The dashed lines show ± 25%. ............................................. 25
Figure A1.3: Comparison of Measured Total NO2 to Final Adjusted Modelled Total NO2 Concentrations. The dashed lines show ± 25%. ............................................. 25
Figure A3.1: Predicted Annual Mean Nitrogen Dioxide Concentration .......................... 28
Guildford Borough Council confirms that it accepts the recommendations made in this report.
Page 202

Detailed Assessment of Air Quality A281, Shalford, Guildford
J3353 3 of 28 February 2019
1 Introduction
1.1 Air Quality Consultants Ltd has been commissioned by Guildford Borough Council to undertake a
Detailed Assessment of air quality along The Street (A281) in Shalford. Measurements in 2018
between January and September indicate that the annual mean nitrogen dioxide objective may be
exceeded along this road. Guildford Borough Council has thus decided to undertake a Detailed
Assessment of air quality within Shalford.
1.2 The aim of this Detailed Assessment is to determine whether the annual mean nitrogen dioxide
objective is exceeded at relevant locations and, if so, the extent of exceedances and thus the
boundary of the Air Quality Management Area (AQMA) required.
Background
1.3 The Air Quality Strategy (Defra, 2007) published by the Department for Environment, Food, and
Rural Affairs (Defra) and Devolved Administrations, provides the policy framework for air quality
management and assessment in the UK. It provides air quality standards and objectives for key air
pollutants, which are designed to protect human health and the environment. It also sets out how
the different sectors: industry, transport and local government, can contribute to achieving the air
quality objectives. Local authorities are seen to play a particularly important role. The strategy
describes the Local Air Quality Management (LAQM) regime that has been established, whereby
every authority has to carry out regular reviews and assessments of air quality in its area to identify
whether the objectives have been, or will be, achieved at relevant locations, by the applicable date.
If this is not the case, the authority must declare an Air Quality Management Area (AQMA), and
prepare an action plan which identifies appropriate measures that will be introduced in pursuit of
the objectives.
1.4 Technical Guidance for LAQM (LAQM.TG16) (Defra, 2018a) sets out a streamlined approach to
the Review and Assessment process. This prescribes the submission of a single Annual Status
Report (ASR) which all local authorities in England must submit each year. It should identify new
non-compliant areas and report progress made within existing AQMA’s. When an exceedance has
been identified, the local authority can either use the “Fast Track Option” and immediately declare
an AQMA, or obtain further information and/or data before deciding on the declaration of an
AQMA. The latter approach is being treated as a ‘Detailed Assessment’ for the purposes of this
report1.
1.5 The purpose of this Detailed Assessment is to determine whether an exceedance of an air quality
objective is likely and the geographical extent of that exceedance, which will determine the extent
1 Detailed Assessments were part of the previous approach to LAQM, but they are no longer required in current
TG16 guidance.
Page 203

Detailed Assessment of Air Quality A281, Shalford, Guildford
J3353 4 of 28 February 2019
of the AQMA that has to be declared. Subsequent to the declaration of an AQMA, an Air Quality
Action Plan (AQAP) should ideally be prepared within one year and approved by Defra. The
AQAP will identify measures to improve local air quality and to achieve the air quality objectives. In
order to inform the Action Plan process, source apportionment should be undertaken to ascertain
the sources contributing the exceedances, and the magnitude of reduction in emissions required to
achieve the objective should also be calculated.
1.6 Guildford Borough Council’s 2017 ASR found no exceedances within Shalford in 2016; however,
monitoring was only carried out at one site, and only between June and December.
Concentrations at this location were close to the objective. Monitoring was undertaken at an
additional site in 2018, and concentrations measured at both sites in 2018 between January and
September indicate that exceedances of the objective are likely. This report represents a Detailed
Assessment, following these findings.
The Air Quality Objectives
1.7 The Government’s Air Quality Strategy (Defra, 2007) provides air quality standards and objectives
for key air pollutants, which are designed to protect human health and the environment. The
‘standards’ are set as concentrations below which health effects are unlikely even in sensitive
population groups, or below which risks to public health would be exceedingly small. They are
based purely upon the scientific and medical evidence of the effects of a particular pollutant. The
‘objectives’ set out the extent to which the Government expects the standards to be achieved by a
certain date. They take account of the costs, benefits, feasibility and practicality of achieving the
standards. It also sets out how the different sectors: industry, transport and local government, can
contribute to achieving the air quality objectives. The objectives are prescribed within The Air
Quality (England) Regulations 2000 (2000) and The Air Quality (England) (Amendment)
Regulations 2002 (2002). Table 1 summarises the objectives which are relevant to this report.
Studies have shown associations of nitrogen dioxide in outdoor air with adverse health effects;
respiratory and cardiovascular morbidity and mortality.
Page 204
Detailed Assessment of Air Quality A281, Shalford, Guildford
J3353 5 of 28 February 2019
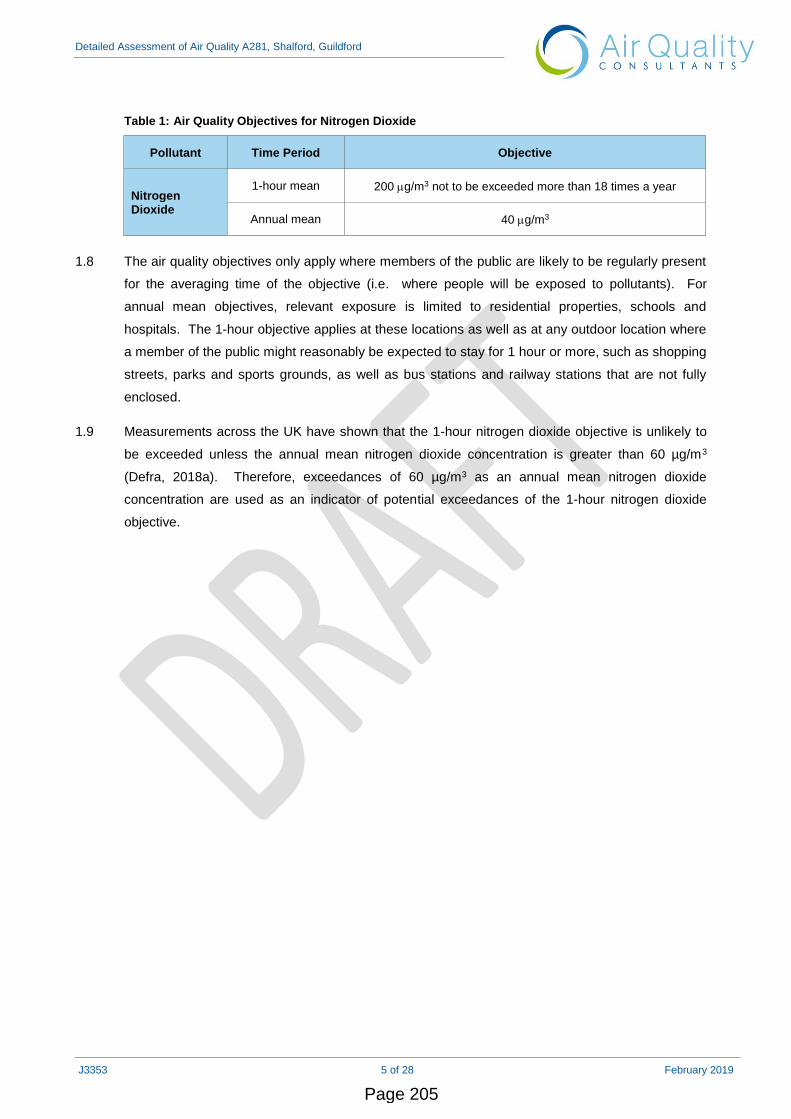
Table 1: Air Quality Objectives for Nitrogen Dioxide
Pollutant Time Period Objective
Nitrogen Dioxide
1-hour mean 200 g/m3 not to be exceeded more than 18 times a year
Annual mean 40 g/m3
1.8 The air quality objectives only apply where members of the public are likely to be regularly present
for the averaging time of the objective (i.e. where people will be exposed to pollutants). For
annual mean objectives, relevant exposure is limited to residential properties, schools and
hospitals. The 1-hour objective applies at these locations as well as at any outdoor location where
a member of the public might reasonably be expected to stay for 1 hour or more, such as shopping
streets, parks and sports grounds, as well as bus stations and railway stations that are not fully
enclosed.
1.9 Measurements across the UK have shown that the 1-hour nitrogen dioxide objective is unlikely to
be exceeded unless the annual mean nitrogen dioxide concentration is greater than 60 µg/m3
(Defra, 2018a). Therefore, exceedances of 60 µg/m3 as an annual mean nitrogen dioxide
concentration are used as an indicator of potential exceedances of the 1-hour nitrogen dioxide
objective.
Page 205
Detailed Assessment of Air Quality A281, Shalford, Guildford
J3353 6 of 28 February 2019
2 Assessment Methodology
Monitoring
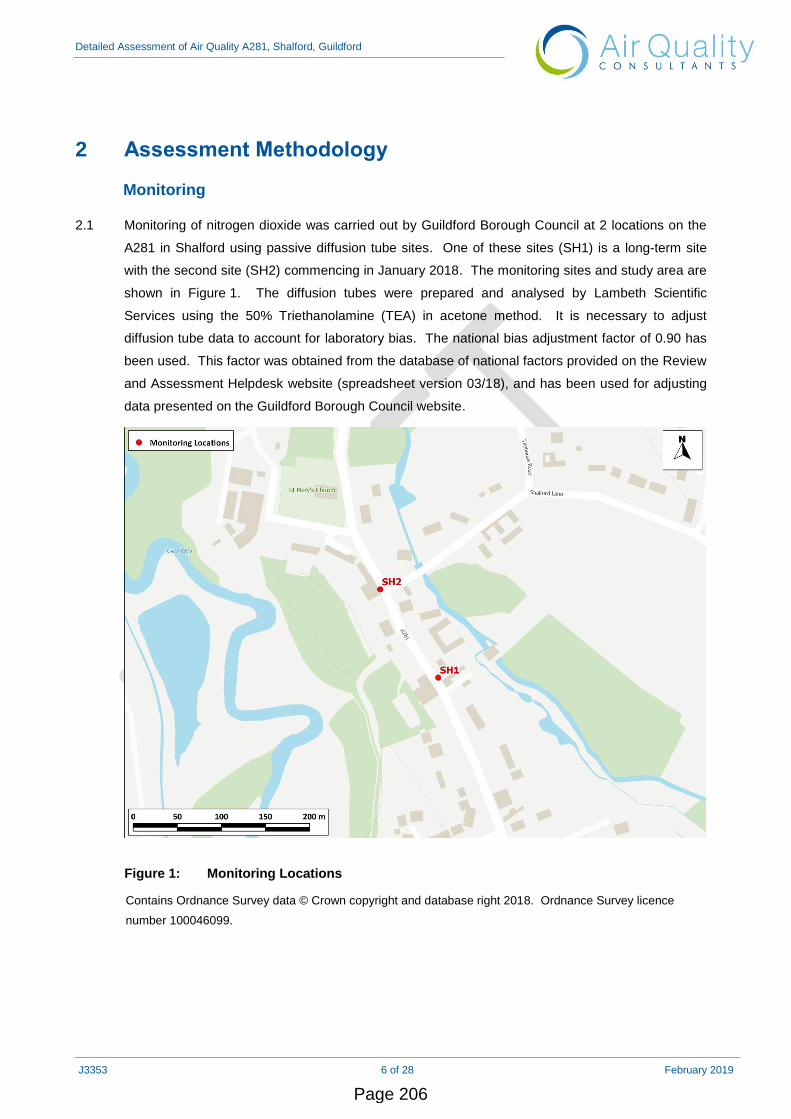
2.1 Monitoring of nitrogen dioxide was carried out by Guildford Borough Council at 2 locations on the
A281 in Shalford using passive diffusion tube sites. One of these sites (SH1) is a long-term site
with the second site (SH2) commencing in January 2018. The monitoring sites and study area are
shown in Figure 1. The diffusion tubes were prepared and analysed by Lambeth Scientific
Services using the 50% Triethanolamine (TEA) in acetone method. It is necessary to adjust
diffusion tube data to account for laboratory bias. The national bias adjustment factor of 0.90 has
been used. This factor was obtained from the database of national factors provided on the Review
and Assessment Helpdesk website (spreadsheet version 03/18), and has been used for adjusting
data presented on the Guildford Borough Council website.
Figure 1: Monitoring Locations
Contains Ordnance Survey data © Crown copyright and database right 2018. Ordnance Survey licence
number 100046099.
Page 206

Detailed Assessment of Air Quality A281, Shalford, Guildford
J3353 7 of 28 February 2019
Modelling
2.2 Annual mean nitrogen dioxide concentrations have been predicted using detailed dispersion
modelling (ADMS-Roads v4.1). The input data used are described in Appendix A1. The model
outputs have been verified against data from the SH1 and SH2 diffusion tube monitoring sites; the
2018 SH2 monitoring data have been annualised to 2017 to be used in verification. Further details
of model verification are supplied in Appendix A1.
2.3 Concentrations have been predicted at 14 specific receptors (modelled at 1.5 m, with the exception
of receptor R11 which was modelled at the first floor height of 4 m) as shown in Figure 2.
Receptors have been chosen to represent worst-case locations, in particular locations close to
narrow sections of roads and in areas where dispersion is limited by buildings.
Figure 2: Receptor Locations
Contains Ordnance Survey data © Crown copyright and database right 2018. Ordnance Survey licence
number 100046099.
National Background Pollution Maps
2.4 The 2017 nitrogen dioxide background concentrations across the study area have been defined
using the national pollution maps published by Defra (Defra, 2017). These cover the whole country
Page 207

Detailed Assessment of Air Quality A281, Shalford, Guildford
J3353 8 of 28 February 2019
on a 1x1 grid. The backgrounds used within the detailed assessment are provided in Table 1. The
derivation of background concentrations is described in Appendix A1.
Table 1: Estimated Annual Mean Background Pollutant Concentrations in 2017 (µg/m3) a
Year NO2
2017 10.6-11.2
Objectives 40
a The range of values is for the different 1x1 km grid squares covering the study area.
Uncertainty
2.5 Uncertainty is inherent in all measured and modelled data. All values presented in this report are
the best possible estimates, but uncertainties in the results might cause over- or under-predictions.
The model results rely on traffic data and any uncertainties inherent in these data will carry into this
assessment. There will be additional uncertainties introduced because the modelling has
simplified real-world processes into a series of algorithms. For example: it has been assumed that
wind conditions measured at Farnborough meteorological station during 2017 will have occurred
throughout the study area during 2017; and it has been assumed that the dispersion of emitted
pollutants will conform to a Gaussian distribution over flat terrain. An important step in the
assessment is verifying the dispersion model against the measured data. Because the model has
been verified and adjusted, there can be reasonable confidence in the prediction of current year
(2017) concentrations.
2.6 The limitations to the assessment should be borne in mind when considering the results set out in
the following sections. While the model should give an overall accurate picture, i.e. one without
bias, there will be uncertainties for individual receptors. The results are ‘best estimates’ and have
been treated as such in the discussion.
Page 208
Detailed Assessment of Air Quality A281, Shalford, Guildford
J3353 9 of 28 February 2019
3 Results
Monitoring
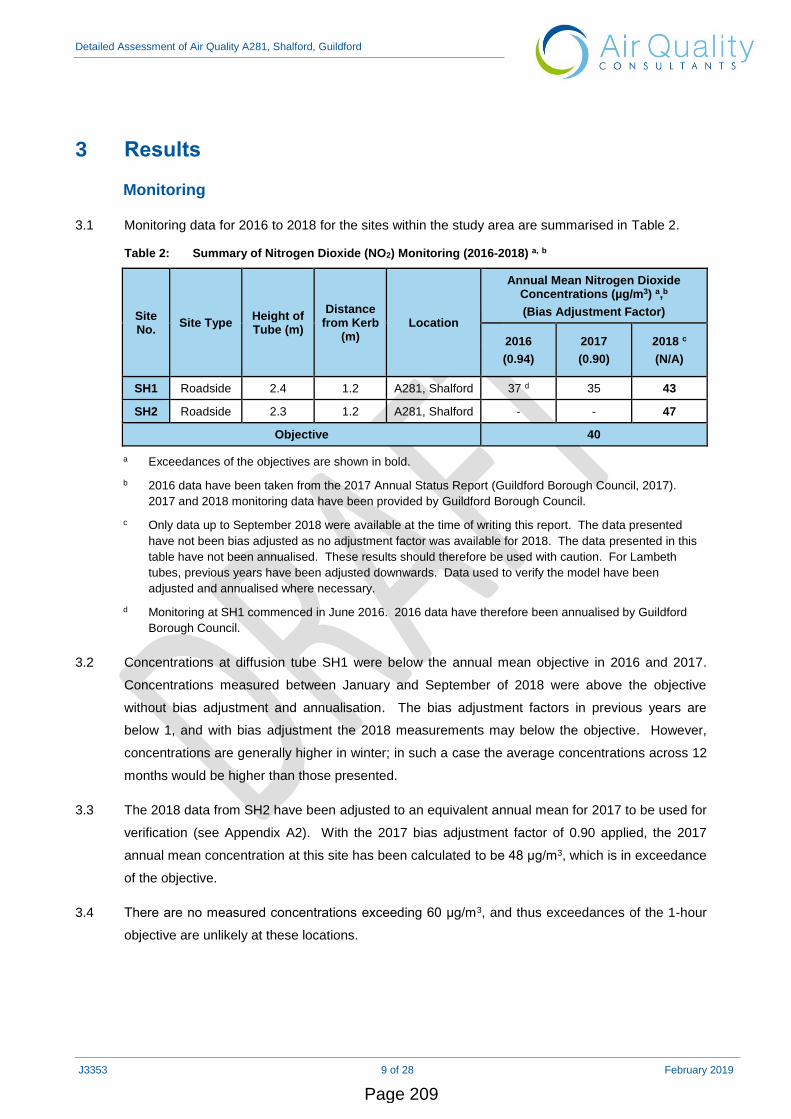
3.1 Monitoring data for 2016 to 2018 for the sites within the study area are summarised in Table 2.
Table 2: Summary of Nitrogen Dioxide (NO2) Monitoring (2016-2018) a, b
Site No.
Site Type Height of Tube (m)
Distance from Kerb
(m) Location
Annual Mean Nitrogen Dioxide Concentrations (µg/m3) a,b
(Bias Adjustment Factor)
2016
(0.94)
2017
(0.90)
2018 c
(N/A)
SH1 Roadside 2.4 1.2 A281, Shalford 37 d 35 43
SH2 Roadside 2.3 1.2 A281, Shalford - - 47
Objective 40
a Exceedances of the objectives are shown in bold.
b 2016 data have been taken from the 2017 Annual Status Report (Guildford Borough Council, 2017).
2017 and 2018 monitoring data have been provided by Guildford Borough Council.
c Only data up to September 2018 were available at the time of writing this report. The data presented
have not been bias adjusted as no adjustment factor was available for 2018. The data presented in this
table have not been annualised. These results should therefore be used with caution. For Lambeth
tubes, previous years have been adjusted downwards. Data used to verify the model have been
adjusted and annualised where necessary.
d Monitoring at SH1 commenced in June 2016. 2016 data have therefore been annualised by Guildford
Borough Council.
3.2 Concentrations at diffusion tube SH1 were below the annual mean objective in 2016 and 2017.
Concentrations measured between January and September of 2018 were above the objective
without bias adjustment and annualisation. The bias adjustment factors in previous years are
below 1, and with bias adjustment the 2018 measurements may below the objective. However,
concentrations are generally higher in winter; in such a case the average concentrations across 12
months would be higher than those presented.
3.3 The 2018 data from SH2 have been adjusted to an equivalent annual mean for 2017 to be used for
verification (see Appendix A2). With the 2017 bias adjustment factor of 0.90 applied, the 2017
annual mean concentration at this site has been calculated to be 48 μg/m3, which is in exceedance
of the objective.
3.4 There are no measured concentrations exceeding 60 μg/m3, and thus exceedances of the 1-hour
objective are unlikely at these locations.
Page 209
Detailed Assessment of Air Quality A281, Shalford, Guildford
J3353 10 of 28 February 2019
Modelling
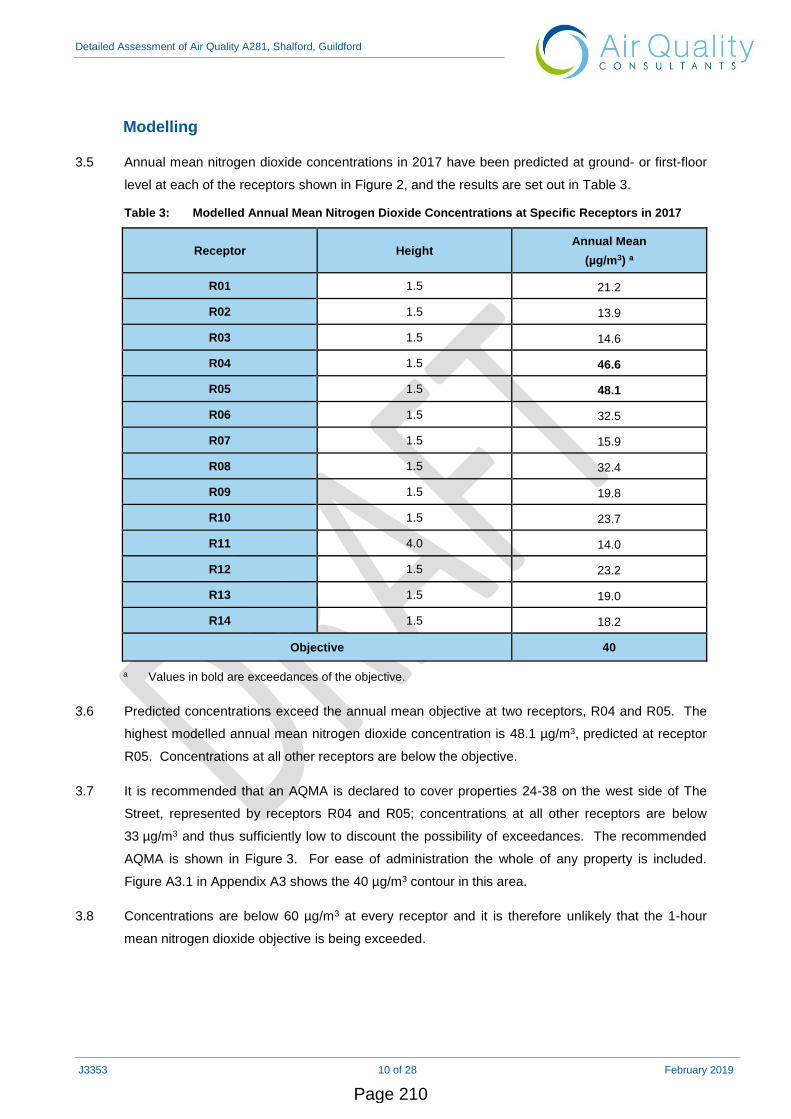
3.5 Annual mean nitrogen dioxide concentrations in 2017 have been predicted at ground- or first-floor
level at each of the receptors shown in Figure 2, and the results are set out in Table 3.
Table 3: Modelled Annual Mean Nitrogen Dioxide Concentrations at Specific Receptors in 2017
Receptor Height Annual Mean
(µg/m3) a
R01 1.5 21.2
R02 1.5 13.9
R03 1.5 14.6
R04 1.5 46.6
R05 1.5 48.1
R06 1.5 32.5
R07 1.5 15.9
R08 1.5 32.4
R09 1.5 19.8
R10 1.5 23.7
R11 4.0 14.0
R12 1.5 23.2
R13 1.5 19.0
R14 1.5 18.2
Objective 40
a Values in bold are exceedances of the objective.
3.6 Predicted concentrations exceed the annual mean objective at two receptors, R04 and R05. The
highest modelled annual mean nitrogen dioxide concentration is 48.1 µg/m3, predicted at receptor
R05. Concentrations at all other receptors are below the objective.
3.7 It is recommended that an AQMA is declared to cover properties 24-38 on the west side of The
Street, represented by receptors R04 and R05; concentrations at all other receptors are below
33 µg/m3 and thus sufficiently low to discount the possibility of exceedances. The recommended
AQMA is shown in Figure 3. For ease of administration the whole of any property is included.
Figure A3.1 in Appendix A3 shows the 40 µg/m3 contour in this area.
3.8 Concentrations are below 60 µg/m3 at every receptor and it is therefore unlikely that the 1-hour
mean nitrogen dioxide objective is being exceeded.
Page 210

Detailed Assessment of Air Quality A281, Shalford, Guildford
J3353 11 of 28 February 2019
Figure 3: Recommended AQMA
Imagery ©2019 Google.
Population Exposure
3.9 Objective exceedances are predicted at eight residential properties. Assuming that each property
has, on average, two occupants, this equates to approximately 16 residents.
Air Quality Improvements Required
3.10 The degree of improvement needed in order for the annual mean nitrogen dioxide objective to be
achieved is defined by the difference between the highest measured or predicted concentration
and the objective level (40 μg/m3).
3.11 In terms of describing the reduction in emissions required, it is more useful to consider nitrogen
oxides (NOx). The required reduction in local nitrogen oxides emission has been calculated in line
with guidance presented in LAQM.TG16 (Defra, 2018a). Table 4 sets out the required reduction in
local emissions of NOx that would be required at each of the receptor locations where an
exceedance is predicted, in order for the annual mean objective to be achieved.
3.12 The highest nitrogen dioxide concentration has been predicted at receptor R05 (48.1 μg/m3),
requiring a reduction of 8.1 μg/m3 in order for the objective to be achieved. Table 4 shows that at
Page 211

Detailed Assessment of Air Quality A281, Shalford, Guildford
J3353 12 of 28 February 2019
this location a reduction of 19.7 µg/m3 in NOx emissions would be required in order to achieve the
objective. This equates to a reduction of 25.0% in local road traffic emissions at this receptor
location.
Table 4: Improvements in Annual Mean Nitrogen Dioxide Concentrations and Nitrogen Oxides Concentrations Required in 2017 to Meet the Objective
Receptor
Required reduction in annual mean nitrogen dioxide (NO2)
Required reduction in road nitrogen oxides (NOx) emissions
µg/m3 % of total predicted NO2
µg/m3 % reduction in road NOx
R04 6.6 14.1 15.9 21.1
R05 8.1 16.9 19.7 25.0
Page 212

Detailed Assessment of Air Quality A281, Shalford, Guildford
J3353 13 of 28 February 2019
4 Source Apportionment
4.1 In order to develop appropriate measures to improve air quality along the A281 in Shalford and
inform the action plan, it is necessary to identify the sources contributing to the objective
exceedances within the study area. Source apportioned nitrogen dioxide concentrations have
been calculated. The different proportions have been calculated in-line with guidance provided in
LAQM.TG16 (Defra, 2018a).
4.2 The following categories have been included in the source apportionment:
• Regional background;
• Local background;
• Cars;
• Lights Good Vehicles (LGV);
• Buses (PSVs);
• Heavy Goods Vehicles (HGVs); and
• Motorcycles (MCs).
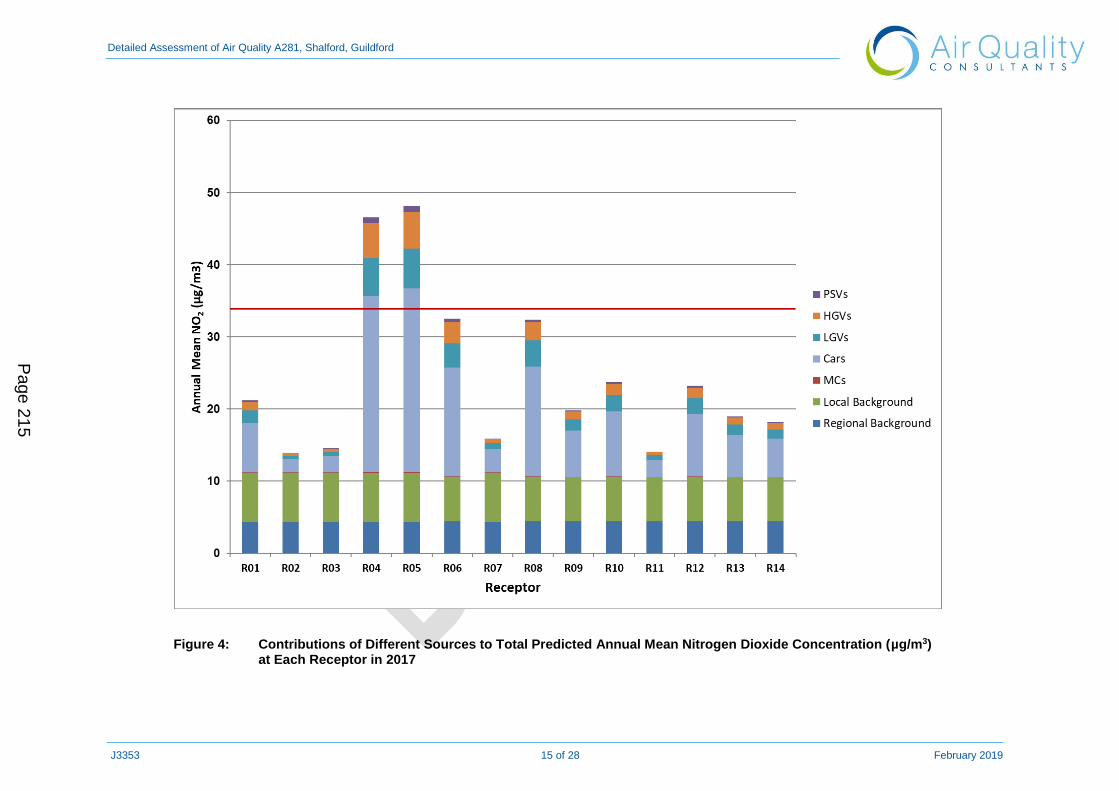
4.3 Table 5 and Figure 4 show the contribution from each of the different categories to total predicted
annual mean nitrogen dioxide concentrations at each of the receptors assessed.
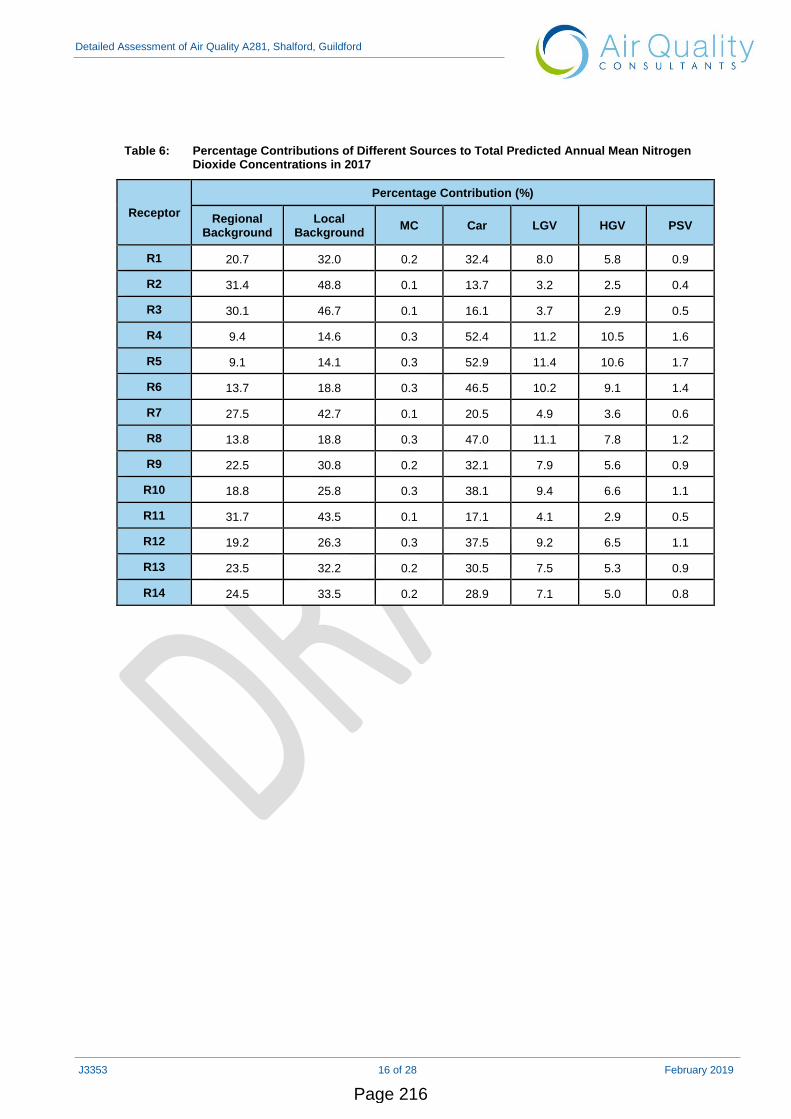
4.4 Table 6 and Figure 5 show the percentage contributions of each category to total predicted annual
mean nitrogen dioxide concentrations. At the majority of receptors, including those where
exceedances are predicted, emissions from cars contribute the largest proportion to the overall
concentration (13.7-52.9%). Local background concentrations (14.1-48.8%), regional background
concentrations (9.1-31.7%), and emissions from LGVs (3.2-11.4%) and HGVs (2.5-10.6%) also
contribute significant proportions to the overall concentrations.
Page 213

Detailed Assessment of Air Quality A281, Shalford, Guildford
J3353 14 of 28 February 2019
Table 5: Contributions of Different Sources to Total Predicted Annual Mean Nitrogen Dioxide Concentrations (µg/m3) in 2017
Receptor
Annual Mean Contribution (µg/m3)
Regional Background
Local Background
MC Car LGV HGV PSV
R01 4.4 6.8 0.1 6.9 1.7 1.2 0.2
R02 4.4 6.8 0.0 1.9 0.4 0.3 0.1
R03 4.4 6.8 0.0 2.3 0.5 0.4 0.1
R04 4.4 6.8 0.1 24.4 5.2 4.9 0.8
R05 4.4 6.8 0.1 25.4 5.5 5.1 0.8
R06 4.5 6.1 0.1 15.1 3.3 3.0 0.5
R07 4.4 6.8 0.0 3.3 0.8 0.6 0.1
R08 4.5 6.1 0.1 15.2 3.6 2.5 0.4
R09 4.5 6.1 0.0 6.4 1.6 1.1 0.2
R10 4.5 6.1 0.1 9.0 2.2 1.6 0.3
R11 4.5 6.1 0.0 2.4 0.6 0.4 0.1
R12 4.5 6.1 0.1 8.7 2.1 1.5 0.2
R13 4.5 6.1 0.0 5.8 1.4 1.0 0.2
R14 4.5 6.1 0.0 5.3 1.3 0.9 0.1
Objective 40
Page 214
Detailed Assessment of Air Quality A281, Shalford, Guildford
J3353 15 of 28 February 2019
Figure 4: Contributions of Different Sources to Total Predicted Annual Mean Nitrogen Dioxide Concentration (µg/m3) at Each Receptor in 2017
Page 215
Detailed Assessment of Air Quality A281, Shalford, Guildford
J3353 16 of 28 February 2019
Table 6: Percentage Contributions of Different Sources to Total Predicted Annual Mean Nitrogen Dioxide Concentrations in 2017
Receptor
Percentage Contribution (%)
Regional Background
Local Background
MC Car LGV HGV PSV
R1 20.7 32.0 0.2 32.4 8.0 5.8 0.9
R2 31.4 48.8 0.1 13.7 3.2 2.5 0.4
R3 30.1 46.7 0.1 16.1 3.7 2.9 0.5
R4 9.4 14.6 0.3 52.4 11.2 10.5 1.6
R5 9.1 14.1 0.3 52.9 11.4 10.6 1.7
R6 13.7 18.8 0.3 46.5 10.2 9.1 1.4
R7 27.5 42.7 0.1 20.5 4.9 3.6 0.6
R8 13.8 18.8 0.3 47.0 11.1 7.8 1.2
R9 22.5 30.8 0.2 32.1 7.9 5.6 0.9
R10 18.8 25.8 0.3 38.1 9.4 6.6 1.1
R11 31.7 43.5 0.1 17.1 4.1 2.9 0.5
R12 19.2 26.3 0.3 37.5 9.2 6.5 1.1
R13 23.5 32.2 0.2 30.5 7.5 5.3 0.9
R14 24.5 33.5 0.2 28.9 7.1 5.0 0.8
Page 216
Detailed Assessment of Air Quality A281, Shalford, Guildford
J3353 17 of 28 February 2019
Figure 5: Percentage Contributions of Different Sources to Total Predicted Annual Mean Nitrogen Dioxide Concentrations at Receptor R4 in 2017
Page 217

Detailed Assessment of Air Quality A281, Shalford, Guildford
J3353 18 of 28 February 2019
5 Conclusions and Recommendations
5.1 A Detailed Assessment has been carried out for nitrogen dioxide along the A281 in Guildford. This
area was identified as being at risk of exceeding the annual mean air quality objective for nitrogen
dioxide based on local monitoring data in 2018.
5.2 The Detailed Assessment has been carried out using a combination of monitoring data and
modelled concentrations. Concentrations of nitrogen dioxide have been modelled for 2017 using
the ADMS-Roads dispersion model. The model has been verified against measurements made at
two nitrogen dioxide diffusion tube monitoring locations which lie adjacent to the road network
included in the model.
5.3 The assessment has identified that the annual mean nitrogen dioxide objective is being exceeded
at a small number of relevant locations alongside the A281. Concentrations are below 60 µg/m3 at
all locations and it is therefore unlikely that the 1-hour mean nitrogen dioxide objective is being
exceeded.
5.4 It is recommended that Guildford Borough Council declare an AQMA along the A281 for property
numbers 24-38, as shown in Figure 3. The modelled results reflect the monitoring which is
showing exceedances on the façade of a property at this location. It is also recommended that
Guilford Borough Council continues monitoring nitrogen dioxide at the existing locations.
5.5 Source apportionment of the local traffic emissions has been undertaken. This shows that in
locations where exceedances are predicted, emissions from cars on the A281 contribute the
largest proportion to the overall concentration. Local and regional backgrounds and emissions
from LGVs and HGVs also contribute significant proportions to the overall concentrations.
5.6 A reduction in traffic emissions along the A281 would result in a decrease in the concentrations of
nitrogen dioxide. Reductions in vehicle emissions from local traffic of up to 25.0% would be
required to achieve the annual mean nitrogen dioxide objective where the highest concentrations
are predicted to occur.
Page 218
Detailed Assessment of Air Quality A281, Shalford, Guildford
J3353 19 of 28 February 2019
6 References
AQC (2018) Calibrating Defra’s 2015-based Background NOx and NO2 Maps against
2016 and 2017 Measurements, Available:
http://www.aqconsultants.co.uk/AQC/media/Reports/Background-Calibration-News-F2.pdf.
Defra (2007) The Air Quality Strategy for England, Scotland, Wales and Northern Ireland,
Defra.
Defra (2017) Defra Air Quality Website, [Online], Available: http://laqm.defra.gov.uk/.
Defra (2018a) Review & Assessment: Technical Guidance LAQM.TG16 February 2018
Version, Defra, Available: https://laqm.defra.gov.uk/documents/LAQM-TG16-February-18-
v1.pdf.
Defra (2018b) Local Air Quality Management (LAQM) Support Website, Available:
http://laqm.defra.gov.uk/.
DfT (2017) DfT Automatic traffic Counters Table TRA0305-0307, Available:
https://www.gov.uk/government/statistical-data-sets/tra03-motor-vehicle-flow.
Guildford Borough Council (2017) 2017 Air Quality Annual Status Report.
The Air Quality (England) (Amendment) Regulations, 2002, Statutory Instrument 3043
(2002), HMSO.
The Air Quality (England) Regulations, 2000, Statutory Instrument 928 (2000), HMSO.
Page 219
Detailed Assessment of Air Quality A281, Shalford, Guildford
J3353 20 of 28 February 2019
7 Glossary
AADT Annual Average Daily Traffic
ADMS-Roads Atmospheric Dispersion Modelling System model for Roads
AQC Air Quality Consultants
AQMA Air Quality Management Area
Defra Department for Environment, Food and Rural Affairs
DfT Department for Transport
EFT Emission Factor Toolkit
Exceedance A period of time when the concentration of a pollutant is greater than the
appropriate air quality objective. This applies to specified locations with relevant
exposure
HMSO Her Majesty’s Stationery Office
HGV Heavy Goods Vehicle
kph Kilometres Per hour
LAQM Local Air Quality Management
LGV Light Goods Vehicles (<3.5 tonnes)
μg/m3 Microgrammes per cubic metre
MC Motorcycle
NO Nitric oxide
NO2 Nitrogen dioxide
NOx Nitrogen oxides (taken to be NO2 + NO)
Objectives A nationally defined set of health-based concentrations for nine pollutants, seven of
which are incorporated in Regulations, setting out the extent to which the
standards should be achieved by a defined date. There are also vegetation-based
objectives for sulphur dioxide and nitrogen oxides
PSV Public Service Vehicle
Standards A nationally defined set of concentrations for nine pollutants below which health
effects do not occur or are minimal
TEA Triethanolamine – used to absorb nitrogen dioxide
Page 220

Detailed Assessment of Air Quality A281, Shalford, Guildford
J3353 21 of 28 February 2019
8 Appendices
Page 221

Detailed Assessment of Air Quality A281, Shalford, Guildford
J3353 22 of 28 February 2019
A1 Dispersion Modelling Methodology
Model Inputs
Road Traffic
A1.1 Predictions have been carried out using the ADMS-Roads dispersion model (v4.1). The model
requires the user to provide various input data, including emissions from each section of road, and
the road characteristics (including road width, street canyon width, street canyon height and
porosity). Vehicle emissions have been calculated based on vehicle flow, composition and speed
data using the EFT (Version 8.0.1) published by Defra (2018b).
A1.2 Hourly sequential meteorological data from Farnborough for 2017 have been used in the model.
The Farnborough meteorological monitoring station is located approximately 16 km to the
northwest of the A281 study area. It is deemed to be the nearest monitoring station representative
of meteorological conditions in the study area; both the study area and the Farnborough
meteorological monitoring station are located in the south of England where they will be influenced
by the effects of inland meteorology.
A1.3 For the purposes of modelling it has been assumed that two sections of the A281 are within street
canyons formed by adjacent buildings and walls, the first between 24 and 31 The Street, and the
second along the length of The Seahorse pub. The dispersion of traffic emissions within street
canyons is reduced, which can lead to concentrations of pollutants being higher than they would
be in areas with greater dispersion. These sections have therefore been modelled as street
canyons using ADMS-Roads’ advanced canyon module, with appropriate input parameters
determined from local mapping and photographs.
A1.4 AADT flows, speeds and vehicle fleet composition data have been derived from a traffic survey
undertaken by Surrey County Council between 17 and 30 September 2018. The traffic data used
in this assessment are summarised in Table A1.1. Some traffic speeds have been adjusted from
those measured in the traffic survey based on professional judgement, taking into account the road
layout. Diurnal and monthly flow profiles for the traffic have been derived from the national profiles
published by DfT (2017).
Table A1.1: Summary of Traffic Data used in the Assessment (AADT Flows) a
Road Link AADT % Car % LGV % HGV % Bus/ Coach
% Motor Cycle
A281 22,474 89.1 6.7 2.6 0.2 1.3
A1.5 Figure A1.1 shows the road network and traffic speeds included within the model and defines the
study area.
Page 222

Detailed Assessment of Air Quality A281, Shalford, Guildford
J3353 23 of 28 February 2019
Figure A1.1: Modelled Road Network
Contains Ordnance Survey data © Crown copyright and database right 2018. Ordnance Survey licence
number 100046099.
Background Concentrations
A1.6 The background pollutant concentrations across the study area have been defined using the
national pollution maps published by Defra (2018b). These cover the whole country on a 1x1 km
grid and are published for each year from 2015 until 2030. The background maps for 2017 have
been calibrated against concurrent measurements from national monitoring sites (AQC, 2018).
A1.7 For the purposes of the source apportionment study the local and regional components of the
background concentrations have been derived using the methodology outlined in LAQM.TG16.
The local background NOx component was derived by total background NOx minus regional
background NOx (represented by rural column in background maps). The local and regional NOx
proportions were then used to apportion the total background NO2 concentrations.
Model Verification
A1.8 In order to ensure that ADMS-Roads accurately predicts local concentrations, it is necessary to
verify the model against local measurements.
Page 223
Detailed Assessment of Air Quality A281, Shalford, Guildford
J3353 24 of 28 February 2019
A1.9 Most nitrogen dioxide (NO2) is produced in the atmosphere by a reaction of nitric oxide (NO) with
ozone. It is therefore most appropriate to verify the model in terms of primary pollutant emissions
of nitrogen oxides (NOx = NO + NO2). The model has been run to predict the annual mean NOx
concentrations during 2017 at the SH1 and SH2 diffusion tube monitoring sites. Concentrations
have been modelled at 2.4 m and 2.3 m, the heights of the respective diffusion tubes.
A1.10 The model output of road-NOx (i.e. the component of total NOx coming from road traffic) has been
compared with the ‘measured’ road-NOx. Measured road-NOx has been calculated from the
measured NO2 concentrations and the predicted background NO2 concentration using the NOx
from NO2 calculator (Version 5.1) available on the Defra LAQM Support website (Defra, 2017).
Monitoring data from site SH2 were only available for January to September 2018, and these data
have been adjusted to a 2017 annual mean equivalent (see Section A2).
A1.11 An adjustment factor has been determined as the slope of the best-fit line between the ‘measured’
road contribution and the model derived road contribution, forced through zero (Figure A1.2). The
calculated adjustment factor of 1.0505 has been applied to the modelled road-NOx concentration
for each receptor to provide adjusted modelled road-NOx concentrations.
A1.12 The total nitrogen dioxide concentrations have then been determined by combining the adjusted
modelled road-NOx concentrations with the predicted background NO2 concentration within the
NOx to NO2 calculator. Figure A1.3 compares final adjusted modelled total NO2 at each of the
monitoring sites to measured total NO2, and shows a close agreement.
A1.13 The results imply that the model has under predicted the road-NOx contribution. This is a common
experience with this and most other road traffic emissions dispersion models.
Page 224

Detailed Assessment of Air Quality A281, Shalford, Guildford
J3353 25 of 28 February 2019
Figure A1.2: Comparison of Measured Road NOx to Unadjusted Modelled Road NOx Concentrations. The dashed lines show ± 25%.
Figure A1.3: Comparison of Measured Total NO2 to Final Adjusted Modelled Total NO2 Concentrations. The dashed lines show ± 25%.
Page 225
Detailed Assessment of Air Quality A281, Shalford, Guildford
J3353 26 of 28 February 2019
Model Post-processing
A1.14 The model predicts road-NOx concentrations at each receptor location. These concentrations have
been adjusted using the adjustment factor set out above, which, along with the background NO2,
has been processed through the NOx to NO2 calculator available on the Defra LAQM Support
website (Defra, 2017). The traffic mix within the calculator has been set to “All non-urban UK
traffic”, which is considered suitable for the study area. The calculator predicts the component of
NO2 based on the adjusted road-NOx and the background NO2.
Page 226

Detailed Assessment of Air Quality A281, Shalford, Guildford
J3353 27 of 28 February 2019
A2 Adjustment of Short-Term 2018 Data to 2017 Annual Mean
A2.1 The SH2 diffusion tube monitoring site was established at the beginning of January 2018. Data
have been provided by Guildford Borough Council for this site up to and including September
2018. In order to be used in the model verification these data have been adjusted to a 2017
annual mean equivalent based on the ratio of concentrations during the short-term monitoring
period (9 months; Jan – Sep 2018) to those over the 2017 calendar year at two background sites
operated as part of the Automatic Urban and Rural Network (AURN). This follows the guidance set
out in Box 7.9 of LAQM.TG16.
A2.2 The annual mean nitrogen dioxide concentrations and the period means for each of the two
monitoring sites from which adjustment factors have been calculated are presented in Table A2.1,
along with the Overall Factor.
Table A2.1: Data used to Adjust Short-term Monitoring Data from SH2 to 2017 Annual Mean Equivalent
Monitoring Site Period Mean Concentration (μg/m3) Adjustment
Factor Overall Factor 2017 Calendar
year Jan-Sep 2018 a
Reading New Town AURN 28.7 25.6 1.123 1.131
Hillingdon AURN 53.1 46.6 1.139
a Specifically 1 January 2018 to 30 September 2018.
Page 227
Detailed Assessment of Air Quality A281, Shalford, Guildford
J3353 28 of 28 February 2019
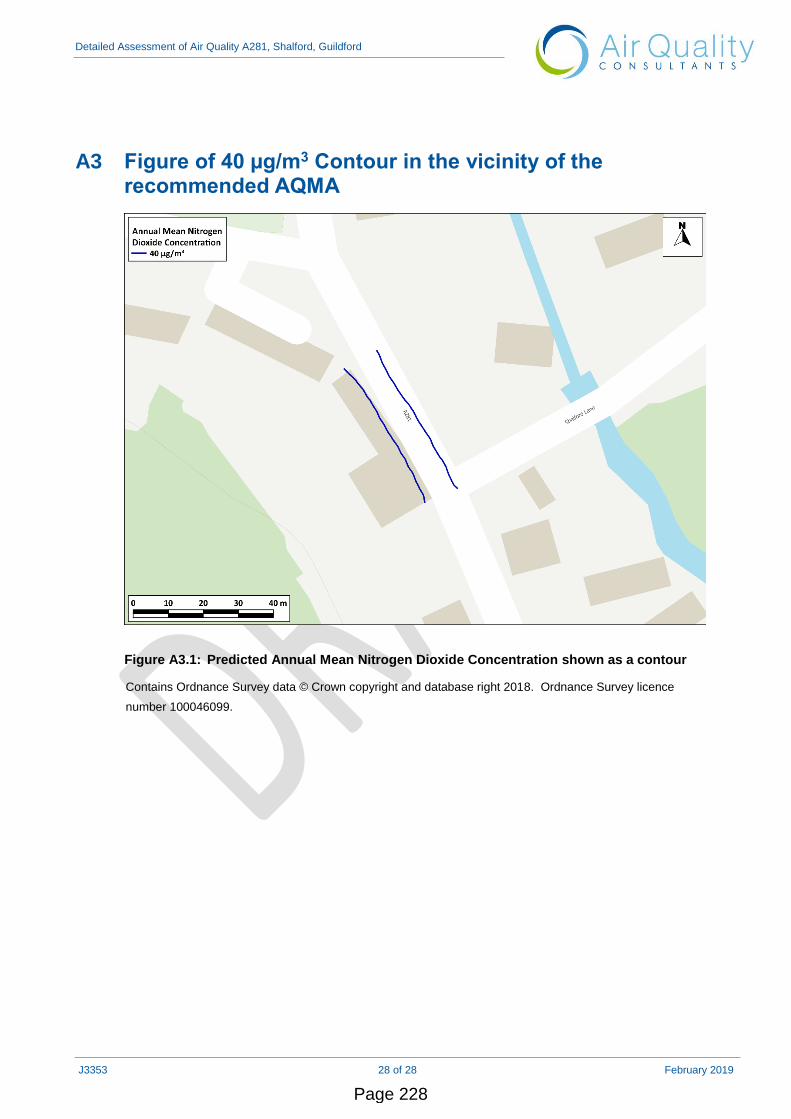
A3 Figure of 40 µg/m3 Contour in the vicinity of the recommended AQMA
Figure A3.1: Predicted Annual Mean Nitrogen Dioxide Concentration shown as a contour
Contains Ordnance Survey data © Crown copyright and database right 2018. Ordnance Survey licence
number 100046099.
Page 228