desperately seeking housing - microsoft · desperately seeking housing . ... s ppi ma a ta entucky...
TRANSCRIPT
Sti l l Houseless in Honolulu, 2016 BIA Hawaii
November 15, 2016
Dr. Carl Bonham Executive Director, UHERO
Desperately seeking Housing

November 15, 2016
Overview
Houseless in Honolulu is not new ‣ Home prices and rents have always been high. ‣ Production has always been cyclical. ‣ What is new?
UHERO.HAWAII.EDU ©2016

November 15, 2016
Overview
Houseless in Honolulu is not new ‣ Home prices and rents have always been high. ‣ Production has always been cyclical. ‣ What is new?
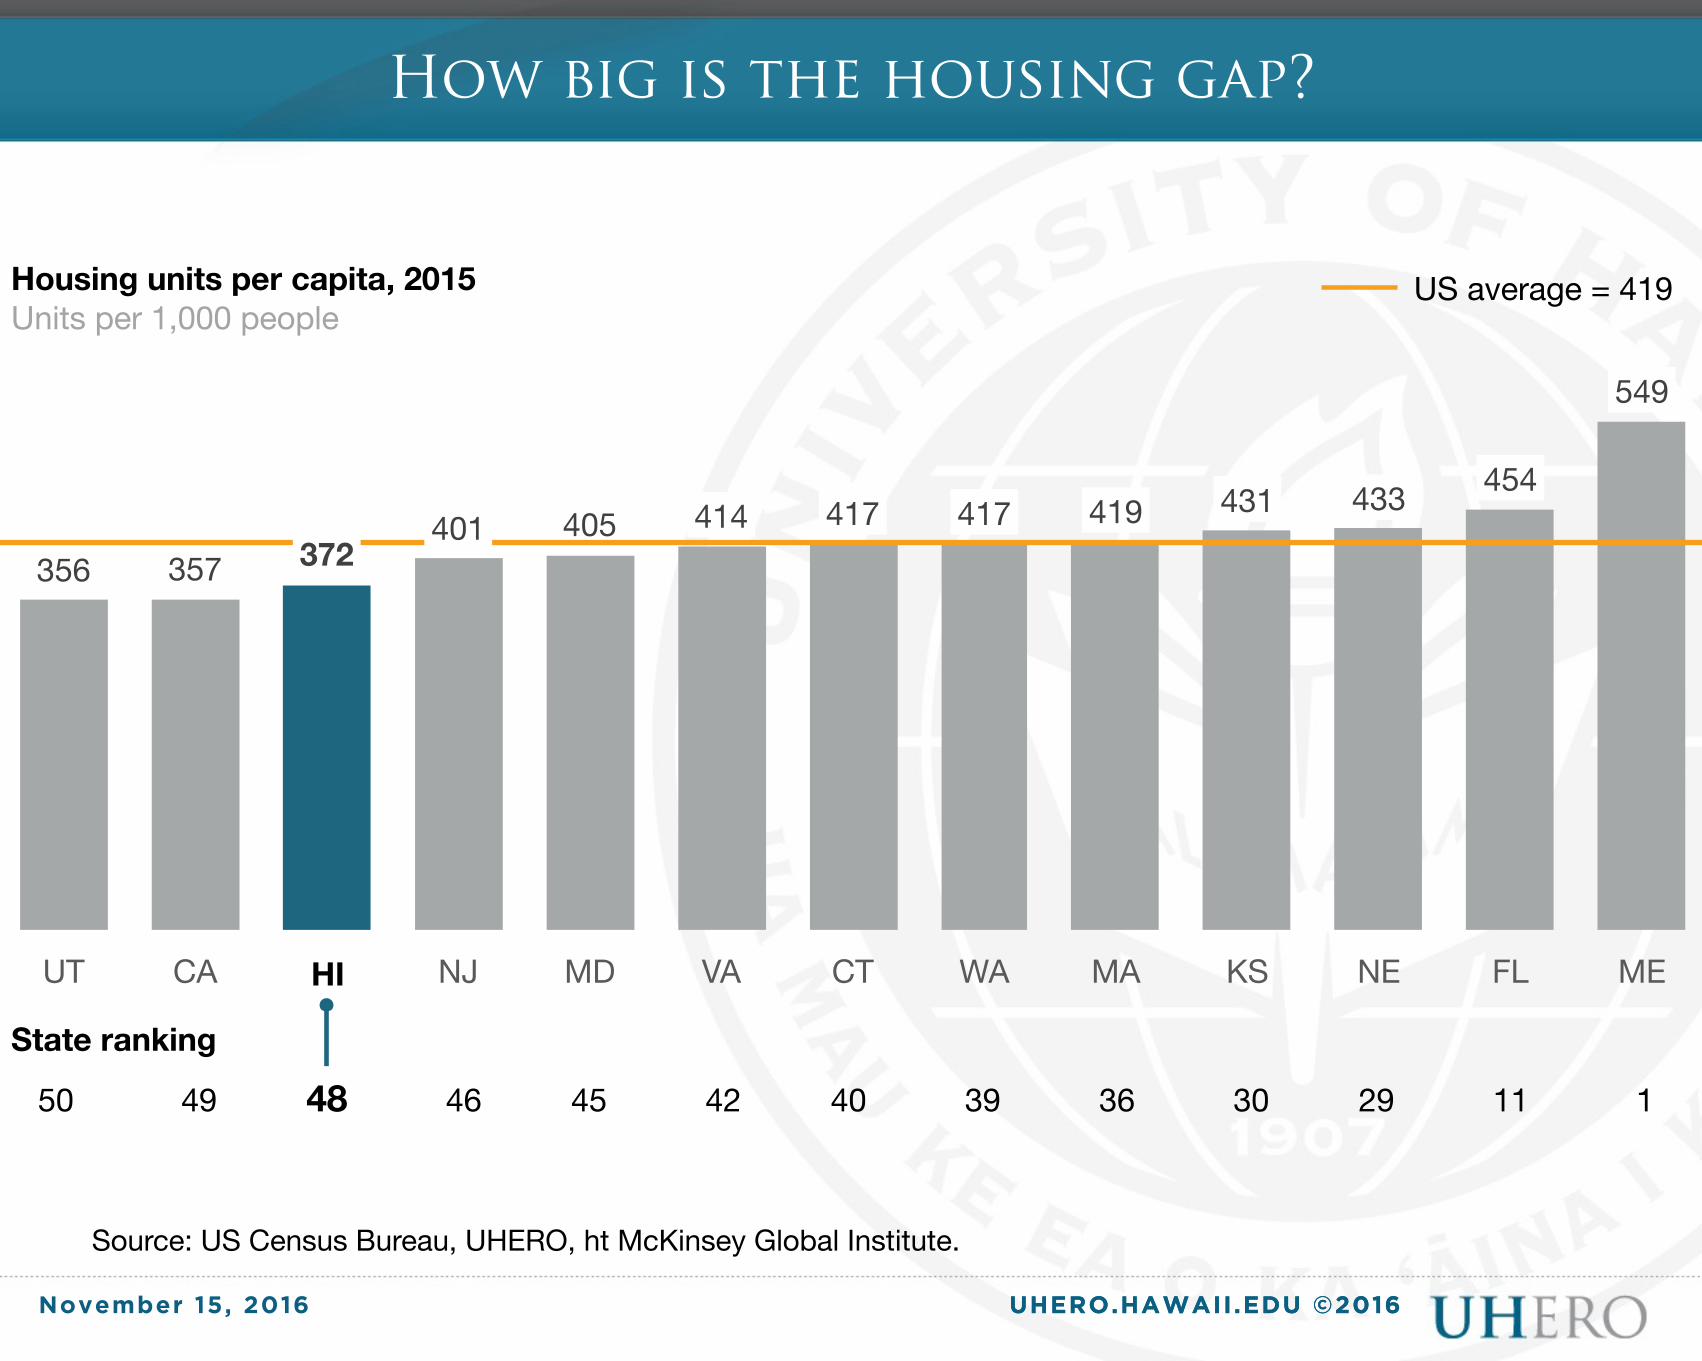
Hawaii’s Housing Gap ‣ Hawaii is 48th in housing per capita. ‣ But, how big is Hawaii’s housing gap?
UHERO.HAWAII.EDU ©2016

November 15, 2016
Overview
Houseless in Honolulu is not new ‣ Home prices and rents have always been high. ‣ Production has always been cyclical. ‣ What is new?
Hawaii’s Housing Gap ‣ Hawaii is 48th in housing per capita. ‣ But, how big is Hawaii’s housing gap?
Benefits of Closing the Gap ‣ Economic benefits of closing the gap. ‣ Diversification and growth without housing? ‣ Reducing poverty
UHERO.HAWAII.EDU ©2016

November 15, 2016
0
1
2
3
4
1950 1960 1970 1980 1990 2000 2010 2015
Home ownership has always been expensive
Ratio of Hawaii to US Owner Occupied Home Values
UHERO.HAWAII.EDU ©2016
Source: US Census Bureau

November 15, 2016
60
80
100
120
140
160
180
Ark
ansa
sM
issi
ssip
piA
laba
ma
Wes
t Vir
gini
aSo
uth
Dak
ota
Ken
tuck
yO
klah
oma
Ohi
oTe
nnes
see
Mis
sour
iIo
wa
Indi
ana
Sout
h C
arol
ina
Kan
sas
Neb
rask
aLo
uisi
ana
Geo
rgia
Idah
oN
orth
Car
olin
aN
orth
Dak
ota
Mic
higa
nM
onta
naN
ew M
exic
oW
isco
nsin
Penn
sylv
ania
Ari
zona
Texa
sU
tah
Mai
neW
yom
ing
Nev
ada
Min
neso
taIll
inoi
sO
rego
nD
elaw
are
Rho
de Is
land
Flor
ida
Col
orad
oV
irgi
nia
Was
hing
ton
Con
nect
icut
Verm
ont
New
Ham
pshi
reM
assa
chus
etts
Mar
ylan
dN
ew Y
ork
New
Jers
eyA
lask
aC
alifo
rnia
Haw
aii
Dis
rict
of C
.
Rent too
2014 Regional Price Parities: Rents and Utilities
UHERO.HAWAII.EDU ©2016
Source: US Bureau of Economic Analysis

UHERO.HAWAII.EDU ©2016November 15, 2016
Home Price Inflation highest on the coasts
Source: FHFA Quarterly All Transactions Price Index, NSA
FHFA Quarterly Home Price Index (1980=100)
0
200
400
600
800
1000
1200
1980-1
1981-1
1982-1
1983-1
1984-1
1985-1
1986-1
1987-1
1988-1
1989-1
1990-1
1991-1
1992-1
1993-1
1994-1
1995-1
1996-1
1997-1
1998-1
1999-1
2000-1
2001-1
2002-1
2003-1
2004-1
2005-1
2006-1
2007-1
2008-1
2009-1
2010-1
2011-1
2012-1
2013-1
2014-1
2015-1
2016-1
Boston
Nassau Cnty
Cambridge
San Francisco
San Jose
Honolulu
US Average

UHERO.HAWAII.EDU ©2016November 15, 2016
Housing Units Authorized by Permits
new lows in post war home building
0
2,000
4,000
6,000
8,000
10,000
12,000
14,000
16,000
18,000
20,000
1940
1948
1956
1964
1972
1980
1988
1996
2004
2012
OahuState
Source: Robert Schmidt, Historical Statistics of Hawaii, DBEDT, UHERO.

UHERO.HAWAII.EDU ©2016UHERO.HAWAII.EDU ©2016
How big is the housing gap?
November 15, 2016
Population and Housing (2005-2015)
139
391
806
414
166
135
306
84
40,896
114,322
277,741
143,686
58,070
51,746
136,469
50,380
294
292
345
347
349
384
446
600Connecticut
New Jersey
Nebraska
Kansas
Maryland
Virginia
Massachusetts
Hawaii
Population added1,000 people
Housing units addedNumber
Ratio of housing units added to population addedUnits per 1,000 people
Source: US Census Bureau, UHERO, ht McKinsey Global Institute.
UHERO.HAWAII.EDU ©2016UHERO.HAWAII.EDU ©2016November 15, 2016
356 357 372401 405 414 417 417 419 431 433 454
549
UT CA NJ MD VA CT WA MA KS NE FL ME
US average = 419Housing units per capita, 2015Units per 1,000 people
50 49 48 46 45 42 40 39 36 30 29 11 1
State ranking
HI
How big is the housing gap?
Source: US Census Bureau, UHERO, ht McKinsey Global Institute.

UHERO.HAWAII.EDU ©2016UHERO.HAWAII.EDU ©2016
How big is the housing gap?
November 15, 2016
574.1
532.5
41.6 38.480.0
46.9 33.1
Current demand(2015)
Currentstock(2015)
Currenthousingbacklog
Demandadditionby 2025
Totalhousingbacklogby 2025
Projectedunits2016-25
Gap to fillby 2025
1,000 housing units
Number of housing units neededin Hawaii to supply the market atthe same per capita rate as New Jersey (i.e., 401 units per thousand people)
Additional units needed tosupply Hawaii’s populationgrowth through 2025 (at thesame per capita rate as New Jersey)
574.1
Hawaii’s housing supply gap
Source: US Census Bureau, UHERO, ht McKinsey Global Institute.

November 15, 2016
Build an 33K additional housing units by 2025 ‣ Real GSP average of 0.6% higher over 2016-25 ‣ Non farm employment and labor earnings 1% higher ‣ Construction job 13% higher ‣ Almost 5K more net migration over the period ‣ Housing gap impedes diversification and growth
Reduce poverty rates
UHERO.HAWAII.EDU ©2016
Benefits to closing the housing gap
0
5
10
15
20
25
30
Official Poverty Rte Supplemental Poverty Measure SPM w/RPP rent, food, clothing*
Hawaii US
Source: US Census, Trudi Renwick and Liana Fox, Supplemental Poverty Measure 2015. Trudi Renwick, Bettina Aten, Eric Figueroa and Troy Martin, Supplemental Poverty Measure: A Comparison of Geographic Adjustments with Regional Price Parities vs. Median Rents from the American Community Survey. * Applied 2011 estimated gap to 2015 rates.

UHERO.HAWAII.EDU ©2016March 6, 2013
Mahalo

UHERO.HAWAII.EDU ©2016November 15, 2016
Mahalo