desktop stress demonstration device
TRANSCRIPT
Desktop Stress Demonstration Device
A Major Qualifying Project Submitted to the Faculty of
Worcester Polytechnic Institute in partial fulfillment of the requirements for the
Degree in Bachelor of Science in
Mechanical Engineering By
__________________________________ Jarrod Peloquin
__________________________________ Charles Whitfield Bleakney IV
Date: 4/27/17
Project Advisor:
__________________________________
Professor Eben Cobb, Advisor

Desktop Stress Demonstration Device
Abstract
The goal of this MQP was to design a tabletop demonstration device to be used to aid
students in understanding combined bending and torsional stresses. The device is a cantilever
beam capable of being twisted as well as bent. The geometry of the beam was selected to balance
easily measured amplitudes of strain with longevity of the device. We included the addition of
strain gauges on the critical section of the main shaft of the beam to allow theoretical values of
stress to be compared to measured values of stress.
1

Desktop Stress Demonstration Device
Table of Contents
Abstract 1
Table of Contents 2
Table of Figures 2
Introduction: 4
Design Specifications 5
Design Section 6 Design of Shaft 6 Design of Device 10
Building the Device 15 Design to Part 15 Redesigns During Physical Build 16
Strain Gages 19 What is a Strain Gage 19 Choosing Strain Gage Sensor(s) and Configurations 20 Calculation of Bending Stress (2-Gage Method) 22 Calculation of Torsional Stress (2-Gage Method) 22 Installation and Testing of Strain Gages 23
Conclusion 25
Recommendations 26 USING STEEL 26 STRAIN GAGE PROGRAM 28 VIBRATION AND RESONANCE FREQUENCY TESTING 28 HEIGHT ADJUSTABLE FEET 28
Appendix 29 Appendix A: Tables and Diagrams for the Design of the Device 29 Appendix B: Mathcad Calculations for the Design of the Shaft 46 Appendix C: Photos of the final device 56
2

Desktop Stress Demonstration Device
Table of Figures
Figure 01: Singularity Functions 06
Figure 02: Calculations of Von-Mises Stresses at critical point A.
07
Figure 03: Preliminary Safety Factor 08
Figure 04: Log Mean Diagram and Sf value. 09
Figure 05: Alternating and Mean Von-Mises stresses
09
Figure 06: Safety Factor Calculations 10
Figure 07: The first design which was overly complex. 10
Figure 08: First Simplified Design. The design was easier to make but still lacked
a way to apply a torque to the device. 11
Figure 09: First rendition of our final design. The addition of the arm allows a torque
to be applied. This is the first design that incorporated the interference
fit at the shaft Interfaces. 12
Figure 10: Diagrams showing the slide fit of the shaft into the device. 13
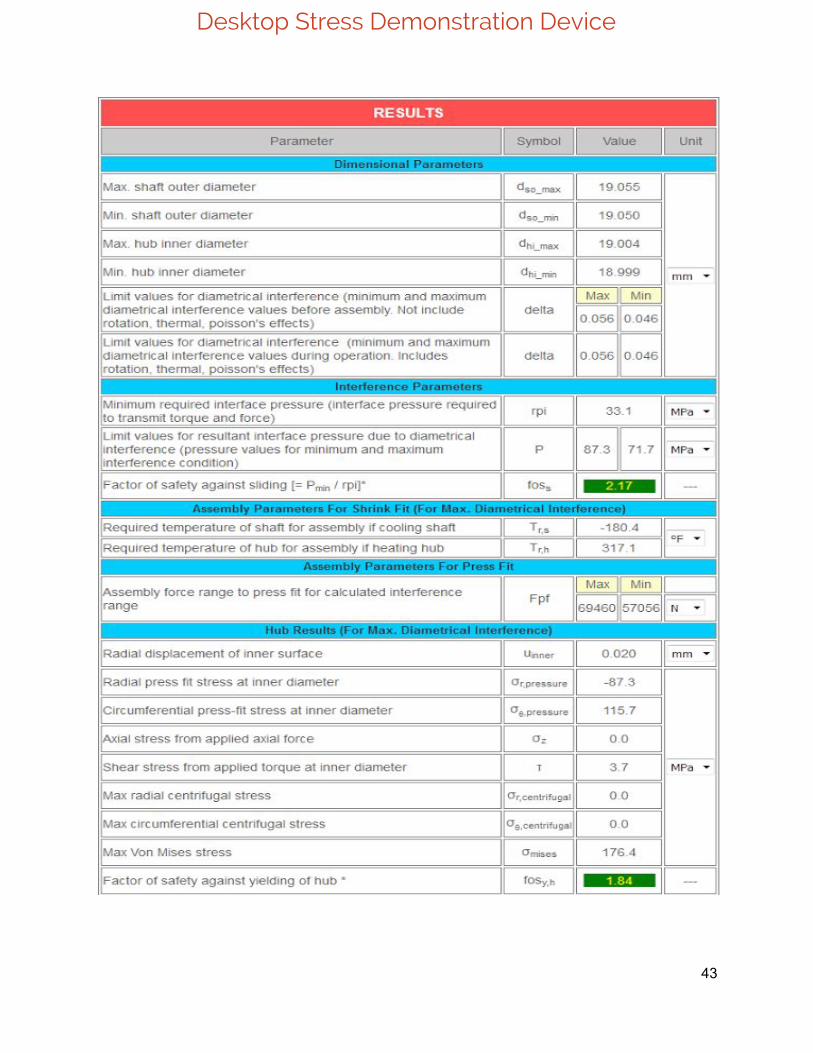
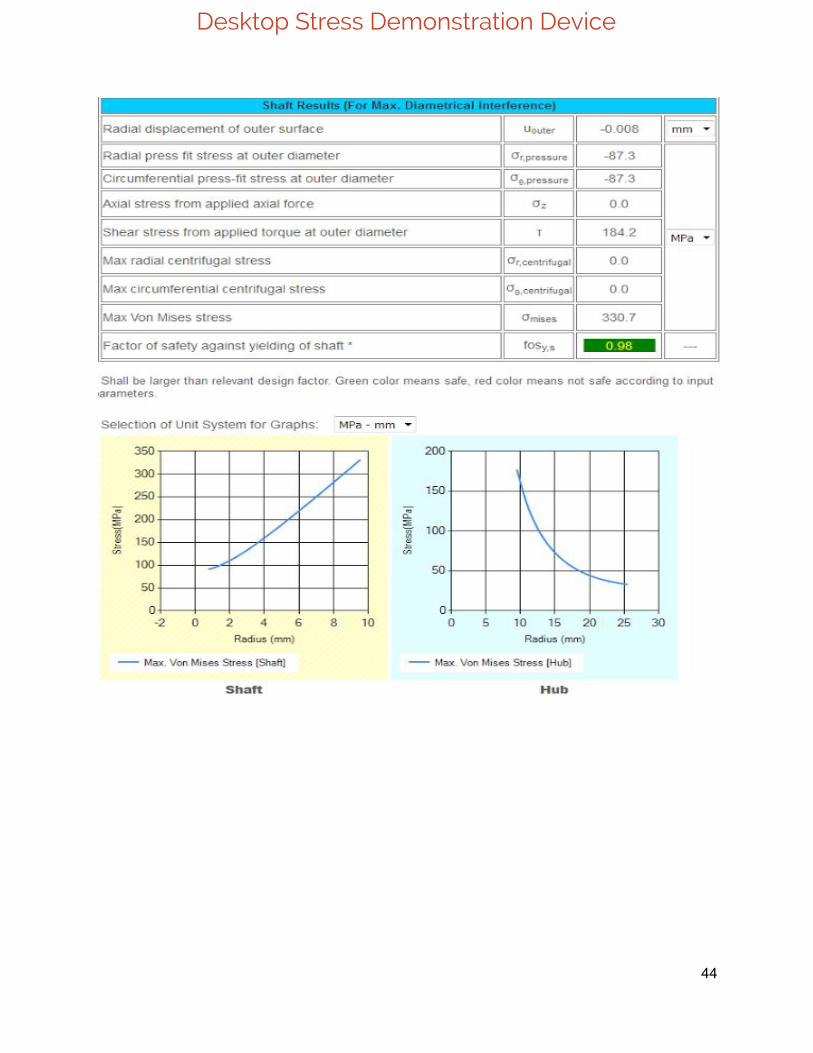
Figure 11: AMESweb Calculation of the various stress parameters 14
Figure 12: Engineering Drawings of the arm and backplate, using ordinate dimensioning 16
Figure 13: Final Design Concept of the Tabletop Demonstration Device 17
Figures 14 and 15: Engineering Drawings of the two backplate pieces and a front view of
the devices arm used to apply the torque and force. 18
Figure 16: Diagrams of the parts and workings of a standard strain gage. 19
Figure 17: Diagrams and equations for the 45 degree Delta Rosette. 20
Figure 18: 2-Gage Bending Stress Measurement 22
Figure 19: 2-Gage Torsional Stress Measurement 22
Figure 20: Bending-Torsion Arm Diagram with Strain Gage Placement 22
Figure 21: 2-Gage Bending Stress Measurement 23
Figure 22: 2-Gage Torsional Stress Measurement 23
Figure 23: Strain Gage Amplifiers 24
Figure 24: Strain Gages installed on beam 24
Figure 25: Bending/Torsion with 195 Newton mass installed 26
3
Desktop Stress Demonstration Device
Figure 26: LabView Interface: Torsion and Bending Readout 26
Introduction:
The device designed is intended to demonstrate combined torsional and bending stresses
to be used to further students understanding at WPI. In order to complete a design concentration
with a Mechanical Engineering degree at WPI students are required to take the Design of
Machine Elements course. In this introductory course students spend the 7 week term examining
stress and fatigue in various machine elements. According to the WPI course catalog “machine
elements are studied and methods of selection and design are related to the associated hardware”
(WPI Course Catalog). It is important for students to understand the stresses and forces that are
applied to various components and mechanisms in order to further understand how to design to
account for various potential failures. From analyzing these potential failures students learn how
to account for such failures in their design and selecting materials in order to acquire a
satisfactory safety factor.
While learning throughout this seven week course students are also required to design
various components for certain devices and structures to put into practice what they are learning.
One device that has been designed by students in past Design of Machine Elements courses has
been the main rotor shaft for a Wind Turbine. Students underwent research to understand the
function and design of the rotor shaft and what specific forces and torques they needed to design
for. From their students determined singularity functions and calculated the stresses acting at
critical sections on the shaft to determine if it would withstand the forces applied. As the course
went on students learned about stress concentrations and made stepped shafts with a radius of
curvature and calculated the stresses acting at that section. They then used their desired material
and those stresses to determine the safety factor of the rotor shaft.
A problem that students tend to face in this class is understanding the concept of
combined stresses and the affects they have on a system. Designing for such systems can be
difficult when there isn’t a fundamental understanding which could be helped through the use of
visual aid. The purpose of this MQP is to design a tabletop demonstration device to demonstrate
4

Desktop Stress Demonstration Device
combined stresses in a system. This would be used in future design classes as a teaching aid to
further students’ understanding of combined stresses.
Design Specifications ● The beam must be able to withstand bending and torsional stresses with a safety factor
over 1 (preferably 2).
● The device must be able to withstand the max load desired without flipping over or
breaking.
● The connection between the beam and back plate must be able to hold without causing
damage to the beam or having the beam slip from the grip.
● The connection between the beam and the arm must be able to hold without causing
damage to the beam or arm or by having the grip fail.
● Must be able to measure stresses, both bending and torsional, acting on the shaft.
● The device must be easily transported.
● The beam must deflect enough to be visually distinct but not cause any plastic
deformation to the shaft.
● The device must be able to be accurately measured with the use of strain gages based
on the theoretical values calculated for the device.
● The device must be able to withstand 200,000 cycles of a maximum load of 45 lbf
applied without failing.
● The device must be able to adjust the amount of force applied between 0 and 45 lbf.
● The hanging weight must be able to adjust the amount of distance it applies the force
across the length of the shaft.
5

Desktop Stress Demonstration Device
Design Section
Design of Shaft
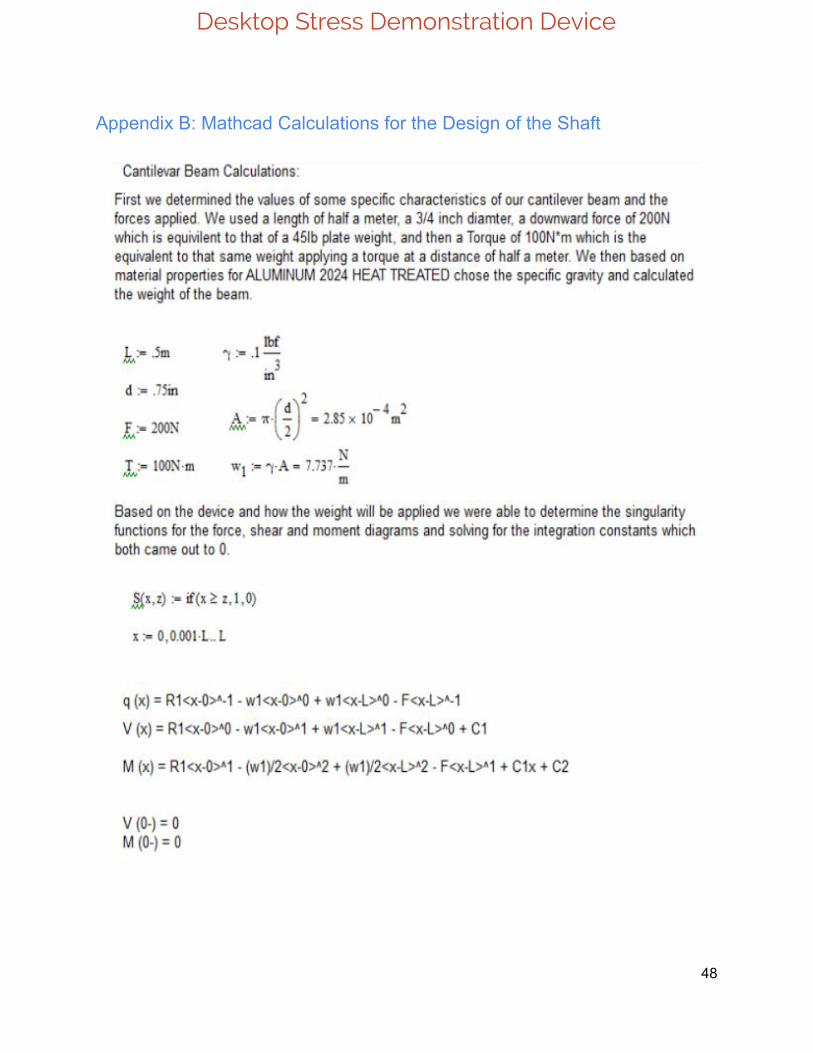
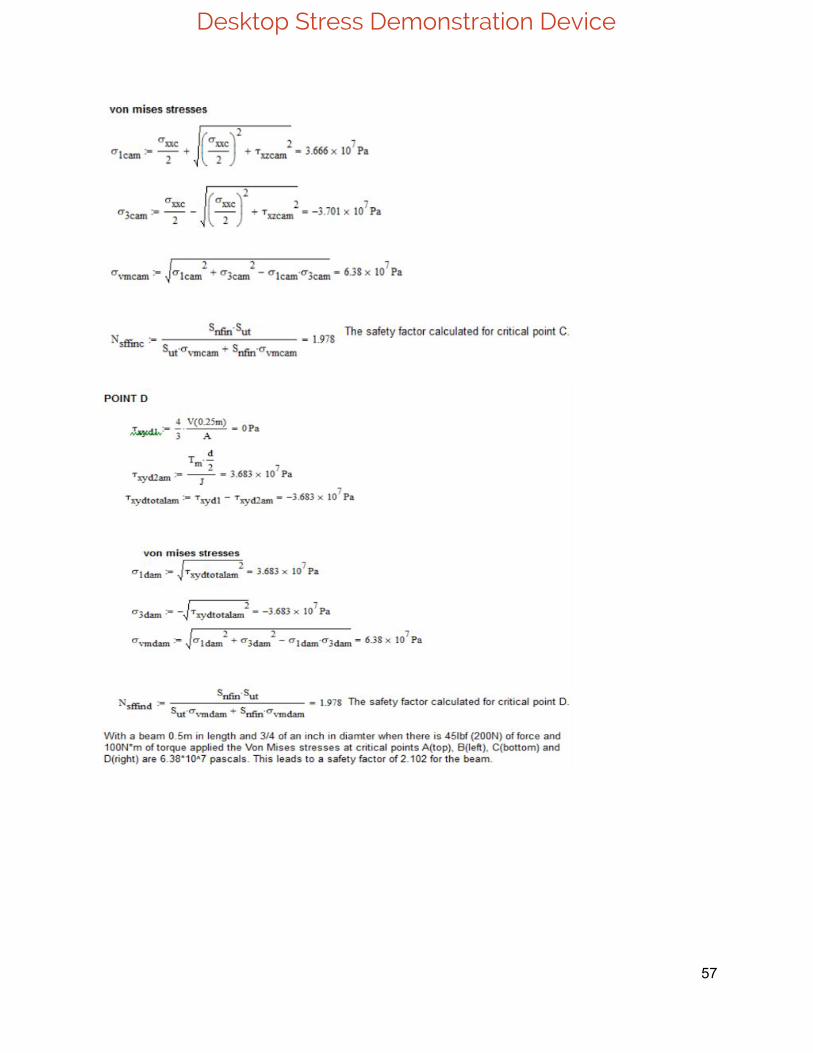
When designing the beam for our demonstration device we needed to determine some
important variables and characteristics to take into account. We determined that the length of the
beam would be 0.5 meters with a 0.75 inch diameter. We then assumed that we would hang a
weight on the end of the arm we designed for our device that weighs 45lbs. This would generate
approximately 200N of force as well as 100N*m of torque from the weight both bending and
twisting the main beam. We then needed to determine a material for our beam. When looking
through materials we wanted something that would be lightweight but also have a high strength
value to be able to handle the amount of force and torque being applied. After some researching
we settled on a 2024 Heat Treated Aluminum. Using its specific gravity we were then able to
calculate the weight of the beam and thus begin determining our singularity functions.
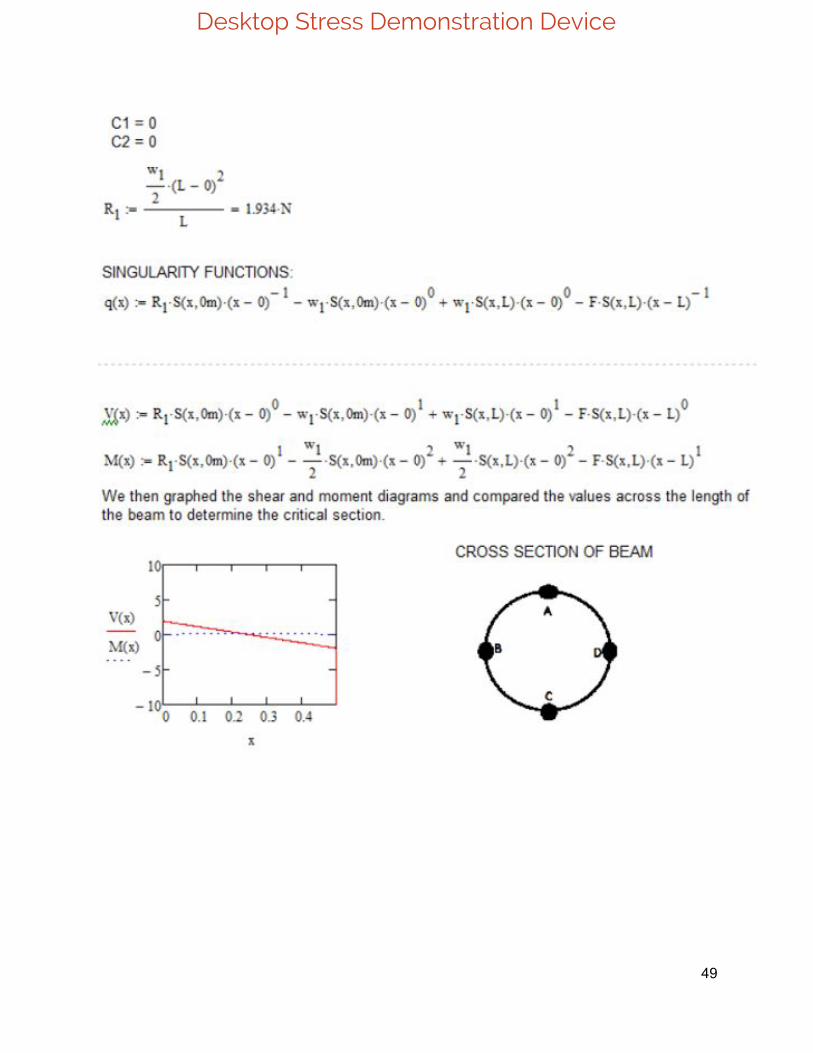
When creating the singularity functions we had to determine the forces acting on the
beam. We analyzed the beam having a reaction force, R1, at the base of the back plate, the
weight of the beam being evenly distributed across its entire length and then the applied force
acting at the end of the beam. From here we created the Force, Shear and Moment singularity
functions as shown in the figure below.
Figure 01: Singularity Functions
We then had to solve for the integration constants and calculate the value of the reaction
force at the back plate solving the moment function for when x equals the length of the beam.
6

Desktop Stress Demonstration Device
This solution derived that the reaction force equaled 1.934 N. After solving for these variables
we were able to create the final versions of the singularity functions. From there we created a
graph that contained both the shear and moment diagrams to determine where the critical section
was across the length of the beam. Based on the graph we determined the critical section to be
located approximately 0.25 meters from the base of the back plate. We also determined the four
critical points: “A” located at the top of the beam, “B” located on the left side of the beam, “C”
located on the bottom of the beam and “D” located on the right side of the beam.
From here we calculated the stresses acting at each critical point on the beam. At critical
point A there was the bending stress and the torsional stress acting on the beam. After calculating
both of those stresses we then converted them into the von mises stress values for that specific
critical point. The total von mises stress was calculated to be 1.276*10^8 Pascals. The final
calculations are shown in the figure below and the full calculations can be found in the Appendix
at the end of this document.
Figure 02: Calculations of Von-Mises Stresses at critical point A.
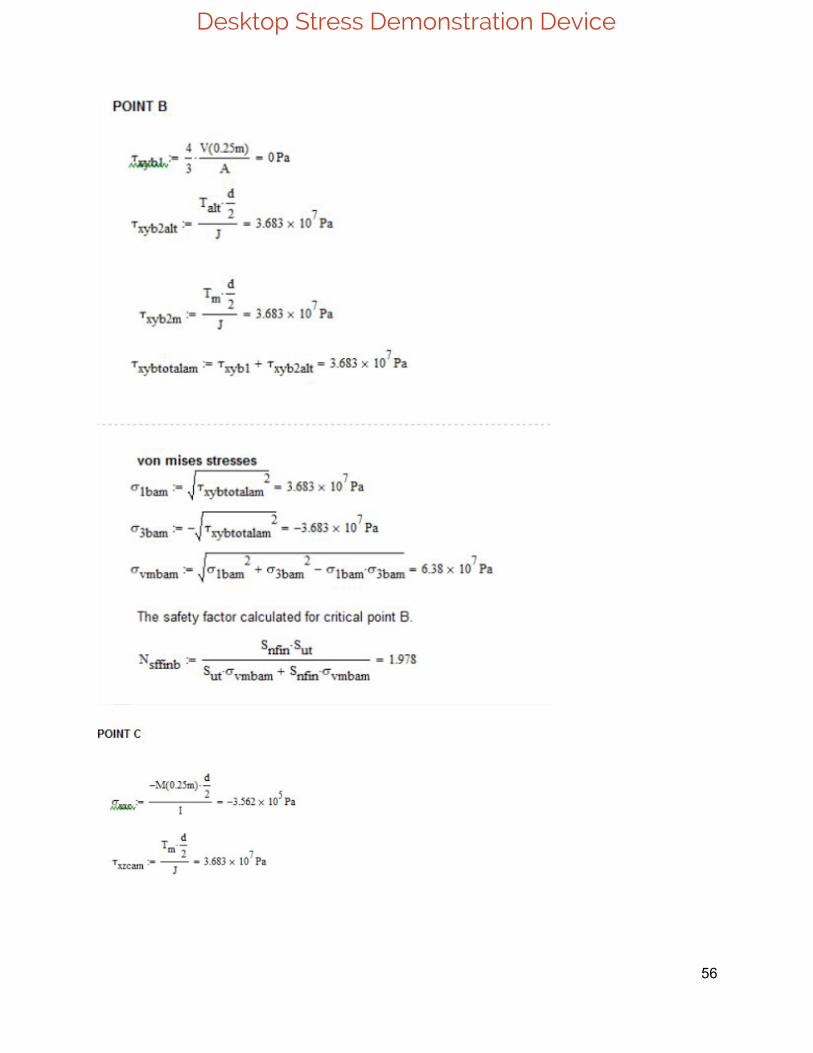
Next we calculated the stresses acting at point B on the critical section. We determined a
transverse shear and a torsional shear were both at this specific point. We calculated both these
stresses and added them together because they are both acting on the same axis and are both in
the same direction. We then calculated the von mises stresses at this point. The calculations for
the von mises stresses at point C were very similar to that at point A except both forces were in
the opposite directions of the forces at A. These calculations ultimately lead to the same value
that was calculated at point A. Then for the calculations at point D we determined again both a
transverse and a torsional stress present but they were acting in the opposite directions. When
calculating this though we still came up with the same value as in point B for the von mises
stresses. We then did a preliminary safety factor calculation dividing the yield strength of the
material by the total von-mises stress calculations that we completed at each point to figure out
7

Desktop Stress Demonstration Device
how well we were doing at this point of the design process. This showed us that our current
safety factor was approximately 2.3 which was a satisfactory value but we needed to account for
different loading and our desired lifetime of the device. The calculations of this initial safety
factor can be found in the figure below.
Figure 03: Preliminary Safety Factor
To ensure a more accurate safety factor we took into account a cyclic loading scenario
and had to calculate for the endurance strength value. This was determined to be half the ultimate
tensile strength which meant the endurance strength is equal to 2.205*10^8 Pascals. We then
calculated the various correction factors that would help us acquire a more accurate safety factor
for our design analysis. We determined our size, load, and temperature factors to all be 1
meaning they didn’t alter our beams safety factor. However, we didn’t use a surface correctional
factor because we could not find a table of constants to determine the values needed to calculate
such a factor. With basic bending and torsional loading our correction factor for loading is 1. For
the size correction factor, with the beam diameter being over 0.3inches the correction factor is
equal to 0.894 after the calculations. The temperature correction factor is 1 since we are not
working at extreme temperatures. Lastly we want a high reliability so we decided to go with a
reliability of 99.99% which bad our correction factor 0.702. After multiplying these factors to
our endurance strength Se, our new corrected endurance strength value was calculated at
1.548*10^8 Pascals.
We then created a log mean diagram for the device and graphed it. We used 10^3 cycles
and 10^6 cycles for the range of our linear slope. To determine our necessary strength Sf we
needed to determine what number of cycles to design for. An estimation was made that each
student in a course would perform 10 cycles on the device each term for the course of 10 years.
8

Desktop Stress Demonstration Device
Based on a class size of approximately 30 students we rounded the number of cycles to 200,000
for the life of our device. This lead to a value of 1.928*10^8 Pascals for Sf at 200,000 cycles.
Figure 04: Log Mean Diagram and Sf value.
We determined this would be a cyclic loading condition for our device and designed for
such. This is because the loads we expect to design for are a full load of a certain weight We
used a the current Force and Torque values we designed for as our maximum values and then
used 0 for the minimums of both. From here we calculated the alternating and mean values for
both Force and Torque which were 100N and 50J respectively. We then used these alternating
and mean values to recalculate the alternating and mean von-mises stresses at each critical point
on the critical section of the beam. The calculations of these values at critical point A can be seen
below.
Figure 05: Alternating and Mean Von-Mises stresses
Lastly with each point we used the alternating and mean von-mises stresses to calculate
the safety factors for each critical point. With a finite life value for 200,000 cycles, the von-mises
stresses, and the ultimate tensile strengths we determined safety factors of approximately 2 at
each point. We felt this was a very reasonable safety factor for our final design and would work
9

Desktop Stress Demonstration Device
within our design parameters. The calculation of the safety factor can be seen below for point A
with the full calculations available in the appendix at the end of this document.
Figure 06: Safety Factor Calculations
Design of Device
Through calculations of the stresses, bending deflection and twist from torsion; we were
able to define the material, diameter, and length of cantilevered circular beam. The solid circular
rod would be made of aluminum, and would need to deflect and twist enough to offer an easily
observable deformation, in both bending and torsion under combined loading. Initially the device
was a pretty complicated system of parts that would require careful and skillful machining for it
to work correctly.
Figure 07: The first design which was overly complex. This first solid model we devised, but it required precision machining of the shaft, having
flat sides to keep it from rotation when the torsion is applied. Further complicating the logistics
of making the parts, the post in which it mated would have to be machined to a matching
tolerance, having the same shape as the shaft to constrain it. This design also had a series of ball
10

Desktop Stress Demonstration Device
joint, bearings and other overly complicated elements; The realization of the complexity led to a
deeper discussion of its intended use, and how to choose different methods that would simplify
the device.
With further focus on what the true core requirements of this device were; we designed a
very simplistic mechanism assembly, from which our final design would grow, as we honed the
parameters, fixturing methods of the circular beam, and moment arm; each parameter we refined,
allowed us to strip the design down to it’s core elements and configure it for our precise needs,
then build up from there to meet our space, weight, durability, safety and aesthetic needs.
Also considering the ease of storage, transportation and use; We wanted the input load to
be created by a system that was both variable and easily transportable. For this, we decided to
use a 5 gallon water bottle as the weight. A varied amount of water could be added to the bottle,
for a range of roughly 5 to 195 Newtons. Since our full bottle would be just under 200 N, and our
goal was 100 Nm force, our beam would want to be about 0.5 meter from the cantilevered end,
to the hanging weight.
Figure 08: First Simplified Design. The design was easier to make but still lacked a way to apply
a torque to the device.
These are two versions of the simplified device, where the rod would be pinned into one
block, which could then be bolted or otherwise mounted to the base, constraining the torque and
bending with a pinned element. One concern that arose from examining this design was the
stresses caused by drilling and pinning the elements together, along with the requirement of the
parts to have a sliding fit to allow them to be assembled before they are pinned. The sliding fit
meant that the aluminum rod could move inside the plate, creating a weakness in the design; The
11
Desktop Stress Demonstration Device
rod could be deformed by repeated movement inside the plate. We were able to take this
“failure” and turn it into the solution we used in our final device. One of us had experience with
shrink-fits at work; this method of heating and/or cooling parts to aid in assembly or disassembly
is relatively simple in execution. However, it requires careful calculating to find a balance of
torque-holding capability and building excess internal stresses.
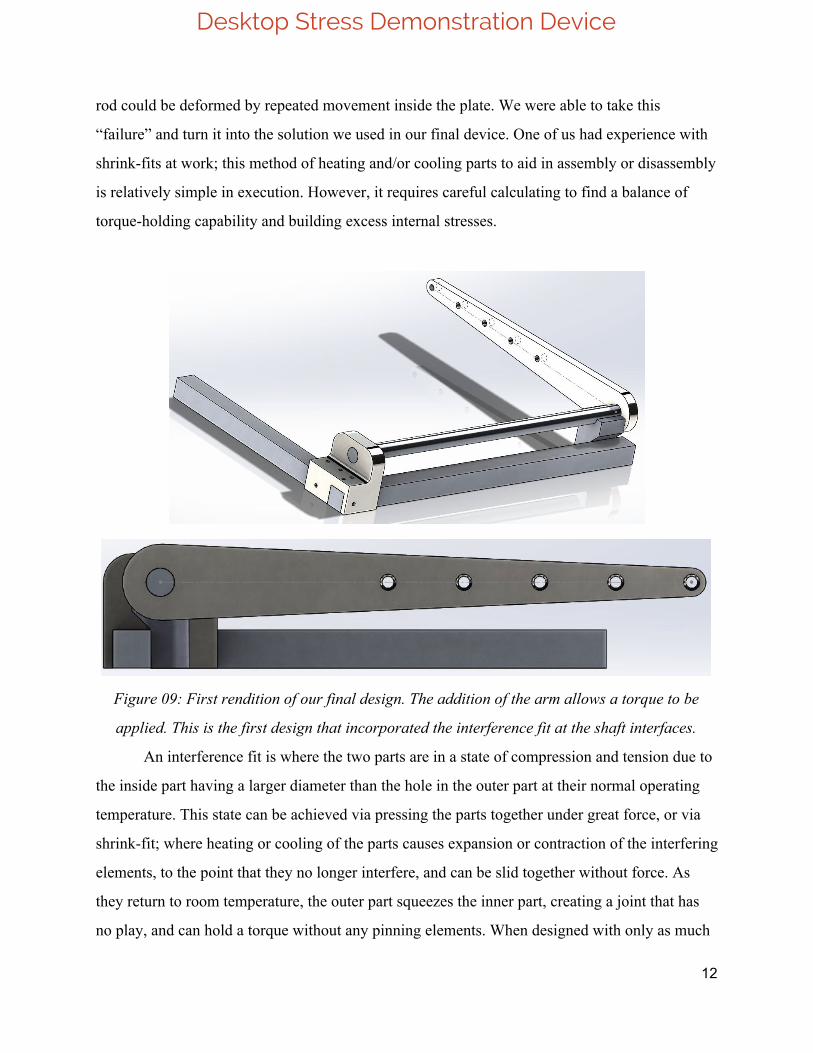
Figure 09: First rendition of our final design. The addition of the arm allows a torque to be
applied. This is the first design that incorporated the interference fit at the shaft interfaces.
An interference fit is where the two parts are in a state of compression and tension due to
the inside part having a larger diameter than the hole in the outer part at their normal operating
temperature. This state can be achieved via pressing the parts together under great force, or via
shrink-fit; where heating or cooling of the parts causes expansion or contraction of the interfering
elements, to the point that they no longer interfere, and can be slid together without force. As
they return to room temperature, the outer part squeezes the inner part, creating a joint that has
no play, and can hold a torque without any pinning elements. When designed with only as much
12
Desktop Stress Demonstration Device
interference as is required to hold the torque required, the mating has a much lower concentration
factor than any pinning method.
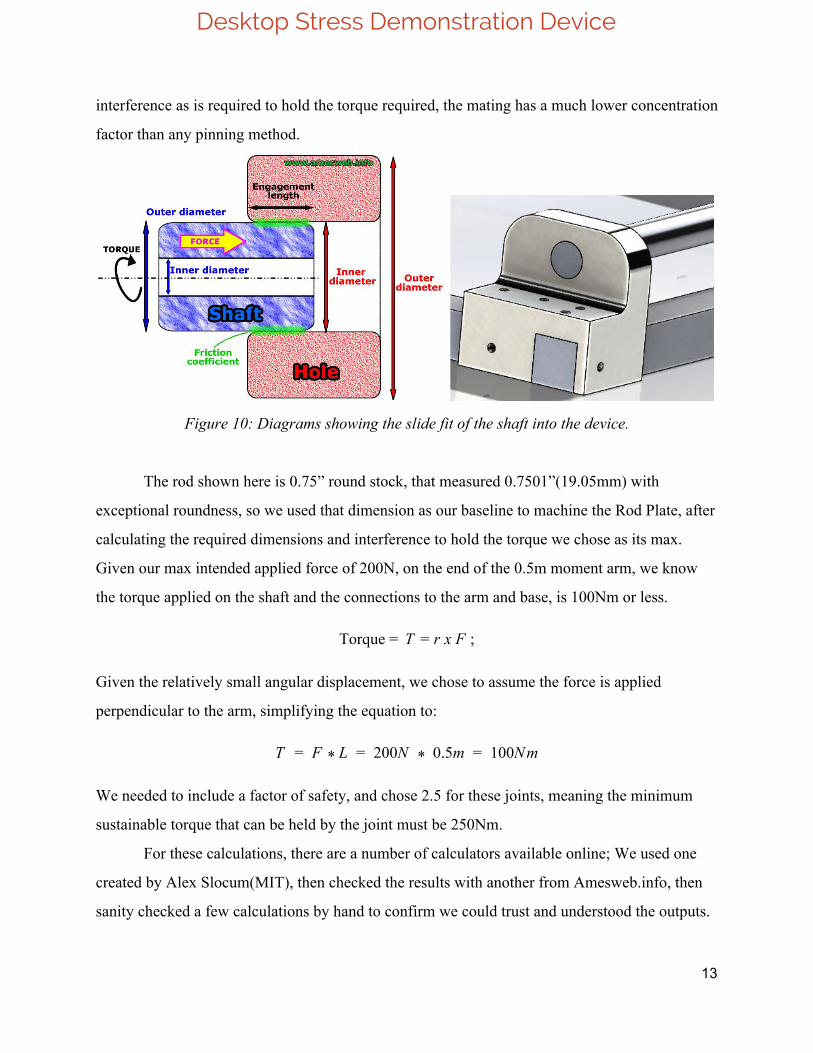
Figure 10: Diagrams showing the slide fit of the shaft into the device.
The rod shown here is 0.75” round stock, that measured 0.7501”(19.05mm) with
exceptional roundness, so we used that dimension as our baseline to machine the Rod Plate, after
calculating the required dimensions and interference to hold the torque we chose as its max.
Given our max intended applied force of 200N, on the end of the 0.5m moment arm, we know
the torque applied on the shaft and the connections to the arm and base, is 100Nm or less.
Torque = ; x FT = r
Given the relatively small angular displacement, we chose to assume the force is applied
perpendicular to the arm, simplifying the equation to:
F 200N 0.5m 100NmT = * L = * =
We needed to include a factor of safety, and chose 2.5 for these joints, meaning the minimum
sustainable torque that can be held by the joint must be 250Nm.
For these calculations, there are a number of calculators available online; We used one
created by Alex Slocum(MIT), then checked the results with another from Amesweb.info, then
sanity checked a few calculations by hand to confirm we could trust and understood the outputs.
13
Desktop Stress Demonstration Device
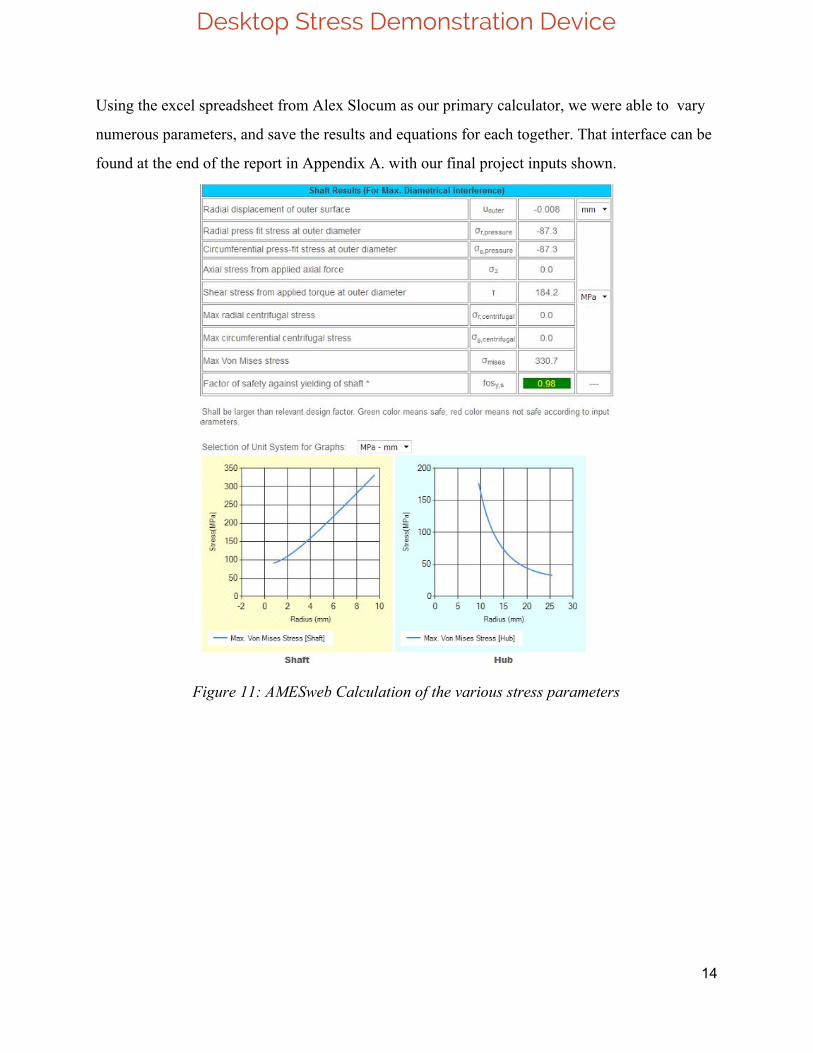
Using the excel spreadsheet from Alex Slocum as our primary calculator, we were able to vary
numerous parameters, and save the results and equations for each together. That interface can be
found at the end of the report in Appendix A. with our final project inputs shown.
Figure 11: AMESweb Calculation of the various stress parameters
14

Desktop Stress Demonstration Device
Building the Device
Design to Part
Having calculated the parameters that allow us to meet our goals, the device design is
updated to account dimensions, fits, and bending clearances. The following engineering
drawings were created in a format prefered by machinists, using ordinate dimensions with a
common origin point at which all points can be referenced during machining, with physical
measurement.The updated design used 10-series 80/20 extrusion as the base frame of the
assembly, on which the other parts would sit; allowing simplified assembly and weight savings
over solid square stock.
15

Desktop Stress Demonstration Device
Figure 12: Engineering Drawings of the arm and backplate, using ordinate dimensioning.
Redesigns During Physical Build
We started these calculations using the 2024-T351 Aluminum round bar stock, ½”
1018-Steel plate for the torque arm, and a block of 1018 for our cantilever base. The 2024
proved somewhat difficult to get, so we ordered 6061-T651 Aluminum which has very similar
properties but is readily available. After hours of machining and working with the 1018 base
block, we felt the weight of these pieces would be inhibitive to our goal of the whole device
being easy to carry and set up. Additionally we found the great amount of machining time
required for our original 1-piece base was inefficient, where a 2-piece base assembly made from
6061 Aluminum would allow for faster, simplified machining, assembly, and future
maintenance. Through the process we had numerous redesigns; and we had to learn from the data
that we received and readjust.
The result was this, our final design iteration; upsized aluminum extrusion to offer a
stiffer and slightly heavier frame to counteract the weight applied on the machine, reducing it’s
likelihood of flipping off the table. The updated aluminum 2-piece cantilever base assembly
16
Desktop Stress Demonstration Device
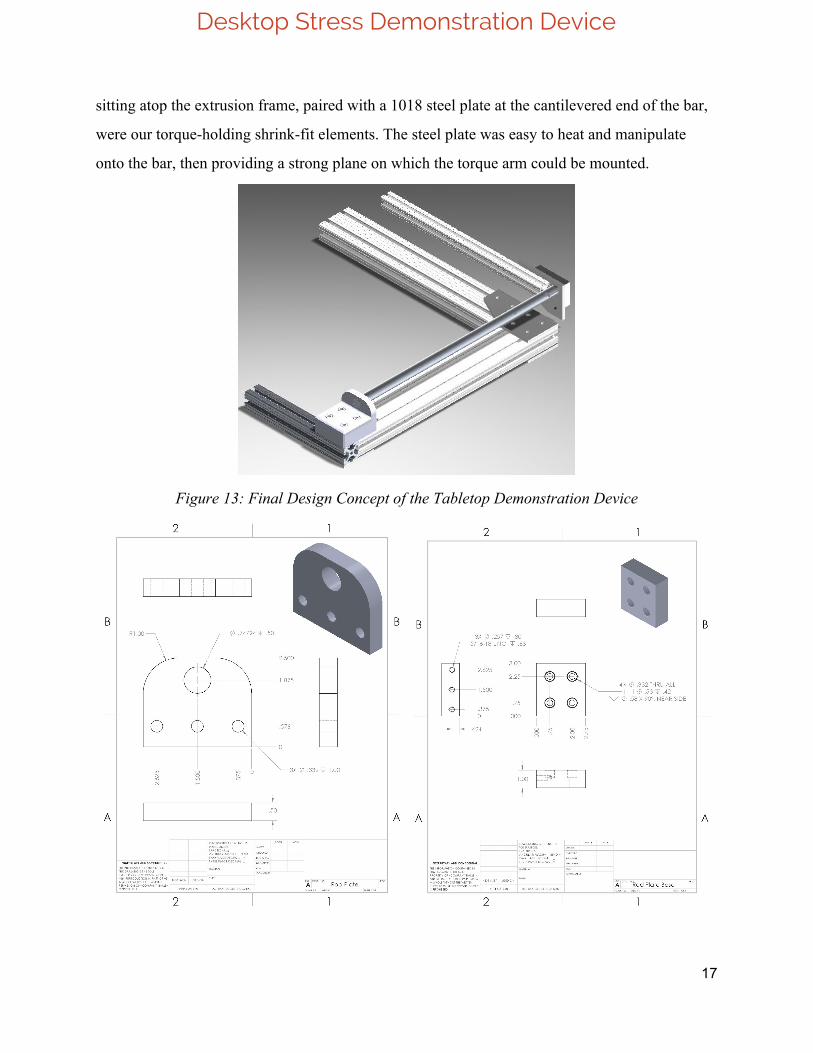
sitting atop the extrusion frame, paired with a 1018 steel plate at the cantilevered end of the bar,
were our torque-holding shrink-fit elements. The steel plate was easy to heat and manipulate
onto the bar, then providing a strong plane on which the torque arm could be mounted.
Figure 13: Final Design Concept of the Tabletop Demonstration Device
17

Desktop Stress Demonstration Device
Figures 14 and 15: Engineering Drawings of the two backplate pieces and a front view of the
devices arm used to apply the torque and force.
The ½ meter intended torque arm was more than we needed to visually represent the
torsion, so we changed to a shorter arm. The point on the arm on which the weight is applied, can
be adjusted with a thumb screw, allowing fine tuning of the moment arm length, or setting an
“unknown” length parameter, for which students can solve for. The Plate Base and Rod Plate
were both made on the CNC Haas Mini Mills, after creating CAM programs in Esprit, and
outputting the NC code into the machine to machine the parts.
After creating the device and testing, we found there were a few features that the project
should include in order to be more complete. A safety feature was designed and built from stock
we had available, taking advantage of the 80/20 extruded aluminum of the base frame. Some
alignment shims, and a tensioning handle were modified and added to a piece of extrusion to act
as a sliding outrigger. This piece allows easy extension past the back side of the table, where the
adjustable clamping end can be adjusted to hold the back of the device from both lifting off the
table, and sliding off the front edge.
A thumb screw allows easy adjustment of the table clamp, for tables up to about 8” thick, while
the sliding arm can accommodate tables about 42” deep.
Making clearance for the sliding arm, bracketry, and adding safety; we added pliable
rubber feet, allowing the device to safely sit on the table without moving around.
The reality of heating, then simultaneously aligning and sliding the ends onto the
aluminum bar was more difficult than expected, leading to a loosening of the joint over the
following weeks of being transported and tested; please see our recommendations section for our
thoughts on how this could be made better in the future.
18

Desktop Stress Demonstration Device
Strain Gages
What is a Strain Gage
Figure 16: Diagrams of the parts and workings of a standard strain gage.
The basic concept of a strain gage, is the gage is a thin circuit that has a single “wire” that
zig-zags back and forth in a configuration on the thin film, and has connections for both ends of
the circuit. This circuit has a given resistance across its leads, which changes as the gage is
deformed. The change in resistance is caused by deformation of the circuit, when stretched or
compressed along the length of the circuit. The “strain direction” as mentioned in the above
figure, is the one in which the circuit is designed to stretch the wire of the circuit; the layout of
the small circuit “wire” is thin in the strain direction with long straight sections of wire, and fat
and short when perpendicular to the strain direction. This configuration allows the circuit to
elongate perpendicular to the strain direction, like pulling on a light spring, without changing the
internal resistance of the wire. Whereas along the strain direction, an elongation of the circuit is
translated directly into stretching of the wires, changing the resistance of the circuit. Thus, when
we drive an excitation voltage through this circuit, and an appropriate balancing circuit; we can
output a voltage that changes linearly with the tension or compression under which the gage is
19

Desktop Stress Demonstration Device
subjected. When securely attached to a surface, the gage will read the strain at the surface of that
object, and allow us to measure the deformation of the object.
Choosing Strain Gage Sensor(s) and Configurations
For our application, we needed to monitor the combined stresses of bending and torsion
when a force is exerted on the end of the torque arm. For this we initially considered the Delta
Rosette specialty strain gages. Here multiple strain gages are built into one gage, and oriented at
one of many different configurations. The one we decided on was the 45° Delta Rosette.
Solving for εx, εy and γxy gives:
Figure 17: Diagrams and equations for the 45
degree Delta Rosette.
These rosette configurations allowed for differing types of readings, where the gages
required calculation of the output voltages to gain a useful reading. With a Labview type
program, this would be uncomplicated for the final user to read the output, but there were a
number of downfalls to this configuration.
The first was it required the use of three (3) separate amplifier circuits, which would be
calibrated and then the outputs calculated in LabView or by hand if reading the output voltages
on a voltmeter. Second, the calculations added a step to the process where a student could
become disconnected and not be able to have a natural correlation of the force exerted on the rod,
to the reaction of the gages. Third is the aforementioned high cost of the custom gages; though
the group of three gages could be replicated using three individual ones, this added an additional
20

Desktop Stress Demonstration Device
complexity to the precision orientation of these gages and created an avenue for loss of precision
and output linearity.
A less complicated method would be creating two separate circuits, using 4 simple strain
gages, the MMF006835 “Student gages” by Micro-Measurements. Two would be mounted along
the rod,
Additionally, the gages are meant to be used by teachers and students to further the
learning; So using these odd gages would be less applicable to what the students have available
outside of this device, so we decided to use the standard gage that is used in the ME3901 course:
Engineering Experimentation. This meant a student could become more intimately familiar with
setup, calibration and output extrapolation of these gages through the use of our device; then
apply the same gages and equipment that are readily available, to their own projects in a more
efficient manner.
21

Desktop Stress Demonstration Device
Calculation of Bending Stress (2-Gage Method)
Two strain gages bonded at the contrasting
positions of the front and rear surfaces of a
beam are equal in their absolute values and
the mark of (+) or (-) will come reverse. If
the strain gages are bonded on a beam in
such a manner that they may be neighboring
ones each other, their bending strain will
Figure 18: 2-Gage Bending Stress Measurement become double and the strains caused by the
force to the axial direction may be negated.
In this case, calculated to: σ=εo*E/2
Calculation of Torsional Stress (2-Gage Method)
In the axle catching the torsional moment
"Mω" like a figure, the shearing stress "τ"
becomes greatest at the axis surface; the
value is :
τmax=Mω/Zp
Where, Zp:Polar modulus of section
The surface shearing strain "γ" is :
Figure 19: 2-Gage Torsional Stress Measurement γ=τmax/G=Mω/G*Zp
The indicated strain "εo'" becomes the value
of the surface shearing strain "γ = 2*εo"
when it's measured by 2-Gage Method, and
the shearing stress "τ" be calculated using a
next formula. τmax=G*εo'
εo'=γ=2*εo
Mω=G*Zp*εo'
Figure 20: Bending-Torsion Arm Diagram with Strain Gage Placement
22

Desktop Stress Demonstration Device
Installation and Testing of Strain Gages
For accurate measurements with the strain gages; they need to be accurately placed,
securely attached, with little to no strain from the wire leads. The device was placed on a level
table, top-dead-center was located by marking the point in contact with the level placed on the
bar, and a line was etched into the bar. This line represents the absolute top of the bar, and the
center plane on which the first bending strain gage would be aligned. As in figure 21, the two
gages would be oriented with the strain direction along the length of the beam, and because it is a
circular beam; both the top and bottom would need to be centered and aligned for a linear and
accurate measurement.
Figure 21: 2-Gage Bending Stress Measurement
Similarly, the torsion gages needed to be accurately installed, but their orientation was to
be centered 90° from the bending gages, and once again that line would be centered on the gage.
Orienting these was made somewhat easier by the fact that the gages have small indicator lines
on them which allow you to align the gages at 45° and 90° increments. The two of these gages
would be mounted as shown in figure 22, at 45° and 135° from the length of the beam, which is
90° from each other.
Figure 22: 2-Gage Torsional Stress Measurement
23

Desktop Stress Demonstration Device
The orientation of these gages would allow for each one to be in tension while the other
is in compression; this is critical because we are inducing bending on the beam while reading the
torsion. If we did not orient the gages this way, the bending would affect the torsion reading, and
we could not use it as an accurate measure of torsion. The gage aligned with the twist of the
beam gives the torsional output, which is slightly inaccurate due to the bending of the beam also
causing deformation of the gage. The second gage is perpendicular to the twist, meaning it is not
affected by the torsion, but is still sensitive to the bending. These gages are then wired through
the wheatstone bridge, such that the anomaly caused by the bending cancels between the two
gages, and we are left with an accurate and linear torsion output.
Figure 23: Strain Gage Amplifiers Figure 24: Strain Gages installed on beam
The laboratory amplifiers in figure 23, were used in testing, and measuring of out strain
gage circuits. They have an output power circuit, and adjustable wheatstone bridge circuit inside,
allowing simplified connection, calibration, and use of the bending-torsion device.
They were connected to the amplifiers, then a calibration procedure done in order to set
the circuit to output 0 volts at rest on both circuits. From here, a known load was added, in order
24

Desktop Stress Demonstration Device
to dial in the gain factor, and set our 10 volt available output to match our maximum measured
weight to be added.
Per our previous calculations and designs, this would be scaled as a 100Nm bending
force acting at the static end of a 0.5 meter cantilevered beam, and adjustable length torque arm
at the cantilevered end. This means we have our 200N force applied at a variable distance along
the torque arm. We decided on a moment arm of 30cm, For the initial testing, we placed a 6.66N
weight 30cm along the torque arm, and since this was different from the previously calculated
torque, we had to calculate the max torque with the simple torque equation.
F 200N 0.300m 60NmT = * L = * =
This means that for bending; 200N @ 0.5m = 100Nm = 10 volt output.
Resolution would therefore be: 10v/100Nm = 0.1v/Nm
The value could also be calculated for a direct correlation to the weight added, by
calculating Volts/Newton, which would be: 10 volts/200 Newton = 0.05v/N
For Torsion, we have: 10v/60Nm = 0.167v/Nm
The range and resolution can be adjusted for any maximum load or moment arm length, or it can
be tuned to have a stable output correlation to the weight applied. Because of this adjustability, it
is useful for training how adjusting the circuit can affect the output data, for good and bad.
After our circuits were adjusted, we applied varying known weights to the device, to
check the linearity of the output, and it was generally accurate within about 1%, with a few
fluctuations outside that range that we believe were caused by, and corresponded to, a slight drift
in the amplifier’s output voltage, or calibration/balance circuit that we had noticed.
A user can set the device up to output a voltage, to be read directly from a volt meter for
simple usage and data tracking, however, another more powerful way to make use of this device
is via LabView, with a custom designed interface that can take the input voltages from the
bending and torsion circuits, and do anything you’d like- the limits are your programming ability
in LabView. We created an interface that could read either of the inputs, and output them on a
graph, calculate the weight, deflection, and unit conversions, but it was flawed and unable to
control both circuits simultaneously. We ran out of time to fix the program, and instead focussed
25

Desktop Stress Demonstration Device
on other aspects of the device and project that would be more useful for future users, or MQP
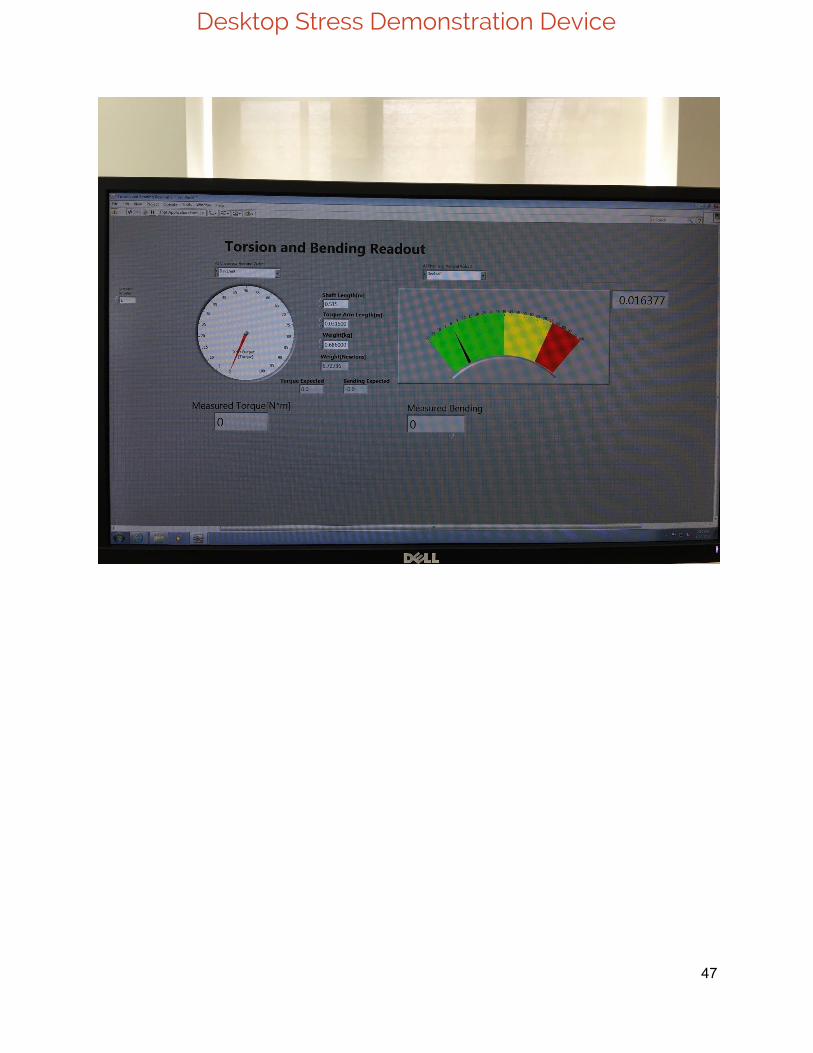
groups that wish to improve upon it. Please see figure 26 for an idea of how the labview program
we created was laid out, and intended to work.
Figure 25: Bending/Torsion with 195 Newton mass installed
Figure 26: LabView Interface: Torsion and Bending Readout
26

Desktop Stress Demonstration Device
Conclusion
Over the course of the three terms for this project we were successful in completing the
task we sought out to complete and learned a lot about the engineering design process because of
it. We learned the amount of work and time that can go into designing and re-designing alone
which took up a huge majority of our time on this project. The various different iteration of the
device consistently had improvements that needed to be made in order to successfully complete
the task desired. Even once we had our “final design” we still made changes during the build
process and added on new additions to add new features for safety or ease of use such as the
table gripper that prevents the device from flipping. A lot of thought went into the design of this
device, a lot more than we anticipated, so it was a lesson learned thinking this would have been
relatively easy to create.
However, we were able to finalize and build the complete device and it functions rather
well with the desire we had intended. The beam is able to maintain its structural integrity when
facing the maximum load designed for and can be easily seen visually bending. The strain gages
applied to the device to measure bending and torsion stresses are also easily able to be set up to
be hooked up to a LabView program to measure the exact stresses applied on the shaft. There are
still improvements that could be made to the device that we realized through the completion of
this project but with the time we had available we weren’t able to fix these issues. We do list all
of the suggestions that we would like to make to improve this device in the recommendations
section of this paper going into detail of what changes should be made and why. Overall, this
device has been very successful and we are confident it will be a great teaching aid to be used in
future design classes.
27

Desktop Stress Demonstration Device
Recommendations
Even after successfully completing our desired task and building this tabletop
demonstration device we still found some potential improvements that could be made in the
future for anyone who wants to design a device such as this. We hope to use this section to allow
others to learn from mistakes and choices we have made that probably weren’t the most optimal
in completing the task to help them in future designs and builds.
USING STEEL
One of the top recommendations we had was making the back plate, the main shaft, and
the connection to the arm all out of steel. We did a shrink fit for our beam into the wall and the
arm and this was done by heating up the back plate and arm slot to a high temperature so it
would expand. Then we would force slide the shaft into the openings and as the pieces cooled off
they would shrink back down and have a strong, high friction grip that could withstand the
torques applied.
However, the fact we used aluminum for the shaft and back plate made it very difficult to
obtain a successful shrink fit. This is because the aluminum would cool of significantly fast to
the point where the shaft would fail to slide in properly. This lead to the fit being redone multiple
times until it was finally fitted properly. Even so, the last ⅛” of the fit had to be forced in after it
was cooled which lead to the degradation of the fit. After only two weeks of use and transporting
the device the bar started to become loose on the back plate. For these reasons we would suggest
using steel for those three components, but maintaining the aluminum for the rest of the design.
The steel stays heated longer and will be much easier to get a successful shrink fit and will
maintain its integrity longer and better than the aluminum will.
However, steel is much heavier compared to the same volume of aluminum so make sure
only these three components are steel. It will still allow your device to be easily transported and
also will be easier to machine. The first attempts at making the backplate out of steel from hand
took almost five hours of cutting and was barely half complete. If time and equipment permit
28

Desktop Stress Demonstration Device
though steel would be a nice option still. Also we suggest if the shaft were to also be made out of
steel design for a smaller diameter cross section. With the steel being much stronger than
aluminum the steel would need less material for the same safety factor with its higher yield and
ultimate tensile strength but still be able to have the visually distinct bend for students and users
of the device to see. If after all of this you still desire to maintain the aluminum shaft for any
reason then we would suggest have a closer tolerance for machining the fits. This could help
overcome some of the issues we saw when building and fitting our shaft for the shrink fit. Even
setting up a jig to allow for a quicker and more accurate slide fit could help with the short time
response needed to counteract the fast cooling tendencies of the aluminum material.
SIMPLIFY YOUR DESIGN Another big piece of advice we have for others who wish to design such a device is to
make sure you don’t overdesign and over complicate your components. From the beginning our
original designs were very complex in how they would be built and were very large and bulky.
There was also talk of some complicated fits into the wall which involved some very complex
machining that neither of us really had the ability to do. This can be seen in what was our first
design which involved a large system to house the beam involving many pieces and a complex
key fit for the shaft into the back plate. These can be seen in Figure 07.
The device overall was way to complex for us to be able to build or design and included
many components that may not have gotten the job done properly. Additionally we still didn’t
have a way to apply a torque to the shaft but only a bending force which was applied from a
threaded rod that fit through the end of the shaft. This made not only the build and design more
complex, but the analysis more complex as well since we would have to design for a pin that
could withstand the force applied and could potentially be a component that failed.
From here when we moved onto our simpler versions and eventually our final designs we
were much more successful at being able to analyze and build. If time, materials, and equipment
permitted there could potentially be some design choices that could be more effective than what
we were able to accomplish with our design and could in turn make the device much more
successful at completing its job. However, if you do not have access to the equipment and
29

Desktop Stress Demonstration Device
materials necessary, and if you have a short time frame then making sure your design is simple
and effective is the best way to succeed well.
STRAIN GAGE PROGRAM
The program was not completed in a functional manner, as such it should be recreated
with a usable interface from which users can gather and log data. The creation of a robust base
program, would allow students to further build on these inputs and outputs to form their own
interfaces that would meet their own specific needs.
VIBRATION AND RESONANCE FREQUENCY TESTING
We noted that during the devices use, some buildings were transmitting a vibration into
the device, causing an oscillation of the arm- we think it would be used for vibration and
resonant frequency learning, in addition to the bending and torsion.
HEIGHT ADJUSTABLE FEET
Most tables on which the device would be used, will have a flat top- but we would
suggest adding height adjustable feet to allow it’s use on any surface. Additionally, if the table
were not level, the feet could allow for leveling of the system, allowing greater accuracy to some
measurements.
30

Desktop Stress Demonstration Device
Appendix
Appendix A: Tables and Diagrams for the Design of the Device
31

Desktop Stress Demonstration Device
32

Desktop Stress Demonstration Device
33

Desktop Stress Demonstration Device
34
Desktop Stress Demonstration Device
35

Desktop Stress Demonstration Device
36

Desktop Stress Demonstration Device
37

Desktop Stress Demonstration Device
38
Desktop Stress Demonstration Device
39

Desktop Stress Demonstration Device
40

Desktop Stress Demonstration Device
41

Desktop Stress Demonstration Device
42
Desktop Stress Demonstration Device
43
Desktop Stress Demonstration Device
44

Desktop Stress Demonstration Device
45

Desktop Stress Demonstration Device
46
Desktop Stress Demonstration Device
47
Desktop Stress Demonstration Device
Appendix B: Mathcad Calculations for the Design of the Shaft
48
Desktop Stress Demonstration Device
49

Desktop Stress Demonstration Device
50

Desktop Stress Demonstration Device
51

Desktop Stress Demonstration Device
52

Desktop Stress Demonstration Device
53

Desktop Stress Demonstration Device
54

Desktop Stress Demonstration Device
55
Desktop Stress Demonstration Device
56
Desktop Stress Demonstration Device
57

Desktop Stress Demonstration Device
Appendix C: Photos of the final device
The final device with the addition of the hanging weight and the adjustable gripper arm.
A view of the adjustable gripper holding onto the back of a table
58

Desktop Stress Demonstration Device
Close up of the strain gages attached to measure both bending and torsional stresses.
The device under the effect of the maximum weight designed for (45lbf).
59

Desktop Stress Demonstration Device
Side view of the device under the effect of the maximum load designed for (45lbf).
The devices’ strain gages hooked up and being measured by a volt meter.
60