designing progressive and interactive analytics processes for high-dimensional data analysis
TRANSCRIPT

Cagatay Turkay
Erdem Kaya
Selim Balcisoy
Helwig Hauserwww.gicentre.net/vis2016
Designing Progressive and InteractiveAnalytics Processes for High-Dimensional Data Analysis

Visual analytics (VA) can be considered as an
interactive and iterative dialogue between the human and the computer where the interactive
analysis process is a sequence of actions by the user and responses by the computer motivated by an analytical question …
Based on several works, e.g., [Keim et al. 2008], [Green et al. 2008]

…. this iterative discourse serves as the fundamental mechanism through which analysts make observations
… we need to ensure that this dialogue takes place at a pace that respects the temporal cognitive capabilities of users …

Please wait,while I construct my next sentence ...

Card, S.K., Robertson, G.G. and Mackinlay, J.D., 1991, The information visualizer, an information workspace. In Proceedings of the ACM SIGCHI


THURSDAY, 4:15InfoVis: Scalable Algorithms

This paper …
… visual data analysis processes where a computational tool is integrated to support high-dimensional data analysis

… instead of forcing the user to wait for an interactive computation to finish, we present a best possible result within an acceptable time frame.
In essence ..
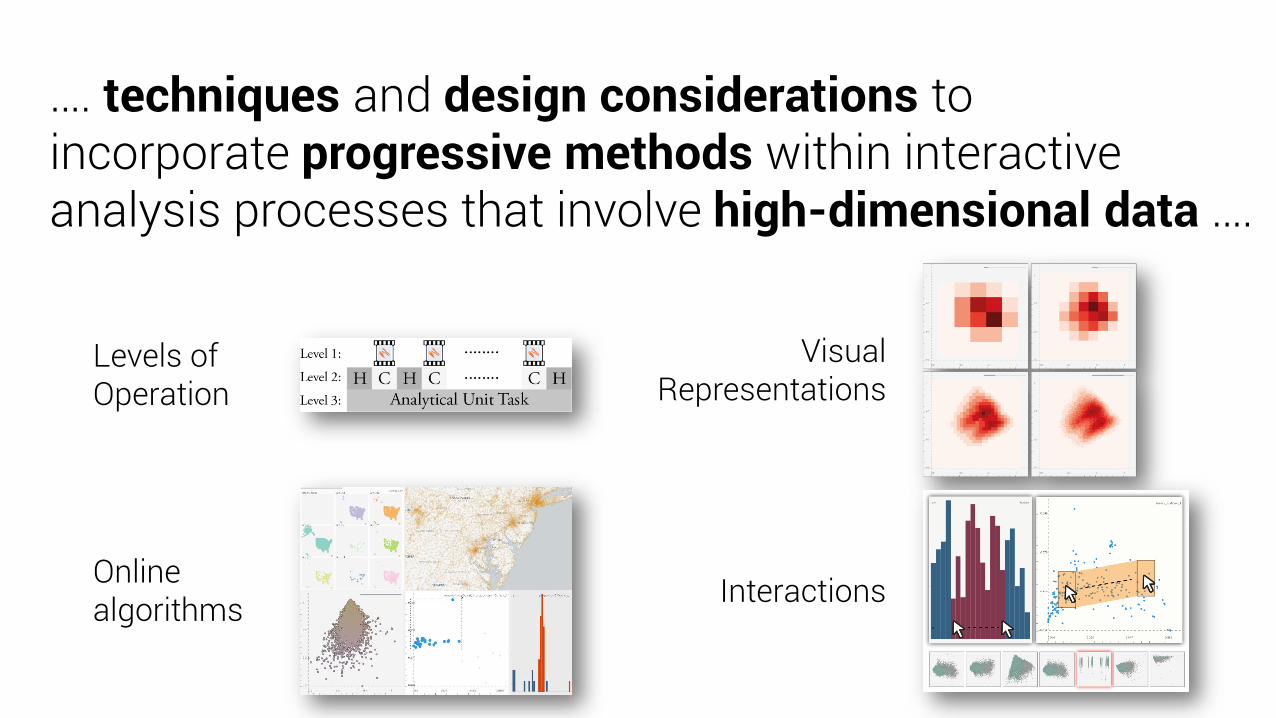
…. techniques and design considerations to incorporate progressive methods within interactiveanalysis processes that involve high-dimensional data ….
Online algorithms
Visual Representations
Levels of Operation
Interactions

Human time constants to govern the pace of interaction….

Levels of Operation
Level 1 (0.1 sec.)What: (animated) transitions between (computation) resultsWhy: ensures perceptually smooth transitions
Level 2 (1 sec.)What: guaranteed response time for intermediate resultsWhy: Maintains dialog nature
Level 3 (10 – 30 sec.)What: analytical unit task completionWhy: Answer a specific question
e.g. finding groups, locate outliers
A framework to implement human time constants

Integrating online algorithms
Can operate on small batches of data (on random sample subsets)
Produce approximate results
Updates can be done efficiently
Online PCA (Ross et al., 2008) Online clustering (Sculley et al., 2010)
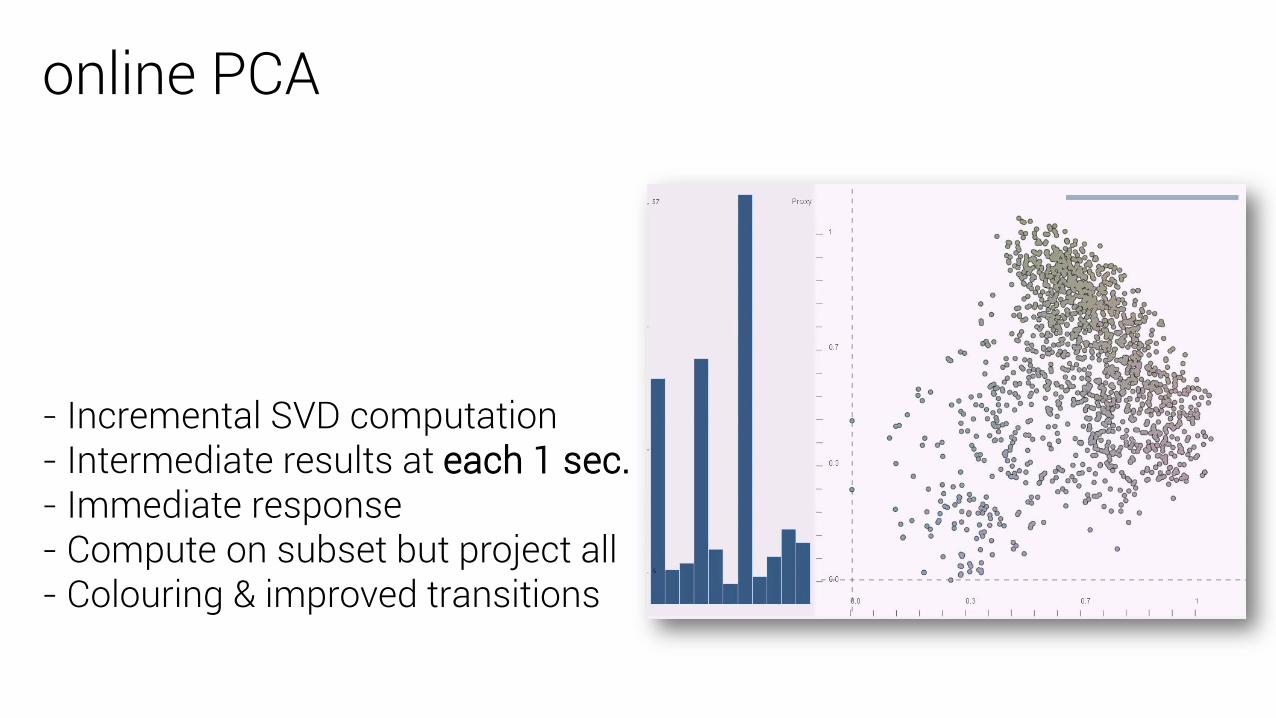
online PCA
- Incremental SVD computation- Intermediate results at each 1 sec.- Immediate response- Compute on subset but project all- Colouring & improved transitions

Adaptive random sampling
Guarantee response in a fixed period of time (i.e. 1 sec.)
Faster convergence
1st Batch size: %8 , Time taken: 0.3 sec.
2nd Batch size: %16, Time taken: 0.7 sec.
3rd Batch size: %33, Time taken: 1.3 sec.
4th Batch size: %25, Time taken: 0.9 sec.
5th Batch size: %25, Time taken: 0.9 sec.
Let’s say these are your data items
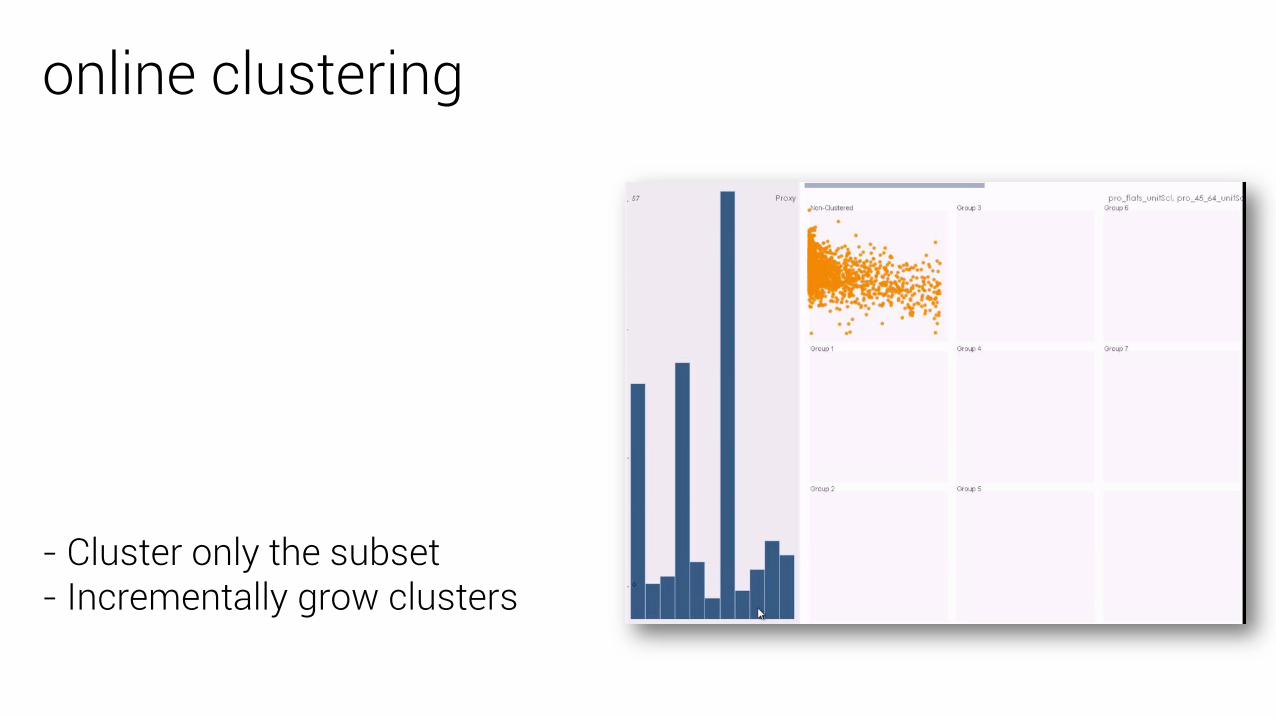
online clustering
- Cluster only the subset - Incrementally grow clusters

progress & certainty
Increasing sample size

Interaction methods to moderate the process
Key-framed brushing [Turkay, 2014]
Well-defined sequences that can be represented in 30 sec.
Help define analytical unit task

Evalution WorkshopsProblem: Credit card transactions segmentation -- groups of expenditures with similar
characteristics
Data: 300K+ CC transactions, 5K customers (demog., location, financial metrics, etc.)
Methodology:
- 2-months long case study, 4 analysis session
(1 for training) with 4 CRM analyst
- Fly-on-the-wall observations
- Semi-structured interviews
- Video and sound recorded, renounce times noted,
32 hours of video processed for the extraction
of inference moments and quotes transcribed.
- Insights, questions, hypothesis identified

Observed/reported positive aspects
- Generation and verification of hypotheses in short time
. . . . .
. . . . .
. . . . .

Observed/reported positive aspects
- Generation and verification of hypotheses in short time- Continuous engagement
“We could generate so many new hypotheses in a very short time without waiting for the whole calculation to end.”
“..., [Visualization] is quite engaging as we don’t have to wait for even a moment to get some initial results.”

Observed/reported positive aspects
- Generation and verification of hypotheses in short time- Continuous engagement- Stability is key in decisions
“ … It seems like the clustering will not change. ... let’s switch to some other set …

Observed/reported issues- Continuous update of the visualization can be distracting
“... it can be distracting to look at an ever-changing visualization. [If we were] able to set the step size, … then we can have some time to talk about intermediate results.”
- Uncertainty and unstability is an issue“…. I’ve just seen a high response score for the selected cluster, but it has just
gone away. “
- Early decisions might be wrong
- Multiple views operating concurrently can be problematicUnaligned convergence
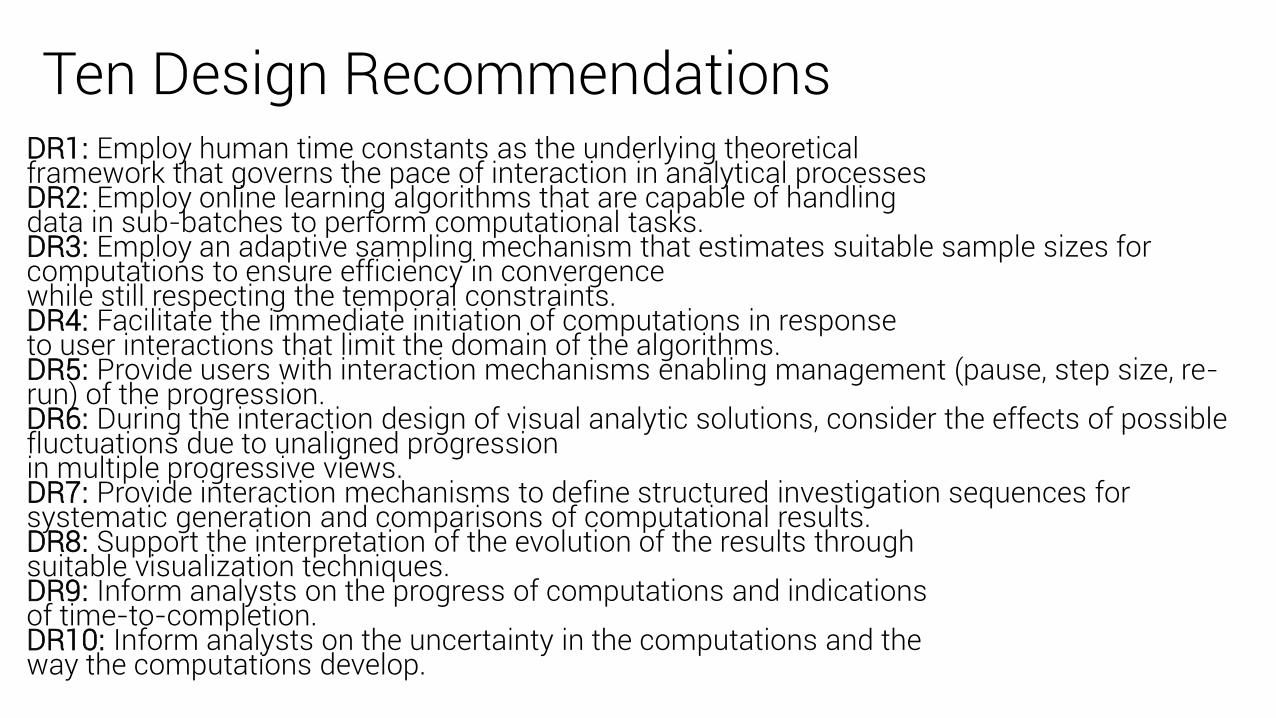
Ten Design RecommendationsDR1: Employ human time constants as the underlying theoreticalframework that governs the pace of interaction in analytical processes DR2: Employ online learning algorithms that are capable of handlingdata in sub-batches to perform computational tasks. DR3: Employ an adaptive sampling mechanism that estimates suitable sample sizes for computations to ensure efficiency in convergencewhile still respecting the temporal constraints. DR4: Facilitate the immediate initiation of computations in responseto user interactions that limit the domain of the algorithms. DR5: Provide users with interaction mechanisms enabling management (pause, step size, re-run) of the progression. DR6: During the interaction design of visual analytic solutions, consider the effects of possible fluctuations due to unaligned progressionin multiple progressive views. DR7: Provide interaction mechanisms to define structured investigation sequences for systematic generation and comparisons of computational results. DR8: Support the interpretation of the evolution of the results throughsuitable visualization techniques. DR9: Inform analysts on the progress of computations and indicationsof time-to-completion. DR10: Inform analysts on the uncertainty in the computations and theway the computations develop.

Future challenges & opportunities
Better heuristics/quality metrics
Reproducibility?
- different samples in each run
Provenance

…. instead of forcing the user to adjust to the temporal and cognitive capabilities of visual analysis solutions, we orient the technical solutions at the communication characteristics of the users.
To conclude …

Cagatay Turkay
Erdem Kaya
Selim Balcisoy
Helwig Hauser
Designing Progressive and InteractiveAnalytics Processes for High-Dimensional Data Analysis
Full list of giCentre VIS 2016 contributions
www.gicentre.net/vis2016