designing a lighting, power and protection system...
TRANSCRIPT

UNIVERSITY OF NAIROBI
FACULTY OF ENGINEERING
DEPARTMENT OF ELECTRICAL AND INFORMATION
ENGINEERING.
DESIGNING A LIGHTING, POWER AND PROTECTION
SYSTEM OF A RESIDENTIAL ESTATE.
PROJECT INDEX: PRJ 059
BY
MIRANG’A VALENTINE MOKEIRA
F17/40230/2011
SUPERVISOR: PROF. N. O. ABUNGU
EXAMINER: MR. C. OMBURA
PROJECT REPORT SUBMITTED IN PARTIAL FULFILMENT OF THE
REQUIREMENT FOR THE AWARD OF THE DEGREE
OF
BACHELOR OF SCIENCE IN ELECTRICAL AND ELECTRONIC ENGINEERING OF
THE UNIVERSITY OF NAIROBI
SUBMITTED ON: 16TH MAY 2016

DEDICATION
I dedicate this report to my parents and my brothers for the support and love they have
given me.

DECLARATION AND CERTIFICATION
COLLEGE OF ARCHITECTURE AND ENGINEERING
FACULTY/SCHOOL/INSTITUTE: ENGINEERING
DEPARTMENT: ELECTRICAL AND INFORMATION ENGINEERING
NAME OF STUDENT: MIRANG’A VALENTINE MOKEIRA
REGISTRATION NUMBER: F17/40230/2011
TITLE OF THE WORK: DESIGNING A LIGHTING, POWER AND PROTECTION SYSTEM
OF A RESIDENTIAL ESTATE.
DECLARATION
1. I understand what Plagiarism is and I am aware of the University’s policy in this regard
2. I declare that this assignment is my original work and has not been submitted elsewhere for
examination, award of a degree or publication. Where other people’s work, or my own work has
been used, this has properly been acknowledged and referenced in accordance with the University
of Nairobi’s requirements.
3. I have not sought or used the services of any professional agencies to produce this work
4. I have not allowed, and shall not allow anyone to copy my work with the intention of passing it
off as his/her own work
5. I understand that any false claim in respect of this work shall result in disciplinary action, in
accordance with University Plagiarism Policy.
Signature:
……………………………………………………………………………………….
Date:
……………………………………………………………………………………….

ACKNOWLEDGEMENT
I thank God for the continued strength, knowledge, understanding and good health and for seeing
me this far through my undergraduate degree.
I want to sincerely appreciate my supervisor Prof. Nicodemus Abungu Odero for the guidance and
constructive criticism that he had offered all through development of my project up to its completion.
To my friends, my sincere gratitude for both moral and technical support you extended with
respect to resources shared, time and words of encouragement.
To my family, from whom I have received the usual warm support without which this report
wouldn’t have been written.
And finally I would like to thank the Department of Electrical and Electronics Engineering
at the University of Nairobi, which has instilled in me the knowledge and discipline to pursue
a career in electrical engineering.

34
TABLE OF CONTENTS
CONTENTS
DEDICATION ........................................................................................................................... 2
DECLARATION AND CERTIFICATION ........................................................................... 3
ACKNOWLEDGEMENT ........................................................................................................ 4
TABLE OF CONTENTS ........................................................................................................... i
LIST OF TABLES .................................................................................................................... v
LIST OF FIGURES ................................................................................................................. vi
LIST OF ABBREVIATIONS ................................................................................................. vii
ABSTRACT ............................................................................................................................ viii
Chapter 1 ....................................................................................................................................... 1
1.1 INTRODUCTION ............................................................................................................... 1
1.2 OBJECTIVES ..................................................................................................................... 2
Chapter 2 ....................................................................................................................................... 3
2.1 LIGHT .................................................................................................................................. 3
2.1.1 PHOTOMERTIC QUANTITIES ............................................................................... 4
2.2 LIGHTING .......................................................................................................................... 4
2.2.1 LIGHTING SCHEMES ............................................................................................... 5
2.2.2 CALCULATING NUMBER OF FIXTURES ............................................................ 6
Chapter 3 ....................................................................................................................................... 8
3.1 POWER DISTRIBUTION ................................................................................................. 8
3.1.1 POWER DISTRIBUTION BETWEEN BUILDINGS .............................................. 8
3.1.2 POWER DISTRIBUTION WITHIN LARGE BUILDINGS ................................... 9
3.1.3 POWER DISTRIBUTION IN DOMESTIC BUILDINGS ....................................... 9
3.2 DISTRIBUTION BOARD (D.B) ........................................................................................ 9

3.3 CONSUMER UNIT (C.U) .................................................................................................. 9
3.4 SWITCHES ....................................................................................................................... 10
3.5 SOCKETS .......................................................................................................................... 10
3.6 CIRCUITS ......................................................................................................................... 11
3.6.1 SOCKET CIRCUITS ................................................................................................. 11
3.6.2 LIGHTING CIRCUITS ............................................................................................. 13
3.7 CABLE SIZING ................................................................................................................ 14
Chapter 4 ..................................................................................................................................... 15
4.1 PROTECTION .................................................................................................................. 15
4.1.1 PROTECTION AGAINST OVERCURRENT. ....................................................... 15
4.1.2 PROTECTION AGAINST LIGHTNING. .............................................................. 15
4.2 DISCRIMINATION.......................................................................................................... 16
4.3 POWER FACTOR CORRECTION ............................................................................... 17
4.4 GENERATORS ................................................................................................................. 17
Chapter 5 ..................................................................................................................................... 19
5.1 DESIGN SPECIFICATIONS. ......................................................................................... 19
5.1.1 LIGHT FITTINGS. .................................................................................................... 19
5.1.2 SWITCHES ................................................................................................................. 20
5.1.3 SOCKET OUTLETS .................................................................................................. 20
5.1.4 TELEVISION AND DATA POINTS ........................................................................ 20
5.1.5 SINGLE PHASE LOADS .......................................................................................... 21
5.2 DESIGN.............................................................................................................................. 21
5.2.1 LIGHT DESIGN IN HOUSING UNITS .................................................................. 21
5.2.2 ROAD LIGHTING DESIGN .................................................................................... 25
5.3 LOAD CALCULATION IN HOUSING UNITS ............................................................ 27

5.3.1 LOAD CALCULATION IN UNIT A2 ..................................................................... 27
5.4 SUMMERY OF LOAD IN THE ESTATE ..................................................................... 28
5.4.1 HOUSING UNIT A2 .................................................................................................. 29
5.4.2 HOUSING UNIT B2 ................................................................................................... 29
5.4.2 HOUSING UNIT C2 .................................................................................................. 31
5.4.3 TOTAL LOAD IN THE WHOLE ESTATE ........................................................... 32
5.4 CIRCUIT BREAKERS AND CONSUMER UNITS ..................................................... 32
5.4.1 CIRCUIT BREAKERS IN HOUSING UNITS ....................................................... 32
5.4.2 CONSUMER UNITS .................................................................................................. 34
5.5 SERVICE TURRETS ....................................................................................................... 35
5.6 CONSUMER UNIT CABLE SIZING. ............................................................................ 36
5.6.1 CABLE SIZING FOR CU-A2-1 ................................................................................ 37
5.7 SERVICE TURRET CABLE SIZING ............................................................................ 40
5.7.1 CABLES FEEDING SERVICE TURRET 1. .......................................................... 40
Chapter 6 ..................................................................................................................................... 41
6.1 TRANSFORMER SIZE ................................................................................................... 41
6.1.1 TRANSFORMER 1 TOTAL LOAD ........................................................................ 41
6.1.2 TRANSFORMER 2 TOTAL LOAD ........................................................................ 42
6.2 BACKUP GENERATOR ................................................................................................. 42
6.2.1 CAPACITY OF THE STANDBY GENERATOR .................................................. 42
6.2.2 CABLE SIZE OF THE STANDBY GENERATOR ............................................... 43
6.3 ELECTRICAL DISTRIBUTION SYSTEM RETICULATION. ................................. 45
6.4 POWER FACTOR CORRECTION ............................................................................... 46
6.5 DETERMINATION OF PROSPECTIVE FAULT CURRENTS ................................ 46
6.5.1 FAULT CURRENT AT THE SWITCHBOARD LEVEL ..................................... 46

6.5.2 FAULT CURRENT AT THE BEGINNING OF THE FINAL CIRCUITS ......... 48
6.6 DISCRIMINATION.......................................................................................................... 51
6.6.1 DISCRIMINATION BETWEEN CONSUMER UNITS AND SERVICE
TURRETS ........................................................................................................................... .51
6.6.2DISCRIMINATION BETWEEN SERVICE TURRETS AND LV SWITCH
BOARD….. ........................................................................................................................... 54
6.6.3DISCRIMINATION BETWEEN GENERATOR MCCB AND LV
SWITCHBOARD…. ........................................................................................................... 54
6.7 LIGHTNING PROTECTION ......................................................................................... 56
Chapter 7 ..................................................................................................................................... 57
7.1 RECOMMENDATIONS FOR FUTURE WORK ......................................................... 57
7.2 CONCLUSION .................................................................................................................. 57
APPENDIX 1: LIGHT DESIGN ........................................................................................... 59
APPENDIX 2: LOAD CALCULATIONS ............................................................................ 63
APPENDIX 3: CATALOGUES ............................................................................................. 67
REFERENCES ........................................................................................................................ 73

LIST OF TABLES
TABLE 2-1 COLOUR RENDERING INDEX. .......................................................................... 3
TABLE 3-1 RECOMMENDED NUMBER OF SOCKETS IN A ROOM ............................ 11
TABLE 5-1. TYPES OF LUMINAIRES USED....................................................................... 19
TABLE 5-2. CALCULATION OF MAXIMUM DEMAND IN UNIT A2 ............................ 28
TABLE 5-3 SUMMERY OF LOADS IN UNIT A2 ................................................................. 29
TABLE 5-4 SUMMERY OF LOADS IN UNIT B2 ................................................................. 29
TABLE 5-5 SUMMERY OF LOADS IN UNIT C2 ................................................................. 31
TABLE 5-6 SUMMERY OF LOADS IN THE ESTATE ....................................................... 32
TABLE 5-7 : MCBS IN DB-A2-1 .............................................................................................. 34
TABLE 5-8 CABLE SIZES USED FOR CONSUMER UNITS ............................................. 38
TABLE 5-9 CABLE SIZES FOR SERVICE TURRETS ....................................................... 40
TABLE 6-1 DISTRIBUTION OF LOADS IN TRANSFORMER 1 ...................................... 41
TABLE 6-2 DISTRIBUTION OF LOADS IN TRANSFORMER 2 ...................................... 42
TABLE 6-3 PROSPECTIVE FAULT LEVELS FOR THE CONSUMER UNITS ............. 49
TABLE 6-4 DISCRIMINATION BETWEEN CUS AND THEIR RESPECTIVE SERVICE
TURRETS .................................................................................................................................... 52
TABLE 6-5 DISCRIMINATION BETWEEN SERVICE TURRETS AND THE LOW
VOLTAGE SWITCHBOARD. .................................................................................................. 54
TABLE 6-6 GENERATOR 1 PHASE CURRENTS ............................................................... 54
TABLE 6-7 GENERATOR 2 PHASE CURRENTS ............................................................... 55

LIST OF FIGURES
FIGURE 2-1 POINT BY POINT METHOD ON VERTICAL SCALE .................................. 7
FIGURE 3-1. CONSUMER UNIT ............................................................................................ 10
FIGURE 3-2. RING CIRCUIT CONNECTION ..................................................................... 12
FIGURE 3-3. RADIAL CIRCUIT CONNECTION ................................................................ 13
FIGURE 3-4 LOOP-IN SYSTEM OF WIRING...................................................................... 14
FIGURE 5-1. LUMINAIRE ARRANGEMENT IN LOUNGE .............................................. 23
FIGURE 5-2. POINT BY POINT METHOD FOR A PAINTING ON A WALL ................ 24
FIGURE 5-3 CONSUMER UNIT ARRANGEMENT FOR CU-A2-1 .................................. 35
FIGURE 6-1 CABLES FEEDING THE GENERATOR ........................................................ 44
FIGURE 6-2 ELECTRICAL DISTRIBUTION SYSTEM RETICULATION FOR
TRANSFORMER 1 .................................................................................................................... 45
FIGURE 6-3 ELECTRICAL DISTRIBUTION SYSTEM RETICULATION FOR
TRANSFORMER 2 .................................................................................................................... 45
FIGURE 6-4 POWER FACTOR CORRECTION DIAGRAM ............................................. 46
FIGURE 6-5 LAYOUT FOR FAULT CALCULATION ....................................................... 48
FIGURE 6-6 LIGHTNING PROTECTION LAYOUT FOR UNIT A2 ................................ 56

LIST OF ABBREVIATIONS
KV: Kilovolts
A: Amperes
IEE: Institute of Electrical Engineers
KVA: Kilovolt amperes
KW: Kilowatts
CU: Consumer unit
DB : Distribution board
CB: Circuit breaker
PVC: Polyvinyl Chloride
IES: Illuminating Engineering Society
E: Illuminance
I: Luminous intensity
LCW: Wall luminance coefficient
W: Watts
KPLC: Kenya Power and Lighting Company
Ω: Unit of measurement of resistance
Z: Impedance
X: Reactance
mm: Millimeter
m: Meter
MCB: Miniature circuit breaker
MCCB: Moulded case circuit breaker
SP: Single pole
DP: Double pole
TX: Transformer
SPN: Single phase neutral
TPN: Three phase neutral
p.u: Per unit
kA: kilo ampere

ABSTRACT
This project was aimed at designing an efficient lighting, distribution and protection system for a
residential estate in Juja. The estate had 3 types of houses namely type A2, B2 and C2. The total
number of units in the estate was 75. Literature review on lighting, distribution and protection was
first done. Next, lighting design was done using the lumen method which was used to find the
number of luminaires required and the point-by-point method was used to calculate the illuminance
at a point. Street lighting was also done using IESNA [4] guidelines and the distance between each
luminaire was found to be 31m.
Power outlets design was according to the IEE regulations. The design covered socket outlets and
single phase load outlets. The load in each area was determined and assigned to the respective
consumer units and service turrets. Diversity was taken into account in load calculations and future
load growth catered for by including spare ways.
Sizes of breakers that protect final circuits were determined and the details of consumer units
drawn.
The total load of the estate was 1701.38 kVA the load was split into two load 1 with a total load
of 908.95 kVA and load 2 with a total load of 792.43 kVA. Two pad mounted transformers rated
1000 kVA with a reactance of 4.75% per unit to be used to supply the estate.
Using the load currents in each consumer unit, load balancing was achieved. The load current in
transformer 1 was 3219A and for transformer 2 was 2806.31A. Service turrets were assigned. 10
service turrets were used to cater for the loads in the estate. The sizes of cables that feed consumer
units, service turrets, the switch board and generator were determined using the Bahra Cables
Company catalogue. Voltage drop of 6% was set as the maximum limit.
An electrical distribution reticulation layout was designed showing distribution in the whole
building. Two 1000 KVA generator were used for back-up. Protection was tackled by calculation
of fault currents at various levels in the distribution to the houses. Discrimination was tackled using
the fault currents and the breaker ratings. Using the values of the breaker ratings obtained, a
distribution layout was designed from the consumer level (downstream) to the transformer level
(upstream). Lightning protection was done by the use of lightning arrestors. Power factor
correction was done. Finally, recommendations for future work were detailed and a conclusion
written. A list of references was also outlined. The appendix was put in place for reference.

1
Chapter 1
1.1 INTRODUCTION
Light plays a vital role in the quality of our daily lives. Light is basically radiation that is capable
of producing visual sensation. Every day activities require light. At work, in offices, good lighting
brings employee satisfaction, good performance, comfort and safety thus improving the economy
by extending working hours and enables continued activity in various areas. In shops, galleries
and public places, good lighting accentuates the architectural environment. At home, it brings
comfort, provides a safe welcoming environment and lights the day to day tasks. This calls for
attention to ensuring that efficient lighting is achieved.
Daylight was the main source of light in the earlier days but due to the advancement of artificial
light, daylight is constantly being phased out since artificial lighting is more efficient, has variety
of uses and is very reliable. Advanced artificial light sources and luminaires are currently available
as provided by manufacturers catalogues hence the need to incorporate them in lighting.
Distribution aims at ensuring supply of electricity to the necessary areas. The main purpose of an
electrical distribution system is to meet the customer’s demand of energy after receiving the bulk
supply of electrical energy from the transmission or sub-transmission station. Factors considered
while determining a distribution system include the type of demand, the load characteristics, type
of area and the load factor. The distribution system should be placed and sized carefully so as to
serve the maximum load possible. An efficient distribution system can be costly thus it is important
that a beneficial yet economical distribution system is achieved.
Electricity can be dangerous hence safety is a key factor. Proper protective measures, for the
building and its users, have to be put in place. Electrical protection is installed to isolate the faulty
part of the electric system hence preventing further damage of equipment and accidents for the
personnel handling the equipment. Some of the factors to be taken into account while selecting
protection equipment are speed, selectivity, reliability and also cost.

2
1.2 OBJECTIVES
The objectives of this project hence included:
i. Coming up with efficient lighting schemes for each housing unit in the residential estate
and also outdoor areas within the estate.
ii. Power distribution: this included the placement of the lighting points, electrical power
points, data points and consumer units, and their electrical connection and also sizing of
the various cables that fed the final circuits.
iii. Protection: this included protection of loads and cables from short circuit and overload and
lightning protection.
iv. Sizing of the various cables that were used in the electrical system.
v. Provision of a backup system for the area.
vi. Power factor correction
vii. Discrimination between various load centers.
Since this project focuses on a residential estate, the comfort, safety and security of the people and
are had to be focused on. The method of investigation applied is research. Sources of information
include books, the internet and people.

3
Chapter 2
2.1 LIGHT
Light is the part of the electromagnetic spectrum that can be perceived by the human eye. It is
closely related to other forms of electromagnetic radiation such as radio waves, micro waves, infra-
red, ultra-violet radiation and x-rays. The difference between the various forms of electromagnetic
radiation is in their wave lengths. Radiation with wavelengths between 380-780 nanometers forms
the visible part of the electromagnetic spectrum referred to as light. Light may be characterized in
terms of behavior and color. [1]
i. Behavior: The behavioral characteristics of light include; reflection, absorption,
transmission, refraction and interference.
ii. Colour: Colour is what distinguishes different wavelengths of light. It involves the spectral
characteristics of light itself, the spectral reflectance of the illuminated surface as well as
the perception of the observer. The properties of colour used in lighting include, colour
rendering ability and colour temperature.[1]
Table 2-1 Colour rendering index.
Colour rendering index Ra Colour rendering Properties
90-100 Excellent colour rendering properties
80-90 Good colour rendering properties
60-80 Moderate colour rendering properties
< 60 Poor colour rendering properties

4
2.1.1 PHOTOMERTIC QUANTITIES
These are the photometric units used for quantitative measurement of light.
i. Luminous flux Ф - This expresses the total quantity of light radiated per second by a light
source. SI units of luminous flux is lumen. (lm)
ii. Luminous Intensity I – Defined as flux of light emitted in a certain direction. The SI unit
of luminous intensity is candela. (cd)
iii. Illuminance E – Quantity of light falling on a unit area of a surface. SI unit is lumen/squared
meter lm/m2 or lux (lx). [1]
iv. Luminance L- Describes the light emitted from a unit area in a specific direction. SI unit is
candela/ squared meter cd/m2.
v. Luminous efficacy- Total luminous flux of a light source for each watt of power supplied
to the source. Measured in lumen/watt.[1]
2.2 LIGHTING
Lighting basically refers to the application of light. Types of lighting include:
Day lighting
It is mainly direct sunlight. Daylight illuminances are significantly higher than the illuminances
produced by artificial lighting. Entire buildings and individual rooms were inclined to the
incidence of the sun’s rays so as to get maximum illumination in the room. The disadvantage was
that there was unreliability as some areas had too much sunshine while others very little sunshine.
[3]
Artificial Lighting
Lamps and luminaires are the main sources of artificial lighting. Artificial lighting also provides
aesthetic value apart from meeting visual needs.
Good quality lighting is an important as is affects our ability to perform tasks. In order to design
an effective lighting system the following factors have to be considered; lighting level, luminous
contrasts, glare, spatial distribution of the light and colour. [1]

5
2.2.1 LIGHTING SCHEMES
Lighting schemes are ways in which a place can be lit. To design an efficient lighting scheme, we
have to consider the use of the room, duration of light usage, location of the area to be lit e.g.
indoors or outdoors and the mood to be created.
2.2.1.1 INTERIOR LIGHTING SCHEMES
This aims at providing general lighting, task lighting and decoration. Indoor lighting can use
battens (fluorescents), down lights, recessed lights, spotlights and track lights, surface mounted
and suspended luminaires and wall mounted luminaires.
2.2.1.2 EXTERIOR LIGHTING SCHEMES.
Outdoor lighting design can use spotlights, strip lights, backlights, floodlights, wall-mounted
luminaires, recessed architectural floodlights, surface mounted architectural floodlights among
others. It is applied on street lights, security lights, entry lights, signage and advertisement.
Road Lighting Design
The main aim of road lighting design is to provide patterns and sufficient levels of horizontal
pavement luminance and horizontal and vertical illuminance of objects. Factors to take into
consideration include; pedestrian conflict, luminaire arrangement style and roadway classification.
[5]
The method used to calculate average illuminance is known as the illuminance method and is given
by the equation below
x WS
LL MFUFEav
Where: Eav = average horizontal Illuminance in lux
LL = Lumen per fixture in lumens
MF = maintenance factor
UF = utilisation factor
S = luminaire spacing
W = Road width. [4]

6
2.2.2 CALCULATING NUMBER OF FIXTURES
The methods employed in finding the level of light in interior and exterior spaces include:
The lumen method
The point-to-point method.
2.2.2.1 THE LUMEN METHOD
It is a simplified method used in interior lighting design to calculate the light level in a room. This
enables us to estimate the costs. The steps involved are:
The room index (K) of the space has to be calculated using:
)WL(H
WLK
m
Where: K = room index (describes the influence of room geometry)
Hm = mounting height in meters
L = length of the room in meters
W = width of the room in meters [15].
The number of fixtures can be given by: A
LN
MFUFE
Where: E = Illuminance in lux
N = number of fittings
L = Lumen per fixture in lumens
MF = maintenance factor
UF = utilisation factor
A = area in mm2
Illuminance is the total flux per area. It measure the concentration of light on a surface
Maintenance factor (also called the light loss factor) refers to the reduction of luminous flux for
a source. Lamp output declines with time. Dirt is a major cause of this reduction.
Utilisation factor is a calculated ratio of the lumens effectively lighting an area to the total
available lumens from the lamp. Light is absorbed by surfaces causing a reduction in the lumens.
[4]

7
2.2.2.2 THE POINT-BY-POINT METHOD
The point-by-point is used to calculate the effect of individual luminaires at particular points. The
luminaire photometric data has to be known. The inverse square method is used to calculate
illuminance at a point. [4]
Inverse Square Method
This method is used when the distance from the source is at least 5 times the maximum dimension
of the source. In this method illuminance is directly proportional to the candle power of the source
in a given direction (luminous intensity) and inversely proportional to the square of the distance
from the source. [4]
E= I
D2
For a vertical plane, shown in figure 2-2 below,
H
R
D
Figure 2-1 point by point method on vertical scale
E = I x sin 𝜃 since, sin θ = cos β. Since D2 = H2
D2 Cos2 θ
E = I x sin θ x cos2 θ
H2
Where D - The actual distance from the light source to the point.
R - The horizontal distance from light source to the point
H – The mounting height from the point to the source. [4]

8
Chapter 3
3.1 POWER DISTRIBUTION
Electricity is supplied to a building by a supply authority. In Kenya, KPLC is in charge of
supplying electricity to all buildings. Power is generated at the generating stations in ranges of 11
kV to 25 kV using three-phase alternators. Energy sources include geothermal, hydro reservoirs,
fossil fuels, solar, wind and tides. [6]
The generated voltage is stepped up to ranges of 220 kV to 400 kV for transmission. At the
transmission substations, power is stepped down to voltages in the range of 11kV to 132 kV. For
distribution to high and medium consumers such as heavy industries, voltages of 66 kV or 33 kV
is supplied. For some medium and low industries voltages of 33 kV or 11 kV are supplied. For
distribution to domestic consumers, power is stepped down at the distribution substation to 415 V
(three-phase). Three-phase four-wire and single phase distribution can be achieved here due to the
use of star transformers. The mode of transmission commonly used is overhead transmission.
Underground transmission finds use in heavily populated areas. [6]
3.1.1 POWER DISTRIBUTION BETWEEN BUILDINGS
While distributing power from one building to another, ring or radial distribution systems are used.
Ring or loop system: Underground cable is laid from the substation to loops to each building then
taken back to the substation. Current flows in both directions from the intake. If the cable on the
ring is damaged at any point, it can be isolated for repair without loss of supply to any of the
buildings.
Radial system: Separate underground cables are laid from the substation to each building. It uses
more cable than the ring but only one fused switch is required below the distribution board in each
building.

9
3.1.2 POWER DISTRIBUTION WITHIN LARGE BUILDINGS
In large industries space can be allocated for an 11kV to 415kV step-down transformer. It should
be sited as near as possible to the heaviest loads so as to avoid long runs of expensive low-voltage
cables. Power from the transformer goes to a switchboard first. The switchboard has panels each
of which contains switches that allow electricity to be redirected to load areas. From the
switchboard, power then goes to distribution board then fed to various loads. [8]
3.1.3 POWER DISTRIBUTION IN DOMESTIC BUILDINGS
Power is mostly supplied to buildings through underground cabling (underground service entry)
to a suitable point in the building referred to as the main intake. The position of the entry of the
supply cable should be convenient, safe and secure. The length of the service cable should be
minimized to reduce heating and to ensure less reactive power. Single phase supply is used unless
a three-phase equipment is to be used. Protection at the incoming service cable position is with a
service fuse (high breaking capacity (HBC) fuse). Other equipment at this position are the
energy meter and the consumer’s distribution unit. [8]
3.2 DISTRIBUTION BOARD (D.B)
The distribution board (or a panel board) is a unit which ensures the distribution and comprises
one or more protective devices in an enclosure. Distribution board can be supplied by the
switchboard or another distribution board. They have an incoming integral isolator for protection.
[8]
3.3 CONSUMER UNIT (C.U)
The consumer unit CU or consumer control unit CCU can be described as the consumer’s power
supply control unit. They are incorporated with a double pole isolating switch on the incoming
side. CUs are available with 60A or 100A isolators and up to 12 fuse ways or CBs. Each way is
connected to a single circuit and individual circuit protection is used. Breaker rating is in
accordance with the circuit function. Consumer units can be fed from the distribution board or
other consumer units. Figure 2 shows various circuits in a C.U, together with the main isolator and

10
a spare way. Consumer units have protection against residual currents in addition to miniature
circuit breakers MCBs for each individual circuit. [6]
Figure 3-1. Consumer unit
3.4 SWITCHES
A switch is a device used to make or break a circuit. There is a maximum current which the contacts
of a particular switch can make or break and a maximum voltage that the contact gap can withstand.
A switch must not be put in a circuit which carries a greater current than the switch can break. The
standard capacities by most manufacturers are 5A, 15A, 20A and a higher rating of 45A. [8]
3.5 SOCKETS
Socket outlets are the major outlets for power services. Great Britain standards use sockets that are
designed to accept 13A plugs. Sockets are available with or without switches. Sockets without
switches have their contacts permanently connected to the wiring and thus are permanently live.
Those with switches must be switched on for the contacts to close. Special sockets installed in
domestic houses include, shaving outlets, cooker control units, television and telephone outlets.
[8]
IEE wiring regulations BS 7671 recommends usage of 13A plugs and socket outlets for low
voltage applications. The mounting height of the sockets 150mm above finished floor or work

11
surface as a minimum. Sufficient number of socket outlets should be provided so that long flexible
cords are avoided. [9]
Modern Wiring Practice [7] chapter on design and arrangement of final circuits shows the
recommended minimum number of 13A twin socket outlets that should be installed in a domestic
premises according to The Electrical Installation Industry Liaison Committee. Table 3-1 below
shows the minimum number of twin socket outlets to be provided in homes as recommended by
the committee.
Table 3-1 Recommended number of sockets in a room
ROOM TYPE MINIMUM NUMBER OF TWIN SOCKETS
Main living room 6
Dining room 3
Single bedroom 3
Double bedroom 4
Study room 3
Kitchen 4
Hallway 1
3.6 CIRCUITS
3.6.1 SOCKET CIRCUITS
Final outlets of an electric system in a building are lighting points, sockets and fixed equipment.
A fuse or circuit breaker can serve several outlets. For socket outlets, ring or radial circuit
arrangements are used. [8]
Ring Circuit.
A ring circuit is one that forms a closed loop. It starts at one of the fuse ways in the distribution
board runs to a number of outlets one after another and returns to the distribution board. According

12
to ONSITE GUIDE BS 7671 [9] Appendix 8 IEE regulations recommend an unlimited number of
socket outlets connected to a ring final circuit serving a floor area not exceeding 100 m2 wired with
2.5 mm2 PVC insulated cables and protected by a 30 A or 32 A overcurrent protective device. The
diagram in figure 3 illustrates a ring circuit.
The advantage of this arrangement is that current can flow from the fuse way to the outlets along
both halves of the rings so that at any one point the cable carries only part of the total current being
taken by the whole circuit. This is the feature that makes it possible for the fuse rating to be greater
than the cable current rating the fuse carries the sum of the currents in the two halves and will
blow when the current is about half the current rating of the fuse.
Radial Circuit.
In the radial circuit, the wiring starts at the distribution boards fuse ways, connects each device in
turn and terminates at the last available socket as shown in figure 4. Radial circuits are more
economical than the ring circuit since they use less length of cables. According to ONSITE
GUIDE BS 7671 [9] Appendix 8 IEE regulations recommend an unlimited number of socket
outlets connected to a radial final circuit serving a floor area not exceeding 50 m2 wired with 4
mm2 PVC insulated cables and protected by a 30 A or 32 A overcurrent protective device.
Figure 3-2. Ring circuit connection

13
3.6.2 LIGHTING CIRCUITS
These are circuits that show how light fittings are connected. They are categorized into two:
Junction box circuit
This is where there is a junction box for each light. A cable runs from the consumer unit to the first
junction box, then to the next until it terminates at the last junction box. Another cable runs from
each junction box to its light and another wire from the junction box to the light switch. [6]
Loop-in circuit
This is where a cable runs from light to light terminating at the last light (as in radial), then a single
cable runs from the lights to the light switches. Figure 3-4 illustrates the loop in system of wiring.
[6]
Figure 3-3. Radial circuit connection

14
3.7 CABLE SIZING
The size of the cables to be used in a given circuit is governed by the current which the circuit has
to carry. A conductor carrying a current is bound to have some losses due to its own resistance.
These losses appear as heat and will raise the temperature of the insulation. The current the cable
can carry is limited by the temperature by which it is safe to raise the insulation. [8]
IEE regulations concerning the maximum allowable current for each type and size of cable is given
in ON SITE GUIDE BS 7671 [9The resistance of the conductor also results in a drop of voltage
along its length thus the voltage at the receiving end is less than that at the sending end. Since all
electric equipment used in the building is designed to operate on the nominal supply voltage, it is
necessary to limit the amount by which the voltage drops between the point of entry into the
building and the outlet serving an appliance. IEE guide limits the voltage drop to 3% of the nominal
voltage for lighting circuits and 5 % of nominal voltage for socket outlets. [9]
Figure 3-4 Loop-in system of wiring

15
Chapter 4
4.1 PROTECTION
In the designing of an electrical system, a large part is concerned with ensuring that accidents do
not happen and if they do, their effects will be limited. The general principal of protection is that
a faulty circuit should be cut-off from the supply and isolated until the fault can be found and
repaired. The protective device is the tool that detects and isolates the fault. Two damages to
prevent are fire and electric shock.
4.1.1 PROTECTION AGAINST OVERCURRENT.
Overcurrent is a condition in an electrical circuit where the current exceeds the rated current
capacity of that circuit. IEE wiring regulations require that every consumer unit contains devices
that protects the final circuits from short circuit faults, overload faults and earth faults. A short
circuit fault is one that occurs when the line or phase and the neutral conductors come into contact
with each other. An overload fault can be described as one that occurs when a circuit is carrying a
current much larger than the maximum current that the circuit can safely handle. An earth fault
occurs when a line conductor comes into contact with the earth metalwork. [8]
The various protective devices used include; rewirable fuses, High Breaking Capacity Fuses
(HBC), Circuit Breakers (CB) and Residual Current Devices (RCD).
4.1.2 PROTECTION AGAINST LIGHTNING.
Lightning is a natural phenomenon caused by separation of electrical positive and negative charges
by atmospheric processes. Lightning produces a great amount of energy that can cause damage. A
lightning protection system is used to prevent damage caused by lightning. The system comprises
of;
i. Air terminal which intercepts lightning flashes and connects them to a path to ground.
They include air terminals, metal masts and permanent metal parts of structures.
ii. Down conductors which link the strike termination device to the ground terminal and
provide a low resistance path to earth.
iii. An earth terminal is installed to provide electrical contact with the earth. [10]
Surge protectors are also used both at the main building entrance and on equipment.

16
Materials that are commonly used for lightning protection system are aluminum and copper. The
Zone of protection is the space within which a lightning conductor provides protection by
attracting the lightning stroke to itself. [10]
4.2 DISCRIMINATION
Many fuses or circuit breakers are incorporated to protect a circuit from the incoming supply to
the final outlet. Ideally, protective devices should be graded so that when a fault occurs, only the
device nearest to the fault operates. The discrimination of the CB’s can be based on either
magnitude of the fault current (current discrimination) or the duration of the time during which
the circuit breaker “sees” the fault current (time discrimination). [8]
CURRENT DISCRIMINATION
This requires a circuit breaker to have a lower continuous current rating and a lower instantaneous
pick-up value than the next upstream circuit breakers. Current discrimination increases as the
difference between continuous current ratings increases and as the pick-up settings increase
between the upstream and the downstream breakers. Current discrimination at short circuit levels
is necessary where high prospective faults levels exist at the circuit breaker distribution point.
TIME DISCRIMINATION
“The total clearing time of the downstream breaker must be less than the time delay setting of the
upstream breaker”. The upstream circuit breaker must have a sufficient withstand capability for
the thermal and electrodynamic effects of the full prospective short circuit.
In a distribution board, this requires the use, upstream, of circuit breakers with adjustable time
delay settings. The upstream breaker must be capable of withstanding the thermal and
electrodynamic effects of the full prospective fault current during the time delay.

17
4.3 POWER FACTOR CORRECTION
Power factor in ac circuits is the ratio of real power (kW) that is used by electric loads to that of
apparent power (kVA) that is supplied to the circuit. KVAR is the reactive or idle component of
power. . The kilo-watt-hour meter does not record the wattless current, so when current is charged
on the basis of units consumed, the distributor is not paid for this current. A load with a low power
factor draws more current than a load with a high power factor for the same amount of useful
power transferred. The high currents increase the energy lost in the distribution system and require
large conductors and equipment. Keeping the power factor close to 1 is a considerable economic
advantage to the utility company and to the consumer.
Power factor correction is the act of increasing the power factor. The power factor should be kept
as close to 1 as possible. Adjusting the power factor will reduce the reactive power in the circuit.
Capacitors are commonly used in correction. The capacitor can be connected in parallel with
individual items or a bank of capacitors can be connected to the main bus. Factors considered
during selection of a capacitor are the capacity, the working voltage and the leakage current.
4.4 GENERATORS
An electrical generator converts mechanical energy to electrical energy. They can be powered by
diesel or gas.
Generators can be classified as standby or portable.
Standby generators are used as permanently set up systems that turn on automatically
when a power failure is detected. They are larger in size and wattage and have a long run
time.
Portable generators are smaller in size and wattage. They are used for outdoor events and
other utilities that require a short run time.
Silent generators are designed to reduce the noise output of generators. Materials that absorb
sound are used in the casing of the generator.
Automatic generators have an auto-transfer switch that can sense power outage and start the
generator. When power is restored, the system connects itself back to the utility lines and turns
itself off. The standby generator connects to the house wiring via the transfer switch. This switch
18
provides protection too. The change-over panel ensures automatic transfer of power from the
mains power supply to the generator power supply within a few seconds interval.
In sizing generators, first the amount of load that will be used under backup has to be determined.
Next, the starting and running wattages of the respective items are determined. These are found on
the identification plate of the items. The total power is then calculated in watts or KVA by
multiplying the current by the voltage.

19
Chapter 5
This chapter is aimed at implementing all the issues discussed in the previous chapters in a
residential estate. During the implementation the various tasks to be carried out in individual units
of the estate, safety factors and also guidelines given by IEE and IES were taken into consideration.
Catalogues such as Searchlight and Thorn were used for luminaires. The residential estate
comprises of 75 housing units. There are 3 different designs of housing units in the residential
estate.
5.1 DESIGN SPECIFICATIONS.
5.1.1 LIGHT FITTINGS.
The types of luminaires used in the design implementation are shown in the table 5-1 below.
Table 5-1. Types of luminaires used
TYPE OF LIGHT FITTING NAMING CONVENTION
1 × 16W POLISHED BRASS flush ceiling mounting as search
light no LE1836-11CW
Type F
26 W LED downlight as THORN CRUZ 160 LED Type G
1 x 28W wall mounted up light as THORN CORACLE Type W
11.5 W THORN BASE JUNIOR LED recessed down lights Type D
1 × 28W THORN SUPER CLUB ceiling mounting. Type B
Ceiling rose complete with lamp holder with 20W compact
fluorescent lamp and decorative with lamp shade.
Type C
1 x 28W wall mounted up light as THORN CORACLE Type S
2 x 9W Outdoor 2-light modern porch wall light as searchlight
no LE3065GY
Type K
1 x 18 W outdoor light as searchlight 280BK Type N
1 x 18W outdoor porch light as searchlight 2942BK Type P
Wall mounted light fitting with shaver unit as thorn BK Type 2D

20
In the lighting circuits the lamp wattage and the voltage were used to calculate the current in each
lighting circuit and the current was used in selecting the size of the switches to be used.
E.g. for luminaire type C, the total wattage of the luminaire was 20 W. The voltage in the circuit
was 240 V. Hence using the formula P=IV
Curre𝑛𝑡 𝐼 = (𝑃𝑜𝑤𝑒𝑟(𝑃))/(𝑉𝑜𝑙𝑡𝑎𝑔𝑒 (𝑉))
= 20 𝑊240𝑉⁄ = 0.083 𝐴
5.1.2 SWITCHES
Using the current calculated for the lighting circuits, single pole switches rated 10 Amps were
used. The main types of switches used were the one-way and the two-way switches. One-way
switches were used for the areas that were accessible via one entrance such as washrooms. Two
way switches were used in areas which could be accessed via two entrances such as kitchen and
also rooms whose lighting needed to be accessed from different parts of the room such as
bedrooms. A switch was placed at each entrance for an area at a mounting height of 1200mm
above finished floor.
5.1.3 SOCKET OUTLETS
The number of socket outlets and the mounting height was in line with the IEE wiring
recommendations. 13 A socket outlets were used mounted at a height of 450mm above finished
floor. The number of sockets in each room was in accordance with the minimum number of twin
socket outlets to be provided in homes as given in Modern Wiring Practice [7] chapter on design
and arrangement of final circuits according to The Electrical Installation Industry Liaison
Committee.
5.1.4 TELEVISION AND DATA POINTS
These ports were installed in areas where data access and telephone services were needed. The
lounge, dining room area and master bedroom had both the television and data points. Other
bedrooms and kitchen were fitted with data points only.

21
5.1.5 SINGLE PHASE LOADS
These included the cooker unit and water heater. Their maximum rated wattages were used to
calculate the load in the circuit. For cooker units, diversity used was 10A plus 30% full load for
appliances in excess of 10 A plus 5 A for cooker units incorporating 13A socket outlets. For water
heaters, the diversity used was 100% full load of the largest appliance plus 100% of the second
largest plus 25% of the remaining appliances as given in IEE ONSITE GUIDE BS 7671 [9]
5.2 DESIGN
Lighting designs for each residential unit type A2, B2 and C2 was done taking one unit from each
type to demonstrate the design. The residential lighting design guide by Contech Lighting [11] was
used to obtain various parameters needed. The guide contains tables from The IES Lighting
handbook 8th edition. The lumen method was used in calculating the number of light fittings of the
various rooms in each housing unit. The IES lighting handbook application volume [4] was also
used to obtain the various parameters that were needed. The THORN catalogue [13],
SEARCHLIGHT catalogue [14] and the PHILLIPS LAMP catalogue [12] were used to give the
various types of luminaires and lamps used and their parameters.
5.2.1 LIGHT DESIGN IN HOUSING UNITS
The lounge in house A2 was used to illustrate how the lumen method was used in calculating
required number of light fittings and the arrangement of the light fittings in the room.
5.2.1.1 CALCULATING NUMBER OF LUMINAIRES
The following steps were used to calculate the number of luminaires;
i. Determination of recommended illuminance.
From the IES handbook application volume, areas devoted to relaxation require a low level of
general lighting to create a pleasant atmosphere for comfort and relaxation. From IES tables, the
recommended illumination is 100 lux.

22
ii. Determination of room dimensions.
The lounge had the following dimensions; Length= 5.54m, Width=5.39m, Height=2.7m.
Taking the height of a table in the lounge as 0.6m, the mounting height Hm= 2.7-0.6= 2.1
iii. Calculating room index.
The room index was calculated using the formula;
K = )WL(H
WL
m
=
)39.554.5(1.2
39.554.5
=1.3
iv. Obtaining the utilization factor (U.F).
The utilization factor was obtained from the utilization factor table in the Technical-lighting design
guide [15] using the room index, ceiling, wall and floor reflectance. The ceiling reflectance was
taken to be to be 70%, the wall reflectance to be 50% and the floor reflectance to be 20% as per
IES lighting handbook application volume [4]. It is not possible to read the room index of 1.3
directly from the tables hence interpolation was used.
For K = 1.25, the UF = 0.55
For K = 1.5, the UF = 0.59.
By interpolation, U.F. = 0.55 + (0.59 – 0.55) ×25.15.1
25.13.1
= 0.558
v. Selection of luminaire
The light fittings selected to be used in the lounge was a 26 W LED downlight as THORN CRUZ
160. With lumen output 2000 lumens, color rendition Ra = 80 and color temperature 3000K.
vi. Obtaining the maintenance factor.
A maintenance factor M.F of 0.7 was used.
vii. Calculation of flux
From the lumen method,
Illuminance, E = Area
M.F U.Fflux Installed
Installed flux = F..MF..U
AE
= lumens 7645 7.0558.0
86.29100

23
viii. Calculating number of fittings
From the Thorn catalogue the lumen output of CRUZ 160 is 2000 lumens per lamp.
Number of fittings = lampper output Lumen
flux Installed
= fittings 5 2000
7645
Five fittings were decided upon since they gave an average illuminance of 140 lux.
ix. Showing arrangement of luminaires.
Luminaires were arranged in order to ensure that all areas of the lounge were well lit and especially
areas with furniture and also ensure uniformity of illumination. In this lighting scheme, the rule
used was that the distance between the ends of adjacent luminaires should be twice the distance
from the luminaire to the wall. The arrangement of luminaires was as shown in fig 5-1 below.
Figure 5-1. Luminaire arrangement in lounge

24
The above concept was applied to all other rooms in all three housing units and the results
summarized in tables in APPENDIX 1.
5.2.1.2 CALCULATING ILLUMINANCE AT A POINT
The point-by- point method was also used to determine the illuminance on a painting on the wall
of lounge in unit A2. The paints’ dimensions were 0.5m x 0.76m and was mounted 1.6m above
the finished floor level. Taking a point P on the painting 1.85m from finished floor, the horizontal
distance from light source to the point whose illuminance is being computed, R was 2.3m, the
vertical mounting height H of the light source above R was 0.48m. The actual distance D from the
light source to the point was 2.77m.The angle between the light ray and the perpendicular to the
plane β= Tan -1 (0.48
2.73) =11.08 0. θ = 78.910. Figure 5-2 below illustrates this.
Figure 5-2. Point by point method for a painting on a wall
The following steps were followed in order to determine the illuminance at point P.
i. Calculating luminous intensity of the lamp
Luminous intensity is given by the equation; I =luminous flux 𝜙
𝛺

25
Where Ω is the solid angle into which the luminous flux is emitted.
Ω= 2𝜋(1 − cos𝛼
2) where α is the apex angle = 850.
Ω= 2𝜋(1 − cos85
2) = 1.65
I = 2000 lumens
1.65 = 1,211 cd
ii. Calculating illuminance
Illuminance is given by the formula
E = I x sin θ x cos2 θ
H2
E =1211 x sin 78.91 x cos2 78.91 = 190 lux
0.482
5.2.2 ROAD LIGHTING DESIGN
Road lighting design specifications were based on IES lighting handbook application volume. The
recommended illuminance values were from Roadway Lighting Design Guide- SaskPower [5]
with tables from IESNA [4].
i. Determination of recommended illuminance.
For local roads with low pedestrian conflict, using IESNA tables [4], the recommended average
maintained illuminance is 8 lux.
ii. Road width
The width of the road from curb to curb is 9m
iii. Selection of luminaire
The luminaire selected was Thorn JET 1 with a mounting height of 6m, using 57 W TC-TEL lamp
with lumen output of 4200 lumens, CRI= 80, and overhang distance (from pavement curb to
projection of luminaire) = 0.4m.
iv. Arrangement of luminaire.
The luminaire arrangement chosen was the one-sided arrangement.

26
v. Obtaining the utilization factor (U.F).
To calculate the utilization factor, for street lighting using IES tables,
Ratio = height mounting Luminaire
side) houseor (road width Transverse
For road side, Ratio =height mounting Luminaire
overhang - widthroad
= 43.16
0.4 -9 UF for road side= 0.35
For house side, Ratio =height mounting Luminaire
widthroad
= 5.16
9 UF for house side= 0.28
Total utilization factor = road side UF + house side UF
= 0.35 + 0.28 = 0.63
vi. Maintenance factor
The maintenance factor of the luminaire is 0.86
vii. Finding the spacing between two luminaires
Using the average illuminance method where
Average illuminance Eav = x WSS
M.F U.F LL
Where, LL- Initial lamp lumens
UF - utilization factor W – Road width
MF - Maintenance factor
SS - Luminaire spacing
The luminaire spacing was given as SS = 9 x 8
0.86 0.63 4200 = 31 meters.

27
5.3 LOAD CALCULATION IN HOUSING UNITS
For every housing unit, a count of the number of fittings, number of socket outlets and single phase
loads was done and grouped into the final circuits that would be used in the consumer unit. This
was then used to calculate the load current in the consumer units while putting diversity and load
growth into consideration.
5.3.1 LOAD CALCULATION IN UNIT A2
Housing unit A2 was used to show how the various loads were calculated. In this housing unit
several light fittings were used in the house. The lighting circuits were grouped into 4 final circuits,
2 circuits serving upstairs and two downstairs. This is to avoid total blackouts incase the circuit
breaker trips. A diversity factor of 66% was used in calculating the loads. The wattage of the
individual circuits was 176.88 W, 298.98 W, 237 W and 217.43 W. The voltage drop per meter
was also considered when selecting the number of light fittings in one circuit according to IEE the
voltage drop for lighting circuits should not exceed 3% of the nominal voltage. The calculation of
lighting final circuits was summarized in table in appendix 2.
Ring circuits were used in the final circuits of the socket outlets. 32 A ring circuits were used and
the maximum floor area to be covered by the ring circuits is 100m2. The ground floor area was
more than 100m2 hence a total of 2 ring circuits were used in unit A2. A diversity factor of 100%
was used for the largest point of utilization and 40% for every other points of utilization. The total
wattage for the most utilized ring circuit was 32A x 240V= 7680W. The other ring circuit had a
wattage of 7680 x 0.4 = 3072 W.
The cooker unit and water heater were the single phase loads in the housing units hence were
allocated their individual circuits. Cooker units rated 45 A was used hence applying diversity factor
= 10A+ 10.5A +5A = 25.5A. This gives a wattage of 6120 W.
Provision was also made for a 60 gallon solar water heater with electric heating element rated 1500
watts used for back-up to heat water further when there is not enough sunshine such as ASSOS
and SECUterm solar water heaters. Current rating of the water heater was 1500/240 = 6.25 A. The
above implementation is summarized in table 5-2. The loads in units B2 and C2 were calculated
in a similar manner and the results shown in table 2-5 and 2-6 in appendix 2.

28
Table 5-2. Calculation of maximum demand in unit A2
LOAD Diversity factor Total load(Watts) Total load current(A)
Lighting circuit 1 0.66 176.88 W 0.74A
Lighting circuit 2 0.66 298.98W 1.25A
Lighting circuit 3 0.66 237 W 0.99A
Lighting circuit 4 0.66 217.43W 0.91A
Circuit .T 0.66 130.68W 0.54A
Ring circuit 1 1 7680 W 32A
Ring circuit 2 0.4 3072 W 13A
Cooker unit
10A+30%for
appliances in excess
of 10A + 5A for
socket incorporation
6120 W
25.5A
Water heater 1 1500 W 6.25 A
TOTAL 19,433 W 80.97 A
5.4 SUMMERY OF LOAD IN THE ESTATE
The estate had 75 housing units. The housing unit A2 had a total of 11 houses, unit B2 had a total
of 40 houses and unit C2 had a total of 24 houses. The end gain of this part of the project was to
ensure that the load on the three phases of the incoming cable of the service turret was balanced.
The load on each consumer unit was tabulated and then individual loads were spread on all phases
to achieve balance.

29
5.4.1 HOUSING UNIT A2
There were a total of 11 houses of type A2 each having a total load of 19,433 W and a total load
current of 80.97 A. The load currents of the consumer units were tabulated and spread across the
phases as shown in table 5-3
Table 5-3 Summery of loads in unit A2
NAME Load
(watts)
Load
current
(Amps)
Consumer
Unit
RED
PHASE
LOAD
(Amps)
YELLOW
PHASE
LOAD
(Amps)
BLUE
PHASE
LOAD
(Amps) House 1 19,433 80.97 CU-A2- 1 80.97
House 2 19,433 80.97 CU-A2-2 80.97
House 3 19,433 80.97 CU-A2-3 80.97
House 4 19,433 80.97 CU-A2-4 80.97
House 5 19,433 80.97 CU-A2-5 80.97
House 6 19,433 80.97 CU-A2-6 80.97
House 7 19,433 80.97 CU-A2-7 80.97
House 8 19,433 80.97 CU-A2-8 80.97
House 9 19,433 80.97 CU-A2-9 80.97
House 10 19,433 80.97 CU-A2-10 80.97
House 26 19,433 80.97 CU-A2-26 80.97
TOTAL
LOAD
213,763 323.88 242.91 323.88
5.4.2 HOUSING UNIT B2
Type B2 had a total of 40 houses each having a total load of 19,310 W and a load current of
80.45A. The consumer load units were tabulated and spread across the phases as shown.
Table 5-4 Summery of loads in unit B2
NAME Load
(watts)
Load
current
(Amps)
Consumer
Unit
RED
PHASE
LOAD
(Amps)
YELLOW
PHASE
LOAD
(Amps)
BLUE
PHASE
LOAD
(Amps)
House 11 19,310 82.74 CU-B2-11 80.45
House 12 19,310 82.74 CU-B2-12 80.45
House 13 19,310 82.74 CU-B2-13 80.45
House 14 19,310 82.74 CU-B2-14 80.45
House 15 19,310 82.74 CU-B2-15 80.45
House 16 19,310 82.74 CU-B2-16 80.45

30
NAME Load
(watts)
Load
current
(Amps)
Consumer
Unit
RED
PHASE
LOAD
(Amps)
YELLOW
PHASE
LOAD
(Amps)
BLUE
PHASE
LOAD
(Amps)
House 17 19,310 82.74 CU-B2-17 80.45
House 18 19,310 82.74 CU-B2-18 80.45
House 19 19,310 82.74 CU-B2-19 80.45
House 20 19,310 82.74 CU-B2-20 80.45 House 21 19,310 82.74 CU-B2-21 80.45
House 22 19,310 82.74 CU-B2-22 80.45
House 23 19,310 82.74 CU-B2-23 80.45
House 24 19,310 82.74 CU-B2-24 80.45
House 25 19,310 82.74 CU-B2-25 80.45
House 27 19,310 82.74 CU-B2-27 80.45
House 28 19,310 82.74 CU-B2-28 80.45
House 29 19,310 82.74 CU-B2-29 80.45
House 30 19,310 82.74 CU-B2-30 80.45
House 31 19,310 82.74 CU-B2-31 80.45
House 32 19,310 82.74 CU-B2-32 80.45
House 33 19,310 82.74 CU-B2-33 80.45
House 34 19,310 82.74 CU-B2-34 80.45
House 35 19,310 82.74 CU-B2-35 80.45
House 36 19,310 82.74 CU-B2-36 80.45
House 37 19,310 82.74 CU-B2-37 80.45
House 38 19,310 82.74 CU-B2-38 80.45
House 39
19,310 82.74 CU-B2-39 80.45
House 40 19,310 82.74 CU-B2-40 80.45
House 41 19,310 82.74 CU-B2-41 80.45
House 42 19,310 82.74 CU-B2-42 80.45
House 43 19,310 82.74 CU-B2-43 80.45
House 44 19,310 82.74 CU-B2-44 80.45
House 45 19,310 82.74 CU-B2-45 80.45
House 46 19,310 82.74 CU-B2-46 80.45
House 47 19,310 82.74 CU-B2-47 80.45 House 48 19,310 82.74 CU-B2-48 80.45 House 49 19,310 82.74 CU-B2-49 80.45 House 50 19,310 82.74 CU-B2-50 80.45 House 51 19,310 82.74 CU-B2-51 80.45
TOTAL
LOAD
772,400
1045.85 1045.85 1126.
3

31
5.4.2 HOUSING UNIT C2
Type C2 had a total of 24 houses each having a total load of 19,167W and a load current of 79.86A.
The consumer load units were tabulated and spread across the phases as shown.
Table 5-5 Summery of loads in unit C2
NAME Load
(watts)
Load
current
(Amps)
Consumer
Unit
RED
PHASE
LOAD
(Amps)
YELLOW
PHASE
LOAD
(Amps)
BLUE
PHASE
LOAD
(Amps) House 52 19,167 79.86 CU-C2-52 79.86
House 53 19,167 79.86 CU-C2-53 79.86
House 54 19,167 79.86 CU-C2-54 79.86
House 55 19,167 79.86 CU-C2-55 79.86
House 56 19,167 79.86 CU-C2-56 79.86
House 57 19,167 79.86 CU-C2-57 79.86
House 58 19,167 79.86 CU-C2-58 79.86
House 59 19,167 79.86 CU-C2-59 79.86
House 60 19,167 79.86 CU-C2-60 79.86
House 61 19,167 79.86 CU-C2-61 79.86
House 62 19,167 79.86 CU-C2-62 79.86
House 63 19,167 79.86 CU-C2-63 79.86
House 64 19,167 79.86 CU-C2-64 79.86
House 65 19,167 79.86 CU-C2-65 79.86
House 66 19,167 79.86 CU-C2-66 79.86
House 67 19,167 79.86 CU-C2-67 79.86
House 68 19,167 79.86 CU-C2-68 79.86
House 69 19,167 79.86 CU-C2-69 79.86
House 70 19,167 79.86 CU-C2-70 79.86
House 71 19,167 79.86 CU-C2-71 79.86
House 72 19,167 79.86 CU-C2-72 79.86
House 73 19,167 79.86 CU-C2-73 79.86
House 74 19,167 79.86 CU-C2-74 79.86
House 75 19,167 79.86 CU-C2-75 79.86
TOTAL
LOAD
460,008
638.88 638.88 638.88

32
5.4.3 TOTAL LOAD IN THE WHOLE ESTATE
The total load in the whole estate across the phases is as shown in table 5-6.
Table 5-6 Summery of loads in the estate
NAME Load
(watts)
Load
current
(A)
Number of
consumer
Units
RED
PHASE
LOAD (A)
YELLOW
PHASE
LOAD (A)
BLUE
PHASE
LOAD (A)
UNIT A2 213763
890.6
11 323.88 323.88 242.91
UNIT B2 772,400
3218.3
40 1045.85 1045.85 1126.3
UNIT C2 460,008 1916.7 24 638.88 638.88 638.88
TOTALS 1446171 75 2008.6 2008.6 2008.1
The overall load currents were 2008.6A on the red phase, 2000.6A on the yellow phase and
2008.1A on the blue phase. Balance was hence achieved. The total current for all the phases was
6025.3A.
5.4 CIRCUIT BREAKERS AND CONSUMER UNITS
From the Eaton MEM catalogue [15] in appendix 3, the standard ratings for Miniature Circuit
Breakers (MCBs) are 1A, 2A, 4A, 6A, 8A, 10A, 13A, 16A, 20A, 25A, 32A, 40A, 50A, and 63A.
The standard consumer unit (CU) sizes are 4-way, 6-way, 8-way, 10-way, 12-way, 16-way, 18-
way and 24-way. Sizing of the MCB was done by calculating the load current then checking for
the rating of the MCB just above it.
5.4.1 CIRCUIT BREAKERS IN HOUSING UNITS
Housing unit A2 was used to show how the size of the circuit breaker and cables were selected.
The naming convention used for the distribution boards in housing units A2 was DB-A2-house
number this represented the distribution board, the type of housing unit it was in and the house
number.

33
The lighting loads were 194.04 W, 279.18 W, 296.67 W and 268.95 W. The current by each
lighting load was calculated as shown below;
Current in CIR.L1 = 176.88
240= 0.74 A
Current in CIR.L2 = 298.98
240= 1.25 A
Current in CIR.L3 = 237
240= 0.99 A
Current in CIR.L4 = 217.43
240= 0.91 A
Current in CIR.T =130.68
240= 0.54 A
A 4A, 10 kA, trip type B, SP MCB from Eaton MEM catalogue was therefore chosen as protection
for each lighting load. 1mm2 2-core PVC insulated cables were used.
Ring circuits were protected by a 32A, 10 kA, trip type B, DP MCB. 2.5 mm2 3-core PVC
insulated cables were used.
The cooker had a total load of 6120W and a current of 6120
240 = 25.5 A. The MCB chosen for
cooker protection was a 32A, 10 kA, trip type B, DP MCB. 6 mm2 3-core PVC insulated cables
were used.
The water heater load was 1500W and the current given was 1500
240= 6.25 A. The MCB chosen for
the water heater protection was a 10A, 10 kA, trip type B, DP MCB. 2.5 mm2 3-core PVC insulated
cables were used.
RCDs (residual current devices) rated 30 mA were used to protect circuits that are in wet areas
such as bathrooms and socket outlets.
A summary of the MCB ratings is given in table 5-7. Taking the hose number to be 1. The
distribution board label was DB-A2-1

34
Table 5-7 : MCBs in DB-A2-1
Type of load Total load
(Watts)
Total
Current
load (A)
MCB
size
Cable size (mm2)
Lighting CIR.LI 194.04W 0.74A 4A 1mm2
Lighting CIR.L2 298.98W 1.25A 4A 1mm2
Lighting CIR.L3 237 W 0.99A 4A 1mm2
Lighting CIR.L4 217.43W 0.91A 4A 1mm2
Circuit .T 130.68W 0.54A 4A 1mm2
Ring circuit CIR.R1 7680W 32A 32A 2.5 mm2
Ring circuit CIR.R2 3072W 13A 32A 2.5 mm2
Cooker CIR.DI 6120W 25.5A 32A 6 mm2
Water heater 1500W 6.25A 10A 2.5 mm2
The same procedure above was applied to the other housing units B2 and C2 and the results were
as shown in table 2-7 and 2-8 in appendix 2.
5.4.2 CONSUMER UNITS
The total load for housing unit A2, B2 and C2 as calculated was 19,433 W, 19,310 W and 19,167W
respectively. The currents by each load was given as 80.97A, 80.45A, 79.86A respectively.
Given the current on each load, consumer units with integral isolator of 100A and 14 circuit
breaker ways were used in each housing unit. The naming convention used for the distribution
boards in unit A2 was CU-A2 then followed by the house number. Consumer units for units B2
and C2 were labeled CU-B2 and CU-C2 respectively. The location of the consumer units had to
be taken into consideration so as to reduce the voltage drops and cost of cables. A total number of
75 consumer units was installed in the estate to cater for each house.

35
From the AutoCAD drawings attached, the consumer units were located in the store room of each
room of the housing unit. . A diagram depicting the arrangement of consumer unit for house
number 1 house type A2 is shown in figure 5-3. The consumer units for the other houses were
similar to that of house A2-1.
Figure 5-3 consumer unit arrangement for CU-A2-1
5.5 SERVICE TURRETS
Distribution of power to the houses was done using underground cables. Underground cables were
preferred due to the low maintenance costs because they rarely get damaged, improved reliability
since power interruptions are minimal as the risk of getting damaged due to severe weather such
as wind and storm surges is reduced. Underground cables also improve the property value as they
improve the aesthetics of the estate by removal of poles and structures that impact sidewalks.
Service turrets are used to distribute power throughout the estate. Each low voltage turret was
provided with a manhole and a service conduit from the manhole of each residential estate.

36
According to KPLC, service turrets feeding low voltage distribution systems and made for outdoor
use have the following specifications;
The service turret is designed to have 18 single phase circuits of 100A rating (outgoing circuits in
a 6x3- phase configuration) with cut-outs arranged with fuses in accordance to BS1361.
The rated voltage of the service turrets was 0.6/1kV and the rated current was 600A.
The total number of consumer units was 75 as seen in section 5.4. In selecting the number of
service turrets and determining their positions, the location of the consumer units had to be taken
into consideration. A longer cable between the service turret and the consumer unit could lead to
large voltage drops and greater cost of cables; which was undesirable in design.
From the AutoCAD drawings attached, the consumer units were located in the store of each
housing unit. The distance from the consumer unit to the power manhole which was located at a
corner outside the yard wall was approximately 8m. In order to avoid large voltage drops,
consumer units were grouped and lumped in such a way that the consumer units were served with
the turret closest to them.
The arrangement as shown in the AutoCAD drawing was such that the maximum number of houses
allowed on each phase of the turret was 3. The total number of turrets was 10.
5.6 CONSUMER UNIT CABLE SIZING.
The current in each housing unit was as 80.97A, 80.45A and 79.86A for unit A2, B2 and C2
respectively. The consumer units were lumped as follows;
Consumer units for houses 1,2,3,4 were fed by turret number 1
Consumer units for houses 5,6,7,8,9,10 were fed by turret number 2
Consumer units for houses 11,12,26,27,28 were fed by turret number 3
Consumer units for houses 13,14,15,16,29,30,31,32 were fed by turret number 4
Consumer units for houses 40,41,42,54,55,56,57,58 were fed by turret number 5
Consumer units for houses 43,44,45,46,47,59,60,61 were fed by turret number 6
Consumer units for houses 48,49,50,51,62,63,64,65,66 were fed by turret number 7
Consumer units for houses 52,53,67,68,69,72,73,74,75 were fed by turret number 8

37
Consumer units for houses number 17,18,19,20,33,34,35,36,37 were fed by service turret
number 9
Consumer units for houses 21,22,23,24,25,38,39,70,71 were fed by turret number 10
The above was shown in the AutoCAD drawings provided.
The distances between the consumer units and the respective service turrets were measured. In
order to cater for future load growth, the actual growth was increased by 20%. This gave the
revised load. Since the installation was underground, PVC insulated, PVC sheathed cables were
used. A maximum voltage drop of 1.5 % was allowed for cables feeding consumer units from the
distribution boards. Using the Bahra Cables Company catalogue in appendix 4, the voltage drop
rate was obtained using the design current. The values obtained were used to calculate the voltage
drop as follows:
240
100
1000
m)rate(mV/A/ drop voltagecurrent load revised length(m) drop voltage%
5.6.1 CABLE SIZING FOR CU-A2-1
The total load current for houses in unit A2 was 80.97A. The revised load was thus 120% of
80.97A which was 97A. The distance from the service turret to the house was 41m. A 70 mm2 core
copper conductor with a voltage drop of 0.61 mV/A/m and a current carrying capability of 154 A
was selected. The voltage drop was given as;
240V
100
1000
0.61mV/A/m A 97 41m drop voltage%
= 1.00 %
The % voltage drop was less than 1.5 % hence the conductor was selected.
The same concept was applied to the remaining CUs in the estate and the results summarized in
table 5-8.
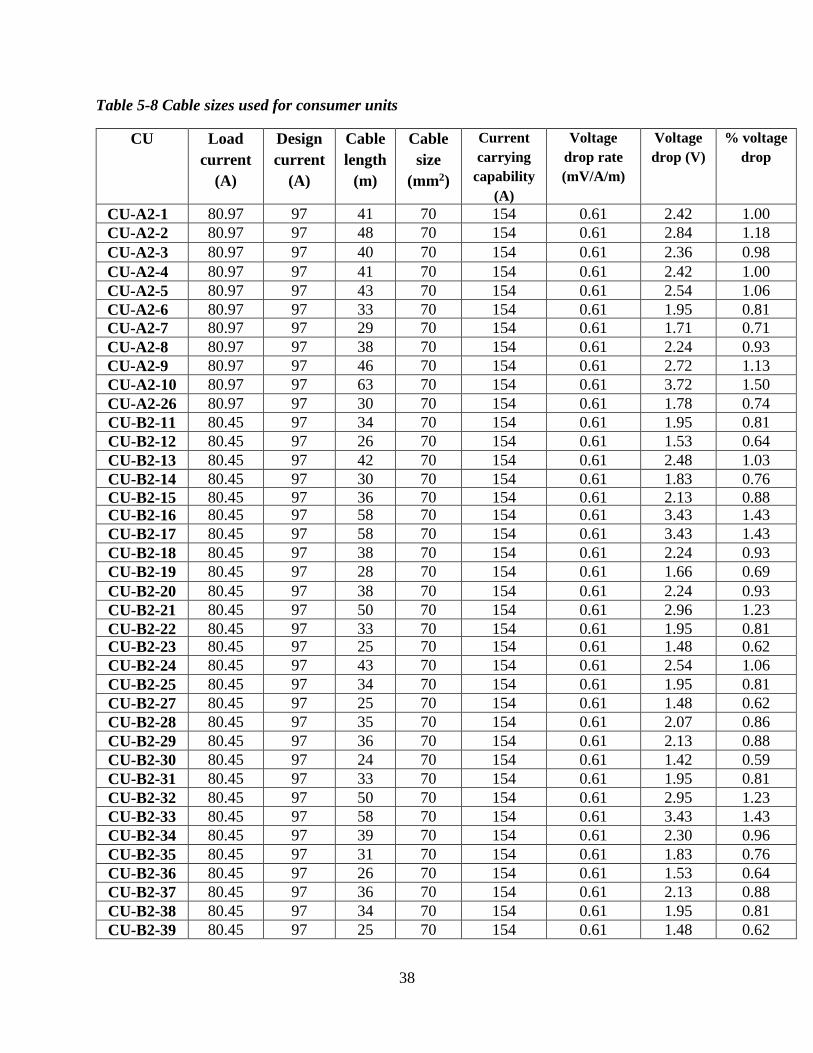
38
Table 5-8 Cable sizes used for consumer units
CU Load
current
(A)
Design
current
(A)
Cable
length
(m)
Cable
size
(mm2)
Current
carrying
capability
(A)
Voltage
drop rate
(mV/A/m)
Voltage
drop (V)
% voltage
drop
CU-A2-1 80.97 97 41 70 154 0.61 2.42 1.00
CU-A2-2 80.97 97 48 70 154 0.61 2.84 1.18
CU-A2-3 80.97 97 40 70 154 0.61 2.36 0.98
CU-A2-4 80.97 97 41 70 154 0.61 2.42 1.00
CU-A2-5 80.97 97 43 70 154 0.61 2.54 1.06
CU-A2-6 80.97 97 33 70 154 0.61 1.95 0.81
CU-A2-7 80.97 97 29 70 154 0.61 1.71 0.71
CU-A2-8 80.97 97 38 70 154 0.61 2.24 0.93
CU-A2-9 80.97 97 46 70 154 0.61 2.72 1.13
3 CU-A2-10 80.97 97 63 70 154 0.61 3.72 1.50
CU-A2-26 80.97 97 30 70 154 0.61 1.78 0.74
CU-B2-11 80.45 97 34 70 154 0.61 1.95 0.81
CU-B2-12 80.45 97 26 70 154 0.61 1.53 0.64
CU-B2-13 80.45 97 42 70 154 0.61 2.48 1.03
CU-B2-14 80.45 97 30 70 154 0.61 1.83 0.76
CU-B2-15 80.45 97 36 70 154 0.61 2.13 0.88 CU-B2-16 80.45 97 58 70 154 0.61 3.43 1.43
CU-B2-17 80.45 97 58 70 154 0.61 3.43 1.43
CU-B2-18 80.45 97 38 70 154 0.61 2.24 0.93
CU-B2-19 80.45 97 28 70 154 0.61 1.66 0.69
CU-B2-20 80.45 97 38 70 154 0.61 2.24 0.93
CU-B2-21 80.45 97 50 70 154 0.61 2.96 1.23
CU-B2-22 80.45 97 33 70 154 0.61 1.95
0.81 CU-B2-23 80.45 97 25 70 154 0.61 1.48 0.62
CU-B2-24 80.45 97 43 70 154 0.61 2.54 1.06
CU-B2-25 80.45 97 34 70 154 0.61 1.95 0.81
CU-B2-27 80.45 97 25 70 154 0.61 1.48 0.62
CU-B2-28 80.45 97 35 70 154 0.61 2.07 0.86
CU-B2-29 80.45 97 36 70 154 0.61 2.13 0.88
CU-B2-30 80.45 97 24 70 154 0.61 1.42 0.59
CU-B2-31 80.45 97 33 70 154 0.61 1.95 0.81
CU-B2-32 80.45 97 50 70 154 0.61 2.95 1.23
CU-B2-33 80.45 97 58 70 154 0.61 3.43 1.43
CU-B2-34 80.45 97 39 70 154 0.61 2.30 0.96
CU-B2-35 80.45 97 31 70 154 0.61 1.83 0.76
CU-B2-36 80.45 97 26 70 154 0.61 1.53 0.64
CU-B2-37 80.45 97 36 70 154 0.61 2.13 0.88
CU-B2-38 80.45 97 34 70 154 0.61 1.95 0.81
CU-B2-39 80.45 97 25 70 154 0.61 1.48 0.62

39
CU Load
current
(A)
Design
current
(A)
Cable
length
(m)
Cable
size
(mm2)
Current
carrying
capability
(A)
Voltage
drop rate
(mV/A/m)
Voltage
drop (V)
%
voltage
drop
CU-B2-40 80.45 97 38 70 154 0.61 2.24 0.93
CU-B2-41 80.45 97 29 70 154 0.61 1.71 0.71
CU-B2-42 80.45 97 29 70 154 0.61 1.71 0.71
CU-B2-43 80.45 97 46 70 154 0.61 2.72 1.13
CU-B2-44 80.45 97 31 70 154 0.61 1.83 0.76
CU-B2-45 80.45 97 29 70 154 0.61 1.71 0.71
CU-B2-46 80.45 97 31 70 154 0.61 1.83 0.76
CU-B2-47 80.45 97 45 70 154 0.61 2.66 1.11
CU-B2-48 80.45 97 33 70 154 0.61 1.95 0.81
CU-B2-49 80.45 97 23 70 154 0.61 1.36 0.56
CU-B2-50 80.45 97 29 70 154 0.61 1.71 0.71
CU-B2-51 80.45 97 40 70 154 0.61 2.36 0.98
CU-C2-52 79.86 96 34 70 154 0.61 1.99 0.82
CU-C2-53 79.86 96 26 70 154 0.61 1.52 0.63
CU-C2-54 79.86 96 42 70 154 0.61 2.45 1.02
CU-C2-55 79.86 96 34 70 154 0.61 1.99 0.83
CU-C2-56 79.86 96 26 70 154 0.61 1.52 0.63
CU-C2-57 79.86 96 35 70 154 0.61 2.04 0.85
CU-C2-58 79.86 96 50 70 154 0.61 2.92 1.22
CU-C2-59 79.86 96 45 70 154 0.61 2.63 1.09
CU-C2-60 79.86 96 31 70 154 0.61 1.82 0.76
CU-C2-61 79.86 96 31 70 154 0.61 1.82 0.76
CU-C2-62 79.86 96 57 70 154 0.61 3.34 1.40
CU-C2-63 79.86 96 42 70 154 0.61 2.45 1.02
CU-C2-64 79.86 96 33 70 154 0.61 1.93 0.80
CU-C2-65 79.86 96 27 70 154 0.61 1.58 0.66
CU-C2-66 79.86 96 34 70 154 0.61 1.99 0.83
CU-C2-67 79.86 96 42 70 154 0.61 2.45 1.02
CU-C2-68 79.86 96 38 70 154 0.61 2.23 0.92
CU-C2-69 79.86 96 30 70 154 0.61 1.76 0.73
CU-C2-70 79.86 96 36 70 154 0.61 2.11 0.87
CU-C2-71 79.86 96 46 70 154 0.61 2.69 1.12
CU-C2-72 79.86 96 44 70 154 0.61 2.58 1.07
CU-C2-73 79.86 96 34 70 154 0.61 1.99 0.83
CU-C2-74 79.86 96 35 70 154 0.61 2.04 0.85
CU-C2-75 79.86 96 48 70 154 0.61 2.81 1.17

40
5.7 SERVICE TURRET CABLE SIZING
5.7.1 CABLES FEEDING SERVICE TURRET 1.
Service turret 1 fed CU-B2-17, CU-B2-18, CU-B2-19, CU-B2-20, CU-B2-33, CU-B2-34, CU-B2-
35, CU-B2-36 and CU-B2-37. The total phase load was found by summing up the currents on each
phase. Load current on the red phase was 162A, the yellow phase was 80.97 and blue phase was
80.97 A. Current of the red phase was used to size the cables as it was the largest. This current was
increased by 20% to cater for future load growth. The design current was therefore: 162 × 1.2 =
194A. The length of the cable connecting this service turret to the switch room was found to be
33m. A maximum voltage drop of 2 % was allowed. A 240 mm2 PVC insulated, PVC sheathed
conductor with a current carrying capacity of 301A and a voltage drop of 0.23 mV/A/m was
selected. The percentage voltage drop was thus calculated as
415V
100
1000
mV/A/m 0.23 A 194 m 33 drop voltage%
= 0.35 %
Since the percentage voltage drop was less than 2 % then the conductor was suitable. The cable
sizes of the other service turrets was selected and summarized in table 5-9.
Table 5-9 Cable sizes for service turrets
Service
turret
Largest
Load
current
(A)
Design
current
(A)
Cable
length
(m)
Cable
size
(mm2)
Current
carrying
capability
(A)
Voltage
drop rate
(mV/A/m)
Voltage
drop (V)
%
voltage
drop
ST.1 162.00 194 33 240 301 0.23 1.47 0.35
ST.2 162.00 194 53 240 301 0.23 2.36 0.98
ST.3 161.00 194 70 240 301 0.23 3.12 0.75 ST.4 241.35 290 125 300 339 0.20 7.25 1.75
ST.5 241.35 290 50 300 339 0.20 2.9 0.69
ST.6 241.35 290 123 300 339 0.20 7.13 1.72
ST.7 241.35 290 100 300 339 0.20 5.80 1.39
ST.8 241.35 290 62 300 339 0.20 3.60 0.87
ST.9 241.35 290 86 300 339 0.20 5.00 1.20
ST.10 241.35 290 15 300 339 0.20 6.03 0.15
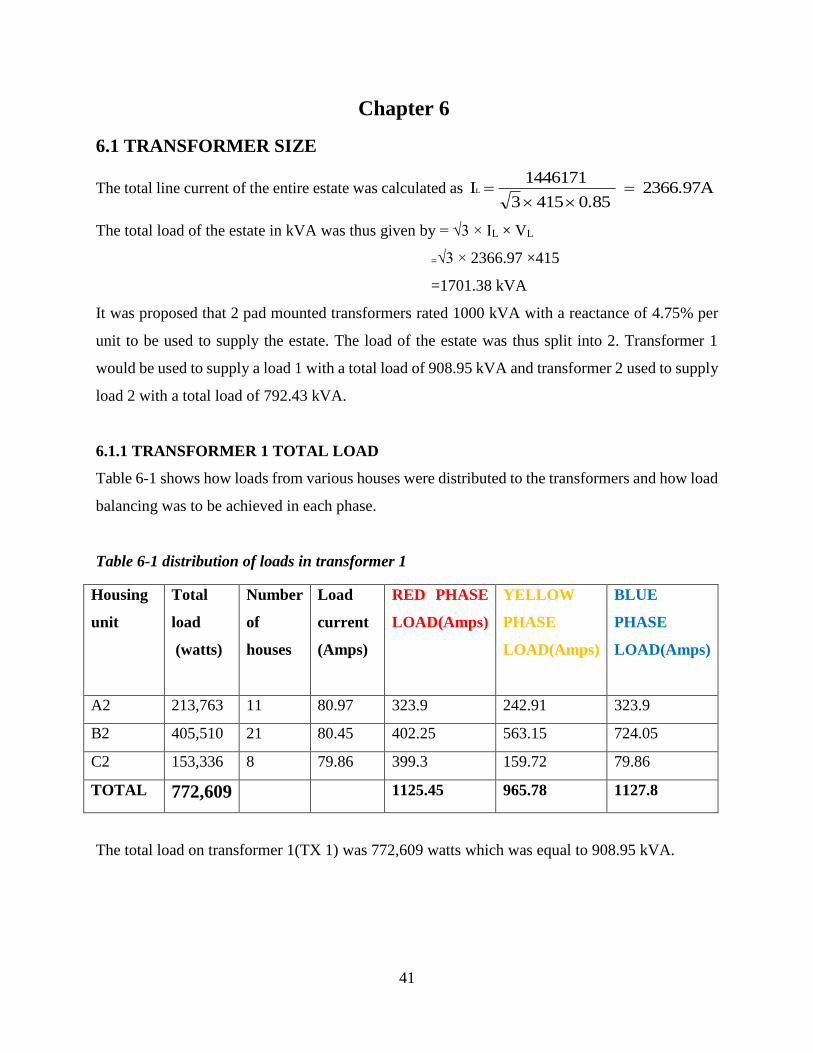
41
Chapter 6
6.1 TRANSFORMER SIZE
The total line current of the entire estate was calculated as 2366.97A 0.85 415 3
1446171 IL
The total load of the estate in kVA was thus given by = √3 × IL × VL
=√3 × 2366.97 ×415
=1701.38 kVA
It was proposed that 2 pad mounted transformers rated 1000 kVA with a reactance of 4.75% per
unit to be used to supply the estate. The load of the estate was thus split into 2. Transformer 1
would be used to supply a load 1 with a total load of 908.95 kVA and transformer 2 used to supply
load 2 with a total load of 792.43 kVA.
6.1.1 TRANSFORMER 1 TOTAL LOAD
Table 6-1 shows how loads from various houses were distributed to the transformers and how load
balancing was to be achieved in each phase.
Table 6-1 distribution of loads in transformer 1
Housing
unit
Total
load
(watts)
Number
of
houses
Load
current
(Amps)
RED PHASE
LOAD(Amps)
YELLOW
PHASE
LOAD(Amps)
BLUE
PHASE
LOAD(Amps)
A2 213,763 11 80.97 323.9 242.91 323.9
B2 405,510 21 80.45 402.25 563.15 724.05
C2 153,336 8 79.86 399.3 159.72 79.86
TOTAL 772,609 1125.45 965.78 1127.8
The total load on transformer 1(TX 1) was 772,609 watts which was equal to 908.95 kVA.

42
6.1.2 TRANSFORMER 2 TOTAL LOAD
Table 6-2 Distribution of loads in transformer 2
Housing
unit
Total
load
(watts)
Number
of
houses
Load
current
(Amps)
RED PHASE
LOAD(Amps)
YELLOW
PHASE
LOAD(Amps)
BLUE
PHASE
LOAD(Amps)
B2 366,890 19 80.45 643.60 482.7 402.25
C2 306,672 16 79.86 239.58 479.16 559.02
TOTAL 673,562 883.18 961.86 961.27
The total load on transformer 2(TX 2) was 673,572 watts which was equal to 792.43 kVA.
6.2 BACKUP GENERATOR
Back-up generators in residential areas are becoming increasingly common providing backup
when the supply from KPLC is cut-out. It was therefore proposed that the power supply in the
residential estate be backed up by a standby generator. Backing up the whole estate seemed like
an expensive idea since the capacity of the generator would be large; but for continuity of house-
hold activities such as lighting, use of socket outlets and water heating, the back-up plan would be
of great advantage. This also attracted potential clients to purchase houses since the area was under
continuous power supply.
6.2.1 CAPACITY OF THE STANDBY GENERATOR
Two separate generators were selected to act as a stand-by power supply for loads served by
transformer 1 and 2.
In order to determine the size of generator required, the total load of the estate was considered.
The total load served by transformer 1 was 908.95 kVA. The load served by transformer 2 was

43
792.43 kVA. The optimal load of the generator was assumed to be 80% of the full load hence the
total load was found as: For load 1
80% = 908.95 kVA
100% = kVA19.113680
10095.908
For load 2
80% = 792.43 kVA
100% = kVA54.99080
10043.792
A standard 1250 kVA, 50Hz Cummins generator was found appropriate for load 1 and 1000 kVA
for load 2 since it could easily accommodate the load. Diesel was the selected source of fuel as it
is readily available. In order to deal with the noise challenges, a muffler was included to reduce
the noise produced by the generator.
6.2.2 CABLE SIZE OF THE STANDBY GENERATOR
Standby generator for load 1 supplied 1250 kVA of power at 50Hz, 1500 rpm. The line current
(IL) was:
A 1739 415 3
KVA 1250 IL
For load 2 a 1000 kVA generator supplied power. The line current was given by
1391.2A 415 3
KVA 1000 IL

44
From the standard cable sizes tables in appendix 3, no cable had a current carrying capability that
matched 1739A or 1391.2A. The current was therefore divided into three so that three parallel
cables were used in supply. Design current for generator 1 was hence 579.67A and for generator
2 was 463.7A. This is illustrated in figure 6-1.
The length of the cable from the generator 1 to the switch board was 7m. A maximum of 2%
voltage drop was allowed on this cable. Therefore:
415
100
1000
0.15mV/A/m 579.67A 7m drop voltage%
= 0.15%.
0.15 % is less than 2%, thus 500mm2 XLPE insulated and PVC sheathed 3-core copper
conductor with a voltage drop rate of 0.15mV/A/m and a current carrying capacity of 597A was
selected.
For generator 2 the length to the switch board was 3m. The voltage drop was given as;
415
100
1000
0.19mV/A/m 463.7A 7m drop voltage%
= 0.15 %.
A 400mm2 XLPE insulated and PVC sheathed 3-core copper conductor with a voltage drop of
0.19 mV/A/m and a current carrying capacity of 478A was selected
BUS BARS
RED YELLOW BLUE
FROM GENERATOR: 3 -
THREE PHASE CABLES
IN PARALLEL
Figure 6-1 Cables feeding the generator

45
6.3 ELECTRICAL DISTRIBUTION SYSTEM RETICULATION.
Figure 6-2 Electrical distribution system reticulation for transformer 1
Figure 6-3 Electrical distribution system reticulation for transformer 2

46
6.4 POWER FACTOR CORRECTION
Capacitor banks were used in the correction of the power factor. They were installed at the switch
board. Load 1 was 908.95kVA. A power factor of 0.85 is assumed before correction and a power
factor of 0.9 after correction, as required by KPLC. The power factor before and after correction
is as shown in figure 6-4.
Since a 104.47kVAR capacitor bank was not available in the market, a 150kVAR ABB 300series
capacitor bank electronically switched in 3 steps of 50kVAR each was selected.
The distance of the capacitor bank from the switch board was 5m. The maximum current drawn
by the capacitor bank = 3 415V
1000 104.47kVAR
= 145.34A
The 4-core PVC copper non-armoured 50mm2 cable with a current carrying capacity of 149A and
a voltage drop rate of 0.8mV/A/m was found appropriate. The voltage drop was 0.14%. Load 2
used the same capacitor bank rating.
6.5 DETERMINATION OF PROSPECTIVE FAULT CURRENTS
6.5.1 FAULT CURRENT AT THE SWITCHBOARD LEVEL
The fault current that was likely to occur at the switchboard level was calculated. The worst fault
that would occur was a 3 phase fault.
For both transformer 1 and 2 the transformer size was 1000kVA (KPLC provided). This gave the
base kVA (kVAB).
KVAR after power factor
correction
Capacitor bank
= 478.66 – 374.19
= 104.47kVAR
KVAR after power factor
correction
= 772.61kW tan 25.84°
= 374.19kVAR
KVAR before power factor
correction
= 772.61KW tan31.78°
= 478.66kVAR
908.95KVA
772.61KW
Cos-1 0.9
Cos-1 0.85
Figure 6-4 Power factor correction diagram

47
Base kV (kVB) was the transformer’s secondary voltage = 415V
MVA
)(kV impedane Base
B
B2
= 0.1722 1
415.0 2
The per unit (p.u) reactance for a 1000kVA transformer = 0.0475 p.u
The length of the cable from the transformer to the switch room = 10m = 0.01km
The series impedance of the feeder = 0.12 + j0.48 Ω/phase/km.
The actual feeder impedance was hence given by (0.12 + j0.48) Ω/phase/km × 0.01km = 0.0012+
j0.0048 Ω/phase
p.u impedance of feeder = impedance Base
impedance Actual
= p.u 0.028 j 0.007 0.1722
j0.0048 0.0012
The most severe fault was a three phase fault; therefore there was need to determine the three phase
fault at the bus bars.
impedancep.u
ep.u voltag current fault .u p
p.u IFimpedancefeeder impedancep.u r transforme
ep.u voltag
p.u 84.7- 13.19 j0.028 0.007 j0.0475
1
The base current (IB) = 0.415 3
1000
KV Base 3
KVA Base
= 1391.2A
The actual current I = Base current IB × p.u IF
= 84.7- 13.19 A 1391.2
= 18.4 kA (This is the 3-phase fault current at the switchboard level). This
was the same for transformer 2.

48
6.5.2 FAULT CURRENT AT THE BEGINNING OF THE FINAL CIRCUITS
Figure 6-5 Layout for fault calculation
Figure 6-4 shows the layout for the fault calculation for a fault occurring a final circuit.
In CU-A2-1, the largest MCB on this CU was rated 32A and it protected the kitchen unit. The total
load current drawn by this CU was 80.97A. In order to maintain discrimination between the
consumer unit and the service turret and also to protect the consumer unit, if a fault occurs in the
kitchen ring final circuit, the MCB protecting it should trip. If it does not, the fuse in service turret
5 will break to clear the fault. The fault current is calculated as follows;
Let X Ω: impedance of one phase winding of the transformer
Z1 Ω: impedance of one phase and neutral of the KPLC incomer
Z2 Ω: impedance of one phase and neutral of the cable between the switchboard and the service
turret.
Z3 Ω: impedance of the phase and neutral of the cable between the service turret and the
consumer unit
The p.u transformer impedance = j0.0475 Ω since the base impedance is 0.1722 Ω as calculated
in section 6.5.1, the actual impedance Z = base impedance × p.u impedance
= 0.1722 × j0.0475
X = j0.0081 Ω
In order to take into account the live and the neutral conductors, the impedances were multiplied
by 2.
Impedance of the KPLC incomer Z1= (0.12 + j0.48) Ω/phase/km × 0.01 km × 2
= 0.0024+ j0.0096

49
Impedance of the cable between lv switchboard and service turret Z2,
= 0.0764 x 0.033 x 2 = 0.005
Impedance of the cable between service turret and consumer unit Z3,
= 0.321 x 0.041 x 2 = 0.026
The fault current was therefore, IF = 321 Z Z Z
240
X
= 0.026 0.005 0.0096 j 0.0024 0081.0
240
j
IF = A 9.276349
The above implementation was applied to the rest of the consumer units and the results
summarized in table 6-3. Fault current levels for the service turrets was summarized in table 2-9,
appendix 2.
Table 6-3 Prospective fault levels for the consumer units
CU
NAME
CABLE SIZE
(mm2)
CABLE LENGTH
(m)
IMPEDANCE
(Ω)
FAULT
CURRENT (A)
CU-A2-1 70 41 0.033+0.0177j 6349
CU-A2-2 70 48 0.037+0.0177j 5800
CU-A2-3 70 40 0.033+0.0177j 6349
CU-A2-4 70 41 0.033+0.0177j 6349
CU-A2-5 70 43 0.040+0.0177j 5441
CU-A2-6 70 33 0.033+0.0177j 6349
CU-A2-7 70 29 0.030+0.0177j 6822
CU-A2-8 70 38 0.036+0.0177j 5929
CU-A2-9 70 46 0.033+0.0177j 6349
CU-A2-10 70 63 0.052+0.0177j 4339
CU-A2-26 70 30 0.032+0.0177j 6500
CU-B2-11
CU-
B2-11
70 34 0.035+0.0177j 6064
CU-B2-12 70 26 0.029+0.0177j 6993
CU-B2-13 70 42 0.039+0.0177j 5556
CU-B2-14 70 30 0.026+0.0177j 7550
CU-B2-15 70 36 0.035+0.0177j 6064
CU-B2-16 70 58 0.052+0.0177j 4339
CU-B2-17 70 58 0.052+0.0177j 4339
CU-B2-18 70 38 0.036+0.0177j 5929
CU-B2-19 70 28 0.030+0.0177j 6822
CU-B2-20 70 38 0.036+0.0177j 5929

50
CU NAME CABLE SIZE
(mm2)
CABLE LENGTH
(m)
IMPEDANCE
(Ω)
FAULT
CURRENT (A)
CU-B2-21 70 50 0.038+0.0177j 5676
CU-B2-22 70 33 0.025+0.0177j 7752
CU-B2-23 70 25 0.020+0.0177j 8886
CU-B2-24 70 43 0.030+0.0177j 6822
CU-B2-25 70 34 0.026+0.0177j 7550
CU-B2-27 70 25 0.029+0.0177j 6993
CU-B2-28 70 35 0.035+0.0177j 6064
CU-B2-29 70 36 0.035+0.0177j 6064
CU-B2-30 70 24 0.033+0.0177j 6409
CU-B2-31 70 33 0.052+0.0177j 4339
CU-B2-32 70 50 0.052+0.0177j 4339
CU-B2-33 70 58 0.052+0.0177j 4339
CU-B2-34 70 39 0.036+0.0177j 5929
CU-B2-35 70 31 0.025+0.0177j 7752
CU-B2-36 70 26 0.030+0.0177j 6822
CU-B2-37 70 36 0.036+0.0177j 5929
CU-B2-38 70 34 0.026+0.0177j 7550
CU-B2-39 70 25 0.020+0.0177j 8886
CU-B2-40 70 38 0.035+0.0177j 6064
CU-B2-41 70 29 0.031+0.0177j 6658
CU-B2-42 70 29 0.031+0.0177j 6658
CU-B2-43 70 46 0.050+0.0177j 4493
CU-B2-44 70 31 0.040+0.0177j 4492
CU-B2-45 70 29 0.039+0.0177j 5556
CU-B2-46 70 31 0.040+0.0177j 4492
CU-B2-47 70 45 0.050+0.0177j 4493
CU-B2-48 70 33 0.043+0.0177j 5120
CU-B2-49 70 23 0.037+0.0177j 5800
CU-B2-50 70 29 0.037+0.0177j 5800
CU-B2-51 70 40 0.048+0.0177j 4657
CU-C2-52 70 34 0.033+0.0177j 6349
CU-C2-53 70 26 0.030+0.0177j 6822
CU-C2-54 70 42 0.039+0.0177j 5556
CU-C2-55 70 34 0.034+0.0177j 6203
CU-C2-56 70 26 0.029+0.0177j 6993
CU-C2-57 70 35 0.034+0.0177j 6203
CU-C2-58 70 50 0.046+0.0177j 4832
CU-C2-59 70 45 0.050+0.0177j 4493
CU-C2-60 70 31 0.040+0.0177j 4492
CU-C2-61 70 31 0.040+0.0177j 4492
CU-C2-62 70 57 0.057+0.0177j 3995
CU-C2-63 70 42 0.047+0.0177j 4743

51
CU NAME CABLE SIZE
(mm2)
CABLE LENGTH
(m)
IMPEDANCE
(Ω)
FAULT
CURRENT (A)
CU-C2-64 70 33 0.041+0.0177j 5330
CU-C2-65 70 27 0.037+0.0177j 5800
CU-C2-66 70 34 0.041+0.0177j 5330
CU-C2-67 70 42 0.039+0.0177j 5556
CU-C2-68 70 38 0.036+0.0177j 5929
CU-C2-69 70 30 0.031+0.0177j 6658
CU-C2-70 70 36 0.035+0.0177j 6064
CU-C2-71 70 46 0.035+0.0177j 6064
CU-C2-72 70 44 0.039+0.0177j 5556
CU-C2-73 70 34 0.033+0.0177j 6349
CU-C2-74 70 35 0.033+0.0177j 6349
CU-C2-75 70 48 0.043+0.0177j 5120
6.6 DISCRIMINATION
6.6.1 DISCRIMINATION BETWEEN CONSUMER UNITS AND SERVICE TURRETS
This section would show how the protection devices used would ensure discrimination between
the consumer units and service turrets. CU-A2-1 was used to illustrate.
The load current was 80.97A as obtained in section 5.3.1.
The cable sizes used was 70mm2 with a current carrying capacity of 154A as shown in
section 5.6.1.
From table 6-3, the fault current arrived at was 6349A. The highest rated MCB as seen in section
5.4.1 was 32 A with a short circuit rating of 10kA. Cut-outs arranged with high rating capacity
fuses rated 100 Amps according to BS1361 were used in the service turrets to achieve
discrimination between the consumer unit and service turret as shown from the MEM Catalogue
Table in the Appendix 3. This was applied to the rest of the CUs and the results summarized in
table 6-4.

52
Table 6-4 Discrimination between CUs and their respective service turrets
CU NAME LOAD
CURRENT
(A)
CABLE
SIZE
(MM2)
CURRENT
CARRYING
CAPACITY
(A)
RATING OF
THE
LARGEST
MCB IN CU
(A)
FAULT
CURRENT
(A)
SERVICE
TURRET
FEEDING
CU
RATING OF
HRC FUSE
IN
SERVICE
TURRET(A)
CU-A2-1 80.97 70 154 32 6349 ST.5 100
CU-A2-2 80.97 70 154 32 5800 ST.5 100
CU-A2-3 80.97 70 154 32 6349 ST.5 100
CU-A2-4 80.97 70 154 32 6349 ST.5 100
CU-A2-5 80.97 70 154 32 5441 ST.6 100
CU-A2-6 80.97 70 154 32 6349 ST.6 100
CU-A2-7 80.97 70 154 32 6822 ST.6 100
CU-A2-8 80.97 70 154 32 5929 ST.6 100
CU-A2-9 80.97 70 154 32 6349 ST.6 100
CU-A2-10 80.97 70 154 32 4339 ST.6 100
CU-A2-26 80.97 70 154 32 6500 ST.4 100
CU-B2-11 80.45 70 154 32 6064 ST.4 100
CU-B2-12 80.45 70 154 32 6993 ST.4 100
CU-B2-13 80.45 70 154 32 5556 ST.2 100
CU-B2-14 80.45 70 154 32 7550 ST.2 100
CU-B2-15 80.45 70 154 32 6064 ST.2 100
CU-B2-16 80.45 70 154 32 4339 ST.2 100
CU-B2-17 80.45 70 154 32 4339 ST.1
100
CU-B2-18 80.45 70 154 32 5929 ST.1 100
CU-B2-19 80.45 70 154 32 6822 ST.1 100
CU-B2-20 80.45 70 154 32 5929 ST.1 100
CU-B2-21 80.45 70 154 32 5676 ST.3 100
CU-B2-22 80.45 70 154 32 7752 ST.3 100
CU-B2-23 80.45 70 154 32 8886 ST.3 100
CU-B2-24 80.45 70 154 32 6822 ST.3
100
CU-B2-25 80.45 70 154 32 7550 ST.3 100
CU-B2-27 80.45 70 154 32 6993 ST.4 100
CU-B2-28 80.45 70 154 32 6064 ST.4 100
CU-B2-29 80.45 70 154 32 6064 ST.2 100
CU-B2-30 80.45 70 154 32 6409 ST.2 100
CU-B2-31 80.45 70 154 32 4339 ST.2 100
CU-B2-32 80.45 70 154 32 4339 ST.2 100
CU-B2-33 80.45 70 154 32 4339 ST.1 100
CU-B2-34 80.45 70 154 32 5929 ST.1 100
CU-B2-35 80.45 70 154 32 7752 ST.1 100
CU-B2-36 80.45 70 154 32 6822 ST.1 100
CU-B2-37 80.45 70 154 32 5929 ST.1 100
CU-B2-38 80.45 70 154 32 7550 ST.3 100
CU-B2-39 80.45 70 154 32 8886 ST.3 100

53
CU NAME LOAD
CURRENT
(A)
CABLE
SIZE
(MM2)
CURRENT
CARRYING
CAPACITY
(A)
RATING
OF THE
LARGEST
MCB IN CU
(A)
FAULT
CURRENT
(A)
SERVICE
TURRETFE
EDING CU
RATING
OF HRC
FUSE IN
SERVICE
TURRET(A
)
CU-B2-40 80.45 70 154 32 6064 ST.10
100
CU-B2-41 80.45 70 154 32 6658 ST.10
100
CU-B2-42 80.45 70 154 32 6658 ST.10
100
CU-B2-43 80.45 70 154 32 4493 ST.9
100
CU-B2-44 80.45 70 154 32 4492 ST.9
100
CU-B2-45 80.45 70 154 32 5556 ST.9
100
CU-B2-46 80.45 70 154 32 4492 ST.9
100
CU-B2-47 80.45 70 154 32 4493 ST.9
100
CU-B2-48 80.45 70 154 32 5120 ST.8 100
CU-B2-49 80.45 70 154 32 5800 ST.8 100
CU-B2-50 80.45 70 154 32 5800 ST.8 100
CU-B2-51 80.45 70 154 32 4657 ST.8 100
CU-C2-52 79.86 70 154 32 6349 ST.7 100
CU-C2-53 79.86 70 154 32 6822 ST.7 100
CU-C2-54 79.86 70 154 32 5556 ST.10 100
CU-C2-55 79.86 70 154 32 6203 ST.10 100
CU-C2-56 79.86 70 154 32 6993 ST.10 100
CU-C2-57 79.86 70 154 32 6203 ST.10 100
CU-C2-58 79.86 70 154 32 4832 ST.10 100
CU-C2-59 79.86 70 154 32 4493 ST.9
100
CU-C2-60 79.86 70 154 32 4492 ST.9
ST.9
100
CU-C2-61 79.86 70 154 32 4492 ST.9
100
CU-C2-62 79.86 70 154 32 3995 ST.8 100
CU-C2-63 79.86 70 154 32 4743 ST.8 100
CU-C2-64 79.86 70 154 32 5330 ST.8 100
CU-C2-65 79.86 70 154 32 5800 ST.8 100
CU-C2-66 79.86 70 154 32 5330 ST.8 100
CU-C2-67 79.86 70 154 32 5556 ST.7 100
CU-C2-68 79.86 70 154 32 5929 ST.7 100
CU-C2-69 79.86 70 154 32 6658 ST.7 100
CU-C2-70 79.86 70 154 32 6064 ST.3 100
CU-C2-71 79.86 70 154 32 6064 ST.3 100
CU-C2-72 79.86 70 154 32 5556 ST.7 100
CU-C2-73 79.86 70 154 32 6349 ST.7 100
CU-C2-74 79.86 70 154 32 6349 ST.7 100
CU-C2-75 79.86 70 154 32 5120 ST.7 100

54
6.6.2 DISCRIMINATION BETWEEN SERVICE TURRETS AND LV SWITCH BOARD
Table 6-5 Discrimination between service turrets and the low voltage switchboard.
SERVICE
TURRET
NAME
LOAD
CURRENT
(A)
CABLE
SIZE
(mm2)
CURRENT
CARRYING
CAPACITY (A)
RATING OF
THE SERVICE
TURRET
FUSES(A)
FAULT
CURRENT
(A)
RATING OF TP/N
FRAME MCCB
UPSTREAM IN
SWITCHBOARD (A)
ST-1 162 240 301 100 12,510 320
ST-2 162 240 301 100 11,105 320
ST-3 161 240 301 100 10,810 320
ST-4 241.35 300 301 100 8,886 320
ST-5 241.35 300 301 100 11,105 320
ST-6 241.35 300 301 100 8,886 320
ST-7 241.35 300 339 100 8,406 320
ST-8 239.58 300 339 100 11,105 320
ST-9 241.35 300 339 100 10,229 320
ST-10 241.35 300 339 100 13,159 320
6.6.3 DISCRIMINATION BETWEEN GENERATOR MCCB AND LV SWITCHBOARD
The whole estate was under backup hence the generator phase currents were found by summing
up the phase currents in the service turrets. This was shown in table 6-6.
Table 6-6 Generator 1 phase currents
Service turret RED PHASE (A) YELLOW PHASE
(A)
BLUE PHASE
(A)
ST.1 161.94 80.97 80.97
ST.2 161.94 161.94 161.94
ST.3 160.9 160.9 80.97
ST.4 241.35 241.35
241.35
ST.5 239.58 159.72 241.35
ST.6 159.87 240.76 241.35
TOTALS 1125.58 1045.64 1047.93

55
Table 6-7 Generator 2 phase currents
Service turret RED PHASE (A) YELLOW PHASE
(A)
BLUE PHASE
(A)
ST.7 241.35 239.58 240.17
ST.8 239.58 239.58 239.58
ST.9 241.35 241.35 241.35
ST.10 160.90 241.35
240.17
TOTALS 883.18 961.86 961.27
Assuming 15% generator 1 reactance, the fault current was found to be:
= A593,1115.04153
10001250
A three phase fault would produce the largest fault current; this was therefore used as the basis to
select the short-circuit capabilities. The largest MCCB on switch board 1 was rated 320A. An
MCCB was hence required, that would allow a load current of 1125A to pass through, withstanding
a fault current of 11593 Amps, and discriminating 320 Amps MCCB at the switchboard in case of
fault at the service turrets. The appropriate MCCB is a 1250 Amps TP/N MEM M FRAME MCCB.
For generator 2 and lv switch board 2, fault current was found to be;
A927515.04153
10001000
The largest MCCB on switch board 2 was rated 320A. An MCCB was hence required, that would
allow a load current of 962A to pass through, withstanding a fault current of 9275 Amps, and
discriminating 320 Amps MCCB at the switchboard in case of fault at the service turrets. The
appropriate MCCB is a 1000 Amps TP/N MEM M FRAME MCCB.

56
6.7 LIGHTNING PROTECTION
Lightning arrestors were used. Air terminals were installed at the sharp points on the roof to
intercept lightning diverting it from people and equipment. The air terminals were then
interconnected via copper strips which ran along the roof ridges, then to the ground. The
conductors had to be straight to offer a direct path to the ground and gave a maximum resistance
of 10 ohms as per BS 6651. [10] Considering the value of the property, AC and signal surge
protectors were installed at the buildings main power entrance. This is shown in figure 6.5.
Figure 6-6 Lightning Protection Layout for unit A2

57
Chapter 7
7.1 RECOMMENDATIONS FOR FUTURE WORK
The areas of improvement in the project include:
Design of a program that would perform the calculations, for example, in cable sizing
and fault current calculations.
Preparing a bill of quantities. This is a document gives details of the materials, parts,
labour and their costs. The terms of implementation and repair contact are itemised. It
serves in helping to source contractual services.
Using an alternative source of energy for backup power supply; solar energy would be a
good option since it is economical.
7.2 CONCLUSION
This project aimed at designing a lighting, power distribution system protection scheme for a
residential estate. In lighting design, the number and placement of light fittings was determined
by use of the lumen method and the point-by-point method used to determine the illuminance at a
point. Road lighting was also done and the spacing calculated between each luminaire was found
to be 31m.
Circuiting was also done with switches being allocated too. Power points were placed in
accordance with the recommendations given by The Electrical Installation Industry Liaison
Committee.
Under power distribution, the total load in the estate was 1606.5 kVA. Due to the location of the
houses, the total load of the estate was split into two, load 1 being 908.95 kVA and load 2 was
792.43 kVA the loads fed by two 1000 kVA transformers. This was done to reduce the voltage
drop that was is caused by long distances between the transformers and the final power outlet.
From the KPLC feeder power was feed to the transformers. From the transformers, power was
supplied to the low voltage switch board which had two bus bars. The maintained and the essential
bus bar. The low voltage switchboard fed the service turrets and the service turret distributed power
to the individual consumer units. Consumer units with integral isolator of 100A and 14 circuit

58
breaker ways were used in each housing unit to supply power to the single phase loads. The total
number of consumer units was 75. A total of 10 service turrets were used in the estate.
1250kVA and 1000kVA capacity backup generators were used to supply power to the estate. An
electrical reticulation diagram was designed to show the major distribution points and their
interconnection.
Cable sizing was done in accordance with the IEE regulations. For the consumer unit a 70 mm2
core copper conductor with a voltage drop of 0.61 mV/A/m and a current carrying capability of
154 A was selected as the incoming cable. For the service turrets a 300 mm2 PVC insulated, PVC
sheathed conductor with a current carrying capacity of 339A and a voltage drop of 0.20 mV/A/m
was selected.
Consumer loads and cable protection was achieved using MCBs and MCCBs. Fault currents were
calculated and a magnitude of 18.4 kA was arrived at as the three phase fault current at the
switchboard level. Discrimination was achieved by using the fault currents at various levels.
Lightning protection was also achieved using a lightning protection system and surge protectors.
Power factor correction was also done using 104.47kVAR capacitors at the switchboard.
A great challenge was encountered in load balancing as the design of the estate used the consumer
unit load in balancing. This made it very difficult to split the load so as to ensure proper load
balance in the 3 phases.
The objectives of the project were hence fully met.

59
APPENDIX 1: LIGHT DESIGN
Table 1-1 Number of fittings in housing A2
Name of the
area
Area m2 Required
Illuminance
(lux)
Type of fitting(by
naming convention)
Number of
fittings
Lounge 29.86m2 100 TYPE G 5
Dining
7.83 m2 100 TYPE C 1
Family room
7.76 m2 145 TYPE C 1
Study room 7.88 m2
200 TYPE G 4
Kitchen
14.80 m2 200 TYPE G 5
Guest room
12.38 m2 100 TYPE C
TYPE W(for accentuation)
1
Master
bedroom
23.91 m2 120 TYPEG
TYPE W(for accentuation)
5
Bedroom 2
11.71 m2 100 TYPE C
TYPE W(for accentuation)
1
Bedroom 3
10.60 m2 100 TYPE C
TYPE W(for accentuation)
1
Lobby and
passage
100 TYPE F 2
Closet
6.01 m2 100 TYPE D 2
Store
0.71 m2 100 TYPE D 1
Bathrooms
100 TYPE B 1
Exterior
entrances
100 TYPE N 4
Outdoor lights
100 TYPE K 9
Porch TYPE P 1

60
Name of the
area
Area m2 Required
Illuminance
(lux)
Type of fitting(by
naming convention)
Number of
fittings
Stairs
100 TYPE S 3
DSQ
7.24 m2 100 TYPE C
TYPE W(for accentuation)
1
Table 1-2 Number of fittings in housing B2
Name of the area Area m2 Required
Illuminance
(lux)
Type of fitting(by naming
convention)
Number of
fittings
Lounge 23.49 m2 100 TYPE G
5
Dining
6.74 m2 100 TYPE CH 1
Kitchen
14.14 m2 200 TYPE G
5
Guest room
11.16 m2 100 TYPE C
TYPE W(for accentuation)
1
Master bedroom
25.41 m2 100 TYPE G
TYPEW(for accentuation)
5
Bedroom 1
10.29 m2 100 TYPE C
TYPE W(for accentuation)
1
Bedroom 2
11.03 m2 100 TYPE C
TYPE W(for accentuation)
1
Lobby and passage 100 TYPE F 2
Closet
5.20 m2 100 TYPE D 2
Store
0.35 m2 100 TYPE D 1
Bathrooms
100 TYPE B 1
Exterior entrances
TYPE N 3

61
Outdoor lights
TYPE K 7
Name of the area Area m2 Required
Illuminance
(lux)
Type of fitting(by naming
convention)
Number of
fittings
Porch
TYPE P 1
Stairs
TYPE S 3
DSQ
6.75 m2 100 TYPE C
TYPE W(for accentuation)
1
Table 1-3 Number of fittings in housing C2
Name of the area Area m2 Required
Illuminance
(lux)
Type of fitting(by
naming convention)
Number of
fittings
Lounge 24.77m2 100 TYPE G
5
Dining
6.77 m2 100 TYPE CH 1
Kitchen
14.37 m2 200 TYPE G
5
Guest room
11.52 m2 100 TYPE C
TYPE W(for accentuation)
1
Master bedroom
19.59 m2 100 TYPE G
TYPE W(for accentuation)
5
Bedroom 1
9.93 m2 100 TYPE C
TYPE W(for accentuation)
1
Lobby and passage 100 TYPE F 2
Closet
5.41 m2 100 TYPE D 1
Store
0.43 m2 100 TYPE D 1
Bathrooms
100 TYPE B 1
Exterior entrances
TYPE N 4

62
Outdoor lights
TYPE K 7
Name of the area Area m2 Required
Illuminance
(lux)
Type of fitting(by
naming convention)
Number of
fittings
Porch
TYPE P 1
Stairs
100 TYPE S 3
DSQ
7.40 m2 100 TYPE C
TYPE W(for accentuation)
1

63
APPENDIX 2: LOAD CALCULATIONS
Table 2-1lighting final circuit 1(CIR.L1)
Fitting Number
of
fittings
Diversity
factor
Lamp
wattage
(Watts)
Total
load(Watts)(applying
diversity factor)
Type C 1 0.66 20W 13.2
Type W 3 0.66 28W 55.44
Type F 2 0.66 16W 21.12
Type G 4 0.66 26W 68.64
Type B 1 0.66 28W 18.48
TOTAL 176.88W
Table 2-2 lighting final circuit 2(CIR.L2)
Fitting Number
of
fittings
Diversity
factor
Lamp
wattage
(Watts)
Total
load(Watts)(applying
diversity factor)
Type C 1 0.66 20W 13.2 W
Type W 5 0.66 28W 92.4W
Type G 5 0.66 26W 85.8W
Type D 2 0.66 11.5W 15.18 W
Type B 2 0.66 28W 36.96 W
Type S 3 0.66 28W 55.44W
TOTAL 298.98 W
Table 2-3 lighting final circuit 3(CIR.L3)
Fitting Number
of
fittings
Diversity
factor
Lamp
wattage
(Watts)
Total
load(Watts)(applying
diversity factor)
Type C 2 0.66 20W 26.4W
Type W 3 0.66 28W 55.44W
Type G 5 0.66 26W 85.8W
Type B 2 0.66 28W 36.96W
Type F 2 0.66 16W 21.12W
Type P 1 0.66 18W 11.88W
TOTAL 237W

64
Table 2-4 lighting final circuit 4(CIR.L4)
Fitting Number
of
fittings
Diversity
factor
Lamp
wattage
(Watts)
Total
load(Watts)(applying
diversity factor)
Type G 5 0.66 26W 85.8W
Type D 1 0.66 11.5W 7.59W
Type K 2 0.66 18W 23.76W
Type C 2 0.66 20W 26.4W
Type W 3 0.66 28W 55.44W
Type B 1 0.66 28W 18.48W
TOTAL 217.43W
Table 2-5 Calculation of maximum demand in unit B2
LOAD Diversity factor Total Load(Watts) Total load current(A)
Lighting circuit 1 0.66 163.68W 0.68A
Lighting circuit 2 0.66 242.94W 1.01A
Lighting circuit 3 0.66 231 W 0.96A
Lighting circuit 4 0.66 217.47 W 0.906A
CIR.T(outdoor lighting) 0.66 83.16 W 0.35A
Ring circuit 1 1 7680 32A
Ring circuit 2 0.4 3072 13A
Cooker unit
10A+30%for
appliances in
excess of 10A +
5A for socket
incorporation
6120
25.5A
Water heater 1 1500 6.25A
TOTAL 19,310 W 80.45A

65
Table 2-6 Calculation of maximum demand in unit C2
LOAD Diversity factor Total load(Watts) Total load current(A)
Lighting circuit 1 0.66 122.1 W 0.51A
Lighting circuit 2 0.66 161.04W 0.67A
Lighting circuit 3 0.66 187.44W 0.78A
Lighting circuit 4 0.66 229.35 W 0.96A
CIR.T 0.66 95.04W 0.40
Ring circuit 1 1 7680 W 32A
Ring circuit 2 0.4 3072 W 13A
Cooker unit 10A+30%for appliances
in excess of 10A + 5A
for socket incorporation
6120 W 25.5A
Water heater 1 1500 W 6.25A
TOTAL 19,167W 79.86A
Table 2-7 MCBs in DB-B2-1
Type of load Total load (Watts) Total
Current load (A)
MCB
size
Cable size
(mm2)
Lighting CIR.LI 163.68W 0.68A 4A 1mm2
Lighting CIR.L2 242.94W 1.01A 4A 1mm2
Lighting CIR.L3 231 W 0.96A 4A 1mm2
Lighting CIR.L4 217.47W 0.906A 4A 1mm2
CIR.T(outdoor
lighting)
83.16W 0.35 A 4A 1mm2
Ring circuit CIR.R1 7680W 32A 32A 2.5 mm2
Ring circuit CIR.R2 3072W 13A 32A 2.5 mm2
Cooker CIR.DI 6120W 25.5A 32A 6 mm2
Water heater 1500W 6.25A 13A 2.5 mm2

66
Table 2-8 MCBs in DB-C2-1
Type of load Total
load
(Watts)
Total
Current load
(A)
MCB
size
Cable size (mm2)
Lighting CIR.LI 122.1 W 0.51A 4A 1mm2
Lighting CIR.L2 161.04W 0.67A 4A 1mm2
Lighting CIR.L3 187.44W 0.78A 4A 1mm2
Lighting CIR.L4 229.35W 0.96A 4A 1mm2
CIR.T(outdoor light) 95.04W 0.40 4A 1mm2
Ring circuit CIR.R1 7680 W 32A 32A 2.5 mm2
Ring circuit CIR.R2 3072 W 13A 32A 2.5 mm2
Cooker CIR.DI 6120 W 25.5A 32A 6 mm2
Water heater 1500 W 6.25A 13A 2.5 mm2
Table 2-9 Fault current levels for the service turrets
SERVICE
TURRET
NAME
CABLE SIZE
(mm2)
CABLE LENGTH
(m)
IMPEDANCE
(Ω)
FAULT
CURRENT (A)
ST-1 240 33 0.007+0.0177j 12,510
ST-2 240 53 0.012+0.0177j 11,105
ST-3 240 70 0.013+0.0177j 10,810
ST-4 300 125 0.020+0.0177j 8,886
ST-5 300 50 0.012+0.0177j 11,105
ST-6 300 123 0.020+0.0177j 8,886
ST-7 300 100 0.022+0.0177j 8,406
ST-8 300 62 0.012+0.0177j 11,105
ST-9
300 86 0.015+0.0177j 10,229
ST-10 300 15 0.004+0.0177j 13,159

67
APPENDIX 3: CATALOGUES

68

69

70

71

72

73
REFERENCES
[1] Basics of Light and Lighting: PHILLIPS
[2] Zumtobel: The Lighting Handbook: 1nd Edition, printed by Zumtobel Lighting GmbH
Schweizer Strasse 30 Postfach 72 6851 Dornbirn, AUSTRIA 2004.
[3] Harald Hofman and Rudiger Ganslant: Handbook of interior lighting design, ERCO edition,
published by Druckhaus Maack, Lüdenscheid in 1992.
[4] Illuminating Engineering Society of North America: IESNA Lighting handbook, reference and
application, 9TH edition
[5] SaskPower: Roadway lighting Design Handbook, Standard engineering practice section 4,
2013
[6] Fred Hall and Roger Greeno: Building services handbook, 5th Edition, printed by Elsevier
Limited Linacre House, Jordan Hill Oxford OX2 8DP 30 Corporate Road, Burlington, 2009.
[7] W E Steward and T A Stubbs with technical contributions by Trevor Marks and Steve Clarke
(Burlington) Elsevier: Modern Wiring Practice: Design and installation; Revised Edition printed
by Elsevier Limited Linacre House, Jordan Hill Oxford OX2 8DP 30 Corporate Road, Burlington,
2005.
[8] Barrie Rigby: Design for Electrical Services for Buildings 4th Edition, published by Spon press
2 Park, Milton park, Abingdon, Oxon 0X14 4RN 2005.
[9] IEE Wiring Regulations: ONSITE GUIDE BS 7671:2008 17TH Edition, published by The
Institution of Engineering and Technology, London, United Kingdom.
[10] IEEE Guide for Surge Protection of Equipment, published by standards information network
IEEE press.
[11] Contech Residential Lighting Design Guide. Copyright by Conservation Technology of
Illinois
[12] Philips lamps catalogue 2010
[13] The Thorn lighting catalogue
[14] The searchlight catalogue
[15] Technical-lighting design guide, the society of light and lighting.

74