designer financial analysis and reports - solaredge
TRANSCRIPT

Designer Financial Analysis and ReportsIntroduction The SolarEdge Designer application's Financial Analysis features provide installers with the ability to accurately forecast the system costs and future financial rewards from which customers can expect to benefit after installing SolarEdge PV systems and products. After reviewing this section you will be familiar with the way:
The Financial Analysis tab is arranged and its features
The financial information you need to provide to assess costs
To predict the financial rewards customers can expect to receive from their investment.
This guide walks you through the Financial Analysis tab by following the tab's structure and flow.
Financial Analysis Tab Arrangement
The Financial Analysis tab is easily accessed from within the Designer tool by clicking Financial Analysis in the Designer’s navigation bar. The tab is arranged as a set of cards, with each card treating a different energy or financial aspect of the system.On opening the tab you see the Financial Parameters card and part of the Energy Consumption card.
Scroll down the tab to see the remaining cards:Financial Parameters
Energy Consumption
Incentives
System Pricing
Bill of Materials (BOM)
Energy Consumption and Export Rate
Once the financial analysis information is complete you can view several financial reports:Financial overview
Estimated Bill Savings
Detailed Financial Analysis
Yearly Cash Flow
These reports equip you with informative graphs and charts that show when a customer can expect to reach the break even point on their investment and how much money is saved monthly and annually by installing SolarEdge PV systems and products.
Application Note - Using the Designer Financial Analysis Features
Designer Financial Analysis and Reports 1

Working in the Financial Analysis tabThere is no hard and fast rules about the order in which you enter information into any of the cards that make up the Financial Analysis tab. However, the more information that you provide, the more complete and accurate will be the financial forecasts that are presented in the Project Summary. For the purpose of this guide the workflow runs through the cards top to bottom as they appear in the tab.
Financial Parameters CardThe information that appears in the Financial Parameters card reflects the state of the local financial market and some financial expectations associated with the SolarEdge PV system. For convenience, an explanation of each of the financial parameters appears in the Financial Parameter Terms section.
To fill out the financial Parameters card 1. From the Currency drop-down menu select the currency to be used to perform financial calculations for the site. 2. For Cash Flow Discount Rate enter the commonly available interest rate that banks and financial institutions are providing their
clients in return for their investments. This interest rate is one of several parameters used to determine whether the long term savings associated with using the PV installation is greater than the client would receive if they had simply deposited the money in the bank.
3. For Exp. Electircity Price Increase enter a percentage that represents how much you expect the cost of electricity to increase each year.
4. For Exp. System Production Degradation enter a percentage that represents how much you expect the PV module efficiency to decrease each year.
5. For System Lifetime enter the number of years over which you expect the system perform. 6. For Equipment Lifetime enter the number of years over which you expect system equipment to run before needing to be replaced. 7. For Annual O & M Costs enter the amount you expect to spend yearly on operations and maintenance per kW(DC) installed in the
system. 8. For Equipment Replacement Cost enter the cost per kW of replacing the system equipment once the Equipment Lifetime period
has expired. 9. For National Tax Rate enter the national tax rate applied to exported system production.
10. For Local Tax Rate enter the local tax rate applied to exported system production. 11. For Bill savings are taxed as revenue by select the National Tax and or Local Tax checkboxes if Bill Savings need to be included in
the financial calculations as taxable revenue.
Energy Consumption CardThe information that appears in the Energy Consumption card deals with the amount of energy expected to be used for a set period in kWh, either annually or monthly. Initially, the value shown for Consumption is the same as that entered in the Project Info page. If the energy consumption values were not entered as part of the Project Info then the Energy Consumption fields on the Financial Analysis page appear blank. Changing the consumption value in the Energy Consumption card updates the value listed in the Project Info page. The designer also supports use of customized interval consumption data which provides a more accurate means of estimating future consumption than when using a consumption profile.The Energy Consumption chart represents the expected monthly Energy Consumption over a year, taking into consideration the estimated consumption and selected consumption profile or the data loaded from an interval consumption data file.
Application Note - Using the Designer Financial Analysis Features
2 Working in the Financial Analysis tab

A list of terms and typical Residential and Commercial consumption profiles is included in the Energy Consumption Terms section.
Estimating Consumption Using a Consumption ProfileTo set the energy consumption
1. Enter a value as kWh that represents the expected energy consumption. 2. From the Period drop-down list select whether the consumption value represents Annual or Monthly use. 3. From the Consumption Profile drop-down list select the profile that best represents the customers electricity usage. The options
in the list vary depending on whether the site is defined as being Residential or Commercial on the Project Info page.
Customized Interval Consumption DataThe Designer supports the upload of interval electricity usage data readings for a customer. Customized data provides increased accuracy for modeling future consumption. Data in the file is used instead of using the customer's annual consumption and a typical consumption profile.Data must be provided as a CSV file with the data arranged according to Green Button xml format.Click the link to view documentation on how to prepare Interval Consumption Data Files.
To To set energy consumption using interval consumption data 1. Click located next to Consumption Profile.
2. In the system search dialog box, browse for and select the CSV file that contains the customers interval consumption data and then click Open.
3. Data is loaded and reflected in the Energy Consumption card.
Incentives CardIncentives are programs offered by cities, states, utilities, and other entities that are designed to encourage the construction and use of energy saving technologies. The Designer supports the use of up to five incentives per project. Incentives that are available to subsidize the cost of a solar installation differ widely by country and state, however they generally belong to one of several types: Fixed Grants, System Cost Based Grants, System Production Based Grants and System Size Based Grants. A list of incentive types and incentive parameters is provided in the Incentive Terms section.
Incentives that are available for use and that have been chosen for use are displayed in the Incentives card together with a brief description of each selected incentive.
Once added to the list of incentives an Edit and a Duplicte icon appear next to the incentive.
This section introduces several actions that you can perform on Incentives:Adding Incentives to the Project
Creating New Incentives
Application Note - Using the Designer Financial Analysis Features
Working in the Financial Analysis tab 3
Adding Incentives to the ProjectThe Designer supports the use of up to five different incentives at a time for each project.
To add an incentive to the project
1. Click Add Incentive.
2. From the Select Incentive drop-down list browse for and select an incentive. 3. The .selected incentive is added to the bottom of the list of incentives associated with the project.
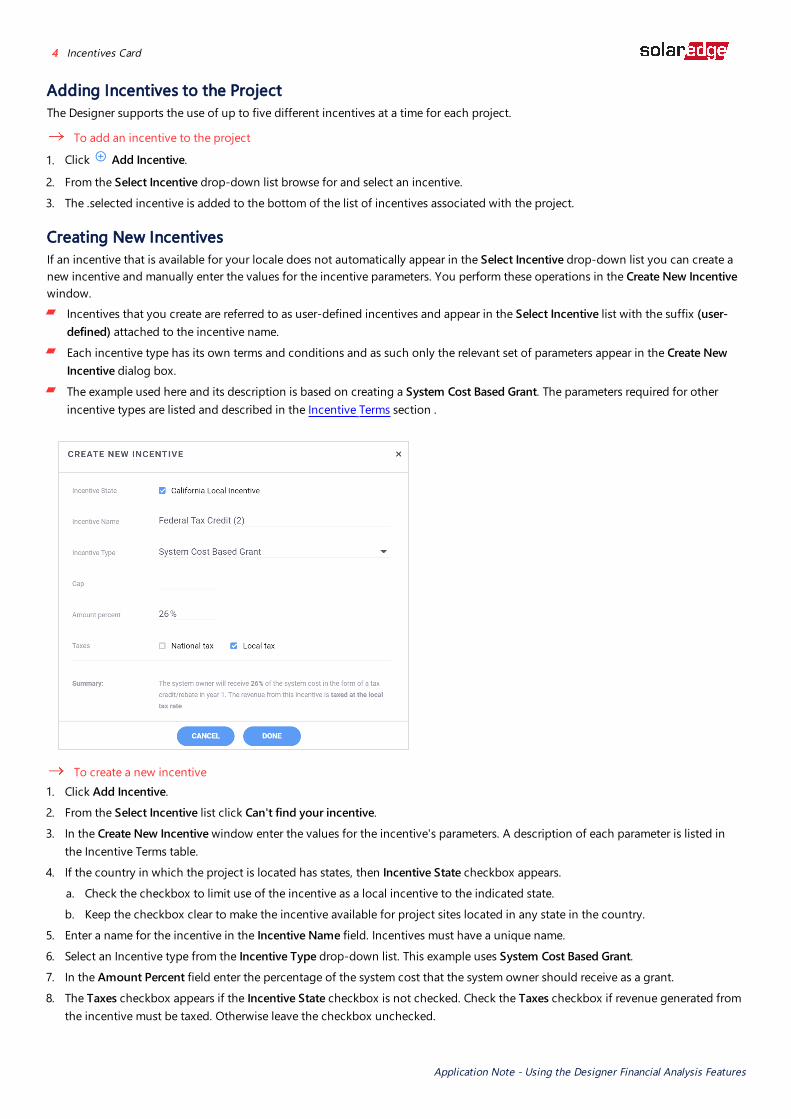
Creating New IncentivesIf an incentive that is available for your locale does not automatically appear in the Select Incentive drop-down list you can create a new incentive and manually enter the values for the incentive parameters. You perform these operations in the Create New Incentive window.
Incentives that you create are referred to as user-defined incentives and appear in the Select Incentive list with the suffix (user-defined) attached to the incentive name. Each incentive type has its own terms and conditions and as such only the relevant set of parameters appear in the Create New Incentive dialog box. The example used here and its description is based on creating a System Cost Based Grant. The parameters required for other incentive types are listed and described in the Incentive Terms section .
To create a new incentive 1. Click Add Incentive. 2. From the Select Incentive list click Can't find your incentive. 3. In the Create New Incentive window enter the values for the incentive's parameters. A description of each parameter is listed in
the Incentive Terms table. 4. If the country in which the project is located has states, then Incentive State checkbox appears.
a. Check the checkbox to limit use of the incentive as a local incentive to the indicated state. b. Keep the checkbox clear to make the incentive available for project sites located in any state in the country.
5. Enter a name for the incentive in the Incentive Name field. Incentives must have a unique name. 6. Select an Incentive type from the Incentive Type drop-down list. This example uses System Cost Based Grant. 7. In the Amount Percent field enter the percentage of the system cost that the system owner should receive as a grant. 8. The Taxes checkbox appears if the Incentive State checkbox is not checked. Check the Taxes checkbox if revenue generated from
the incentive must be taxed. Otherwise leave the checkbox unchecked.
Application Note - Using the Designer Financial Analysis Features
4 Incentives Card

9. If the Incentive State checkbox is checked then a National tax and a Local tax check box appear. Check whichever option is applicable if revenue generated from the incentive must be taxed. Otherwise leave the checkboxes unchecked.
10. Click DONE.
System Pricing CardThe System Pricing card contains options used for setting the system price. The system price can be calculated in a few ways by using:
a fixed price
a price based on Wattage
a price based on the Bill of Materials (BOM).
Select the relevant pricing type for your project from the Pricing Type drop-down list and then fill in the accompanying fields. The system price is a required component for some of the financial analysis calculations.
To set the System Price 1. Select the relevant pricing type for your project from the Pricing Type drop-down list.
For Fixed Price, enter a value for the system in the Price field.
For Price per Watt (DC), enter a price per watt DC in the Price field.
For Price according to BOM, make sure each item in the Bill of Materials card has a value in the Cost field.
2. Other than for Fixed Price, the Designer calculates the price based on the available information and displays the total cost in the System Pricing card. For more information on System Price options see System Price Terms and Bill of Materials Terms.
The parameters and terms used for System Pricing are listed and described in the System PricingTerms section.
Bill of Materials CardThe Bill of Materials (BOM) card displays an itemized list of the components and materials included in the PV system. The card displays a table that includes an Items column and a Quantity column. Each row in the BOM lists the name and quantity of each item included in the PV system. Based on the PV Module Placement and Electrical Design specifications the Designer automatically adds PV System components to the Bill of Materials. Those components cannot be deleted from the BOM by the user other than by updating the PV Module Placement and Electrical Design specifications. The Designer does however support adding custom items to the BOM.
Application Note - Using the Designer Financial Analysis Features
Working in the Financial Analysis tab 5

If pricing is based on the BOM then the card shows additional columns for Costs and Total and displays a sub total for Total Materials Cost at the bottom of the card.
Adding Custom Items to the BOMTo add custom items to the BOM
1. Click Add Custom Item to add a new row to the bottom of the BOM. 2. Enter a description for each custom item in the Items column. 3. Enter a value for the quantity of each item in the Quantity column. 4. If the Cost column is displayed then enter a value for the cost of the item.
Energy Consumption and Export Rate CardThe elements that influence the finances of a PV system over time probably more than anything else is the cost of purchasing energy from the grid and the amount the system owner can charge for selling energy derived from the PV System back to the grid. Utility Providers charge consumers for using electricity from the grid at one rate, the import rate, and in the case of PV System owners buy electricity back at another rate, the export rate. Together these two transactions are described as the Utility Rate Utility rates can have either fixed import rates that charge a single price for usage or they can be structured to reflect various amounts of usage and periods of usage for which electricity is at lower and higher demands. These aspects of the Utility Rate are treated respectively as the Charge Structure and the Charge Schedule. The Energy Consumption and Export Rate card is the place through which you select a Utility Provider and a Utility Rate. You set parameter values used by Utility Rates and set the Import Rate's, Fixed Rate, Charge Structure and Charge Schedule using the Create Rate and Edit Rate dialog boxes. For any combination of Utility Provider and Utility Rate you can view these parameters in the Rate Overview window.
The parameters and terms used for describing rates in general are listed and described in the Energy Consumption and Export Rate Terms section.This section describes how to quickly get up and running by using default settings to:
Select a Utility Provider and Utility Rate
Use an Independent Export Rate
For a guide on how to review rates and manually customize Export rates, Import rates and set other rate associated values see the section Customizing Utility Rates.
Selecting a Utility Provider and Utility RateThe Utility Provider drop-down list shows all the utility providers that have rates in the site's country and state and that match the site's currency. The Utility Rate drop-down list shows all the rates that are provided by the selected Utility Provider in the site's country and state that match the site's currency.
Application Note - Using the Designer Financial Analysis Features
6 Energy Consumption and Export Rate Card

To select a Utility Provider and Utility Rate 1. Select a Utility Provider from the Utility Provider drop-down list. 2. Select a Utility Rate that matches your needs from the Utility Rate drop-down list.
After a Utility Rate is selected the Edit and Duplicate icons appear next to the Utility Rate.
Using an Independent Export RateIn some countries and regions the Export rate that the energy utility pays for purchasing PV generated electricity is not tied to the Utility Rate. Wherever this is the case you can set an export rate that is independent of the export rate associated with the selected Utility Rate to determine the cost of energy which is purchased by the utility.After setting an Independant Export Rate, the Export Rate values associated with the selected Utiltiy Rate are disabled in the Rate Overview page and future Financial Analysis calculations ignore the Export Rate values that are defined by the Utility Rate. .
To use an independent export rate 1. In the Energy Consumption and Export Rate card check the Use independent export rate option. 2. From the adjacent Export Rate drop-down list select an export rate. The list includes export rates that are available to users in the
site country.
3. Click to open the Export Rate dialog box and modify the export rate details if required.
4. If a rate is not available click Can't find your export rate to open the Export Rate dialog box and enter values in the fields. The Rate Name and Sell Price fields are mandatory. The Rate Name can be up to 140 characters long. The Sell Price can range from zero up to but not exceed the value of the export rate offered by the utility.
5. Setting an Effective Start Date, Effective End Date and Making the rate available for users of the account and sub accounts is optional.
6. Click Save.
7. To see the value that was automatically set for the Import Rate ("Buy Price") Fixed rate, click Rate Overview to open the Rate Overview screen. The value appears in the IMPORT RATE ("BUY" PRICE) section.
Application Note - Using the Designer Financial Analysis Features
Working in the Financial Analysis tab 7
The Summary and Reports TabThe Summary and Reports tab contains two pages, Project Summary and Project Layout. For the purposes of reviewing the Financial Reports generated in response to data provided in the Financial Analysis tab we are only interested in the content of the Project Summary page. The Project Summary page includes many charts and reports however the following reports provide a summary of the Financial Analysis that was performed.
Financial overview
Estimated Bill Savings
Detailed Financial Analysis
Yearly Cash Flow
To review and print the Financial Analysis reports 1. From the Designer navigation bar click Summary & Reports and then click Project Summary. 2. Scroll down the Project Summary until you reach the Financial Overview report.
3. To print the reports click located at the top of the Summary and Reports tab.
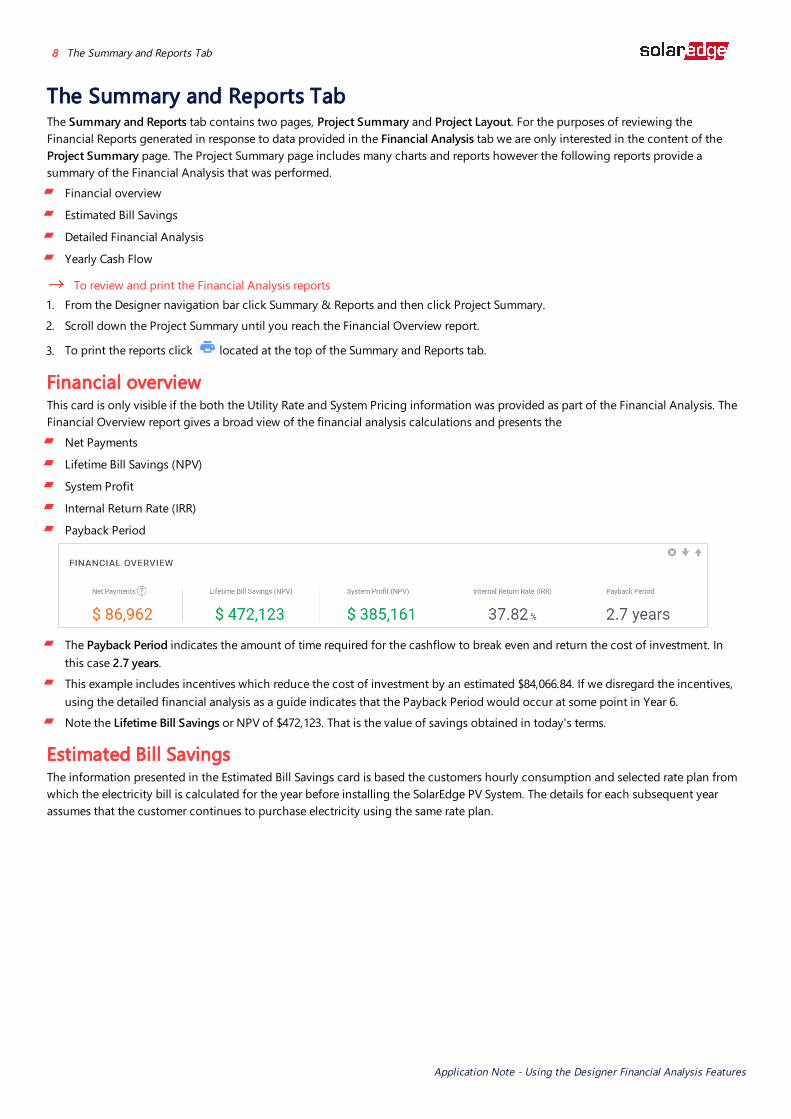
Financial overviewThis card is only visible if the both the Utility Rate and System Pricing information was provided as part of the Financial Analysis. The Financial Overview report gives a broad view of the financial analysis calculations and presents the
Net Payments
Lifetime Bill Savings (NPV)
System Profit
Internal Return Rate (IRR)
Payback Period
The Payback Period indicates the amount of time required for the cashflow to break even and return the cost of investment. In this case 2.7 years. This example includes incentives which reduce the cost of investment by an estimated $84,066.84. If we disregard the incentives, using the detailed financial analysis as a guide indicates that the Payback Period would occur at some point in Year 6.Note the Lifetime Bill Savings or NPV of $472,123. That is the value of savings obtained in today's terms.
Estimated Bill SavingsThe information presented in the Estimated Bill Savings card is based the customers hourly consumption and selected rate plan from which the electricity bill is calculated for the year before installing the SolarEdge PV System. The details for each subsequent year assumes that the customer continues to purchase electricity using the same rate plan.
Application Note - Using the Designer Financial Analysis Features
8 The Summary and Reports Tab

A year selector next to the report title allows you to display Bill Savings data for any given year in the 25 year report.
Using the switch at the top of the page you can choose to display the savings as Average Monthly or Annual amounts.
The Current Monthly/Annual Bill value estimates what the Bill for the period would be without installing the PV system.
Detailed Financial AnalysisThe Detailed Financial Analysis chartcan be presented in terms of Cummulative Cash Flow as in the figure below or in terms of Annual Cash Flow.
In this chart we can see additional data beyond that displayed in the Financial Overview. This includes:System Price
Maintenance Cost (NPV), that is in todays terms
System Profit (NPV)
Return on Investment (ROI)
Levelized Cost of Energy (LCOE), essentially the cost of producing 1kW of energy.
Application Note - Using the Designer Financial Analysis Features
The Summary and Reports Tab 9

Yearly Cash FlowThe Yearly Cash Flow report displays a table detailing the estimated Year on Year cashflow for the 25 year lifetime of the system.In addition to data that is displayed in different forms in the other reports, this table indicates the estimated Replacement Costs and when they would occur.
Application Note - Using the Designer Financial Analysis Features
10 Yearly Cash Flow

Customizing Utility RatesThis section describes how to review rates and manually customize Export rates, Import rates and set other rate associated values.
Reviewing Rates
Creating Rates
Setting the Charge Structure
Setting the Charge Schedule
Reviewing RatesYou can review the selected rate's settings and conditions by opening the Rate Overview window. The window is arranged as follows:
Rate Properties pane
Import Rate ("Buy" Price) pane
Charge Structure pane
Charge Schedule pane
The example used in the following sections and its descriptions are based on the Dometstic Time of Use Electric Vehicle Charging Utility Rate as provided by the Southern California Edison Utility Provider. The parameters and terms used for describing rates in general are listed and described in the Energy Consumption and Export Rate Terms section.
Rate Overview Different utility providers provide usage plans that vary widely for both residential and commericial purposes. These plans are generally variations of some basic types of rates. The Rate Overview section shows the Rate Properties, the Import Rate Charge Structure and Charge Schedule that together define the way a selected rate calculates the cost of energy hourly, weekly, and monthly over a year.
Charge Structure
The Charge Structure table indicates how the rate is divided into Periods and Tiers. The structure shows the rates that are applied to each period and any correction factor with is applied to the rate. Some examples of rate can be structured include:
Flat, with a constant charge rate.
Tiered , where each tier reflects increasing energy consumption levels. Each tier having it's own charge rate.Seasonal where price varies for different seasons of the year.
Time of Use (TOU) where price varies for different hours of the day, as well as price variation between weekdays and weekends.The Charge Structure can contain up to nine (9) Periods, where each period can contain up to nine (9)Tiers.
Application Note - Using the Designer Financial Analysis Features
Customizing Utility Rates 11

Charge Schedule
The Charge Schedule displays charts that reflect how the various charge structure periods are applied to different times of day, parts of the week and different months to best match how the customer uses energy throughout the year.A separate chart is used for applying periods to Weekdays and Weekends.
Creating a RateThere a number of strategies that you can use to setup a rate. You may find it convenient to use an existing rate as a template for a new rate, in which case you can either Duplicate or Edit a rate. If using an existing rate as a base for a new rate does not meet your needs thenthis section describes how to create a rate from scratch and set the charge parameters. Setting up the Charge Structure and Charge Schedule is dealt with in separate and dedicated sections.
To create a rate 1. Open the Utility drop-down list and navigate to the bottom of the list. 2. Click or Tap Can't find your rate. The Create Rate page opens. 3. From the Utility Provider drop-down list select a Utility Provider. 4. In the Rate Name field enter a unique name for the rate. 5. From the Energy Charge Units drop-down list select whether energy units are charged per day or per month. The selection sets
the unit value used for each period in the Charge Structure. 6. In the Fixed Charge field enter an amount if the Utility Provider applies a set fee or charge regardless of energy consumption. For
example, a service fee or maintenance fee or any other recurring fee not connected to energy consumption. Otherwise leave as zero (0).
7. In the Min. Charge field enter an amount if the utility provider applies a charge or fee if during the charge period energy consumption does not reach a minimum threshold. Otherwise leave as zero (0).
8. In the Effective Start Date field enter a date if the new rate is intended to replace an existing rate. On reaching the set date the old rate automatically expires and the new rate is automatically activated. You can enter a date manually or click and select a date.
9. In the Effective End Date field enter a date if the new rate is intended to expire on a specific date. On reaching the set date the rate will automatically expire. You can enter a date manually or click and select a date.
10. In the Reference URL field you can enter the web address for information on the Utility Provider or Rate. Optional. 11. In the Description field enter a brief description of the rate. Optional. 12. You can continue to set the Charge Structure and Charge Schedule details or save the new rate. 13. To save the new rate scroll to the bottom of the page and click Done . The Utility Provider name and the Utility Rate name appear
in the respective fields on the Energy Cost card.
14. After saving the rate you can select the rate on the Energy Cost card and then click or tap Edit Rate to continue setting the Charge Structure and Charge Schedule.
Application Note - Using the Designer Financial Analysis Features
12 Customizing Utility Rates

Setting the Charge StructureWhen setting up a new Utility Rate the Charge Structure table appears empty and contains a single period as illustrated in the image.
The Charge Structure can contain up to 9 periods where each period can contain up to 9 usage thresholds. To illustrate the process lets create a charge structure with 2 periods. The Periods will be divided as described and will not include a correction. Period 1: A general cover all rate that applies to all off peak hours and divided into 2 tiers. Period 2: A rate that is divided into 3 tiers. This covers all peak hours. 06:00-09:00 and 17:00-20:00 Period 1
Tier Threshold (kWh) $ Price Tier 1 20 0.1Tier 2 no limit 0.15
Period 2
Tier Threshold (kWh) $ Price Tier 1 10 0.15Tier 2 20 0.25Tier 3 no limit 0.3
To set the charge structure 1. In the Import Rate ("Buy" Price) section select the Charge Structure (time of usse, tiered) option. 2. For Period 1 in the Max kwh/month field enter a value, in this case 20, and then place the mouse-pointer in the Rate field. As you
do so, a new row is added to the Period for the next threshold and an infinity symbol appears in the new row's max kWh/month field.
3. Enter 0.1 in the Rate field for the first threshold, click or Tap in the Rate field for the second Tier and enter 0.15. The Charge Structure should look like
4. Click Add Period, a new Period that has a single Tier is added to the Charge Structure table. Before entering any values in the new tier, we know that this Period needs to be set up with 3 tiers.
Application Note - Using the Designer Financial Analysis Features
Customizing Utility Rates 13

5. In Period 2. click or tap . An action menu opens. Click Add New Tier. Repeat this twice to add another 2 Tiers.
6. Using the values in the Period 2 table setup above, enter the values into the 3 tiers belonging to Period 2. You should end up with something like:
Setting the Charge ScheduleSimilarly to the Charge Structure, when creating a new rate the initial Charge Schedule only has the first period applied to it, the Weekdays and Weekends grids are only painted with the color associated with Period 1. Something like this.
The newly set up Charge Structures need to be applied to the Charge Schedule. To do this use the Charge Schedule Paint Brush to mark the sections of the Schedule grids with the respective Period colors.
Application Note - Using the Designer Financial Analysis Features
14 Customizing Utility Rates

To set the Charge Schedule 1. Initially the Charge Schedule grids are marked entirely as Period 1. Note that above the Weekends Grid the Period 1 Tile is selected. 2. Click or Tap the Period 2 Tile.
3. Move the mouse pointer over the Grids. As you do so the pointer changes form and is displayed as the Charge Schedule Paint Brush shape. Dragging the mouse pointer over the grid marks the cells with the color associated with the selected Period tile.
4. For this example drag the mouse pointer over the grids to paint them with Period 2 colors to reflect Peak usage hours between 06:00-0900 and 17:00-18:00 hours.
5. After marking the Weekdays and Weekends Grids they should look like this.
6. A real world scenario would have more Periods. Simply mark the Charge Schedule grids with the associated period colors. 7. Click Done to save the settings and close the Create Rate page.
Application Note - Using the Designer Financial Analysis Features
Customizing Utility Rates 15
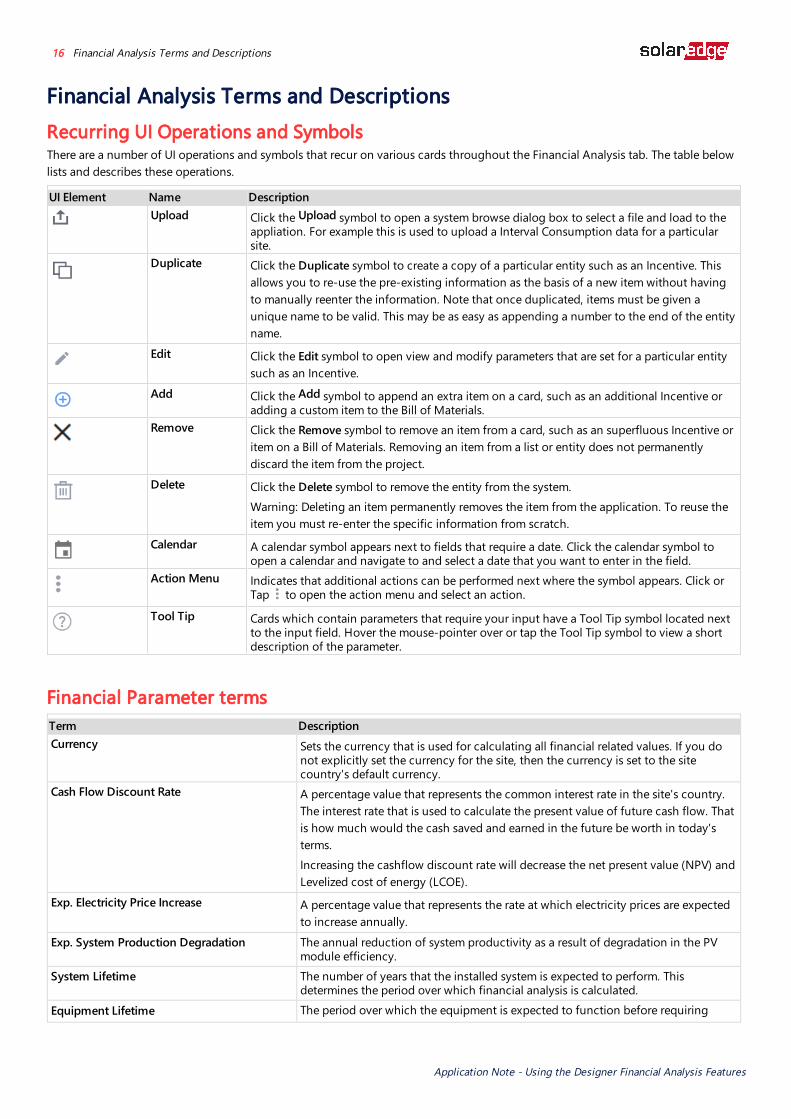
Financial Analysis Terms and DescriptionsRecurring UI Operations and Symbols There are a number of UI operations and symbols that recur on various cards throughout the Financial Analysis tab. The table below lists and describes these operations.
UI Element Name DescriptionUpload Click the Upload symbol to open a system browse dialog box to select a file and load to the
appliation. For example this is used to upload a Interval Consumption data for a particular site.
Duplicate Click the Duplicate symbol to create a copy of a particular entity such as an Incentive. This allows you to re-use the pre-existing information as the basis of a new item without having to manually reenter the information. Note that once duplicated, items must be given a unique name to be valid. This may be as easy as appending a number to the end of the entity name.
Edit Click the Edit symbol to open view and modify parameters that are set for a particular entity such as an Incentive.
Add Click the Add symbol to append an extra item on a card, such as an additional Incentive or adding a custom item to the Bill of Materials.
Remove Click the Remove symbol to remove an item from a card, such as an superfluous Incentive or item on a Bill of Materials. Removing an item from a list or entity does not permanently discard the item from the project.
Delete Click the Delete symbol to remove the entity from the system. Warning: Deleting an item permanently removes the item from the application. To reuse the item you must re-enter the specific information from scratch.
Calendar A calendar symbol appears next to fields that require a date. Click the calendar symbol to open a calendar and navigate to and select a date that you want to enter in the field.
Action Menu Indicates that additional actions can be performed next where the symbol appears. Click or Tap to open the action menu and select an action.
Tool Tip Cards which contain parameters that require your input have a Tool Tip symbol located next to the input field. Hover the mouse-pointer over or tap the Tool Tip symbol to view a short description of the parameter.
Financial Parameter termsTerm DescriptionCurrency Sets the currency that is used for calculating all financial related values. If you do
not explicitly set the currency for the site, then the currency is set to the site country's default currency.
Cash Flow Discount Rate A percentage value that represents the common interest rate in the site's country. The interest rate that is used to calculate the present value of future cash flow. That is how much would the cash saved and earned in the future be worth in today's terms. Increasing the cashflow discount rate will decrease the net present value (NPV) and Levelized cost of energy (LCOE).
Exp. Electricity Price Increase A percentage value that represents the rate at which electricity prices are expected to increase annually.
Exp. System Production Degradation The annual reduction of system productivity as a result of degradation in the PV module efficiency.
System Lifetime The number of years that the installed system is expected to perform. This determines the period over which financial analysis is calculated.
Equipment Lifetime The period over which the equipment is expected to function before requiring
Application Note - Using the Designer Financial Analysis Features
16 Financial Analysis Terms and Descriptions

Term Descriptionreplacement.
Annual O & M Costs The average annual operation and maintenance costs, represented as a cost per kW (DC) installed in the system.
Equipment Replacement Cost The cost per kW of replacing the system equipment once the Equipment Lifetime period has expired.
National Tax Rate The national income tax rate. Enter a value for the rate which may be used to calculate the amount of taxation that is applied to exported system production.
Local Tax Rate The local income tax rate. Enter a value for the rate which may be used to calculate the amount of taxation that is applied to exported system production.
Bill savings are taxed as revenue byBill savings may be viewed as revenue in some countries and regions. Where this is the case, the taxation rate that is applied to the region must be selected. Usually this is either a National or Local tax rate.
National Tax
Select the National Tax check box to use the National Tax Rate in the taxation calculations that are applied to exported system production and used in preparing the financial report. If in your region a taxation levy is not applied to exported system production then make sure this option remains unchecked.
Local Tax
Select the Local Tax check box to use the LocalTax Rate in the taxation calculations that are applied to exported system production and used in preparing the financial report.If in your region a taxation levy is not applied to exported system production then make sure this option remains unchecked.
Energy Consumption TermsTerm DescriptionConsumption Displays the amount of energy expected to be used for a set period in kWh. Initially
the value shown is the same as that entered in the Project Info page. Changing the consumption value in the Energy Consumption tab updates the value listed in the Project Info page.The Energy Consumption fields on the Financial Anaysis page appear blank if the energy consumption values were not entered as part of the Project Info.
Period The Period indicates the amount of time over which the energy is consumed.Annually: The value entered in the Consumption field reflects the amount of energy consumed over a year.Monthly: The value entered in the Consumption field reflects the amount of energy consumed over a calendar month.
Consumption Profile Provides an indication of how commercial businesses or residential facilities consume energy throughout a day and over a week.
Constant energy consumption: Indicates a constant energy consumption seven days a week.Examples include, stores with intensive cooling systems, parking lots, data centers.Evening focused consumption: Indicates that high energy consumption occurs mainly during evening hours, seven days a week.Examples include, hotels, restaurants, gas stations, sports centers.Weekdays focused consumption: Indicates that high energy consumption occurs mainly during regular daytime work hours, five days a week.Examples include, offices, cafeterias, banks, service providers.
Application Note - Using the Designer Financial Analysis Features
Financial Analysis Terms and Descriptions 17

Term DescriptionCommercial (shopping hours): Indicates that high energy consumption occurs mainly during regular daytime work hours, six days a week.Examples include, grocery stores, retail stores, department stores.Family with school-age children: Indicates that high energy consumption occurs during morning and afternoon routines.
Family with infants or pre-school children): Indicates that high energy consumption occurs during morning and afternoon routines, plus by other daytime usage.Single or two person household: Indicates that high energy consumption occurs during morning hours when occupants get ready for work and in the evening when returning from work.Retirees or working from home: Indicates that most energy consumption occurs during regular daytime/work hours.Nightime focused consumption: Indicates that most energy consumption occurs during nightime hours.
Incentive TermsTerm DescriptionSelect Incentive The Select Incentive drop-down list shows incentives that:
Apply to the project's country and or state
Match the currency associated with the project
Are currently valid and available for use
Selecting an incentive from the drop-down list adds the incentive to the project and displays the incentive name and a brief description of the incentive.
Add Incentive Displays a new instance of the of the Select Incentive drop-down list.
Create new incentive If an incentive that is available for your locale does not automatically appear in the Select Incentive drop-down list you can create a new incentive and manually enter the values for the incentive parameters. Incentives that you create are referred to as user-defined incentives and appear in the Select Incentive list with the suffix (user-defined) attached to the incentive name.You perform these operations in the Create New Incentive window.
Incentive State Appears if the country in which the project is located has states. A check box Indicates that the incentive can be limited for use within the state or local entity supported incentives exist for the location in which your project is located. Select the State Name Local Incentive, for example California Local Incentive, check box to indicate that the incentive is only available for use in the assigned state. .If the State Name Local Incentive is unchecked then the incentive is available for use in all the states that belong to country. For example, if the Project site is located in the U.S. then the incentive would be available for use in a project site located in any of the U.S states.
Incentive Name Enter a name for the incentive in the Incentive Name field.All incentives must have a unique name.
Incentive Type Fixed Grant : A grant that is given in the form of a fixed cash amount.Amount: Enter the of the grant.
Taxes: Indicates whether or not revenue generated from the grant is taxable or not.Select the Taxable checkbox if revenue generated from the incentive must be taxed.
Application Note - Using the Designer Financial Analysis Features
18 Incentive Terms

Term Description
Do not select the Taxable checkbox if revenue generated from the incentive is free of tax.Summary: Provides a brief explanation of what the system owner receives as a grant.
System Cost Based Grant: This is a cost based incentive. The system owner receives a one time grant as a percentage of the system cost. The grant is provided as tax credit or rebate in the first year.
Amount percent: Enter the percentage of the system cost that the system owner should receive as a grant.Taxes: Indicates whether or not revenue generated from the grant is taxable or not.Select the Taxable checkbox if revenue generated from the incentive must be taxed. Do not select the Taxable checkbox if revenue generated from the incentive is free of tax.Summary: Provides a brief explanation of what the system owner receives as a grant.
System Production Based Grant: Return rate per kWh: Enter an amount per kWh to be used to calculate the value of the grant.Escalation factor: Enter a percentage value that is used to increase the Return rate per kWh each year for the duration of the grant.Duration in years: Enter a value for the number of years that the grant runs before it expires.Taxes: Indicates whether or not revenue generated from the grant is taxable or not.Select the Taxable checkbox if revenue generated from the incentive must be taxed. Do not select the Taxable checkbox if revenue generated from the incentive is free of tax.Summary: Provides a brief explanation of what the system owner receives as a grant.
System Size Based Grant: This is a system sized based incentive. The sytem owner receives a cash grant based on the
Based on: Select whether the incentive is based on AC or DC.
Return rate: Enter an amount per Watt in the Return rate field to be used to calculate the value of the grant.Cap: Enter a value for the upper limit of the grant if a grant cap exists. Otherwise leave the field blank if the incentive does not have a cap. 0 is not a valid entry.Taxes: Indicates whether or not revenue generated from the grant is taxable or not.Select the Taxable checkbox if revenue generated from the incentive must be taxed. Do not select the Taxable checkbox if revenue generated from the incentive is free of tax.Summary: Provides a brief explanation of what the system owner receives as a grant.
Make this incentive available for users on: My account Select this checkbox to make the incentive available to users that have access to your account.
Application Note - Using the Designer Financial Analysis Features
Financial Analysis Terms and Descriptions 19

System Pricing TermsTerm DescriptionPricing Type Fixed Price: Enter a value for the system in the Price field.
Price per Watt (DC): Enter a price per watt DC in the Price field and the application calculates the total price by multiplying this value by the sum of STC power of all wired modules. If a value exists for Price per Watt (DC) in the user preferences then that value is automatically shown as the initial value in the Price field.Price according to BOM: If the you select this option from the Drop-down list then a Cost column and a Total column is added to the BOM card. The total price of all BOM components is calculated and displayed in the System Pricing card.
Price The cost of the system.
Energy Consumption and Export Rate TermsTerm DescriptionsUtility Provider Shows all the utility providers that have rates in the site's country and state and that match
the site's currency.Click the drop-down list and select a provider from the list or click Can't find your rate to open the Create Rate window to create a custom rate.
Energy Charge Units Displays the units used for charging for energy use. Options include:$/kWh/day$/kWh/month
Rate Overview Click to open the Rate Overview window to view the Charge Parameters and Charge Structure that together define the way selected rate calculates the cost of energy hourly, weekly, and monthly use over a year. The Rate is composed of three factors:
The Utility Provider set parameters and charges.
A Charge Structure that can include up to 9 charging periods which can each be allocated with separate thresholds and usage rates.A Charge Schedule that supports applying the various charge structure periods to different times of day, parts of the week and different months to best match how the customer uses energy throughout the year.
Rate Name A rate describes the price per 1 kWh of importing from the grid. This rate may be flat, tiered (depending on consumption tiers), seasonal (price varies in different seasons of the year), TOU (price varies in different hours of the day), as well as price variation between weekdays and weekends.A drop-down list that shows all the rates that are provided by the selected Utility Provider in the site's country and state that match the site's currency.Each rate belongs to the Utility Provider and must have a unique name. While the rates belong to the Utility Provider, the rate can be duplicated and edited so the conditions of use reflect the specific terms available to a particular customer.
Types of utility rates Different utility providers provide usage plans that vary widely for both residential and commercial purposes. These plans are generally variations of some basic types of rates as described here. Consult a specific utility providers documentation to accurately understand and assess the terms and conditions associated with any particular utility.
Flat or fixed rates: A fixed price per kWh. The price may vary for weekends and
Application Note - Using the Designer Financial Analysis Features
20 System Pricing Terms

Term Descriptionsseasonally for use in Summer and Winter.Time of Use (TOU): Rates per kWh vary based on the time of day. Electricity rates are lower at nights and on weekends, but go up during peak hours when energy resources are in demand. The rates may vary seasonally. Different providers provide TOU plans that provide users with options that can reduce overall costs and take into account the use of Solar renewable energy.Tiered rates: Usage plans that include packages or allotments of energy that have usage ceilings or thresholds. Each allotment is referred to as a Tier for which customers pay a single rate per kWh for use of energy within the tier. As monthly energy consumption extends beyond the threshold for a baseline tier, the rate increases for consumption of energy alloted to the next and more expensive tier. Many providers have mult-tiered plans. For instance plans that combine TOU and Tiered rates where tiered rates vary for Time of Use such as Peak and Off-Peak.Demand charges: Additional fees that utilities charge non-residential or commercial customers for maintaining a constant supply of electricity. These fees can amount to a substantial sum of money that businesses must pay on monthly electric bills. They can be as much as 50% of the total electric bill or more. In some instances, demand charges can actually be higher than the energy portion of the electric bill itself. So the price that a business is charged each month for electricity depends not only on how much electricity was used during the month, but also on the rate at which consumption of electricity occurred.
Demand can be defined as the maximum amount of energy a business uses at any given point in a billing cycle.
Fixed Charge A fee or charge that the utility provider applies regardless of energy consumption. This should not be confused with a fixed or flat rate.
Minimum Charge A fee or charge that the utility provider applies if the energy consumption does not reach a minimum threshold for the charge period.
Export Rate The rate that the utility company pays for exported electricity.Fixed Rate: All exported kWh are credited with a set and constant value.
Independent Rate: All exported kWh are credited as a flat export feed-in tariff that is independent from the Utility Rate. Retail Rate: All exported kWh are credited the same as a kWh imported from the grid. This is used for traditional net metering rules.Retail Rate With Fixed Reduction: Exported kWh are valued as the retail rate, minus the specified reduction per kWh as set in the Reduction $/kWh field.Retail Rate With Percentage Reduction: All exported kWh are valued as a percentage of the retail rate. The percent reduction is set in the Reduction % field.For example, a 10% reduction would reduce the value of exported energy to 90% of the retail value.
Effective Start Date Indicates if this rate is intended to replace an existing rate. On reaching the set start date, the existing rate automatically expires.
Effective Ene Date Indicates if the rate has an expiration date. On reaching the set end date the existing rate expires.
Charge Structure Contains parameters that are used to define the way selected rate calculates the cost of energy hourly, weekly, and monthly use over a year.
Period: The Period is a unit that groups a number packages of energy and sets the cost of those packages to the customer. The Period is the unit that is applied to the Charge Schedule.
Application Note - Using the Designer Financial Analysis Features
Financial Analysis Terms and Descriptions 21

Term DescriptionsTier: Defined amounts of energy that are grouped into packages.
Max kWh: The upper limit on the .
Rate $/KWh: The cost per kWh of energy for the amount of energy included in a Tier
Charge Schedule Describes that distribution or application of charge structure periods to different times of day, parts of the week and different months to best match how the customer uses energy throughout the year.
Weekdays: A chart used for applying scheduling periods for weekdays.
Weekends: A chart used for applying scheduling periods for weekends.
Application Note - Using the Designer Financial Analysis Features
22 Energy Consumption and Export Rate Terms