design tradeoffs in microchannel heat exchangers - citeseer
TRANSCRIPT
University of Illinois at Urbana-Champaign
Air Conditioning and Refrigeration Center A National Science Foundation/University Cooperative Research Center
Design Tradeoffs in Microchannel Heat Exchangers
T. Kulkarni and C. W. Bullard
ACRC TR-208 February 2003
For additional information: Air Conditioning and Refrigeration Center University of Illinois Mechanical & Industrial Engineering Dept. 1206 West Green Street Urbana, IL 61801 Prepared as part of ACRC Project #124 Design Tradeoffs in Microchannel Heat Exchangers (217) 333-3115 C. W. Bullard, Principal Investigator
The Air Conditioning and Refrigeration Center was founded in 1988 with a grant from the estate of Richard W. Kritzer, the founder of Peerless of America Inc. A State of Illinois Technology Challenge Grant helped build the laboratory facilities. The ACRC receives continuing support from the Richard W. Kritzer Endowment and the National Science Foundation. The following organizations have also become sponsors of the Center. Alcan Aluminum Corporation Amana Refrigeration, Inc. Arçelik A. S. Brazeway, Inc. Carrier Corporation Copeland Corporation Dacor Daikin Industries, Ltd. Delphi Harrison Thermal Systems Embraco S. A. General Motors Corporation Hill PHOENIX Honeywell, Inc. Hydro Aluminum Adrian, Inc. Ingersoll-Rand Company Kelon Electrical Holdings Co., Ltd. Lennox International, Inc. LG Electronics, Inc. Modine Manufacturing Co. Parker Hannifin Corporation Peerless of America, Inc. Samsung Electronics Co., Ltd. Tecumseh Products Company The Trane Company Valeo, Inc. Visteon Automotive Systems Wolverine Tube, Inc. For additional information: Air Conditioning & Refrigeration Center Mechanical & Industrial Engineering Dept. University of Illinois 1206 West Green Street Urbana, IL 61801 217 333 3115
iii
Abstract
The present work is based on theoretical and computational investigations into microchannel heat
exchangers. Microchannel heat exchangers have long been used as condensers but concerns regarding refrigerant
maldistribution have so far prevented their use as evaporators.
The first part of the document is devoted to identifying causes of maldistribution and suggesting ways to
reduce and eventually eliminate maldistribution. To reduce maldistribution caused due to header pressure gradient,
short and fat radial headers were demonstrated to be better than longitudinal headers currently used in microchannel
condensers.
The second part describes a way to avoid the problem associated with distributing two-phase refrigerant:
passive vapor bypass. Immediately downstream of the expansion device, two-phase refrigerant is separated into
vapor which is bypassed directly to the suction line through an adiabatic tube and liquid which is distributed into the
evaporator. Computer simulation models were developed to explore the feasibility of this concept for a residential
air-conditioning application using both sub- and transcritical cycles.
The last part of the document identified tradeoffs among the first cost, operating cost and compactness of
microchannel heat exchangers. Variation of air-side parameters such as fin height, thickness and pitch were
considered to identify a set of designs that have the lowest first cost and another having the highest energy
efficiency.
The report is divided into the above sections which can be read independently, in any order at the reader’s
convenience.
iv
Table of Contents
Page Abstract ......................................................................................................................... iii
List of Figures...............................................................................................................vi
List of Tables ...............................................................................................................vii
List of Symbols...........................................................................................................viii
1. Introduction...............................................................................................................1 1.1 Background .....................................................................................................................................1 1.2 Outline ..............................................................................................................................................1
2. Refrigerant-side tradeoffs in microchannel evaporators ......................................2 2.1 Introduction .....................................................................................................................................2 2.2 Simulating microchannel heat exchangers..................................................................................3 2.3 Header ∆P-induced mass flux maldistribution ............................................................................5 2.4 Header design tradeoffs.................................................................................................................8
2.4.1 Longitudinal header................................................................................................................................9 2.4.2 Radial header ........................................................................................................................................11
2.5 Effects of simplifying assumptions ............................................................................................13 2.5.1 “Minor” pressure drops in tubes ...........................................................................................................13 2.5.2 Header pressure drop due to gravity.....................................................................................................14
2.6 Sensitivity of results to different correlations ...........................................................................14 2.7 Conclusions...................................................................................................................................15
3. Vapor bypass to improve distribution in microchannel evaporators ................16 3.1 Introduction ...................................................................................................................................16 3.2 Simulation model structure .........................................................................................................17 3.3 Baseline system design ...............................................................................................................17
3.3.1 Correlations ..........................................................................................................................................20 3.3.2 Components..........................................................................................................................................20
3.4 Vapor bypass systems .................................................................................................................23 3.5 Off-design loads............................................................................................................................24 3.6 Off-design performance of R410A system .................................................................................25 3.7 Off-design performance of R744 system....................................................................................28 3.8 Sizing the bypass tube .................................................................................................................29 3.9 Conclusions...................................................................................................................................30
4. Air-side tradeoffs ....................................................................................................31 4.1 Introduction ...................................................................................................................................31 4.2 Background ...................................................................................................................................31 4.3 Tradeoffs at minimum air flow rate .............................................................................................33
4.3.1 Fin height..............................................................................................................................................34 4.3.2 Fin pitch................................................................................................................................................35
v
4.3.3 Fin pitch and fin height.........................................................................................................................36 4.3.4 Fin thickness.........................................................................................................................................38 4.3.5 Variation of fin height, pitch and thickness ..........................................................................................38
4.4 Variation of air flow rate ...............................................................................................................39 4.5 Dry coils .........................................................................................................................................42
4.5.1 Varying air/refrigerant-side area ratio ..................................................................................................42 4.5.2 Variation of air-flow rate ......................................................................................................................43
4.6 Conclusions...................................................................................................................................44 Bibliography.................................................................................................................46
Appendix A. House load calculations.......................................................................49
Appendix B. Bypass tube dimensions......................................................................50
vi
List of Figures
Page
Figure 2.1 (a) Variation among 2-phase frictional pressure drop and heat transfer correlations (R410A D=0.5
mm Tevap = 12°C) ...................................................................................................................................................4 Figure 2.1 (b) Range of 2-phase frictional pressure drop and heat transfer correlation (R410A D=0.5 mm Tevap
= 12°C) ..................................................................................................................................................................5 Figure 2.2 Effect of header pressure gradient ................................................................................................................6 Figure 2.3 Effect of header ∆P induced mass flux maldistribution on heat exchanger capacity ...................................7 Figure 2.4 Effect of Dport on dG/d(∆Tsat)........................................................................................................................8 Figure 2.5 Longitudinal header ((a) cross-section and (b) as used in a full heat exchanger).........................................9 Figure 2.6 Geometry of a 90% inertially dominated longitudinal header....................................................................10 Figure 2.7 Header ∆P (∆Tsat) for a 90% inertially dominated longitudinal header ......................................................11 Figure 2.8 Header ∆P (∆Tsat) for a 90% inertially dominated longitudinal header ......................................................11 Figure 2.9 Radial header (cross-section, oblique view and orientation in heat exchanger) .........................................12 Figure 2.10 Capacity of a 90% inertially dominated radial header..............................................................................12 Figure 2.11 Geometry of a 90% inertially dominated radial header ............................................................................13 Figure 2.12 Header ∆P (∆Tsat) in a 90% inertially dominated radial header................................................................13 Figure 3.1 (a) Baseline (sub-critical) model configured in normal simulation mode ..................................................18 Figure 3.1 (b) Bypass (sub-critical) model configured in normal simulation mode (xout,cond = 0 replaced by
∆Tsat,e = ∆Tsat,bypass) ...............................................................................................................................................18 Figure 3.2 (a) Baseline (trans-critical) model configured in normal simulation mode (Note that Pdis is input in
trans-critical cycle in place of xout,cond in sub-critical cycle).................................................................................19 Figure 3.2 (b) Bypass (trans-critical) model configured in normal simulation mode (Note that xout,e = 1.0 is
replaced by ∆Tsat,e = ∆Tsat,bypass)............................................................................................................................19 Figure 3.3 (a) Baseline (left) and bypass (right) a/c system (subcritical) ....................................................................24 Figure 3.3 (b) Baseline (left) and bypass (right) a/c system (transcritical) ..................................................................24 Figure 3.4 Subcritical cycles at Tamb > Tamb,design (qualitative) .....................................................................................27 Figure 3.5 Subcritical cycles at Tamb < Tamb,design (qualitative) ...................................................................................28 Figure 3.6 Vapor bypass system relationships (subcritical cycle) ...............................................................................28 Figure 3.7 Vapor bypass system relations (transcritical cycle)....................................................................................29 Figure 3.8 Flexibility in sizing bypass tube .................................................................................................................30 Figure 4.1 Evaporator alone (relevant) inputs and outputs ..........................................................................................32 Figure 4.2 Block diagram for design process ..............................................................................................................34 Figure 4.3 HX performance vs air flow rate (Vface = 1.5 m/s)......................................................................................40 Figure 4.4 Air side area drops due to rising air flow rate (Vface = 1.5 m/s) ..................................................................41 Figure 4.5 Evaporating and approach temperature difference vs air flow rate (Vface = 1.5 m/s) ..................................41 Figure 4.6 Air-side area vs air flow rate with different face velocities........................................................................42 Figure 4.7 Inputs and outputs to simulate variation of air flow rate ............................................................................43 Figure B.1 Pressure drop vs. refrigerant mass flow rate through different bypass tubes.............................................51
vii
List of Tables
Page
Table 2.1 Sensitivity to two-phase pressure drop correlations.....................................................................................15 Table 2.2 Sensitivity to two-phase heat transfer correlations ......................................................................................15 Table 3.1 Dimensions common to all heat exchangers................................................................................................21 Table 3.2 Baseline system parameters1........................................................................................................................23 Table 3.3 Indoor coil for bypass systems1 ...................................................................................................................25 Table 3.4 Load SHR at full solar conditions................................................................................................................25 Table 3.5 Off-design performance – subcritical systems.............................................................................................26 Table 3.6 Off-design performance of bypass system for transcritical cycle ................................................................29 Table 4.1 Effect of fin height variation........................................................................................................................35 Table 4.2 Variation of fin pitch ...................................................................................................................................36 Table 4.3 Parameters defining computational experiments .........................................................................................37 Table 4.4 Results of changing fin height & pitch ........................................................................................................37 Table 4.5 Parameter range considered .........................................................................................................................38 Table 4.6 Parameter variation to study role of fin thickness........................................................................................39 Table 4.7 Varying Vface at constant Aface (=0.44 m2)....................................................................................................44 Table 4.8 Varying Aface at constant Vface (=1.5 m/s) ....................................................................................................44
viii
List of Symbols
A area [m2] dG mass flux difference [kg/m2 -s ] dT temperature difference [°C] ∆P pressure drop [kPa] ∆T drop in temperature [°C] D diameter [m] F fin g acceleration due to gravity [m/s2] h heat transfer coefficient [W/m2-K] G mass flux [kg/m2-s] L length [m] N number P pressure [kPa] Q heat transfer capacity rate [W] Re Reynolds number t thickness [m] T temperature [°C] V velocity [m/s] x refrigerant quality [-]
Subscripts amb ambient app approach c, cond condenser/condensing db dry bulb dp dewpoint dis discharge displ displacement e, evap evaporating exp expansion f liquid g gas gc gas cooler h header in inlet l, liq liquid max maximum min minimum p port ref refrigerant sat saturation t tube th thickness v, vap vapor XV expansion valve

ix
Greek letters α void fraction µ viscosity θ angle of inclination ρ density ω absolute humidity
1
1. Introduction
1.1 Background There is increasing interest in use of microchannel heat exchangers because they present opportunities for
reducing refrigerant charge while increasing refrigerant-side heat transfer area, as well as reducing air-side pressure
drop. Microchannel heat exchangers are already being used in automotive industry as condensers where void
fractions exceed 90% in the headers and uniform distribution of vapor and liquid is not so difficult. If microchannel
heat exchangers are to be used in unitary or split systems, they must be able to deliver the required heat transfer both
as evaporators and condensers. Unfortunately, for microchannel evaporators it is a challenge to achieve uniform
distribution. It is necessary to quantify how much maldistribution degrades performance of microchannel
evaporator based systems and to identify ways to reduce maldistribution. Therefore this report focuses on single pass
microchannel heat exchangers to eliminate the potential for maldistribution in intermediate headers, and also to
facilitate their use in reversible mode.
1.2 Outline This thesis presents theoretical and computational analyses performed with microchannel heat exchangers
using F-Chart Software’s Engineering Equations Solver. It also identifies and cites references on the relevant
experimental work done elsewhere using microchannel heat exchangers. The first part of this document is focused
on refrigerant-side issues in microchannel evaporators. Chapter 2 explores header designs to reduce maldistribution;
Chapter 3 investigates the concept of passive vapor bypass as a means for avoiding the problems associated with
distribution of two-phase refrigerant. The next part is devoted to the air-side of the microchannel heat exchangers
and Chapter 4 builds on the refrigerant-side results, explores promising air-side tradeoffs, and makes overall
recommendations regarding heat exchanger design. The working fluids considered in this analysis are R410A,
R744, R22, R134a, etc.
2
2. Refrigerant-side tradeoffs in microchannel evaporators
2.1 Introduction Compact cross-flow heat exchangers with flat multi-port microchannel tubes and folded louvered fins have
almost completely replaced conventional round tube flat fin condensers in automotive air-conditioning applications.
Nearly all have two vertical headers partitioned to accommodate 3-5 passes consisting of multiple parallel tubes.
Since void fractions exceed 90% in most of the headers, achieving near-uniform vapor distribution among hundreds
of parallel refrigerant ports has not presented serious problems for condensers. However in evaporators the
challenge is to distribute the liquid evenly among the microchannel ports. Because of the high liquid/vapor density
ratio of fluorocarbon refrigerants, void fractions are generally near 90% at the evaporator inlet and far exceed 90%
at intermediate headers in higher-quality regimes.
At a fundamental level, single-phase flow at T-junctions is relatively well understood, but in two-phase
flow Butterworth (1980) demonstrated how the T-junction might allow the gas to enter the side tube while the liquid
flows along the main branch. The data of Azzopardi (1984), and Azzopardi and Whalley (1982) for air-water
mixtures showed the flow split more likely to be ideal (i.e. equal qualities) if the flow is annular than in case of
churned and bubbly flow upstream of the junction. Nevertheless the liquid in the side arm comes predominantly
from the liquid film along the walls of the main arm; but droplets entrained in the vapor core can also be diverted
into the side arm. Of relevance to microchannels, their results showed that vapor is preferentially extracted when
the diameter of the side tube is small.
Cho, et al. (2002) studied distribution of two-phase R22 in various orientations of branch and main tubes,
and documented the adverse effects of gravitational effects near T-junctions. Tompkins, et al (2002) performed air-
water distribution studies in a transparent horizontal header with 15 microchannel tubes exiting vertically
downward. They observed that liquid distribution was most nearly uniform when flow was highly stratified, and
became less uniform with increasing mass flux as annular flow began to develop. With only a short entrance
section, the liquid on the bottom flowed into the first few tubes, while that in the annular film on the walls tended to
bypass the flush-mounted tubes near the middle of the header, and accumulate at the end. Bajuara’s predictions were
replicated for single-phase water and air. Due to the shortness of the header, measured pressure drop was quite
small, apparently due to the offsetting effects of friction and deceleration. No results were reported for the case of
tubes exiting vertically upward, nor for the case of tubes protruding into the header normal to its axis.
In headers of real heat exchangers, the flat tubes protrude inward from the walls to prevent brazing flux
from sealing the microchannel ports. Experimental data on such evaporators are limited. Stott and Bullard (1999)
conducted experiments with a microchannel evaporator (port diameters ~0.7 mm), fed at four locations along a
horizontal inlet header. They quantified maldistribution by measuring superheat at exits of individual microchannel
tubes, observing that some had nearly zero approach temperature differences while others were saturated, despite the
TXV holding the aggregate suction superheat at 5°C. The tubes showing highest exit superheat were the ones that
received most of vapor at their inlets, where the phases were highly stratified because the multiple inlets produced a
header mass flux less than 20% of that needed for inertial forces to dominate gravitational forces. Experiments by
Beaver et al. (2000) with R744 in a single-pass microchannel evaporator with horizontal header at mass fluxes ~100
3
kg/m2-s (still in the gravitationally-dominated regime) showed ~20% performance degradation due to
maldistribution. Song and Bullard (2002) used the same header as used by Beaver and observed frosting patterns as
a qualitative indicator of maldistribution in a multipass microchannel evaporator with vertical headers shorter but
having the same cross-section as Beaver’s, finding no evidence of serious maldistribution in the 10-tube inlet header
at a mass flux (172 kg/m2-s) significantly closer to but still less than the 260 kg/m2-s required to support fully-
developed annular flow at typical inlet qualities (20% inlet quality of R744 at 12°C with header diameter ~16 mm
from Thome, et al., 1998). The lack of experimental data on inertially-dominated flow in evaporator inlet headers
results is due to the extremely high tooling costs associated with prototyping tubes and headers different from those
currently manufactured for use in condensers.
These experimental results suggest strongly that longitudinal headers such as those currently used with
microchannel condensers have mass velocities too small to overcome gravity-induced maldistribution. Until this
problem is solved, microchannel heat exchanger technology will be limited, as it is now, to condensers of air
conditioning systems. Several fundamentally different approaches may be taken, including adding a valve to bypass
the flash gas as suggested by Beaver et al. (2000) or by developing special nozzles to create a Stokes flow as is
being investigated by Fei et al. (2001). The approach taken here takes existing header geometries and
manufacturing techniques as a point of departure, and identifies those parts of the parameter space where
gravitational forces could be dominated by inertial forces without creating header pressure gradients large enough to
cause flow maldistribution among the branch tubes. In heat pumps both the indoor and outdoor heat exchangers
must both function as evaporators and accommodate refrigerant flow reversals, so the following analysis focuses on
single-pass designs to eliminate the additional maldistribution risks associated with intermediate headers.
The next section reviews the current state of knowledge of two-phase pressure drop, heat transfer and void
fractions for simulating flow in the sub-millimeter channels and of microchannel heat exchangers. While not strictly
applicable to the developing two-phase flow in the headers, published correlations are applied cautiously and related
to available data to provide approximate yet quantitative insights. Next, this information is combined with a few
simplifying assumptions to define the feasible design space (tube lengths, header geometry etc.) for heat exchangers
of a given capacity. The results are then shown to support a robust conclusion that longitudinal headers of the type
heretofore used in microchannel condensers are generally unsuitable for use in evaporators. The paper concludes
with analyses of a proposed radial header design, which appears to offer substantial advantages from the standpoint
of refrigerant distribution.
2.2 Simulating microchannel heat exchangers The superior air and refrigerant-side performance of microchannel heat exchangers has been documented
extensively in the literature (Jacobi, 2001 and Park, et al., 2002). However there have been relatively few detailed
investigations of two-phase heat transfer, pressure drop, flow regimes and void fractions in sub-millimeter ports.
Therefore, the empirical database is still too sparse to support development of broadly-applicable correlations. Far
less is known about the developing two-phase flow in the headers, where diameters range from 10-30 mm. Most
experience is with condensers where void fractions are high and maldistribution concerns are less important, so only
a few detailed studies have been done. Zietlow (1998) conducted flow visualization experiments and detailed
4
measurements of refrigerant mass in microchannel condensers and concluded that a homogeneous void fraction
assumption was valid across a range of typical operating conditions.
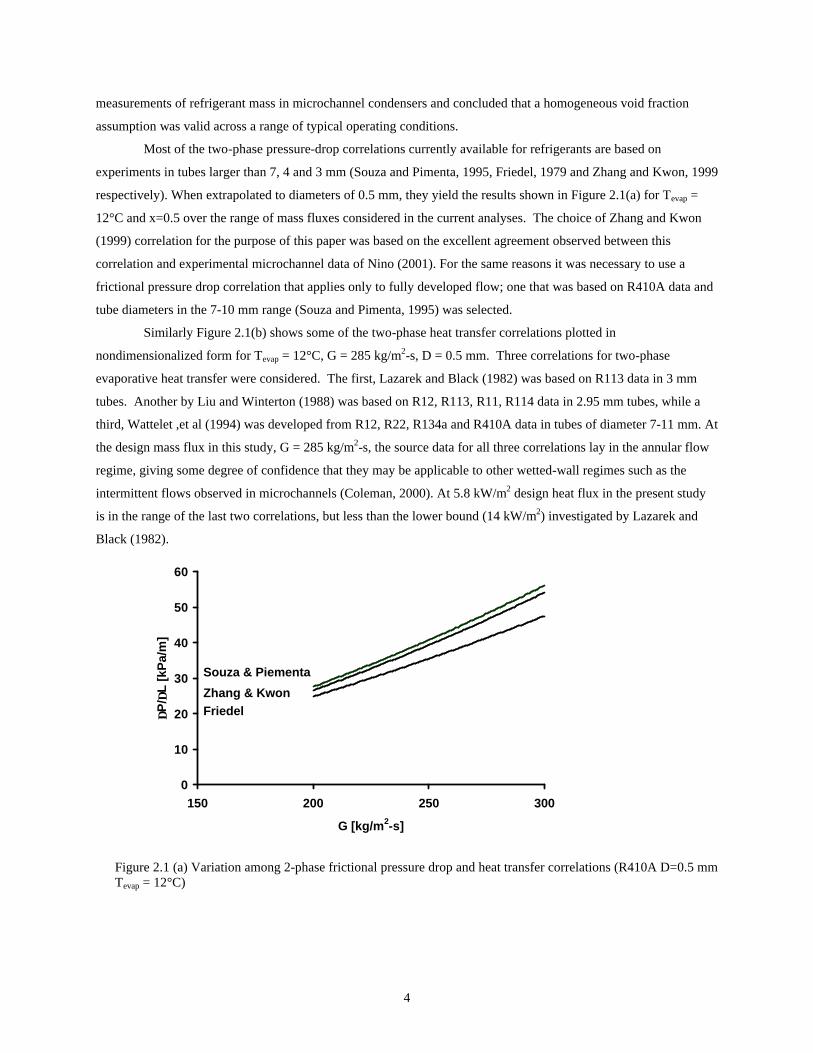
Most of the two-phase pressure-drop correlations currently available for refrigerants are based on
experiments in tubes larger than 7, 4 and 3 mm (Souza and Pimenta, 1995, Friedel, 1979 and Zhang and Kwon, 1999
respectively). When extrapolated to diameters of 0.5 mm, they yield the results shown in Figure 2.1(a) for Tevap =
12°C and x=0.5 over the range of mass fluxes considered in the current analyses. The choice of Zhang and Kwon
(1999) correlation for the purpose of this paper was based on the excellent agreement observed between this
correlation and experimental microchannel data of Nino (2001). For the same reasons it was necessary to use a
frictional pressure drop correlation that applies only to fully developed flow; one that was based on R410A data and
tube diameters in the 7-10 mm range (Souza and Pimenta, 1995) was selected.
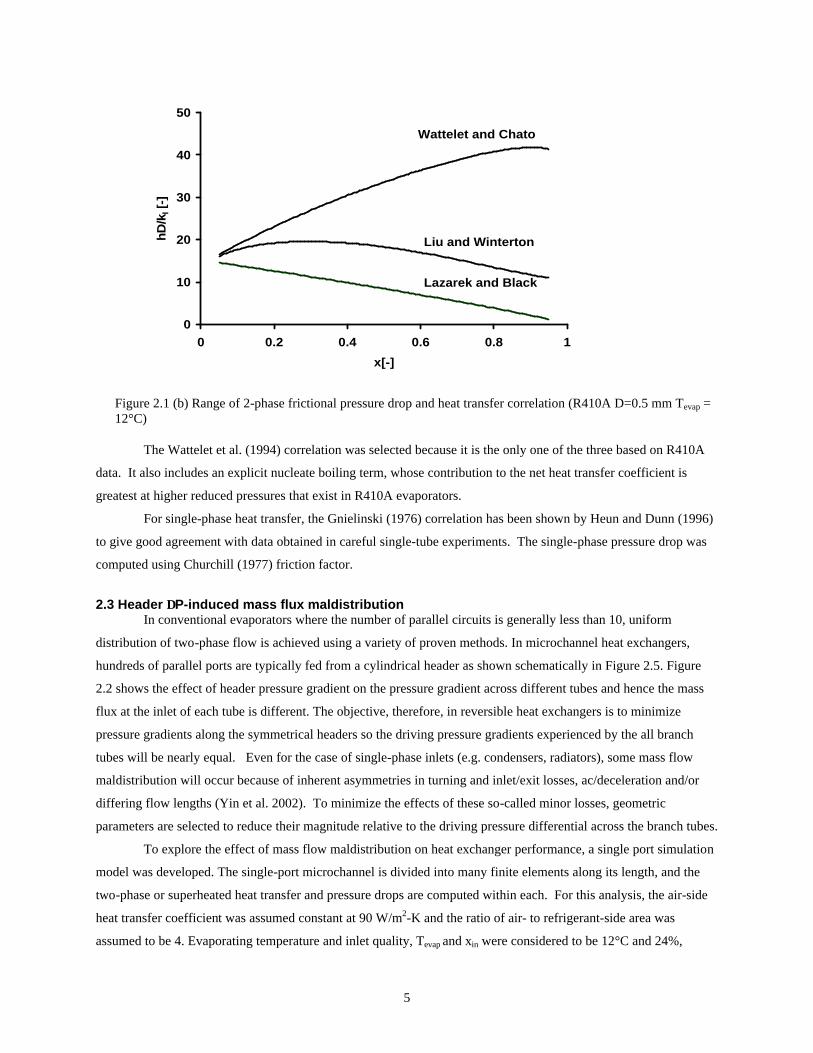
Similarly Figure 2.1(b) shows some of the two-phase heat transfer correlations plotted in
nondimensionalized form for Tevap = 12°C, G = 285 kg/m2-s, D = 0.5 mm. Three correlations for two-phase
evaporative heat transfer were considered. The first, Lazarek and Black (1982) was based on R113 data in 3 mm
tubes. Another by Liu and Winterton (1988) was based on R12, R113, R11, R114 data in 2.95 mm tubes, while a
third, Wattelet ,et al (1994) was developed from R12, R22, R134a and R410A data in tubes of diameter 7-11 mm. At
the design mass flux in this study, G = 285 kg/m2-s, the source data for all three correlations lay in the annular flow
regime, giving some degree of confidence that they may be applicable to other wetted-wall regimes such as the
intermittent flows observed in microchannels (Coleman, 2000). At 5.8 kW/m2 design heat flux in the present study
is in the range of the last two correlations, but less than the lower bound (14 kW/m2) investigated by Lazarek and
Black (1982).
0
10
20
30
40
50
60
150 200 250 300
G [kg/m2-s]
∆P
/ ∆L
[kP
a/m
]
Zhang & KwonFriedel
Souza & Piementa
Figure 2.1 (a) Variation among 2-phase frictional pressure drop and heat transfer correlations (R410A D=0.5 mm Tevap = 12°C)
5
0
10
20
30
40
50
0 0.2 0.4 0.6 0.8 1
x[-]
hD
/kl [
-]
Liu and Winterton
Lazarek and Black
Wattelet and Chato
Figure 2.1 (b) Range of 2-phase frictional pressure drop and heat transfer correlation (R410A D=0.5 mm Tevap = 12°C)
The Wattelet et al. (1994) correlation was selected because it is the only one of the three based on R410A
data. It also includes an explicit nucleate boiling term, whose contribution to the net heat transfer coefficient is
greatest at higher reduced pressures that exist in R410A evaporators.
For single-phase heat transfer, the Gnielinski (1976) correlation has been shown by Heun and Dunn (1996)
to give good agreement with data obtained in careful single-tube experiments. The single-phase pressure drop was
computed using Churchill (1977) friction factor.
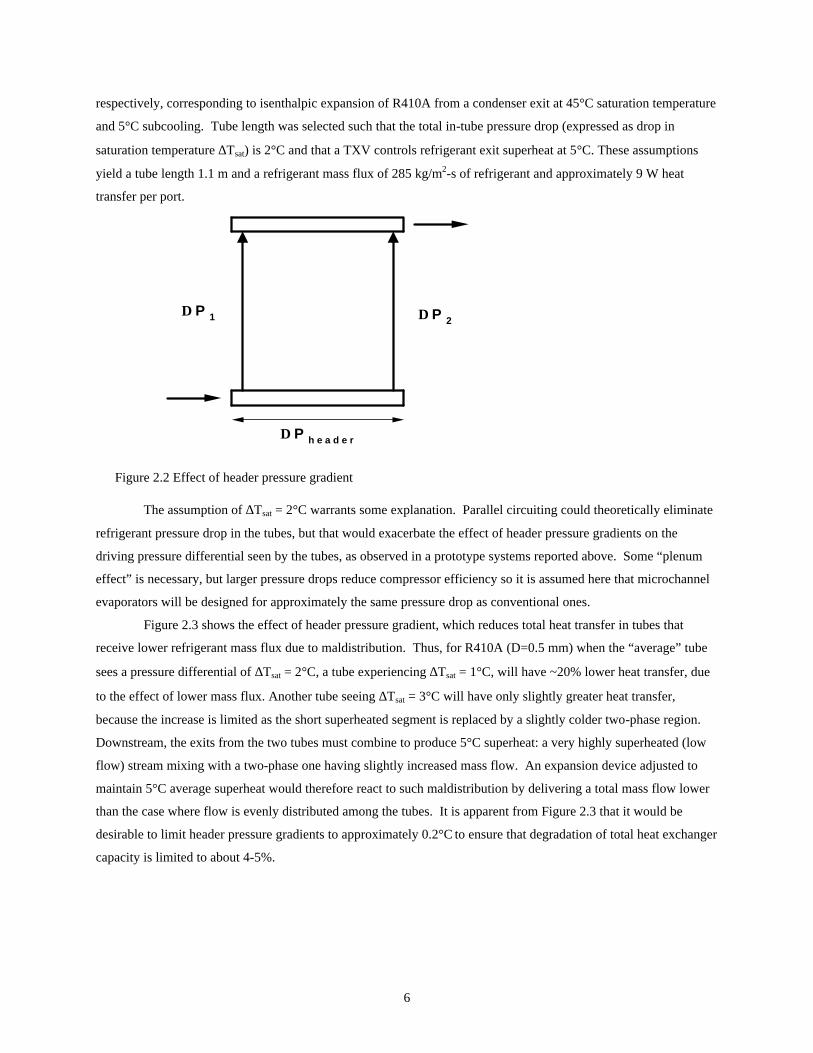
2.3 Header ∆P-induced mass flux maldistribution In conventional evaporators where the number of parallel circuits is generally less than 10, uniform
distribution of two-phase flow is achieved using a variety of proven methods. In microchannel heat exchangers,
hundreds of parallel ports are typically fed from a cylindrical header as shown schematically in Figure 2.5. Figure
2.2 shows the effect of header pressure gradient on the pressure gradient across different tubes and hence the mass
flux at the inlet of each tube is different. The objective, therefore, in reversible heat exchangers is to minimize
pressure gradients along the symmetrical headers so the driving pressure gradients experienced by the all branch
tubes will be nearly equal. Even for the case of single-phase inlets (e.g. condensers, radiators), some mass flow
maldistribution will occur because of inherent asymmetries in turning and inlet/exit losses, ac/deceleration and/or
differing flow lengths (Yin et al. 2002). To minimize the effects of these so-called minor losses, geometric
parameters are selected to reduce their magnitude relative to the driving pressure differential across the branch tubes.
To explore the effect of mass flow maldistribution on heat exchanger performance, a single port simulation
model was developed. The single-port microchannel is divided into many finite elements along its length, and the
two-phase or superheated heat transfer and pressure drops are computed within each. For this analysis, the air-side
heat transfer coefficient was assumed constant at 90 W/m2-K and the ratio of air- to refrigerant-side area was
assumed to be 4. Evaporating temperature and inlet quality, Tevap and xin were considered to be 12°C and 24%,
6
respectively, corresponding to isenthalpic expansion of R410A from a condenser exit at 45°C saturation temperature
and 5°C subcooling. Tube length was selected such that the total in-tube pressure drop (expressed as drop in
saturation temperature ∆Tsat) is 2°C and that a TXV controls refrigerant exit superheat at 5°C. These assumptions
yield a tube length 1.1 m and a refrigerant mass flux of 285 kg/m2-s of refrigerant and approximately 9 W heat
transfer per port.
∆ P 1 ∆ P 2
∆ P h e a d e r
Figure 2.2 Effect of header pressure gradient
The assumption of ∆Tsat = 2°C warrants some explanation. Parallel circuiting could theoretically eliminate
refrigerant pressure drop in the tubes, but that would exacerbate the effect of header pressure gradients on the
driving pressure differential seen by the tubes, as observed in a prototype systems reported above. Some “plenum
effect” is necessary, but larger pressure drops reduce compressor efficiency so it is assumed here that microchannel
evaporators will be designed for approximately the same pressure drop as conventional ones.
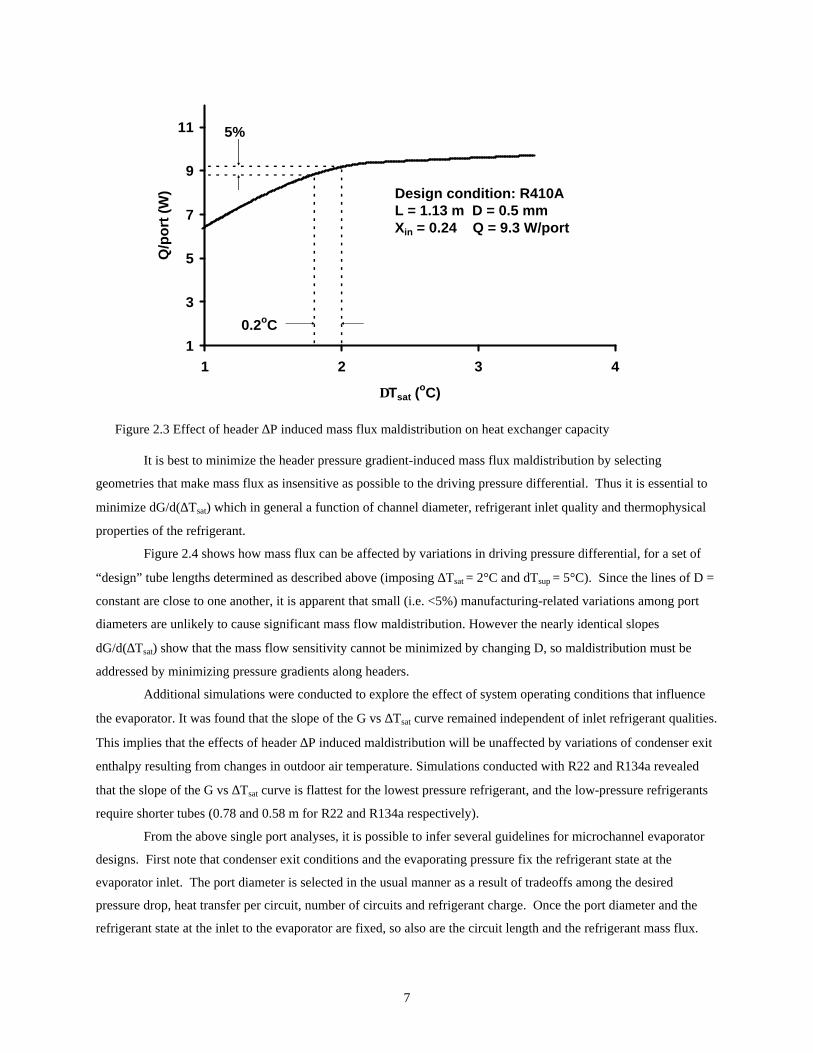
Figure 2.3 shows the effect of header pressure gradient, which reduces total heat transfer in tubes that
receive lower refrigerant mass flux due to maldistribution. Thus, for R410A (D=0.5 mm) when the “average” tube
sees a pressure differential of ∆Tsat = 2°C, a tube experiencing ∆Tsat = 1°C, will have ~20% lower heat transfer, due
to the effect of lower mass flux. Another tube seeing ∆Tsat = 3°C will have only slightly greater heat transfer,
because the increase is limited as the short superheated segment is replaced by a slightly colder two-phase region.
Downstream, the exits from the two tubes must combine to produce 5°C superheat: a very highly superheated (low
flow) stream mixing with a two-phase one having slightly increased mass flow. An expansion device adjusted to
maintain 5°C average superheat would therefore react to such maldistribution by delivering a total mass flow lower
than the case where flow is evenly distributed among the tubes. It is apparent from Figure 2.3 that it would be
desirable to limit header pressure gradients to approximately 0.2°C to ensure that degradation of total heat exchanger
capacity is limited to about 4-5%.
7
1
3
5
7
9
11
1 2 3 4
∆Tsat (oC)
Q/p
ort
(W) Design condition: R410A
L = 1.13 m D = 0.5 mmXin = 0.24 Q = 9.3 W/port
0.2oC
5%
Figure 2.3 Effect of header ∆P induced mass flux maldistribution on heat exchanger capacity
It is best to minimize the header pressure gradient-induced mass flux maldistribution by selecting
geometries that make mass flux as insensitive as possible to the driving pressure differential. Thus it is essential to
minimize dG/d(∆Tsat) which in general a function of channel diameter, refrigerant inlet quality and thermophysical
properties of the refrigerant.
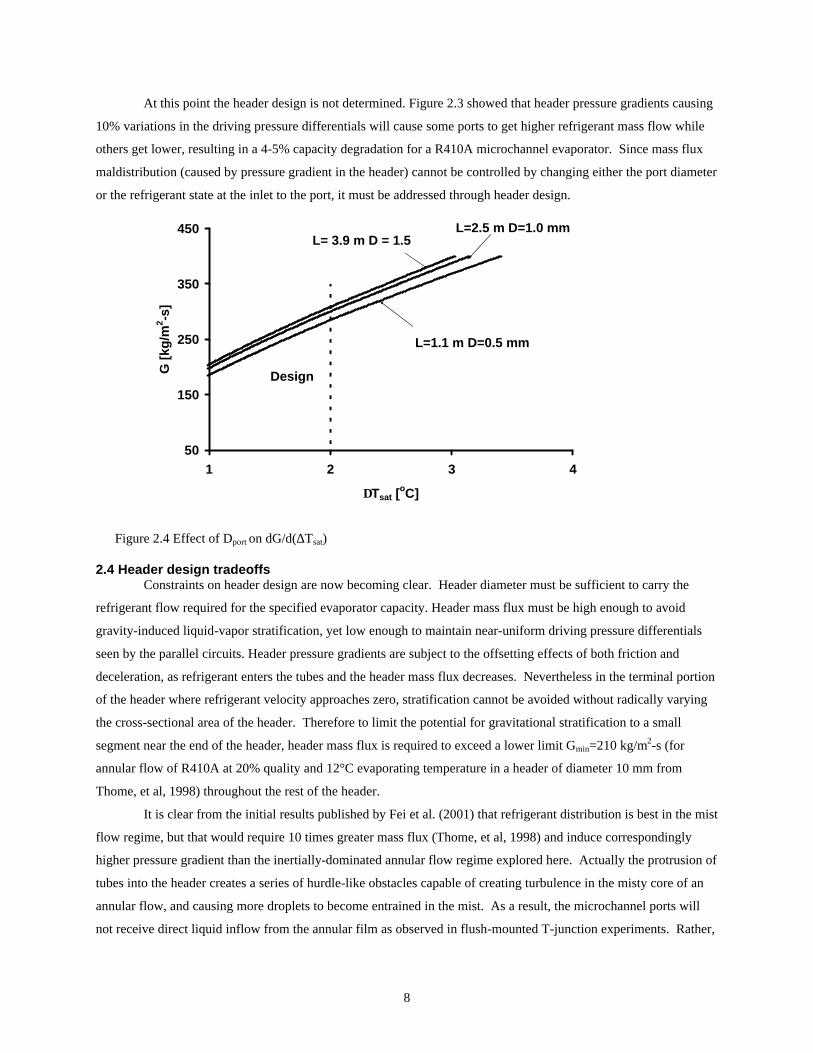
Figure 2.4 shows how mass flux can be affected by variations in driving pressure differential, for a set of
“design” tube lengths determined as described above (imposing ∆Tsat = 2°C and dTsup = 5°C). Since the lines of D =
constant are close to one another, it is apparent that small (i.e. <5%) manufacturing-related variations among port
diameters are unlikely to cause significant mass flow maldistribution. However the nearly identical slopes
dG/d(∆Tsat) show that the mass flow sensitivity cannot be minimized by changing D, so maldistribution must be
addressed by minimizing pressure gradients along headers.
Additional simulations were conducted to explore the effect of system operating conditions that influence
the evaporator. It was found that the slope of the G vs ∆Tsat curve remained independent of inlet refrigerant qualities.
This implies that the effects of header ∆P induced maldistribution will be unaffected by variations of condenser exit
enthalpy resulting from changes in outdoor air temperature. Simulations conducted with R22 and R134a revealed
that the slope of the G vs ∆Tsat curve is flattest for the lowest pressure refrigerant, and the low-pressure refrigerants
require shorter tubes (0.78 and 0.58 m for R22 and R134a respectively).
From the above single port analyses, it is possible to infer several guidelines for microchannel evaporator
designs. First note that condenser exit conditions and the evaporating pressure fix the refrigerant state at the
evaporator inlet. The port diameter is selected in the usual manner as a result of tradeoffs among the desired
pressure drop, heat transfer per circuit, number of circuits and refrigerant charge. Once the port diameter and the
refrigerant state at the inlet to the evaporator are fixed, so also are the circuit length and the refrigerant mass flux.
8
At this point the header design is not determined. Figure 2.3 showed that header pressure gradients causing
10% variations in the driving pressure differentials will cause some ports to get higher refrigerant mass flow while
others get lower, resulting in a 4-5% capacity degradation for a R410A microchannel evaporator. Since mass flux
maldistribution (caused by pressure gradient in the header) cannot be controlled by changing either the port diameter
or the refrigerant state at the inlet to the port, it must be addressed through header design.
50
150
250
350
450
1 2 3 4
∆Tsat [oC]
G [
kg/m
2 -s]
L=1.1 m D=0.5 mm
L=2.5 m D=1.0 mmL= 3.9 m D = 1.5 mm
Design
Figure 2.4 Effect of Dport on dG/d(∆Tsat)
2.4 Header design tradeoffs Constraints on header design are now becoming clear. Header diameter must be sufficient to carry the
refrigerant flow required for the specified evaporator capacity. Header mass flux must be high enough to avoid
gravity-induced liquid-vapor stratification, yet low enough to maintain near-uniform driving pressure differentials
seen by the parallel circuits. Header pressure gradients are subject to the offsetting effects of both friction and
deceleration, as refrigerant enters the tubes and the header mass flux decreases. Nevertheless in the terminal portion
of the header where refrigerant velocity approaches zero, stratification cannot be avoided without radically varying
the cross-sectional area of the header. Therefore to limit the potential for gravitational stratification to a small
segment near the end of the header, header mass flux is required to exceed a lower limit Gmin=210 kg/m2-s (for
annular flow of R410A at 20% quality and 12°C evaporating temperature in a header of diameter 10 mm from
Thome, et al, 1998) throughout the rest of the header.
It is clear from the initial results published by Fei et al. (2001) that refrigerant distribution is best in the mist
flow regime, but that would require 10 times greater mass flux (Thome, et al, 1998) and induce correspondingly
higher pressure gradient than the inertially-dominated annular flow regime explored here. Actually the protrusion of
tubes into the header creates a series of hurdle-like obstacles capable of creating turbulence in the misty core of an
annular flow, and causing more droplets to become entrained in the mist. As a result, the microchannel ports will
not receive direct liquid inflow from the annular film as observed in flush-mounted T-junction experiments. Rather,
9
they are more likely to be exposed to a more nearly homogenous constant-quality misty flow characterized mainly
by mass flux variation along the header.
The absence of correlations describing developing two-phase flow requires an approximate approach to
calculating the pressure gradient in evaporator inlet headers. The frictional pressure drop correlation (Souza and
Pimenta, 1995) applicable to tube diameters of 7-10 mm and a variety of refrigerants including R410A was used,
after adjusting for the effect of tube protrusions on free flow area and hydraulic diameter. Single-phase
measurements by Yin et al. (2002) in a header subject to even greater tube blockage were within 25% of the
calculated value.
Despite the approximate and somewhat arbitrary nature of these assumptions, the following analyses will
show that they are sufficient to eliminate some potential header designs, and to suggest some rather novel designs
that might be necessary to minimize refrigerant maldistribution in microchannel evaporators.
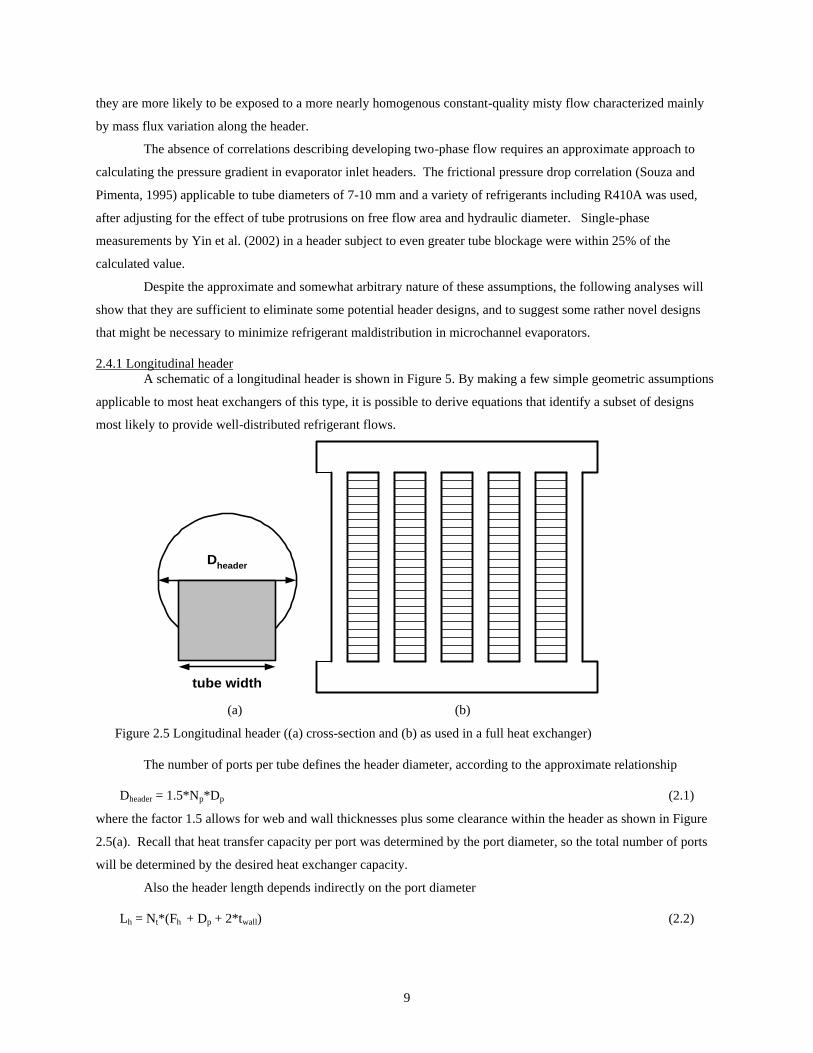
2.4.1 Longitudinal header A schematic of a longitudinal header is shown in Figure 5. By making a few simple geometric assumptions
applicable to most heat exchangers of this type, it is possible to derive equations that identify a subset of designs
most likely to provide well-distributed refrigerant flows.
tube width
Dheader
(a) (b)
Figure 2.5 Longitudinal header ((a) cross-section and (b) as used in a full heat exchanger)
The number of ports per tube defines the header diameter, according to the approximate relationship
Dheader = 1.5*Np*Dp (2.1)
where the factor 1.5 allows for web and wall thicknesses plus some clearance within the header as shown in Figure
2.5(a). Recall that heat transfer capacity per port was determined by the port diameter, so the total number of ports
will be determined by the desired heat exchanger capacity.
Also the header length depends indirectly on the port diameter
Lh = Nt*(Fh + Dp + 2*twall) (2.2)
10
where the fin height (~1 cm) and tube wall thickness (~0.2 mm) are determined for all heat exchangers by fin
efficiency and burst pressure considerations, respectively.
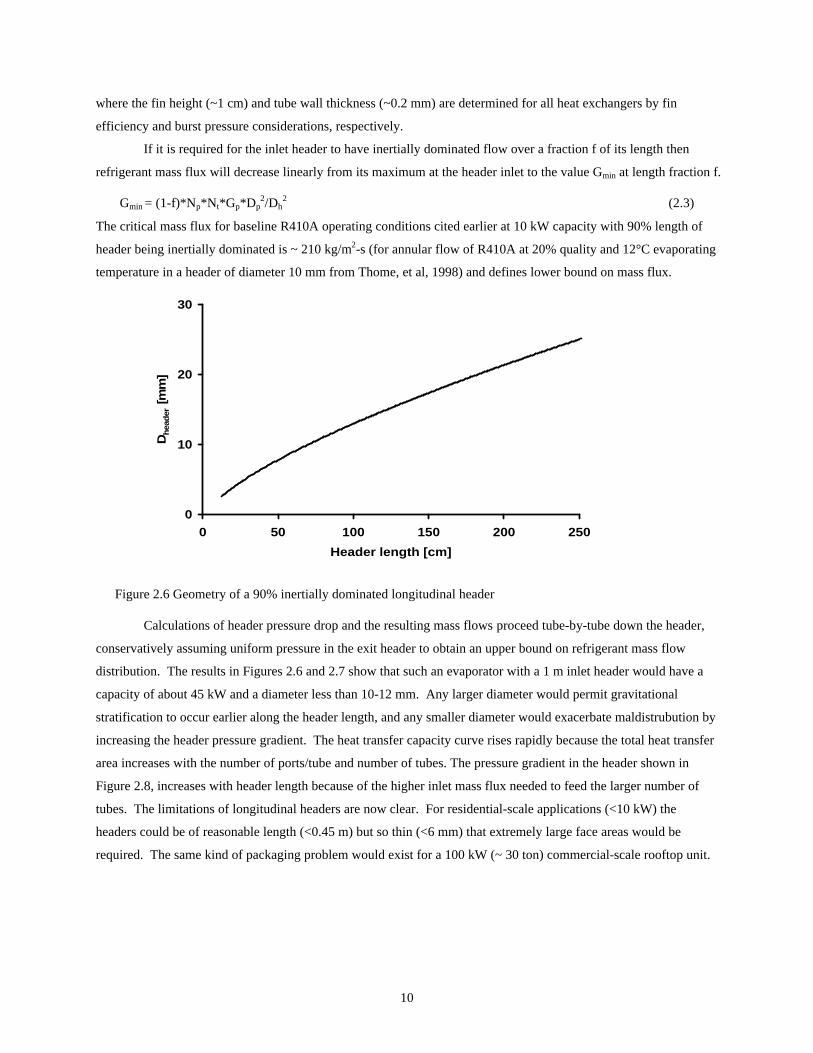
If it is required for the inlet header to have inertially dominated flow over a fraction f of its length then
refrigerant mass flux will decrease linearly from its maximum at the header inlet to the value Gmin at length fraction f.
Gmin = (1-f)*Np*Nt*Gp*Dp2/Dh
2 (2.3)
The critical mass flux for baseline R410A operating conditions cited earlier at 10 kW capacity with 90% length of
header being inertially dominated is ~ 210 kg/m2-s (for annular flow of R410A at 20% quality and 12°C evaporating
temperature in a header of diameter 10 mm from Thome, et al, 1998) and defines lower bound on mass flux.
0
10
20
30
0 50 100 150 200 250
Header length [cm]
Dh
ead
er [
mm
]
Figure 2.6 Geometry of a 90% inertially dominated longitudinal header
Calculations of header pressure drop and the resulting mass flows proceed tube-by-tube down the header,
conservatively assuming uniform pressure in the exit header to obtain an upper bound on refrigerant mass flow
distribution. The results in Figures 2.6 and 2.7 show that such an evaporator with a 1 m inlet header would have a
capacity of about 45 kW and a diameter less than 10-12 mm. Any larger diameter would permit gravitational
stratification to occur earlier along the header length, and any smaller diameter would exacerbate maldistrubution by
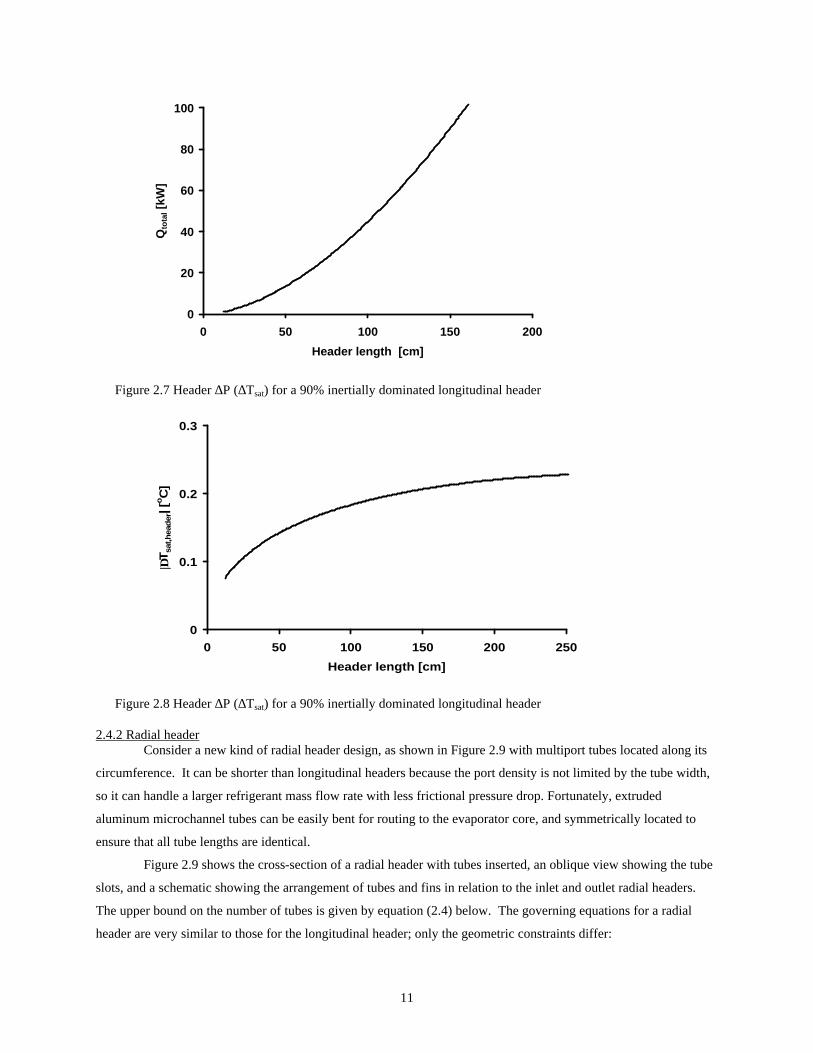
increasing the header pressure gradient. The heat transfer capacity curve rises rapidly because the total heat transfer
area increases with the number of ports/tube and number of tubes. The pressure gradient in the header shown in
Figure 2.8, increases with header length because of the higher inlet mass flux needed to feed the larger number of
tubes. The limitations of longitudinal headers are now clear. For residential-scale applications (<10 kW) the
headers could be of reasonable length (<0.45 m) but so thin (<6 mm) that extremely large face areas would be
required. The same kind of packaging problem would exist for a 100 kW (~ 30 ton) commercial-scale rooftop unit.
11
0
20
40
60
80
100
0 50 100 150 200
Header length [cm]
Qto
tal [
kW]
Figure 2.7 Header ∆P (∆Tsat) for a 90% inertially dominated longitudinal header
0
0.1
0.2
0.3
0 50 100 150 200 250
Header length [cm]
|∆T
sat,h
ead
er| [
oC
]
Figure 2.8 Header ∆P (∆Tsat) for a 90% inertially dominated longitudinal header
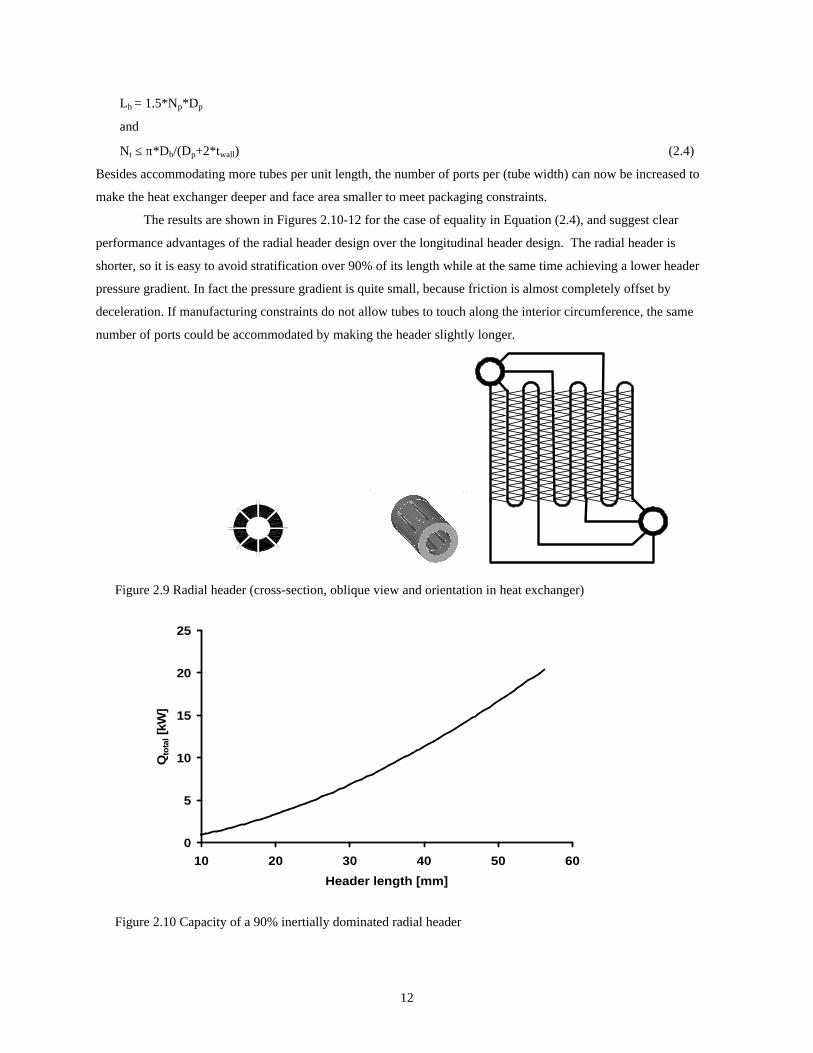
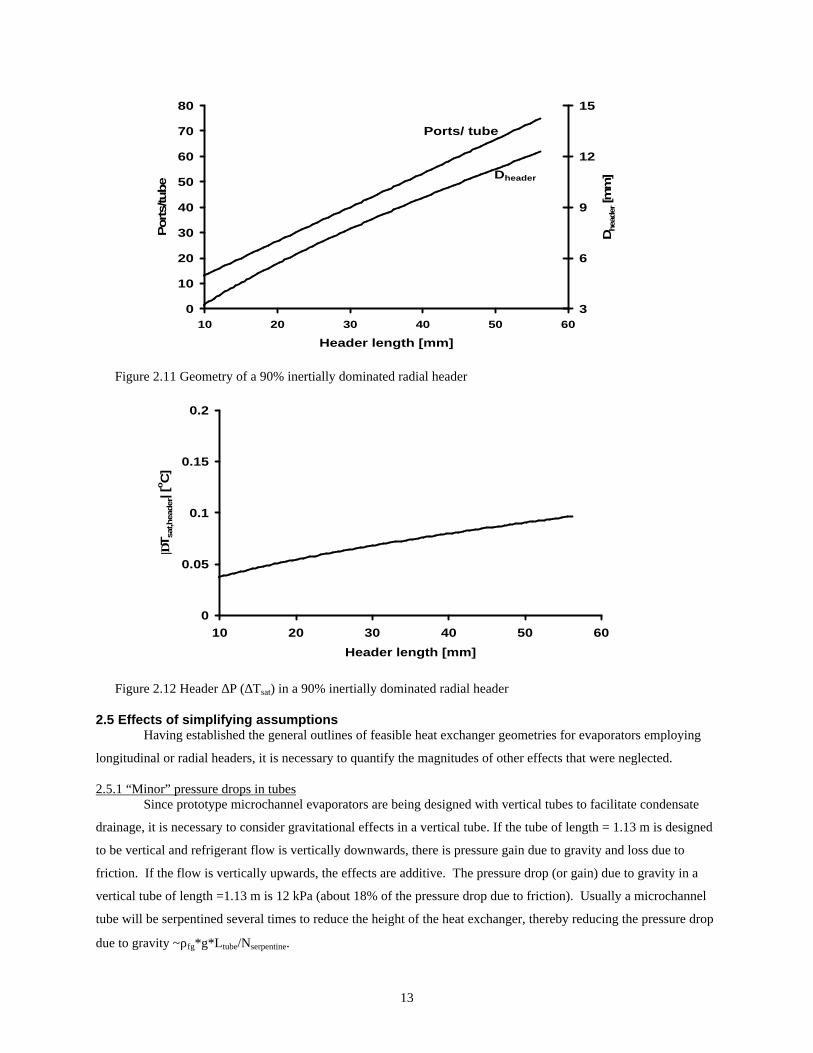
2.4.2 Radial header Consider a new kind of radial header design, as shown in Figure 2.9 with multiport tubes located along its
circumference. It can be shorter than longitudinal headers because the port density is not limited by the tube width,
so it can handle a larger refrigerant mass flow rate with less frictional pressure drop. Fortunately, extruded
aluminum microchannel tubes can be easily bent for routing to the evaporator core, and symmetrically located to
ensure that all tube lengths are identical.
Figure 2.9 shows the cross-section of a radial header with tubes inserted, an oblique view showing the tube
slots, and a schematic showing the arrangement of tubes and fins in relation to the inlet and outlet radial headers.
The upper bound on the number of tubes is given by equation (2.4) below. The governing equations for a radial
header are very similar to those for the longitudinal header; only the geometric constraints differ:
12
Lh = 1.5*Np*Dp
and
Nt ≤ π*Dh/(Dp+2*twall) (2.4)
Besides accommodating more tubes per unit length, the number of ports per (tube width) can now be increased to
make the heat exchanger deeper and face area smaller to meet packaging constraints.
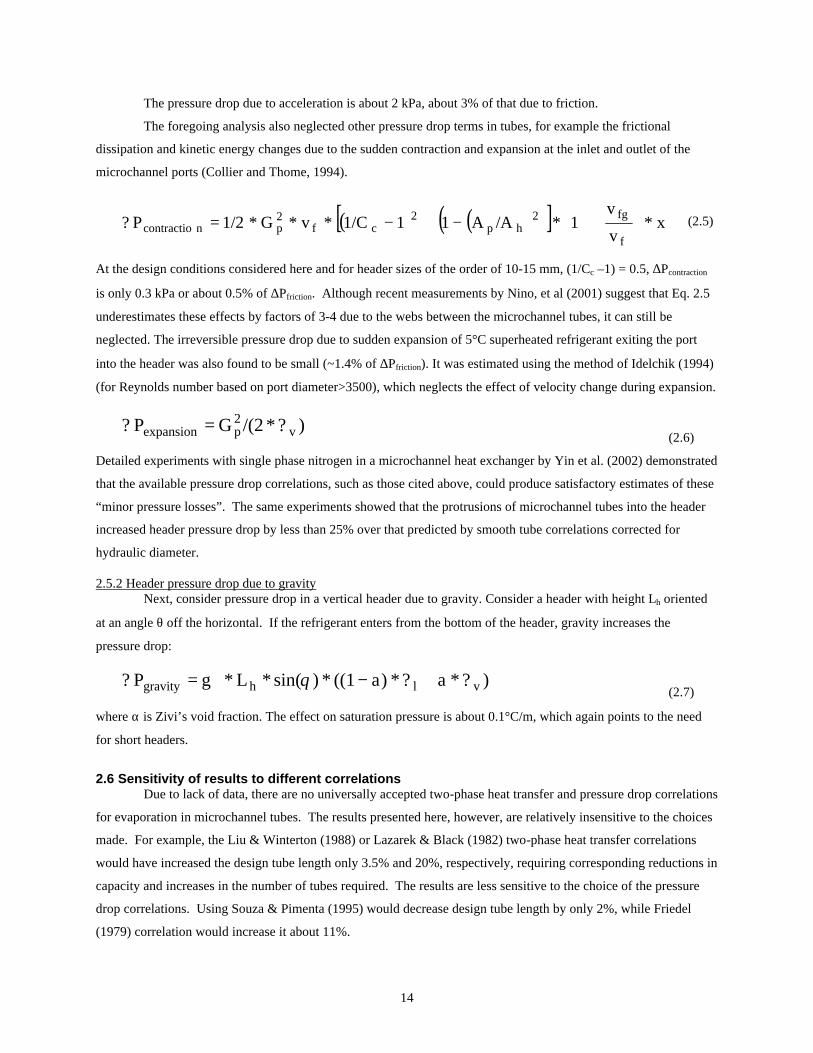
The results are shown in Figures 2.10-12 for the case of equality in Equation (2.4), and suggest clear
performance advantages of the radial header design over the longitudinal header design. The radial header is
shorter, so it is easy to avoid stratification over 90% of its length while at the same time achieving a lower header
pressure gradient. In fact the pressure gradient is quite small, because friction is almost completely offset by
deceleration. If manufacturing constraints do not allow tubes to touch along the interior circumference, the same
number of ports could be accommodated by making the header slightly longer.
Figure 2.9 Radial header (cross-section, oblique view and orientation in heat exchanger)
0
5
10
15
20
25
10 20 30 40 50 60
Header length [mm]
Qto
tal [
kW]
Figure 2.10 Capacity of a 90% inertially dominated radial header
13
0
10
20
30
40
50
60
70
80
10 20 30 40 50 60
Header length [mm]
Ports/
tube
3
6
9
12
15
Dhea
der [m
m]
Ports/ tube
Dheader
Figure 2.11 Geometry of a 90% inertially dominated radial header
0
0.05
0.1
0.15
0.2
10 20 30 40 50 60
Header length [mm]
|∆T
sat,h
eader| [
oC
]
Figure 2.12 Header ∆P (∆Tsat) in a 90% inertially dominated radial header
2.5 Effects of simplifying assumptions Having established the general outlines of feasible heat exchanger geometries for evaporators employing
longitudinal or radial headers, it is necessary to quantify the magnitudes of other effects that were neglected.
2.5.1 “Minor” pressure drops in tubes Since prototype microchannel evaporators are being designed with vertical tubes to facilitate condensate
drainage, it is necessary to consider gravitational effects in a vertical tube. If the tube of length = 1.13 m is designed
to be vertical and refrigerant flow is vertically downwards, there is pressure gain due to gravity and loss due to
friction. If the flow is vertically upwards, the effects are additive. The pressure drop (or gain) due to gravity in a
vertical tube of length =1.13 m is 12 kPa (about 18% of the pressure drop due to friction). Usually a microchannel
tube will be serpentined several times to reduce the height of the heat exchanger, thereby reducing the pressure drop
due to gravity ~ρfg*g*Ltube/Nserpentine.
14
The pressure drop due to acceleration is about 2 kPa, about 3% of that due to friction.
The foregoing analysis also neglected other pressure drop terms in tubes, for example the frictional
dissipation and kinetic energy changes due to the sudden contraction and expansion at the inlet and outlet of the
microchannel ports (Collier and Thome, 1994).
( ) ( )( )[ ]
+−+−= x*
v
v1*/AA111/C*v*G*1/2? P
f
fg2hp
2cf
2pncontractio (2.5)
At the design conditions considered here and for header sizes of the order of 10-15 mm, (1/Cc –1) = 0.5, ∆Pcontraction
is only 0.3 kPa or about 0.5% of ∆Pfriction. Although recent measurements by Nino, et al (2001) suggest that Eq. 2.5
underestimates these effects by factors of 3-4 due to the webs between the microchannel tubes, it can still be
neglected. The irreversible pressure drop due to sudden expansion of 5°C superheated refrigerant exiting the port
into the header was also found to be small (~1.4% of ∆Pfriction). It was estimated using the method of Idelchik (1994)
(for Reynolds number based on port diameter>3500), which neglects the effect of velocity change during expansion.
)?*/(2G? P v2pexpansion =
(2.6)
Detailed experiments with single phase nitrogen in a microchannel heat exchanger by Yin et al. (2002) demonstrated
that the available pressure drop correlations, such as those cited above, could produce satisfactory estimates of these
“minor pressure losses”. The same experiments showed that the protrusions of microchannel tubes into the header
increased header pressure drop by less than 25% over that predicted by smooth tube correlations corrected for
hydraulic diameter.
2.5.2 Header pressure drop due to gravity Next, consider pressure drop in a vertical header due to gravity. Consider a header with height Lh oriented
at an angle θ off the horizontal. If the refrigerant enters from the bottom of the header, gravity increases the
pressure drop:
)?*a?*a)((1*)sin(*L*g? P vlhgravity +−= θ (2.7)
where α is Zivi’s void fraction. The effect on saturation pressure is about 0.1°C/m, which again points to the need
for short headers.
2.6 Sensitivity of results to different correlations Due to lack of data, there are no universally accepted two-phase heat transfer and pressure drop correlations
for evaporation in microchannel tubes. The results presented here, however, are relatively insensitive to the choices
made. For example, the Liu & Winterton (1988) or Lazarek & Black (1982) two-phase heat transfer correlations
would have increased the design tube length only 3.5% and 20%, respectively, requiring corresponding reductions in
capacity and increases in the number of tubes required. The results are less sensitive to the choice of the pressure
drop correlations. Using Souza & Pimenta (1995) would decrease design tube length by only 2%, while Friedel
(1979) correlation would increase it about 11%.
15
Further, in case of two-phase heat transfer coefficients, the need for accuracy is less, because the relatively
large refrigerant-side area reduces refrigerant-side resistance so dramatically in flat multiport tubes, yielding
air/refrigerant area ratios of about 4:1, compared to the 20:1 ratio typical of round tube flat-fin heat exchangers.
Single-tube condensation studies suggest that macrochannel correlations can be extrapolated to microchannels
without substantial loss of accuracy (Bandhauer and Garimella, 2002). However there are even fewer studies
available on microchannel evaporators, mainly because of concerns about refrigerant maldistribution. The results in
table 2.2 successfully demonstrate that the choice of two-phase heat transfer correlation does not affect the results
significantly.
Table 2.1 Sensitivity to two-phase pressure drop correlations
Correlation L [m] Q [W] G [kg/ m2-s] Zhang & Kwon 1.13 9.3 285 Souza & Piementa 1.11 9.0 279 Friedel 1.25 10.3 320
Table 2.2 Sensitivity to two-phase heat transfer correlations
Correlation L [m] Q [W] G [kg/ m2-s] Wattelet et al. 1.13 9.3 285 Lazarek & Black 1.35 8.4 260 Liu & Winterton 1.17 8.9 278
2.7 Conclusions The effects of mass flow maldistribution on microchannel evaporators were investigated by using a
simulation model. Header pressure gradient was limited to approximately 10% of the in-tube pressure drop, to keep
heat exchanger capacity degradation below 5%.
The mass flow maldistribution was estimated by using well-known pressure drop and heat transfer
correlations for two-phase flow. It was found that mass flow maldistribution cannot be controlled by changing either
port/header diameter or the refrigerant state at the inlet to the port, only by limiting pressure gradients along header.
This limitation, combined with a requirement that the flow be inertially dominated in order to prevent gravity-
induced phase separation and flow maldistribution, suggests that microchannel evaporators equipped with
conventional longitudinal headers must be extremely thin and therefore have extremely large face areas to achieve a
given design capacity. An innovative radial header design was proposed and subjected to similar analyses, and the
results suggest that flow maldistribution could indeed be minimized in evaporators having exterior package
dimensions typical of those in use today.
These results help explain the poor performance of existing prototype evaporators that have been made
from headers and tubes originally designed for condenser applications. Parametric analyses quantified the
robustness of the conclusion that conventional longitudinal headers may be fundamentally incompatible with typical
heat exchanger packaging constraints, despite the approximations necessitated by the lack of heat transfer and
pressure drop correlations for developing two-phase flow in geometrically complex channels. Analytical
investigations such as these can be used to develop further hypotheses to be tested, not only in the next generation of
prototype evaporators, but also in fundamental heat transfer and pressure drop experiments.
16
3. Vapor bypass to improve distribution in microchannel evaporators
3.1 Introduction Microchannel heat exchangers are widely used as condensers in mobile air conditioning systems. Now, as
compactness becomes more important in stationary applications, it is important to consider their suitability for
reversible operation in heat pumps. If carbon dioxide (R744) is to be used as a refrigerant in mobile a/c
applications, its high pressures require that microchannels be used in both the indoor and outdoor heat exchangers.
To date the use of microchannel evaporators has been limited to a few prototypes, due to concerns about refrigerant
maldistribution among the many parallel tubes and ports. Maldistribution can be caused by header pressure
gradients that expose parallel circuits to different driving pressure differentials, and by variations in refrigerant
quality at the evaporator inlet.
Early prototypes of R744 microchannel evaporators have tried to minimize refrigerant maldistribution by
designing headers having lengths <75 mm to minimize frictional pressure drop, with diameters small enough to
produce mass fluxes high enough to overcome the risk of gravitational stratification (McEnaney, et al. 1998 and
1999; Song and Bullard, 2001). Assuming that headers can be designed to reduce maldistribution caused by header
pressure gradients; there remains the problem of reducing or eliminating maldistribution of quality among the inlets
of the microchannel ports.
One option is to let gravitational forces dominate the flow upstream of the evaporator, segregating the
liquid and vapor phases of the refrigerant. Liquid refrigerant would be passed through the evaporator tubes, while
the vapor could be bypassed through a tube. Single-phase flow distribution in simple headers is relatively well
understood (Bajura and Jones, 1976) and provides the basis for designing vapor inlet and outlet headers of
microchannel heat exchangers. Since liquid velocities in the same headers will be lower than the vapor that must be
accommodated when the flow is reversed for heat pump operation, liquid pressure gradients inside the header can be
assumed to have negligible effect on refrigerant distribution. This paper explores the choice of design condition for
such a bypass tube, and its implications for performance at off-design conditions.
A similar approach has been demonstrated by Beaver, et al. (2000), based on the use of an actively
controlled valve tube in the R744 vapor bypass line. The analysis presented here explores options for the design of
bypass tube to be used in a transcritical residential air-conditioning application.
A similar option is explored for sub-critical R410A system where the high-side heat rejection occurs in
two-phase zone and an internal heat exchanger is generally not used. Also R410A exits the evaporator as
superheated vapor (5°C superheat is fairly common) opposed to R744 exiting evaporator as saturated vapor. Passive
vapor bypass will be examined for both cycles.
Since it is relatively easy to distribute liquid to several hundred parallel microchannel circuits, this
approach is expected to eliminate the concerns of header pressure gradient maldistribution. At a single design
condition it is possible to design a bypass tube which will carry all of vapor and maintain the same pressure drop as
experienced by the refrigerant passing through the evaporator. The simulation model developed to explore off-
design performance is described in Section 2, and its application to designing the baseline and vapor bypass systems
17
in Sections 3 and 4, respectively. Analyses of off-design performance are presented in Section 5 for both the
subcritical and transcritical systems.
3.2 Simulation model structure The condenser of the subcritical system was divided into a number of finite volumes, each was modeled as
a cross-flow heat exchanger using effectiveness-NTU method with both fluids unmixed (Incropera and DeWitt,
1995). Phase transitions are modeled by breaking the transition element into single and two-phase segments. The
evaporator model was adapted from Song and Bullard (2001), who neglected latent heat transfer in the superheated
zone. This simplification was eliminated in the analysis presented here.
In the transcritical system the gas cooler is similarly modeled by dividing it into finite volumes as was the
internal heat exchanger. Each element was modeled as a counter-flow heat exchanger using the arithmetic mean
temperature difference.
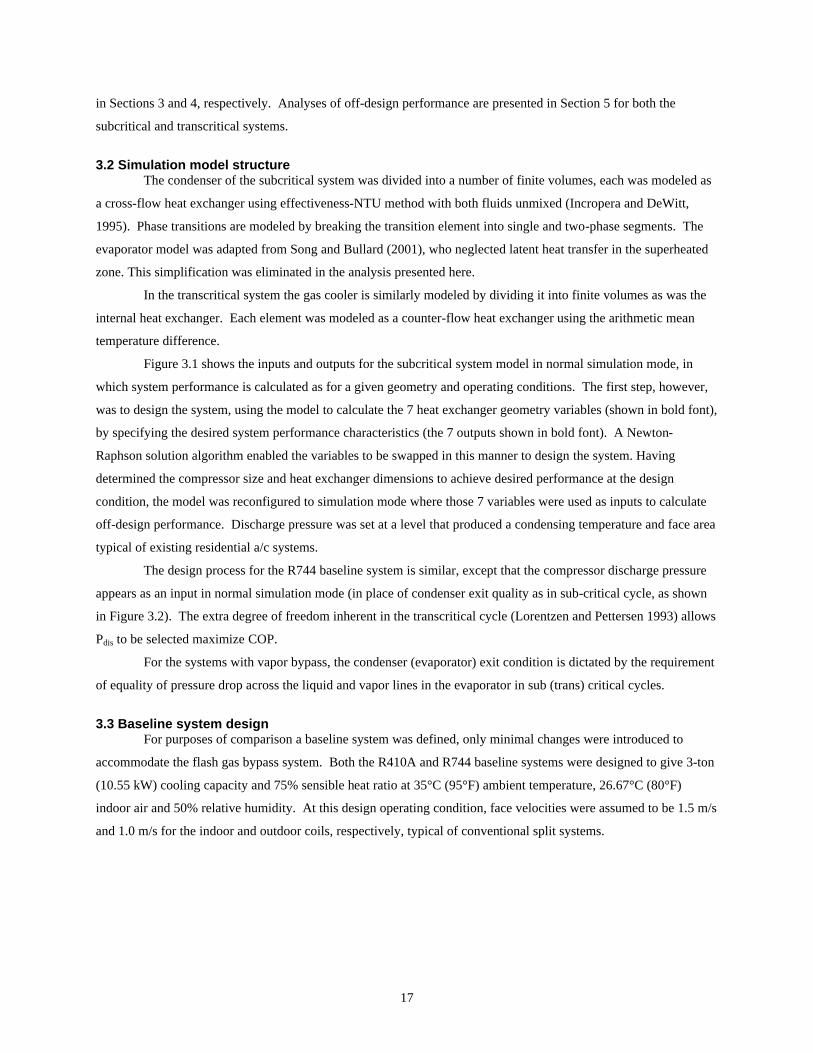
Figure 3.1 shows the inputs and outputs for the subcritical system model in normal simulation mode, in
which system performance is calculated as for a given geometry and operating conditions. The first step, however,
was to design the system, using the model to calculate the 7 heat exchanger geometry variables (shown in bold font),
by specifying the desired system performance characteristics (the 7 outputs shown in bold font). A Newton-
Raphson solution algorithm enabled the variables to be swapped in this manner to design the system. Having
determined the compressor size and heat exchanger dimensions to achieve desired performance at the design
condition, the model was reconfigured to simulation mode where those 7 variables were used as inputs to calculate
off-design performance. Discharge pressure was set at a level that produced a condensing temperature and face area
typical of existing residential a/c systems.
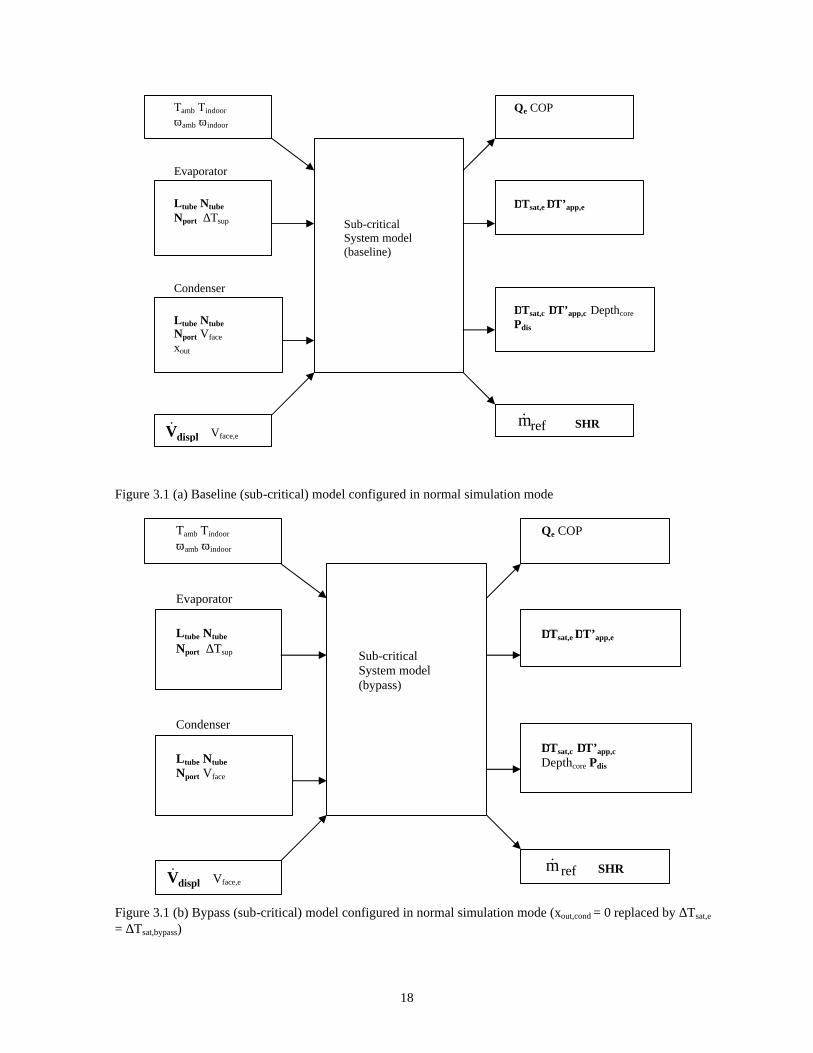
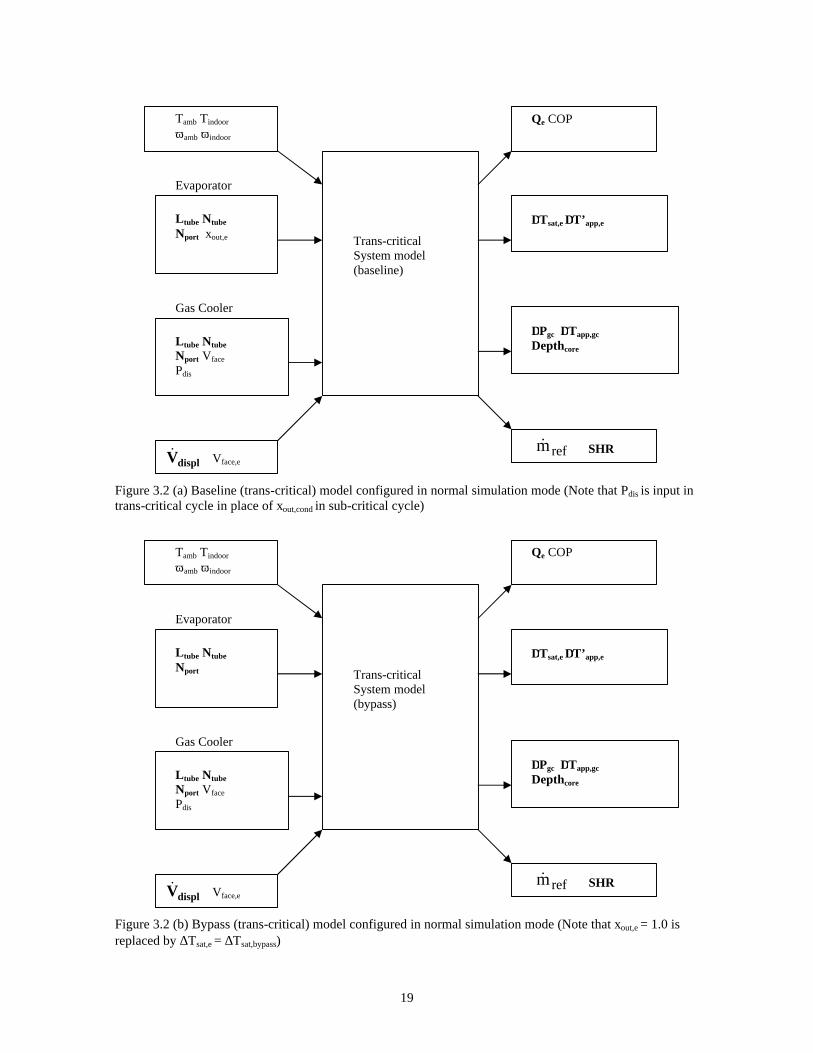
The design process for the R744 baseline system is similar, except that the compressor discharge pressure
appears as an input in normal simulation mode (in place of condenser exit quality as in sub-critical cycle, as shown
in Figure 3.2). The extra degree of freedom inherent in the transcritical cycle (Lorentzen and Pettersen 1993) allows
Pdis to be selected maximize COP.
For the systems with vapor bypass, the condenser (evaporator) exit condition is dictated by the requirement
of equality of pressure drop across the liquid and vapor lines in the evaporator in sub (trans) critical cycles.
3.3 Baseline system design For purposes of comparison a baseline system was defined, only minimal changes were introduced to
accommodate the flash gas bypass system. Both the R410A and R744 baseline systems were designed to give 3-ton
(10.55 kW) cooling capacity and 75% sensible heat ratio at 35°C (95°F) ambient temperature, 26.67°C (80°F)
indoor air and 50% relative humidity. At this design operating condition, face velocities were assumed to be 1.5 m/s
and 1.0 m/s for the indoor and outdoor coils, respectively, typical of conventional split systems.
18
Figure 3.1 (a) Baseline (sub-critical) model configured in normal simulation mode
Figure 3.1 (b) Bypass (sub-critical) model configured in normal simulation mode (xout,cond = 0 replaced by ∆Tsat,e
= ∆Tsat,bypass)
Tamb Tindoor ωamb ωindoor
Evaporator
Ltube Ntube Nport ∆Tsup
Condenser
Ltube Ntube Nport Vface
displV& Vface,e
Qe COP
∆Tsat,e ∆T’app,e
∆Tsat,c ∆T’app,c
Depthcore Pdis
Sub-critical System model (bypass)
refm& SHR
Tamb Tindoor ωamb ωindoor
Evaporator
Ltube Ntube Nport ∆Tsup
Condenser
Ltube Ntube Nport Vface xout
displV& Vface,e
Qe COP
∆Tsat,e ∆T’app,e
∆Tsat,c ∆T’app,c Depthcore Pdis
Sub-critical System model (baseline)
refm& SHR
19
Figure 3.2 (a) Baseline (trans-critical) model configured in normal simulation mode (Note that Pdis is input in trans-critical cycle in place of xout,cond in sub-critical cycle)
Figure 3.2 (b) Bypass (trans-critical) model configured in normal simulation mode (Note that xout,e = 1.0 is replaced by ∆Tsat,e = ∆Tsat,bypass)
Tamb Tindoor ωamb ωindoor
Evaporator
Ltube Ntube Nport
Gas Cooler
Ltube Ntube Nport Vface Pdis
displV& Vface,e
Qe COP
∆Tsat,e ∆T’app,e
∆Pgc ∆Tapp,gc
Depthcore
Trans-critical System model (bypass)
refm& SHR
Tamb Tindoor ωamb ωindoor
Evaporator
Ltube Ntube Nport xout,e
Gas Cooler
Ltube Ntube Nport Vface Pdis
displV& Vface,e
Qe COP
∆Tsat,e ∆T’app,e
∆Pgc ∆Tapp,gc
Depthcore
Trans-critical System model (baseline)
refm& SHR
20
3.3.1 Correlations Two-phase heat transfer and pressure drop correlations for sub-millimeter tubes are in the early stages of
development, so extrapolation from larger diameters is necessary at this time. Nino (2001) measured two-phase
refrigerant pressure drop under adiabatic conditions for R410A in ports >1 mm and found best agreement with
Zhang and Kwon (1999) correlation (developed for port diameter ~2 mm), out of three correlations considered and it
was used in the present study. For heat transfer coefficient during evaporation of R410A, Wattelet and Chato (1995)
was selected because R410A was among the refrigerants used to develop the correlation.
The lowest channel diameter for which experimental data on heat transfer during condensation of R410A
available is 3.1 mm. Cavallini, et al (2002) proposed a correlation to calculate heat transfer coefficient based on flow
regimes, and found excellent agreement with most published data.
Experimental data on R744 is even sparser. Pettersen (2003) proposed models for predicting heat transfer
and pressure drop in two-phase flow of R744 based on experimental results obtained at channel diameter 0.81 mm:
for two-phase heat transfer, model suggested by Pettersen (2003) was used. For two-phase frictional pressure drop,
Lombardi and Carsana (1992). For R744 gas coolers, satisfactory agreement with conventional single-phase
correlations has been found by several investigators (e.g. Rieberer, 1999; Pettersen, et al.2002), so single phase
pressure drop and heat transfer for both refrigerants are computed using Churchill (1977) and Gnielinski (1976)
models respectively.
For flat tubes and louvered fins, the dry-surface correlations developed by Chang and Wang (1997) have
been used to predict the air-side heat transfer coefficient. Currently there are no correlations in the open literature for
predicting performance of such coils under wet or frosted conditions, but Kim, et al. (2001) reported less than 10%
heat transfer coefficient change due to condensate on coils of similar fin pitch.
3.3.2 Components Some system operating conditions are fixed as a result of component selection. The subcritical R410A
system is assumed to have a thermostatic expansion valve to maximize evaporator performance, and a high-side
receiver to maximize condenser performance. Thus the evaporator superheat is specified, and the condenser outlet
state is saturated liquid at all operating conditions. The transcritical R744 system is assumed to be equipped with a
low-side receiver that fixes the evaporator outlet state at saturated vapor, while the expansion valve regulates high-
side pressure at the COP-maximizing level.
Both systems are assumed to be equipped with variable speed compressors and (indoor) blowers that
deliver the nominal refrigerant and air flow rates at the 35°C design condition. The isentropic and volumetric
efficiency equations for the R744 semi-hermetic reciprocating compressor are based on data from Nekså (1999).
For the R410A system, these curve fits were obtained from manufacturer’s data for a scroll compressor (Richter, et
al. 2001). The outdoor fans are assumed to operate at constant speed.
For the microchannel heat exchangers of the baseline systems, the refrigerant-side design began with
selection of port diameter. In general, the smaller the diameter, the better the refrigerant-side heat transfer
performance, because of the increased area and the ability to offset pressure drop by adding parallel circuits. Heun
and Dunn (1995) showed that for turbulent single-phase flow in tubes, the heat transfer coefficient h scales inversely
with diameter (h ~ D-0.2). The smaller diameter also improves air-side performance by reducing tube thickness.
21
Therefore port diameter of both the heat exchangers was selected as 0.5 mm, near the lower limit of aluminum
extrusions currently available. The corresponding wall and web thicknesses needed to meet burst pressure
requirements are still quite thin; further reductions may introduce quality control problems as aluminum grain size
limits are approached.
The air-side fin geometry for both the R410A and R744 systems were taken from prototype microchannel
heat exchangers used by Beaver, et al. (1999), since they were designed with condensate shedding in mind – with
louver pitch and angle of 1 mm and 23° respectively. For R744, the refrigerant side details (wall and web
thickness) were scaled down to port diameters of 0.5 mm (used in the present study) from Beaver’s 0.79 mm
prototype. For R410A, the tube dimensions were scaled down to port diameters 0.5 mm from a commercially
available tube having hydraulic diameter of 0.67 mm (Kirkwood and Bullard, 1999). For actual dimensions, see
Table 3.1.
The principal design criterion defining the size of the R410A condenser and the evaporators of both
baseline systems was the approach temperature difference. The tube depth was selected to achieve a 1°C air-side
approach temperature difference (between the air and surface of the heat exchanger at the trailing edge) in the two-
phase regions. While this level of performance is slightly higher than what is achieved by conventional round tube-
flat fin heat exchangers, it is may be more cost-effectively achieved in microchannel designs because of the lower
marginal cost of adding incremental core depth. The one-degree criterion is arbitrary, and results in a core depth no
greater than conventional designs. This was done to maintain air-side equivalence between the two systems. It is
doubtful that it would be cost-effective to make coils deeper to achieve further reductions in approach temperature
difference. In the transcritical R744 system, the refrigerant is assumed to exit the gas cooler at 36.5°C (air-to-
refrigerant approach temperature difference of 1.5°C) consistent with data obtained from prototype multi-slab cross-
counterflow prototype heat exchangers (Yin, et al. 2002).
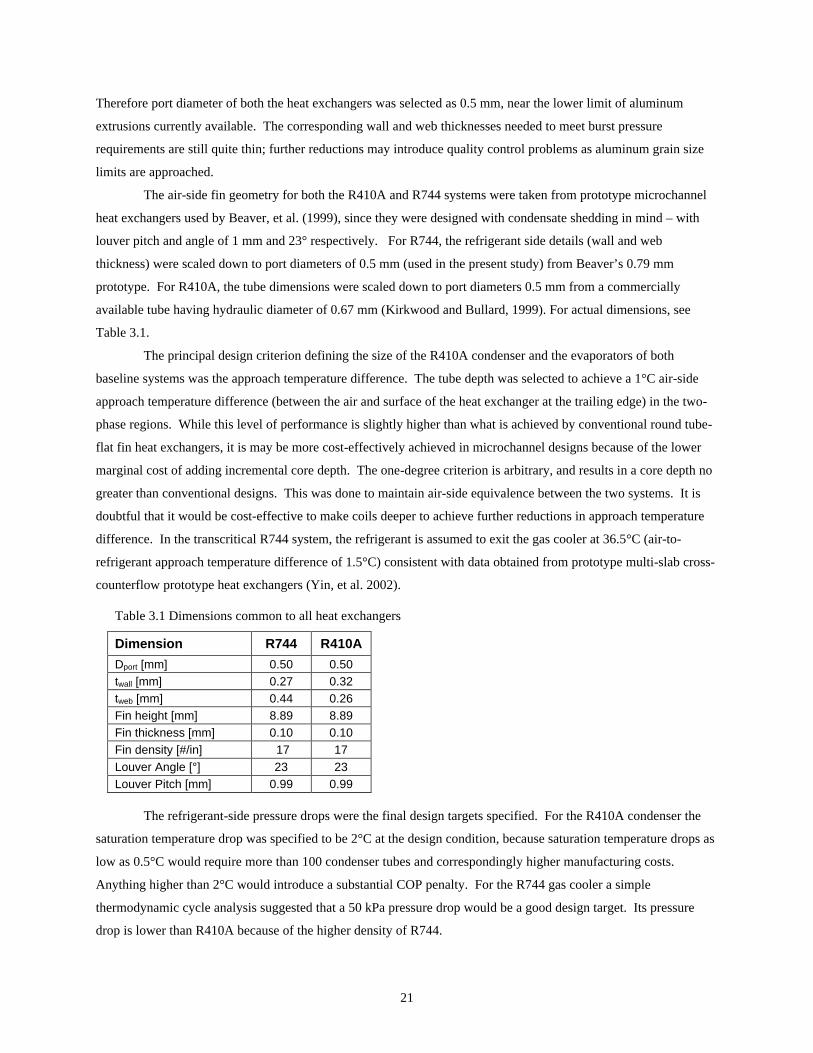
Table 3.1 Dimensions common to all heat exchangers
Dimension R744 R410A
Dport [mm] 0.50 0.50 twall [mm] 0.27 0.32 tweb [mm] 0.44 0.26 Fin height [mm] 8.89 8.89 Fin thickness [mm] 0.10 0.10 Fin density [#/in] 17 17 Louver Angle [°] 23 23 Louver Pitch [mm] 0.99 0.99
The refrigerant-side pressure drops were the final design targets specified. For the R410A condenser the
saturation temperature drop was specified to be 2°C at the design condition, because saturation temperature drops as
low as 0.5°C would require more than 100 condenser tubes and correspondingly higher manufacturing costs.
Anything higher than 2°C would introduce a substantial COP penalty. For the R744 gas cooler a simple
thermodynamic cycle analysis suggested that a 50 kPa pressure drop would be a good design target. Its pressure
drop is lower than R410A because of the higher density of R744.
22
The evaporators of both baseline systems were designed to have refrigerant side pressure drop equivalent to
a saturation temperature drop of 0.5°C. This is typical of existing R410A systems with round tubes and conical
distributors, but there is currently no experimental data indicating how much in-tube pressure drop will be needed in
microchannel evaporators to achieve uniform distribution via a “plenum effect”. Nevertheless for the purpose of
establishing a conservative baseline for evaluating the potential benefits of flash gas bypass, we assume that both
baseline systems achieve uniform distribution of 2-phase refrigerant into their evaporators at 0.5°C saturation
temperature drop. This will understate the estimated benefits of systems equipped with the bypass tube, where it is
much more likely that the liquid will be uniformly distributed into the microchannel ports from the evaporator inlet
header.
For R744 system, an internal heat exchanger is assumed to be 90% effective at the design condition, as
described by Boewe et al. (2001). The number of ports on the suction-side of the internal heat exchanger was
chosen to limit the pressure drop to less than 5 kPa and the length was selected to make it 90% effective. An equal
number of ports were used on its hot-side (2 mm and diameter, 0.57 m long). The assumed dimensions of the indoor
and outdoor heat exchangers are summarized in Table 3.2.
The optimal tube depths were found to be 57 mm and 38 mm for R410A and R744 evaporators
respectively. Since the R744 cycle has saturated refrigerant exiting the evaporator, while the R410A cycle is
superheated, the R744 system can operate at a higher coil surface temperature while providing the same
dehumidification. The simulation model predicted surface temperatures (at the trailing edge of the tube at the
evaporator inlet) 12.4 and 12.9°C for R410A and R744 respectively. This makes R410A evaporator deeper than
R744.
The optimal core depth for the R410A condenser was obtained as 29 mm. The gas cooler tube depth was
also set at 29 mm, yielding a gas cooler face area 1.4 times larger than the outdoor coil face area for R410A system.
Recall that the R410A system indoor coil was about 1.5 times deeper than R744 indoor coil. Thus the two systems
are roughly comparable in terms of total heat exchanger area, and the larger air-side pressure drop across the indoor
coil in R410A system is offset by the larger air-side pressure drop across the gas cooler.
The resulting baseline system designs, and their associated performance variables, are shown in Table 3.2.
The overall dimensions of the indoor and outdoor heat exchangers of the R410A microchannel system do not differ
substantially from its conventional counterpart. However, fundamental differences between the thermodynamic and
transport properties result in the R744 evaporator being 33% smaller, and its outdoor coil being 38% larger than the
R410A system.
23
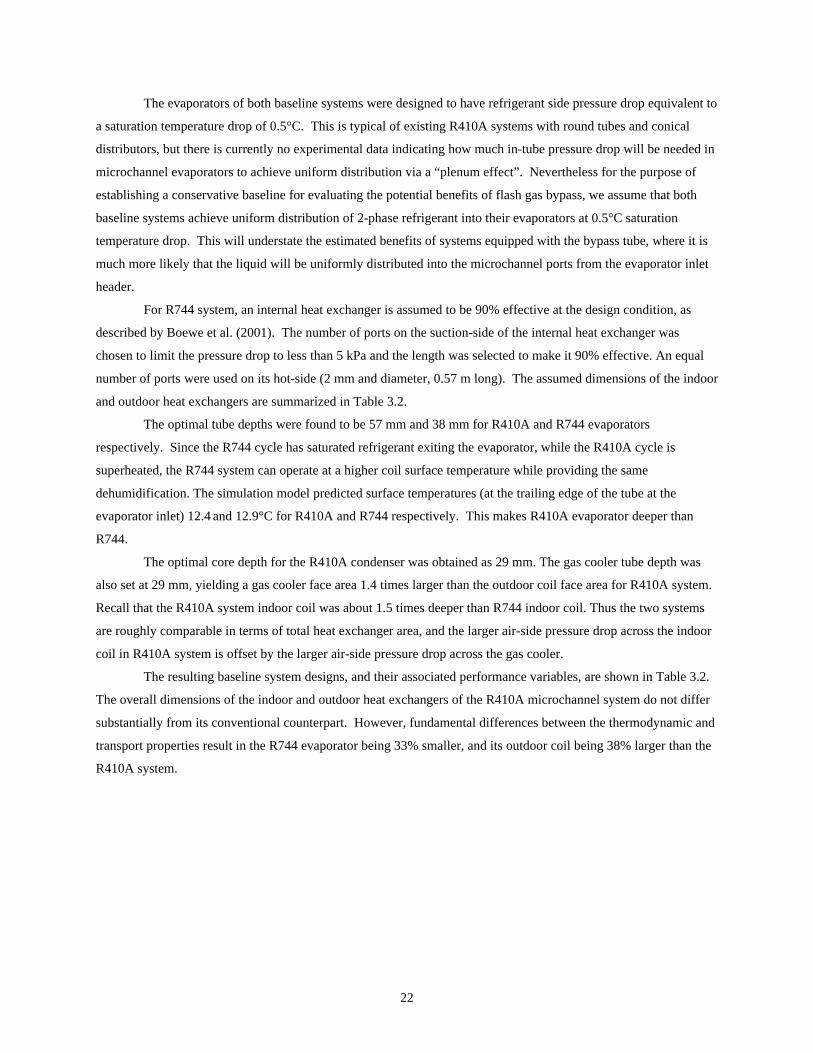
Table 3.2 Baseline system parameters1
Refrigerant R410A R744
System Nominal capacity at 26.7/15.7/35 [Tdb/Tdp, outdoor Tdb]
10.5 kW 10.5 kW
∆Tsat [°C] 0.50 0.50 Refrigerant exit 5°C superheated Saturated vapor ∆T’app [°C]2 1.0 1.0 Number of ports 78 40 Width [m] 0.77 1.40 Number of tubes 43 25 Core depth 57 38 Face area [m2] 0.34 0.36 Air flow rate [m3/s] 0.50 0.53 SHR 0.75 0.75 Refrigerant inlet temperature/quality [°C/-] 11.9/0.28 12.8/0.21 Air-side area [m2] 27.8 18.67
Indoor Coil
Air/ref-side area [-] 6.9 8.7
∆Tsat [°C]/DPtotal[kPa] 2.0/121.5 -/100 Refrigerant exit quality [-] Saturated liquid - Refrigerant exit temperature [°C] - 36.5 ∆T’app [°C]2 1.0 - Number of ports 38 31 Width [m] 1.34 5.11 Number of tubes [-] 85 30 Core depth 29 29 Face area [m2] 1.16 1.58 Air flow rate [m3/s] 1.16 1.58 Discharge pressure [kPa] 2782 8880/9100 Air-side area [m2] 46.67 64.7
Outdoor Coil
Air-side area/Ref-side area[-] 6.9 8.7 Cycle COP 4.25 3.84/3.90 Notes: 1. Calculated parameters italicized. 2. ∆T’app = |temperature difference between the exiting air and surface temperature of port at the trailing
edge of the tube|.
In Table 3.2, two values of the COP-maximizing discharge pressure are given for the R744 system. The
first was obtained during design stage when component geometries were being computed for given performance
criteria (e.g. pressure drop targets). The second value corresponds to the operating condition that optimizes COP,
once the geometry has been specified. The actual system optimizes itself at slightly lower refrigerant mass flow rate
(i.e. lower refrigerant pressure drops, larger refrigerating effect) than the original design targets.
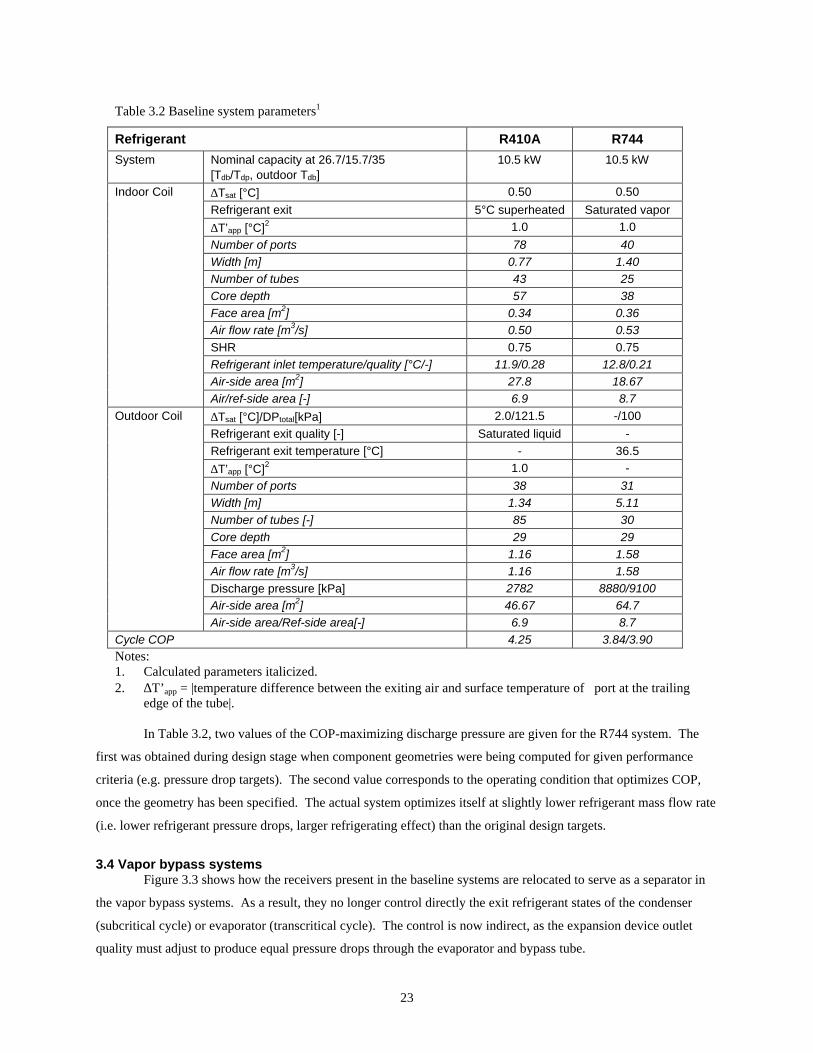
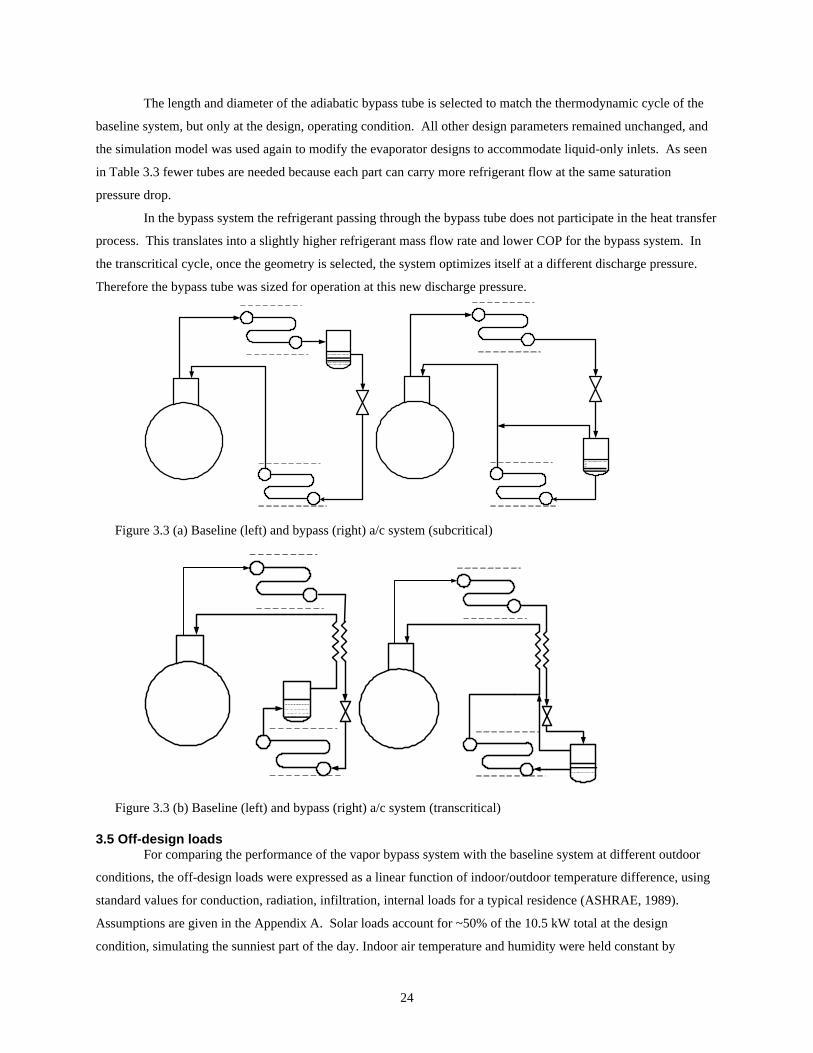
3.4 Vapor bypass systems Figure 3.3 shows how the receivers present in the baseline systems are relocated to serve as a separator in
the vapor bypass systems. As a result, they no longer control directly the exit refrigerant states of the condenser
(subcritical cycle) or evaporator (transcritical cycle). The control is now indirect, as the expansion device outlet
quality must adjust to produce equal pressure drops through the evaporator and bypass tube.
24
The length and diameter of the adiabatic bypass tube is selected to match the thermodynamic cycle of the
baseline system, but only at the design, operating condition. All other design parameters remained unchanged, and
the simulation model was used again to modify the evaporator designs to accommodate liquid-only inlets. As seen
in Table 3.3 fewer tubes are needed because each part can carry more refrigerant flow at the same saturation
pressure drop.
In the bypass system the refrigerant passing through the bypass tube does not participate in the heat transfer
process. This translates into a slightly higher refrigerant mass flow rate and lower COP for the bypass system. In
the transcritical cycle, once the geometry is selected, the system optimizes itself at a different discharge pressure.
Therefore the bypass tube was sized for operation at this new discharge pressure.
Figure 3.3 (a) Baseline (left) and bypass (right) a/c system (subcritical)
Figure 3.3 (b) Baseline (left) and bypass (right) a/c system (transcritical)
3.5 Off-design loads For comparing the performance of the vapor bypass system with the baseline system at different outdoor
conditions, the off-design loads were expressed as a linear function of indoor/outdoor temperature difference, using
standard values for conduction, radiation, infiltration, internal loads for a typical residence (ASHRAE, 1989).
Assumptions are given in the Appendix A. Solar loads account for ~50% of the 10.5 kW total at the design
condition, simulating the sunniest part of the day. Indoor air temperature and humidity were held constant by
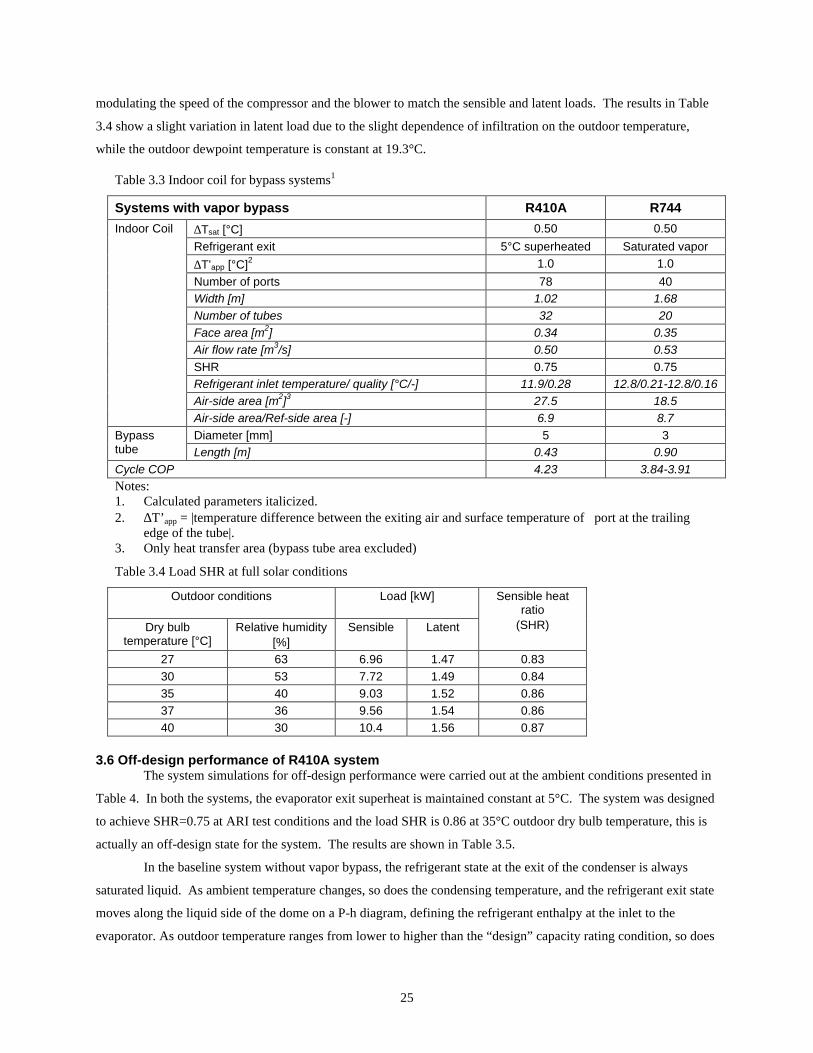
25
modulating the speed of the compressor and the blower to match the sensible and latent loads. The results in Table
3.4 show a slight variation in latent load due to the slight dependence of infiltration on the outdoor temperature,
while the outdoor dewpoint temperature is constant at 19.3°C.
Table 3.3 Indoor coil for bypass systems1
Systems with vapor bypass R410A R744
∆Tsat [°C] 0.50 0.50 Refrigerant exit 5°C superheated Saturated vapor ∆T’app [°C]2 1.0 1.0 Number of ports 78 40 Width [m] 1.02 1.68 Number of tubes 32 20 Face area [m2] 0.34 0.35 Air flow rate [m3/s] 0.50 0.53 SHR 0.75 0.75 Refrigerant inlet temperature/ quality [°C/-] 11.9/0.28 12.8/0.21-12.8/0.16 Air-side area [m2]3 27.5 18.5
Indoor Coil
Air-side area/Ref-side area [-] 6.9 8.7 Diameter [mm] 5 3 Bypass
tube Length [m] 0.43 0.90 Cycle COP 4.23 3.84-3.91 Notes: 1. Calculated parameters italicized. 2. ∆T’app = |temperature difference between the exiting air and surface temperature of port at the trailing
edge of the tube|. 3. Only heat transfer area (bypass tube area excluded)
Table 3.4 Load SHR at full solar conditions
Outdoor conditions Load [kW]
Dry bulb temperature [°C]
Relative humidity [%]
Sensible Latent
Sensible heat ratio
(SHR)
27 63 6.96 1.47 0.83 30 53 7.72 1.49 0.84 35 40 9.03 1.52 0.86 37 36 9.56 1.54 0.86 40 30 10.4 1.56 0.87
3.6 Off-design performance of R410A system The system simulations for off-design performance were carried out at the ambient conditions presented in
Table 4. In both the systems, the evaporator exit superheat is maintained constant at 5°C. The system was designed
to achieve SHR=0.75 at ARI test conditions and the load SHR is 0.86 at 35°C outdoor dry bulb temperature, this is
actually an off-design state for the system. The results are shown in Table 3.5.
In the baseline system without vapor bypass, the refrigerant state at the exit of the condenser is always
saturated liquid. As ambient temperature changes, so does the condensing temperature, and the refrigerant exit state
moves along the liquid side of the dome on a P-h diagram, defining the refrigerant enthalpy at the inlet to the
evaporator. As outdoor temperature ranges from lower to higher than the “design” capacity rating condition, so does
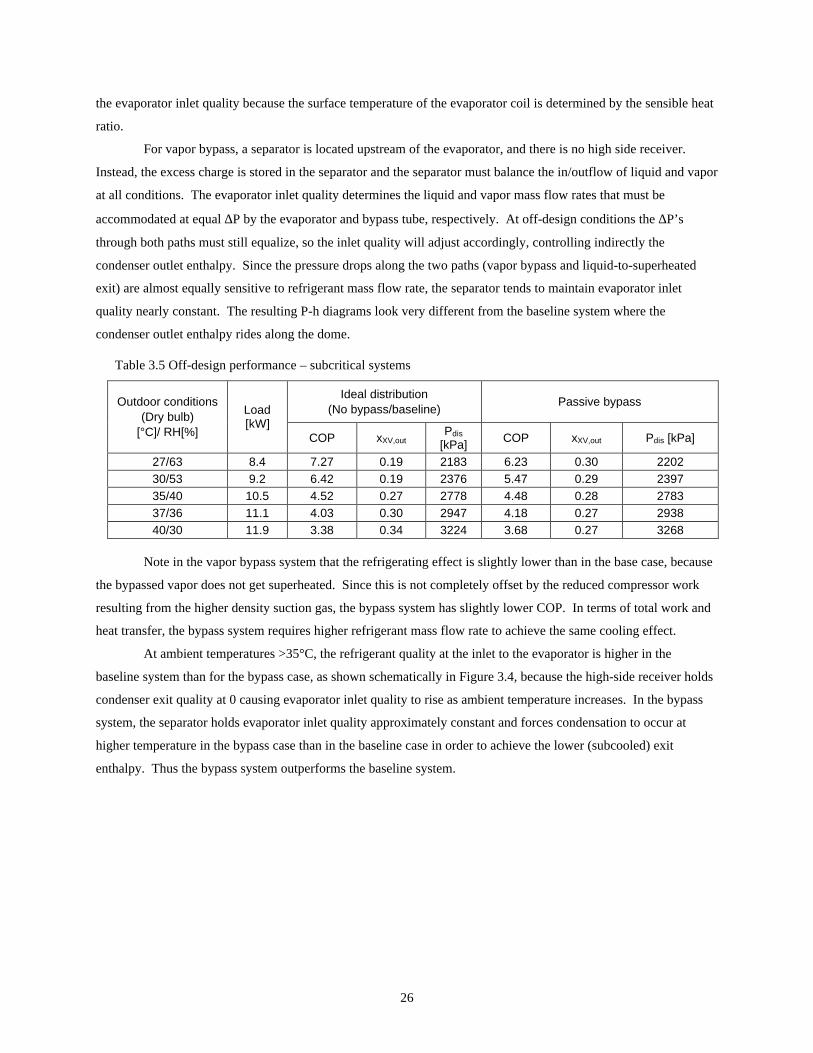
26
the evaporator inlet quality because the surface temperature of the evaporator coil is determined by the sensible heat
ratio.
For vapor bypass, a separator is located upstream of the evaporator, and there is no high side receiver.
Instead, the excess charge is stored in the separator and the separator must balance the in/outflow of liquid and vapor
at all conditions. The evaporator inlet quality determines the liquid and vapor mass flow rates that must be
accommodated at equal ∆P by the evaporator and bypass tube, respectively. At off-design conditions the ∆P’s
through both paths must still equalize, so the inlet quality will adjust accordingly, controlling indirectly the
condenser outlet enthalpy. Since the pressure drops along the two paths (vapor bypass and liquid-to-superheated
exit) are almost equally sensitive to refrigerant mass flow rate, the separator tends to maintain evaporator inlet
quality nearly constant. The resulting P-h diagrams look very different from the baseline system where the
condenser outlet enthalpy rides along the dome.
Table 3.5 Off-design performance – subcritical systems
Ideal distribution (No bypass/baseline)
Passive bypass Outdoor conditions (Dry bulb)
[°C]/ RH[%]
Load [kW]
COP xXV,out Pdis
[kPa] COP xXV,out Pdis [kPa]
27/63 8.4 7.27 0.19 2183 6.23 0.30 2202 30/53 9.2 6.42 0.19 2376 5.47 0.29 2397 35/40 10.5 4.52 0.27 2778 4.48 0.28 2783 37/36 11.1 4.03 0.30 2947 4.18 0.27 2938 40/30 11.9 3.38 0.34 3224 3.68 0.27 3268
Note in the vapor bypass system that the refrigerating effect is slightly lower than in the base case, because
the bypassed vapor does not get superheated. Since this is not completely offset by the reduced compressor work
resulting from the higher density suction gas, the bypass system has slightly lower COP. In terms of total work and
heat transfer, the bypass system requires higher refrigerant mass flow rate to achieve the same cooling effect.
At ambient temperatures >35°C, the refrigerant quality at the inlet to the evaporator is higher in the
baseline system than for the bypass case, as shown schematically in Figure 3.4, because the high-side receiver holds
condenser exit quality at 0 causing evaporator inlet quality to rise as ambient temperature increases. In the bypass
system, the separator holds evaporator inlet quality approximately constant and forces condensation to occur at
higher temperature in the bypass case than in the baseline case in order to achieve the lower (subcooled) exit
enthalpy. Thus the bypass system outperforms the baseline system.
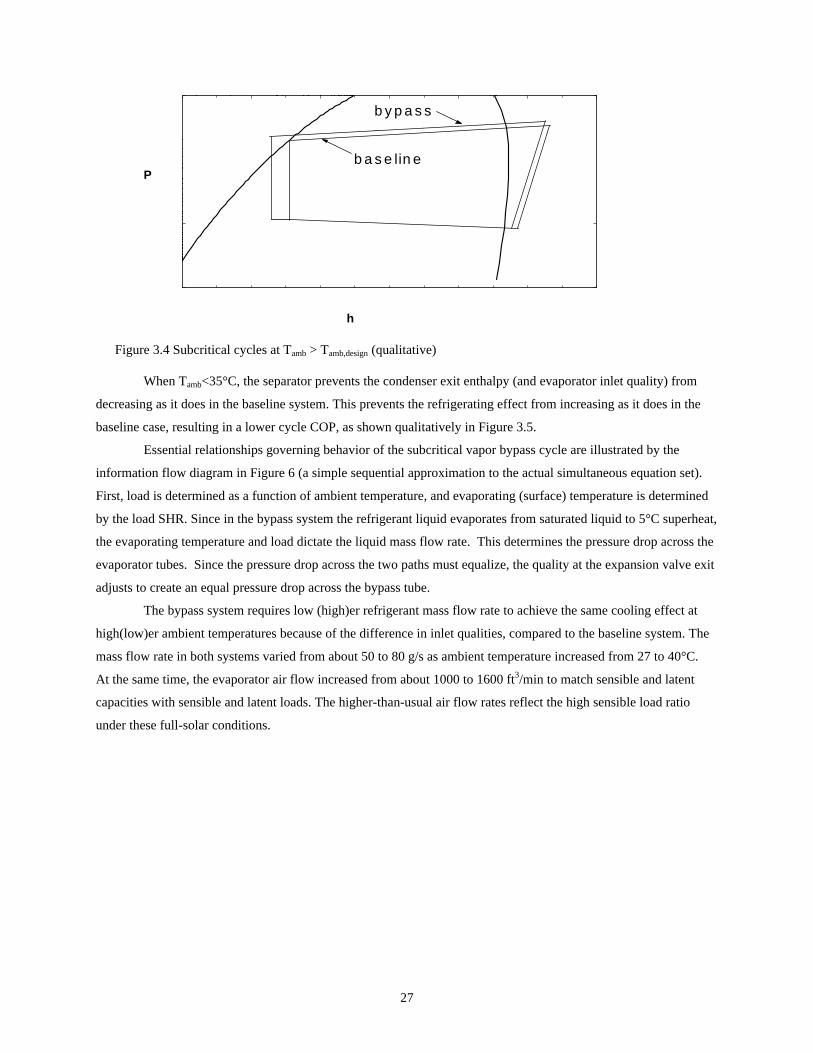
27
h
P
b y p a s s
b a s e lin e
Figure 3.4 Subcritical cycles at Tamb > Tamb,design (qualitative)
When Tamb<35°C, the separator prevents the condenser exit enthalpy (and evaporator inlet quality) from
decreasing as it does in the baseline system. This prevents the refrigerating effect from increasing as it does in the
baseline case, resulting in a lower cycle COP, as shown qualitatively in Figure 3.5.
Essential relationships governing behavior of the subcritical vapor bypass cycle are illustrated by the
information flow diagram in Figure 6 (a simple sequential approximation to the actual simultaneous equation set).
First, load is determined as a function of ambient temperature, and evaporating (surface) temperature is determined
by the load SHR. Since in the bypass system the refrigerant liquid evaporates from saturated liquid to 5°C superheat,
the evaporating temperature and load dictate the liquid mass flow rate. This determines the pressure drop across the
evaporator tubes. Since the pressure drop across the two paths must equalize, the quality at the expansion valve exit
adjusts to create an equal pressure drop across the bypass tube.
The bypass system requires low (high)er refrigerant mass flow rate to achieve the same cooling effect at
high(low)er ambient temperatures because of the difference in inlet qualities, compared to the baseline system. The
mass flow rate in both systems varied from about 50 to 80 g/s as ambient temperature increased from 27 to 40°C.
At the same time, the evaporator air flow increased from about 1000 to 1600 ft3/min to match sensible and latent
capacities with sensible and latent loads. The higher-than-usual air flow rates reflect the high sensible load ratio
under these full-solar conditions.
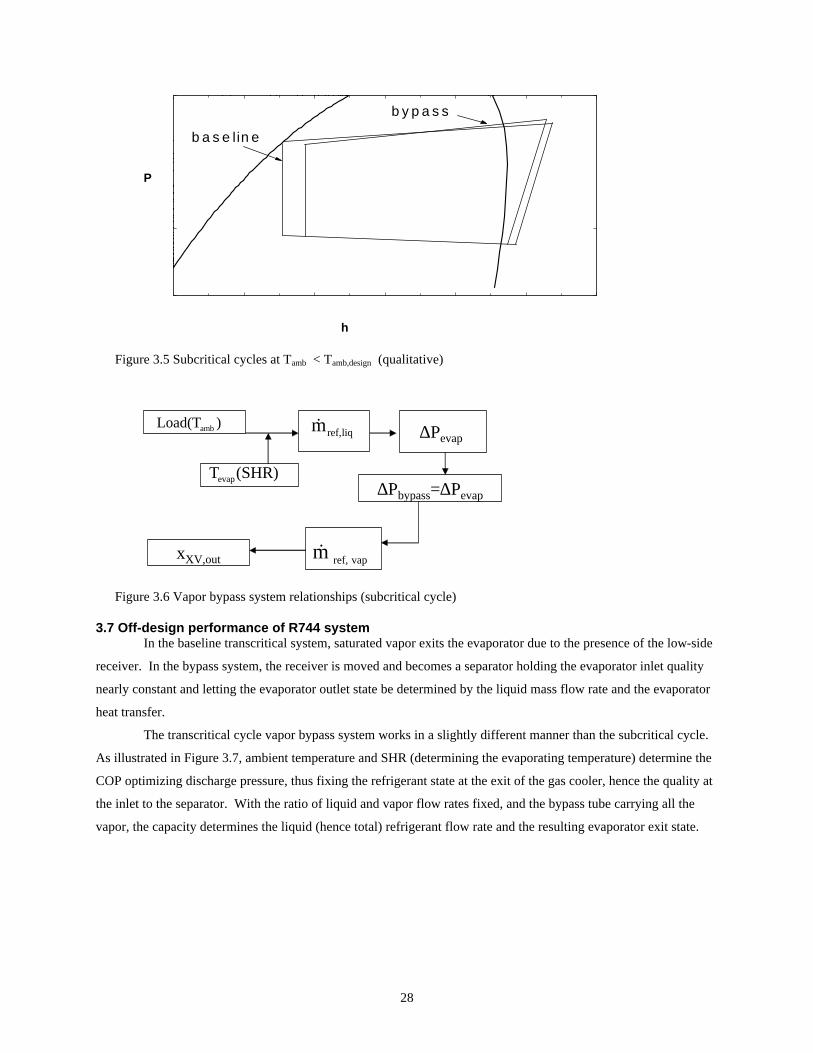
28
h
P
b y p a s s
b a s e lin e
Figure 3.5 Subcritical cycles at Tamb < Tamb,design (qualitative)
)Load(Tamb liqref,m&
∆Pbypass=∆Pevap
vapref,m&xXV,out
(SHR)Tevap
∆Pevap
Figure 3.6 Vapor bypass system relationships (subcritical cycle)
3.7 Off-design performance of R744 system In the baseline transcritical system, saturated vapor exits the evaporator due to the presence of the low-side
receiver. In the bypass system, the receiver is moved and becomes a separator holding the evaporator inlet quality
nearly constant and letting the evaporator outlet state be determined by the liquid mass flow rate and the evaporator
heat transfer.
The transcritical cycle vapor bypass system works in a slightly different manner than the subcritical cycle.
As illustrated in Figure 3.7, ambient temperature and SHR (determining the evaporating temperature) determine the
COP optimizing discharge pressure, thus fixing the refrigerant state at the exit of the gas cooler, hence the quality at
the inlet to the separator. With the ratio of liquid and vapor flow rates fixed, and the bypass tube carrying all the
vapor, the capacity determines the liquid (hence total) refrigerant flow rate and the resulting evaporator exit state.
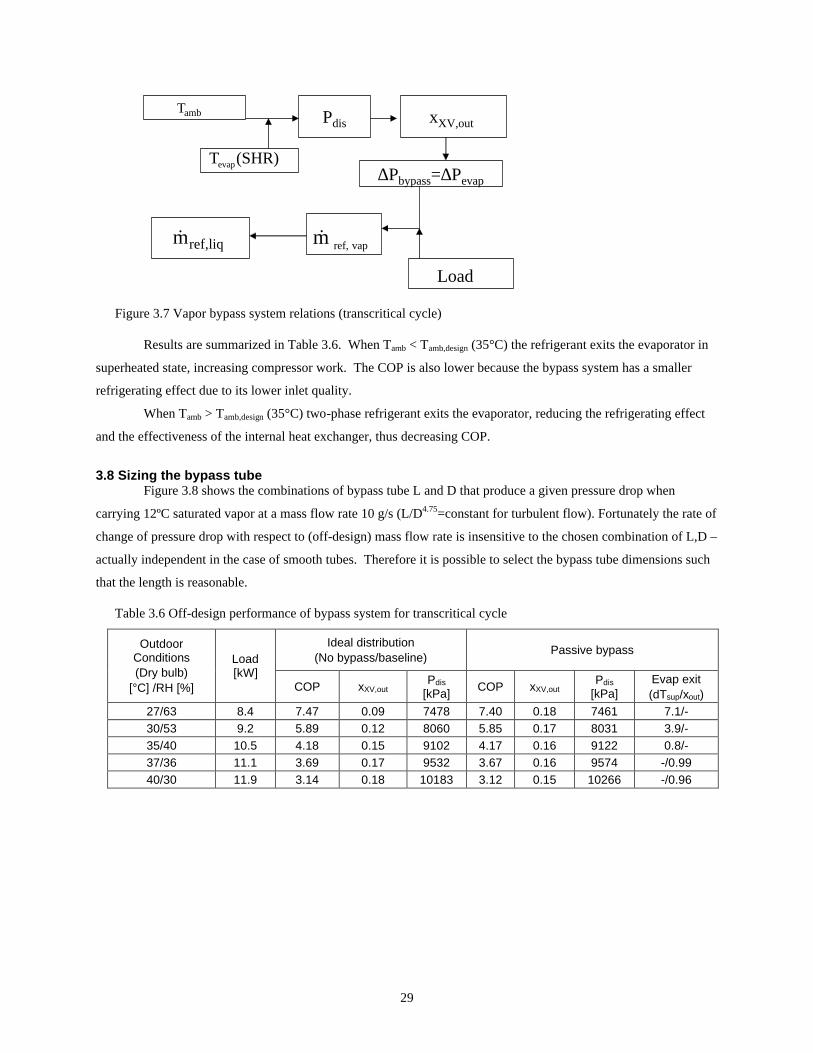
29
ambT
(SHR)Tevap∆Pbypass=∆Pevap
vapref,m&
Pdis xXV,out
liqref,m&
Load
Figure 3.7 Vapor bypass system relations (transcritical cycle)
Results are summarized in Table 3.6. When Tamb < Tamb,design (35°C) the refrigerant exits the evaporator in
superheated state, increasing compressor work. The COP is also lower because the bypass system has a smaller
refrigerating effect due to its lower inlet quality.
When Tamb > Tamb,design (35°C) two-phase refrigerant exits the evaporator, reducing the refrigerating effect
and the effectiveness of the internal heat exchanger, thus decreasing COP.
3.8 Sizing the bypass tube Figure 3.8 shows the combinations of bypass tube L and D that produce a given pressure drop when
carrying 12ºC saturated vapor at a mass flow rate 10 g/s (L/D4.75=constant for turbulent flow). Fortunately the rate of
change of pressure drop with respect to (off-design) mass flow rate is insensitive to the chosen combination of L,D –
actually independent in the case of smooth tubes. Therefore it is possible to select the bypass tube dimensions such
that the length is reasonable.
Table 3.6 Off-design performance of bypass system for transcritical cycle
Ideal distribution (No bypass/baseline)
Passive bypass Outdoor Conditions (Dry bulb)
[°C] /RH [%]
Load [kW]
COP xXV,out Pdis
[kPa] COP xXV,out Pdis
[kPa] Evap exit (dTsup/xout)
27/63 8.4 7.47 0.09 7478 7.40 0.18 7461 7.1/- 30/53 9.2 5.89 0.12 8060 5.85 0.17 8031 3.9/- 35/40 10.5 4.18 0.15 9102 4.17 0.16 9122 0.8/- 37/36 11.1 3.69 0.17 9532 3.67 0.16 9574 -/0.99 40/30 11.9 3.14 0.18 10183 3.12 0.15 10266 -/0.96
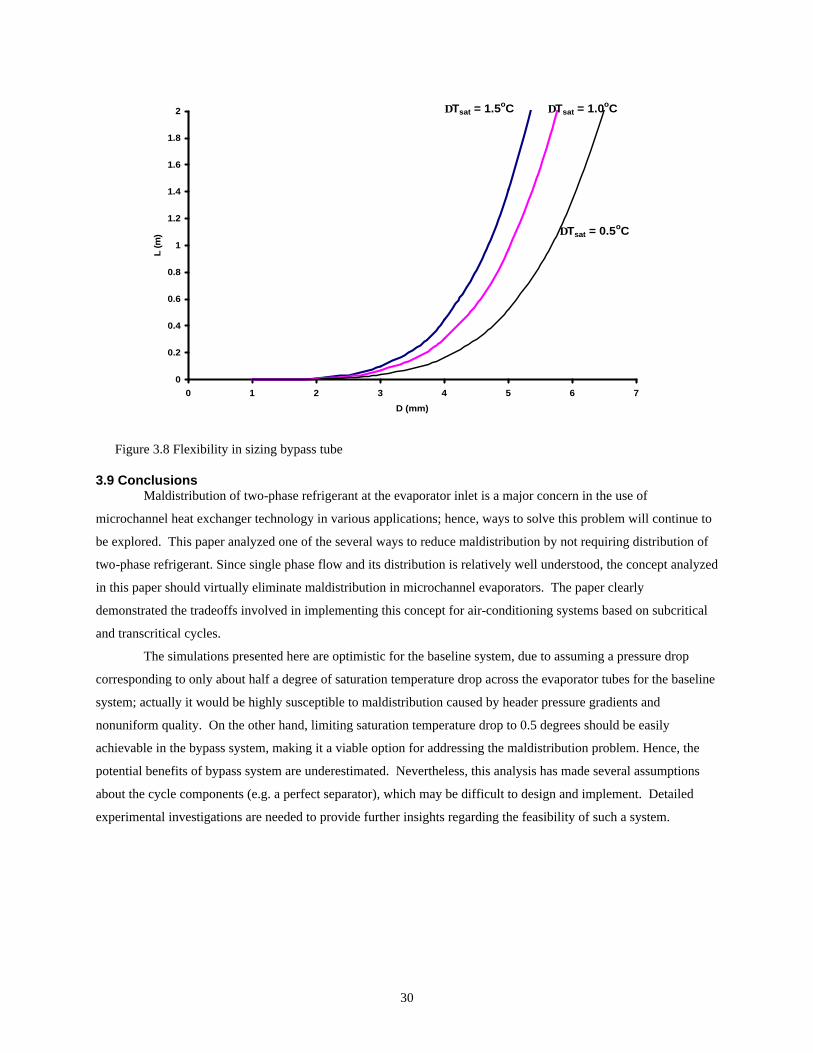
30
0
0.2
0.4
0.6
0.8
1
1.2
1.4
1.6
1.8
2
0 1 2 3 4 5 6 7
D (mm)
L (m
) ∆Tsat = 0.5oC
∆Tsat = 1.5oC ∆Tsat = 1.0oC
Figure 3.8 Flexibility in sizing bypass tube
3.9 Conclusions Maldistribution of two-phase refrigerant at the evaporator inlet is a major concern in the use of
microchannel heat exchanger technology in various applications; hence, ways to solve this problem will continue to
be explored. This paper analyzed one of the several ways to reduce maldistribution by not requiring distribution of
two-phase refrigerant. Since single phase flow and its distribution is relatively well understood, the concept analyzed
in this paper should virtually eliminate maldistribution in microchannel evaporators. The paper clearly
demonstrated the tradeoffs involved in implementing this concept for air-conditioning systems based on subcritical
and transcritical cycles.
The simulations presented here are optimistic for the baseline system, due to assuming a pressure drop
corresponding to only about half a degree of saturation temperature drop across the evaporator tubes for the baseline
system; actually it would be highly susceptible to maldistribution caused by header pressure gradients and
nonuniform quality. On the other hand, limiting saturation temperature drop to 0.5 degrees should be easily
achievable in the bypass system, making it a viable option for addressing the maldistribution problem. Hence, the
potential benefits of bypass system are underestimated. Nevertheless, this analysis has made several assumptions
about the cycle components (e.g. a perfect separator), which may be difficult to design and implement. Detailed
experimental investigations are needed to provide further insights regarding the feasibility of such a system.
31
4. Air-side tradeoffs
4.1 Introduction Having seen in great detail the impact of maldistribution on evaporator performance, refrigerant-side
tradeoffs have been explored thoroughly to find ways to minimize or eliminate maldistribution. This chapter
considers air-side tradeoffs that guide and constrain the design of microchannel heat exchangers. Since
microchannel heat exchangers for split systems will have to work both under dry and wet conditions, louver angle
and louver pitch are selected to accommodate condensate drainage. The following analysis therefore focuses on air-
side geometric parameters (fin height, fin spacing, core depth, louver length), and operating conditions (face
velocity, face area). Generally, air-side performance increases with louver length, but manufacturing considerations
rule out making unlouvered portion of the fin too small, so its value is held constant.
The next sections address these and related issues. First, most of the parameters are varied independently
and then the effect of varying several factors together is also investigated. The results are used to identify high-
performance regions of the parameter space, to guide design of the next generation of prototypes. Due to its nature,
the analysis will help designers identify only qualitative trends in selecting best coil designs.
4.2 Background For flat tubes and louvered fins, the correlations developed by Chang and Wang (1994) and (1997) have
been used to predict the air-side heat transfer coefficient and pressure drop. Although these correlations were
developed for dry coils, they were used because no general correlations are currently available from the open
literature for predicting performance of such coils under wet or frosted condition. Recent results by Kim, et al.
(2001) and (2002), Kim and Bullard (2002) show only small differences between predictions by Chang and Wang
models and wet-surface observations on heat exchangers (having similar geometry to those presented here). Kim, et
al. (2001) observed less than 10% heat transfer coefficient change and less than 25% increase in the net air-side
pressure drop due to condensate on these coils. Kim and Bullard (2002) also reported relatively small pressure drop
and heat transfer difference between dry and wet coils for louver angle (=27°) and fin density (=17 fpi), similar to
those used in the present study. Kim, et al (2002) observed that pressure drops for wet coils were only about 3-14%
larger than dry coils.
When considering air-side tradeoffs in microchannel heat exchangers, the refrigerant side is relatively
unimportant. The authors had to choose between R744 and R410A. R744 was chosen because of the following
reasons:
• Use of microchannel heat exchangers is necessary when using R744, because of its high operating pressure. R410A-based a/c systems do not necessarily have to use microchannel heat exchangers.
• More data are available on refrigerant-side heat transfer and pressure drop of R744 than for R410A. The latest R744 data and comparisons to published correlations are summarized by Pettersen (2003) for microchannel evaporators very similar to the geometry and operating conditions existing in the present analysis. For R410A, significant extrapolation would be required to apply the correlations currently in the open literature (Wattelet, et al, 1994; Zhang and Kwon, 1999).
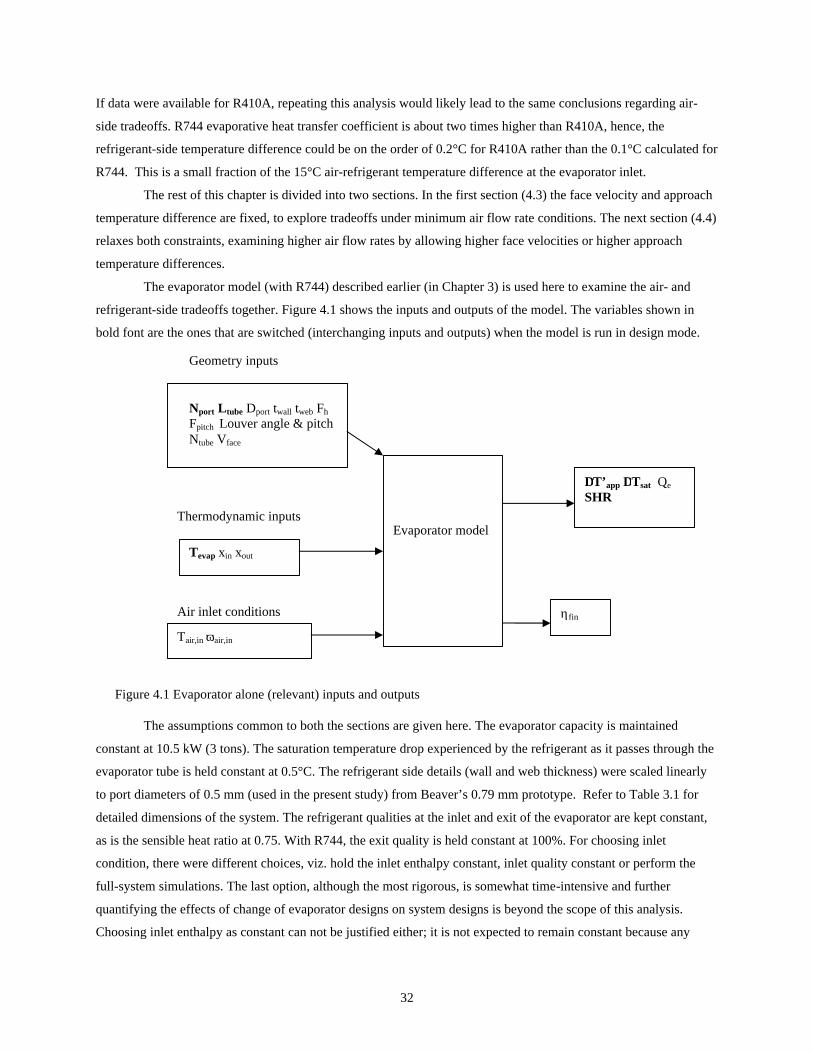
32
If data were available for R410A, repeating this analysis would likely lead to the same conclusions regarding air-
side tradeoffs. R744 evaporative heat transfer coefficient is about two times higher than R410A, hence, the
refrigerant-side temperature difference could be on the order of 0.2°C for R410A rather than the 0.1°C calculated for
R744. This is a small fraction of the 15°C air-refrigerant temperature difference at the evaporator inlet.
The rest of this chapter is divided into two sections. In the first section (4.3) the face velocity and approach
temperature difference are fixed, to explore tradeoffs under minimum air flow rate conditions. The next section (4.4)
relaxes both constraints, examining higher air flow rates by allowing higher face velocities or higher approach
temperature differences.
The evaporator model (with R744) described earlier (in Chapter 3) is used here to examine the air- and
refrigerant-side tradeoffs together. Figure 4.1 shows the inputs and outputs of the model. The variables shown in
bold font are the ones that are switched (interchanging inputs and outputs) when the model is run in design mode.
Figure 4.1 Evaporator alone (relevant) inputs and outputs
The assumptions common to both the sections are given here. The evaporator capacity is maintained
constant at 10.5 kW (3 tons). The saturation temperature drop experienced by the refrigerant as it passes through the
evaporator tube is held constant at 0.5°C. The refrigerant side details (wall and web thickness) were scaled linearly
to port diameters of 0.5 mm (used in the present study) from Beaver’s 0.79 mm prototype. Refer to Table 3.1 for
detailed dimensions of the system. The refrigerant qualities at the inlet and exit of the evaporator are kept constant,
as is the sensible heat ratio at 0.75. With R744, the exit quality is held constant at 100%. For choosing inlet
condition, there were different choices, viz. hold the inlet enthalpy constant, inlet quality constant or perform the
full-system simulations. The last option, although the most rigorous, is somewhat time-intensive and further
quantifying the effects of change of evaporator designs on system designs is beyond the scope of this analysis.
Choosing inlet enthalpy as constant can not be justified either; it is not expected to remain constant because any
Geometry inputs
Nport Ltube Dport twall tweb Fh Fpitch Louver angle & pitch Ntube Vface
Thermodynamic inputs
Tevap xin xout
Air inlet conditions
Tair,in ωair,in
ηfin
Evaporator model
∆T’app ∆Tsat Qe SHR
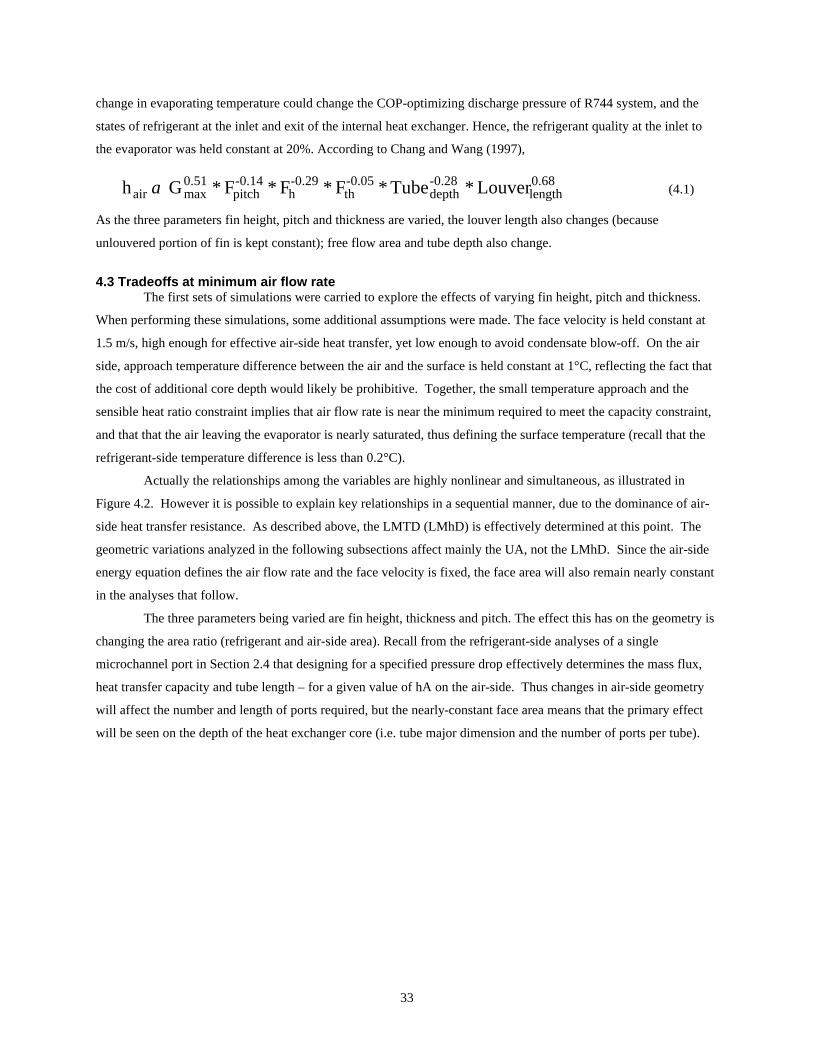
33
change in evaporating temperature could change the COP-optimizing discharge pressure of R744 system, and the
states of refrigerant at the inlet and exit of the internal heat exchanger. Hence, the refrigerant quality at the inlet to
the evaporator was held constant at 20%. According to Chang and Wang (1997),
0.68length
-0.28depth
-0.05th
-0.29h
-0.14pitch
0.51maxair Louver*Tube*F*F*F*G h α (4.1)
As the three parameters fin height, pitch and thickness are varied, the louver length also changes (because
unlouvered portion of fin is kept constant); free flow area and tube depth also change.
4.3 Tradeoffs at minimum air flow rate The first sets of simulations were carried to explore the effects of varying fin height, pitch and thickness.
When performing these simulations, some additional assumptions were made. The face velocity is held constant at
1.5 m/s, high enough for effective air-side heat transfer, yet low enough to avoid condensate blow-off. On the air
side, approach temperature difference between the air and the surface is held constant at 1°C, reflecting the fact that
the cost of additional core depth would likely be prohibitive. Together, the small temperature approach and the
sensible heat ratio constraint implies that air flow rate is near the minimum required to meet the capacity constraint,
and that that the air leaving the evaporator is nearly saturated, thus defining the surface temperature (recall that the
refrigerant-side temperature difference is less than 0.2°C).
Actually the relationships among the variables are highly nonlinear and simultaneous, as illustrated in
Figure 4.2. However it is possible to explain key relationships in a sequential manner, due to the dominance of air-
side heat transfer resistance. As described above, the LMTD (LMhD) is effectively determined at this point. The
geometric variations analyzed in the following subsections affect mainly the UA, not the LMhD. Since the air-side
energy equation defines the air flow rate and the face velocity is fixed, the face area will also remain nearly constant
in the analyses that follow.
The three parameters being varied are fin height, thickness and pitch. The effect this has on the geometry is
changing the area ratio (refrigerant and air-side area). Recall from the refrigerant-side analyses of a single
microchannel port in Section 2.4 that designing for a specified pressure drop effectively determines the mass flux,
heat transfer capacity and tube length – for a given value of hA on the air-side. Thus changes in air-side geometry
will affect the number and length of ports required, but the nearly-constant face area means that the primary effect
will be seen on the depth of the heat exchanger core (i.e. tube major dimension and the number of ports per tube).
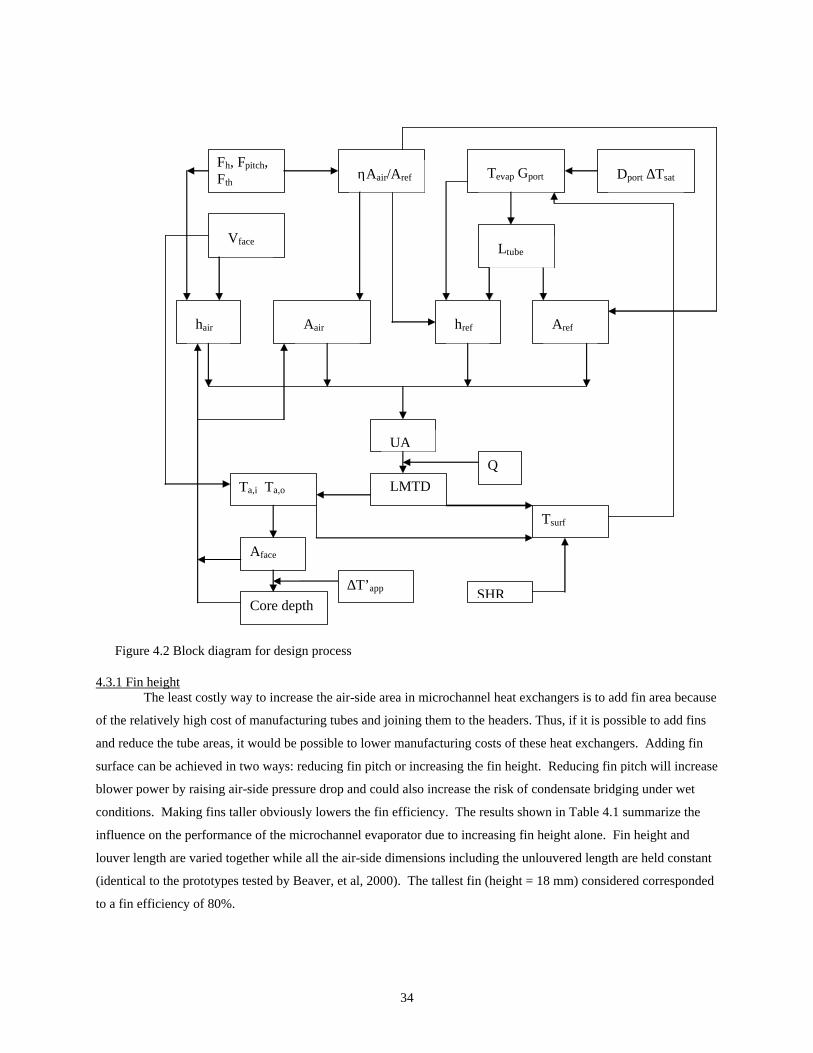
34
Fh, Fpitch, Fth ηAair/Aref
Vface
Dport ∆Tsat Tevap Gport
Ltube
href Aref hair Aair
UA
LMTD Q
Ta,i Ta,o
Aface
Core depth ∆T’app SHR
Tsurf
Figure 4.2 Block diagram for design process
4.3.1 Fin height The least costly way to increase the air-side area in microchannel heat exchangers is to add fin area because
of the relatively high cost of manufacturing tubes and joining them to the headers. Thus, if it is possible to add fins
and reduce the tube areas, it would be possible to lower manufacturing costs of these heat exchangers. Adding fin
surface can be achieved in two ways: reducing fin pitch or increasing the fin height. Reducing fin pitch will increase
blower power by raising air-side pressure drop and could also increase the risk of condensate bridging under wet
conditions. Making fins taller obviously lowers the fin efficiency. The results shown in Table 4.1 summarize the
influence on the performance of the microchannel evaporator due to increasing fin height alone. Fin height and
louver length are varied together while all the air-side dimensions including the unlouvered length are held constant
(identical to the prototypes tested by Beaver, et al, 2000). The tallest fin (height = 18 mm) considered corresponded
to a fin efficiency of 80%.
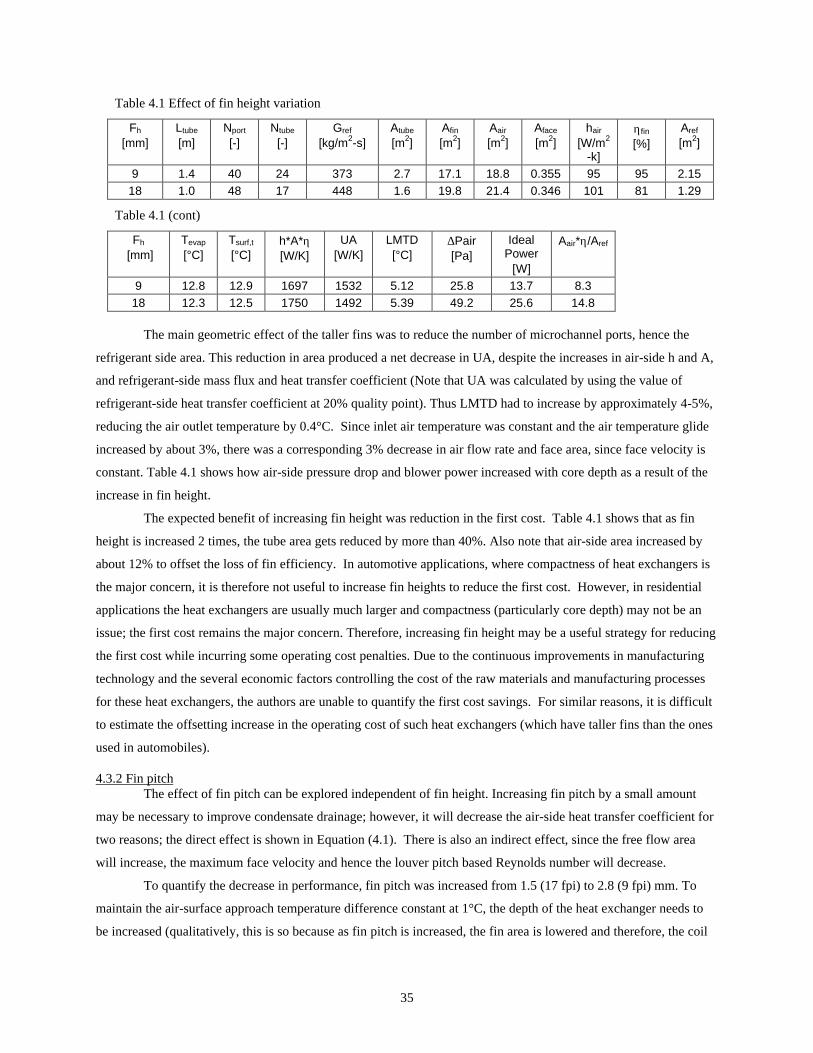
35
Table 4.1 Effect of fin height variation
Fh [mm]
Ltube [m]
Nport [-]
Ntube [-]
Gref [kg/m2-s]
Atube
[m2] Afin [m2]
Aair [m2]
Aface
[m2] hair
[W/m2
-k]
ηfin [%]
Aref
[m2]
9 1.4 40 24 373 2.7 17.1 18.8 0.355 95 95 2.15 18 1.0 48 17 448 1.6 19.8 21.4 0.346 101 81 1.29
Table 4.1 (cont)
Fh [mm]
Tevap [°C]
Tsurf,t
[°C] h*A*η [W/K]
UA [W/K]
LMTD [°C]
∆Pair [Pa]
Ideal Power
[W]
Aair*η/Aref
9 12.8 12.9 1697 1532 5.12 25.8 13.7 8.3 18 12.3 12.5 1750 1492 5.39 49.2 25.6 14.8
The main geometric effect of the taller fins was to reduce the number of microchannel ports, hence the
refrigerant side area. This reduction in area produced a net decrease in UA, despite the increases in air-side h and A,
and refrigerant-side mass flux and heat transfer coefficient (Note that UA was calculated by using the value of
refrigerant-side heat transfer coefficient at 20% quality point). Thus LMTD had to increase by approximately 4-5%,
reducing the air outlet temperature by 0.4°C. Since inlet air temperature was constant and the air temperature glide
increased by about 3%, there was a corresponding 3% decrease in air flow rate and face area, since face velocity is
constant. Table 4.1 shows how air-side pressure drop and blower power increased with core depth as a result of the
increase in fin height.
The expected benefit of increasing fin height was reduction in the first cost. Table 4.1 shows that as fin
height is increased 2 times, the tube area gets reduced by more than 40%. Also note that air-side area increased by
about 12% to offset the loss of fin efficiency. In automotive applications, where compactness of heat exchangers is
the major concern, it is therefore not useful to increase fin heights to reduce the first cost. However, in residential
applications the heat exchangers are usually much larger and compactness (particularly core depth) may not be an
issue; the first cost remains the major concern. Therefore, increasing fin height may be a useful strategy for reducing
the first cost while incurring some operating cost penalties. Due to the continuous improvements in manufacturing
technology and the several economic factors controlling the cost of the raw materials and manufacturing processes
for these heat exchangers, the authors are unable to quantify the first cost savings. For similar reasons, it is difficult
to estimate the offsetting increase in the operating cost of such heat exchangers (which have taller fins than the ones
used in automobiles).
4.3.2 Fin pitch The effect of fin pitch can be explored independent of fin height. Increasing fin pitch by a small amount
may be necessary to improve condensate drainage; however, it will decrease the air-side heat transfer coefficient for
two reasons; the direct effect is shown in Equation (4.1). There is also an indirect effect, since the free flow area
will increase, the maximum face velocity and hence the louver pitch based Reynolds number will decrease.
To quantify the decrease in performance, fin pitch was increased from 1.5 (17 fpi) to 2.8 (9 fpi) mm. To
maintain the air-surface approach temperature difference constant at 1°C, the depth of the heat exchanger needs to
be increased (qualitatively, this is so because as fin pitch is increased, the fin area is lowered and therefore, the coil
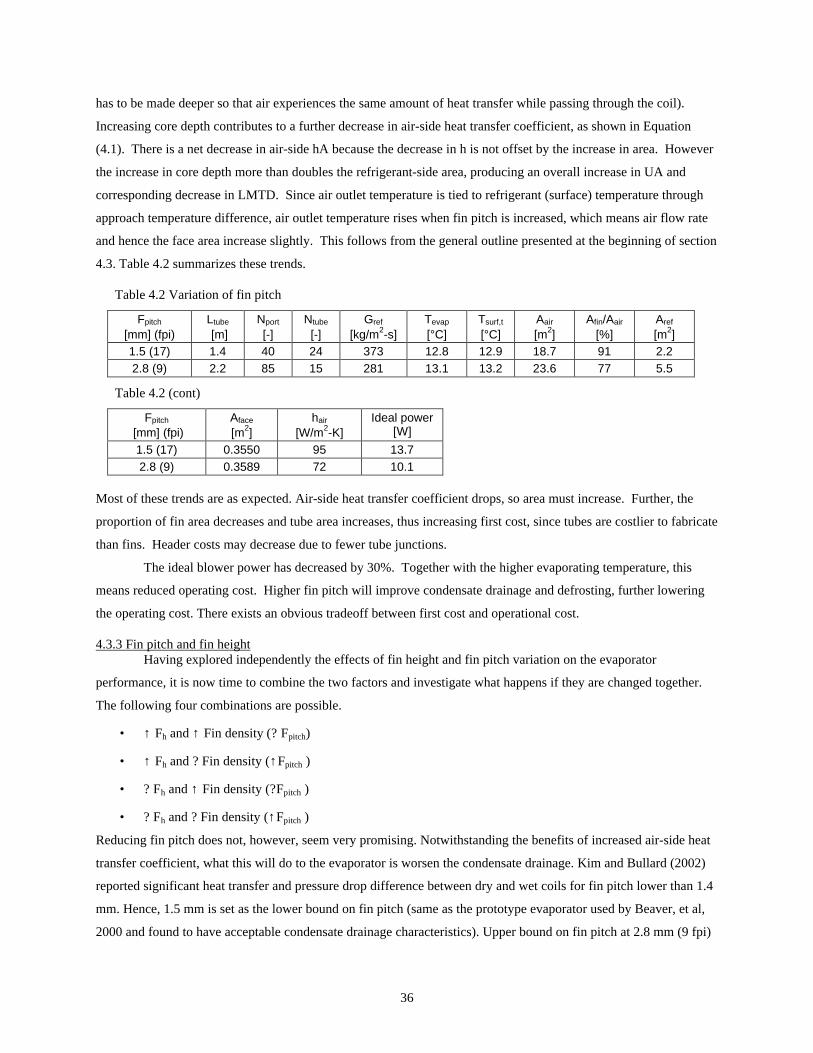
36
has to be made deeper so that air experiences the same amount of heat transfer while passing through the coil).
Increasing core depth contributes to a further decrease in air-side heat transfer coefficient, as shown in Equation
(4.1). There is a net decrease in air-side hA because the decrease in h is not offset by the increase in area. However
the increase in core depth more than doubles the refrigerant-side area, producing an overall increase in UA and
corresponding decrease in LMTD. Since air outlet temperature is tied to refrigerant (surface) temperature through
approach temperature difference, air outlet temperature rises when fin pitch is increased, which means air flow rate
and hence the face area increase slightly. This follows from the general outline presented at the beginning of section
4.3. Table 4.2 summarizes these trends.
Table 4.2 Variation of fin pitch
Fpitch [mm] (fpi)
Ltube [m]
Nport [-]
Ntube [-]
Gref [kg/m2-s]
Tevap [°C]
Tsurf,t
[°C] Aair [m2]
Afin/Aair [%]
Aref [m2]
1.5 (17) 1.4 40 24 373 12.8 12.9 18.7 91 2.2 2.8 (9) 2.2 85 15 281 13.1 13.2 23.6 77 5.5
Table 4.2 (cont)
Fpitch [mm] (fpi)
Aface [m2]
hair [W/m2-K]
Ideal power [W]
1.5 (17) 0.3550 95 13.7 2.8 (9) 0.3589 72 10.1
Most of these trends are as expected. Air-side heat transfer coefficient drops, so area must increase. Further, the
proportion of fin area decreases and tube area increases, thus increasing first cost, since tubes are costlier to fabricate
than fins. Header costs may decrease due to fewer tube junctions.
The ideal blower power has decreased by 30%. Together with the higher evaporating temperature, this
means reduced operating cost. Higher fin pitch will improve condensate drainage and defrosting, further lowering
the operating cost. There exists an obvious tradeoff between first cost and operational cost.
4.3.3 Fin pitch and fin height Having explored independently the effects of fin height and fin pitch variation on the evaporator
performance, it is now time to combine the two factors and investigate what happens if they are changed together.
The following four combinations are possible.
• ↑ Fh and ↑ Fin density (? Fpitch)
• ↑ Fh and ? Fin density (↑Fpitch )
• ? Fh and ↑ Fin density (?Fpitch )
• ? Fh and ? Fin density (↑Fpitch )
Reducing fin pitch does not, however, seem very promising. Notwithstanding the benefits of increased air-side heat
transfer coefficient, what this will do to the evaporator is worsen the condensate drainage. Kim and Bullard (2002)
reported significant heat transfer and pressure drop difference between dry and wet coils for fin pitch lower than 1.4
mm. Hence, 1.5 mm is set as the lower bound on fin pitch (same as the prototype evaporator used by Beaver, et al,
2000 and found to have acceptable condensate drainage characteristics). Upper bound on fin pitch at 2.8 mm (9 fpi)
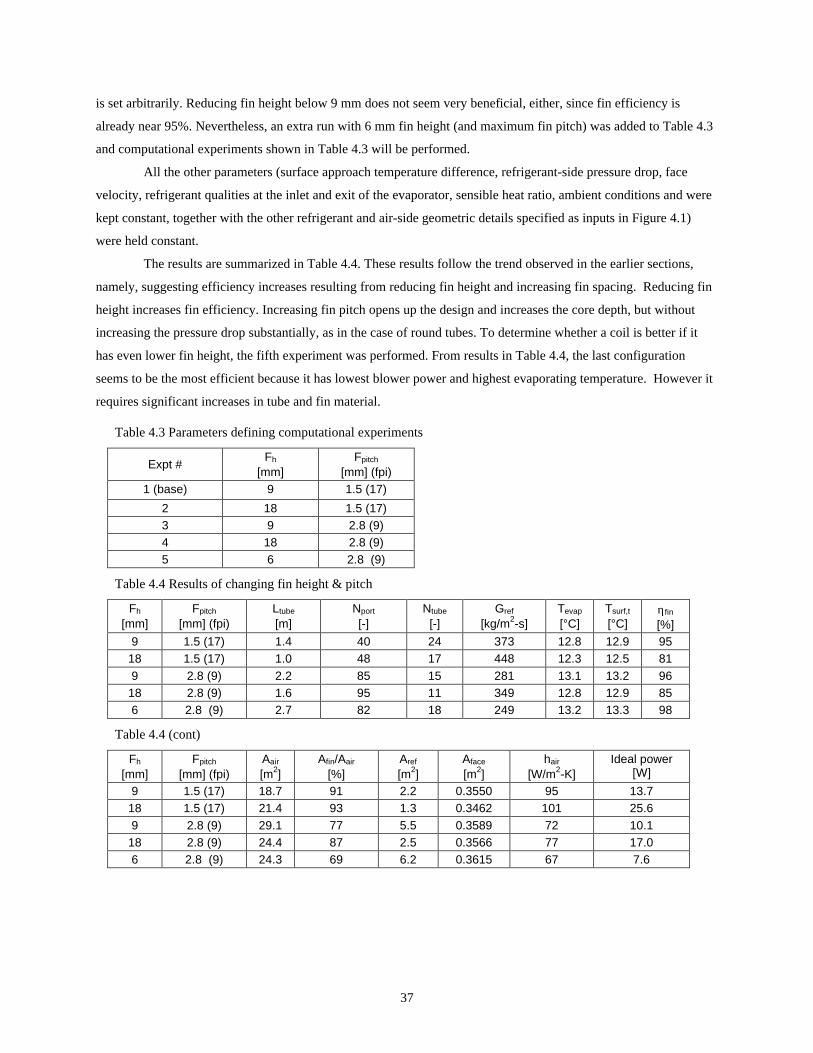
37
is set arbitrarily. Reducing fin height below 9 mm does not seem very beneficial, either, since fin efficiency is
already near 95%. Nevertheless, an extra run with 6 mm fin height (and maximum fin pitch) was added to Table 4.3
and computational experiments shown in Table 4.3 will be performed.
All the other parameters (surface approach temperature difference, refrigerant-side pressure drop, face
velocity, refrigerant qualities at the inlet and exit of the evaporator, sensible heat ratio, ambient conditions and were
kept constant, together with the other refrigerant and air-side geometric details specified as inputs in Figure 4.1)
were held constant.
The results are summarized in Table 4.4. These results follow the trend observed in the earlier sections,
namely, suggesting efficiency increases resulting from reducing fin height and increasing fin spacing. Reducing fin
height increases fin efficiency. Increasing fin pitch opens up the design and increases the core depth, but without
increasing the pressure drop substantially, as in the case of round tubes. To determine whether a coil is better if it
has even lower fin height, the fifth experiment was performed. From results in Table 4.4, the last configuration
seems to be the most efficient because it has lowest blower power and highest evaporating temperature. However it
requires significant increases in tube and fin material.
Table 4.3 Parameters defining computational experiments
Expt # Fh
[mm] Fpitch
[mm] (fpi) 1 (base) 9 1.5 (17)
2 18 1.5 (17) 3 9 2.8 (9) 4 18 2.8 (9) 5 6 2.8 (9)
Table 4.4 Results of changing fin height & pitch
Fh [mm]
Fpitch [mm] (fpi)
Ltube [m]
Nport [-]
Ntube [-]
Gref [kg/m2-s]
Tevap [°C]
Tsurf,t
[°C] ηfin [%]
9 1.5 (17) 1.4 40 24 373 12.8 12.9 95 18 1.5 (17) 1.0 48 17 448 12.3 12.5 81 9 2.8 (9) 2.2 85 15 281 13.1 13.2 96
18 2.8 (9) 1.6 95 11 349 12.8 12.9 85 6 2.8 (9) 2.7 82 18 249 13.2 13.3 98
Table 4.4 (cont)
Fh [mm]
Fpitch [mm] (fpi)
Aair [m2]
Afin/Aair [%]
Aref [m2]
Aface [m2]
hair [W/m2-K]
Ideal power [W]
9 1.5 (17) 18.7 91 2.2 0.3550 95 13.7 18 1.5 (17) 21.4 93 1.3 0.3462 101 25.6 9 2.8 (9) 29.1 77 5.5 0.3589 72 10.1
18 2.8 (9) 24.4 87 2.5 0.3566 77 17.0 6 2.8 (9) 24.3 69 6.2 0.3615 67 7.6
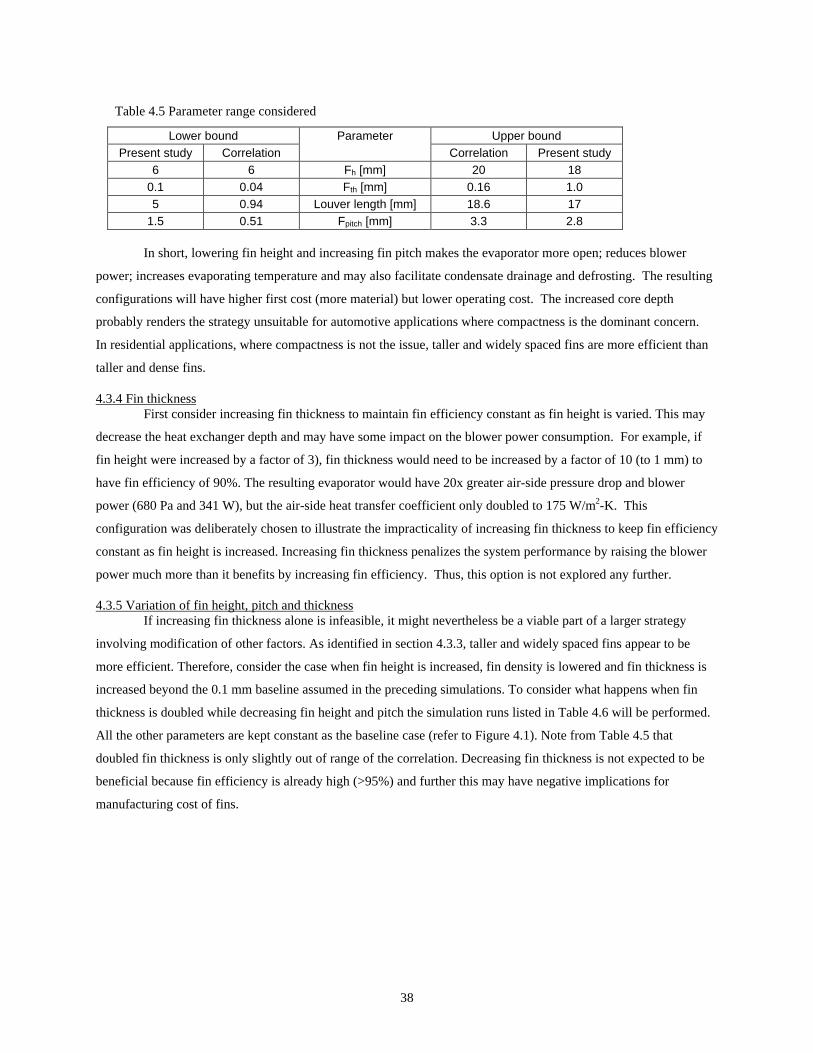
38
Table 4.5 Parameter range considered
Lower bound Upper bound Present study Correlation
Parameter Correlation Present study
6 6 Fh [mm] 20 18 0.1 0.04 Fth [mm] 0.16 1.0 5 0.94 Louver length [mm] 18.6 17
1.5 0.51 Fpitch [mm] 3.3 2.8
In short, lowering fin height and increasing fin pitch makes the evaporator more open; reduces blower
power; increases evaporating temperature and may also facilitate condensate drainage and defrosting. The resulting
configurations will have higher first cost (more material) but lower operating cost. The increased core depth
probably renders the strategy unsuitable for automotive applications where compactness is the dominant concern.
In residential applications, where compactness is not the issue, taller and widely spaced fins are more efficient than
taller and dense fins.
4.3.4 Fin thickness First consider increasing fin thickness to maintain fin efficiency constant as fin height is varied. This may
decrease the heat exchanger depth and may have some impact on the blower power consumption. For example, if
fin height were increased by a factor of 3), fin thickness would need to be increased by a factor of 10 (to 1 mm) to
have fin efficiency of 90%. The resulting evaporator would have 20x greater air-side pressure drop and blower
power (680 Pa and 341 W), but the air-side heat transfer coefficient only doubled to 175 W/m2-K. This
configuration was deliberately chosen to illustrate the impracticality of increasing fin thickness to keep fin efficiency
constant as fin height is increased. Increasing fin thickness penalizes the system performance by raising the blower
power much more than it benefits by increasing fin efficiency. Thus, this option is not explored any further.
4.3.5 Variation of fin height, pitch and thickness If increasing fin thickness alone is infeasible, it might nevertheless be a viable part of a larger strategy
involving modification of other factors. As identified in section 4.3.3, taller and widely spaced fins appear to be
more efficient. Therefore, consider the case when fin height is increased, fin density is lowered and fin thickness is
increased beyond the 0.1 mm baseline assumed in the preceding simulations. To consider what happens when fin
thickness is doubled while decreasing fin height and pitch the simulation runs listed in Table 4.6 will be performed.
All the other parameters are kept constant as the baseline case (refer to Figure 4.1). Note from Table 4.5 that
doubled fin thickness is only slightly out of range of the correlation. Decreasing fin thickness is not expected to be
beneficial because fin efficiency is already high (>95%) and further this may have negative implications for
manufacturing cost of fins.
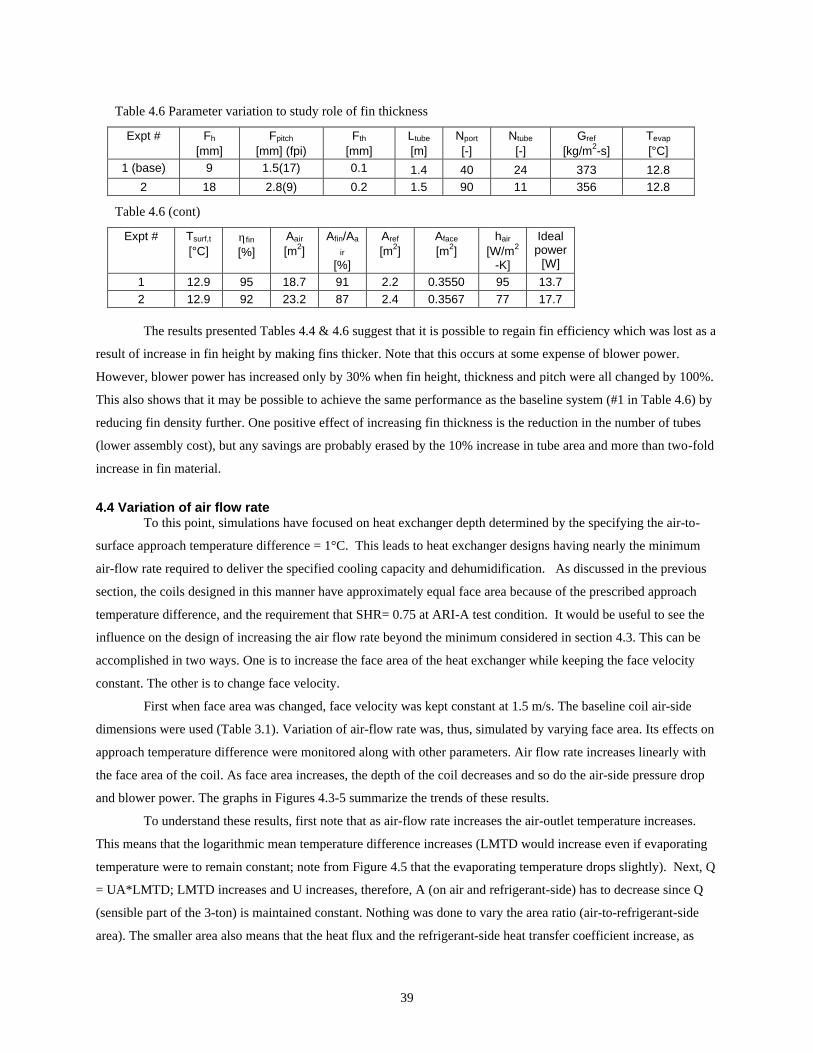
39
Table 4.6 Parameter variation to study role of fin thickness
Expt # Fh [mm]
Fpitch [mm] (fpi)
Fth
[mm] Ltube [m]
Nport [-]
Ntube [-]
Gref [kg/m2-s]
Tevap [°C]
1 (base) 9 1.5(17) 0.1 1.4 40 24 373 12.8 2 18 2.8(9) 0.2 1.5 90 11 356 12.8
Table 4.6 (cont)
Expt # Tsurf,t
[°C] ηfin [%]
Aair [m2]
Afin/Aa
ir [%]
Aref [m2]
Aface [m2]
hair [W/m2
-K]
Ideal power
[W]
1 12.9 95 18.7 91 2.2 0.3550 95 13.7 2 12.9 92 23.2 87 2.4 0.3567 77 17.7
The results presented Tables 4.4 & 4.6 suggest that it is possible to regain fin efficiency which was lost as a
result of increase in fin height by making fins thicker. Note that this occurs at some expense of blower power.
However, blower power has increased only by 30% when fin height, thickness and pitch were all changed by 100%.
This also shows that it may be possible to achieve the same performance as the baseline system (#1 in Table 4.6) by
reducing fin density further. One positive effect of increasing fin thickness is the reduction in the number of tubes
(lower assembly cost), but any savings are probably erased by the 10% increase in tube area and more than two-fold
increase in fin material.
4.4 Variation of air flow rate To this point, simulations have focused on heat exchanger depth determined by the specifying the air-to-
surface approach temperature difference = 1°C. This leads to heat exchanger designs having nearly the minimum
air-flow rate required to deliver the specified cooling capacity and dehumidification. As discussed in the previous
section, the coils designed in this manner have approximately equal face area because of the prescribed approach
temperature difference, and the requirement that SHR= 0.75 at ARI-A test condition. It would be useful to see the
influence on the design of increasing the air flow rate beyond the minimum considered in section 4.3. This can be
accomplished in two ways. One is to increase the face area of the heat exchanger while keeping the face velocity
constant. The other is to change face velocity.
First when face area was changed, face velocity was kept constant at 1.5 m/s. The baseline coil air-side
dimensions were used (Table 3.1). Variation of air-flow rate was, thus, simulated by varying face area. Its effects on
approach temperature difference were monitored along with other parameters. Air flow rate increases linearly with
the face area of the coil. As face area increases, the depth of the coil decreases and so do the air-side pressure drop
and blower power. The graphs in Figures 4.3-5 summarize the trends of these results.
To understand these results, first note that as air-flow rate increases the air-outlet temperature increases.
This means that the logarithmic mean temperature difference increases (LMTD would increase even if evaporating
temperature were to remain constant; note from Figure 4.5 that the evaporating temperature drops slightly). Next, Q
= UA*LMTD; LMTD increases and U increases, therefore, A (on air and refrigerant-side) has to decrease since Q
(sensible part of the 3-ton) is maintained constant. Nothing was done to vary the area ratio (air-to-refrigerant-side
area). The smaller area also means that the heat flux and the refrigerant-side heat transfer coefficient increase, as
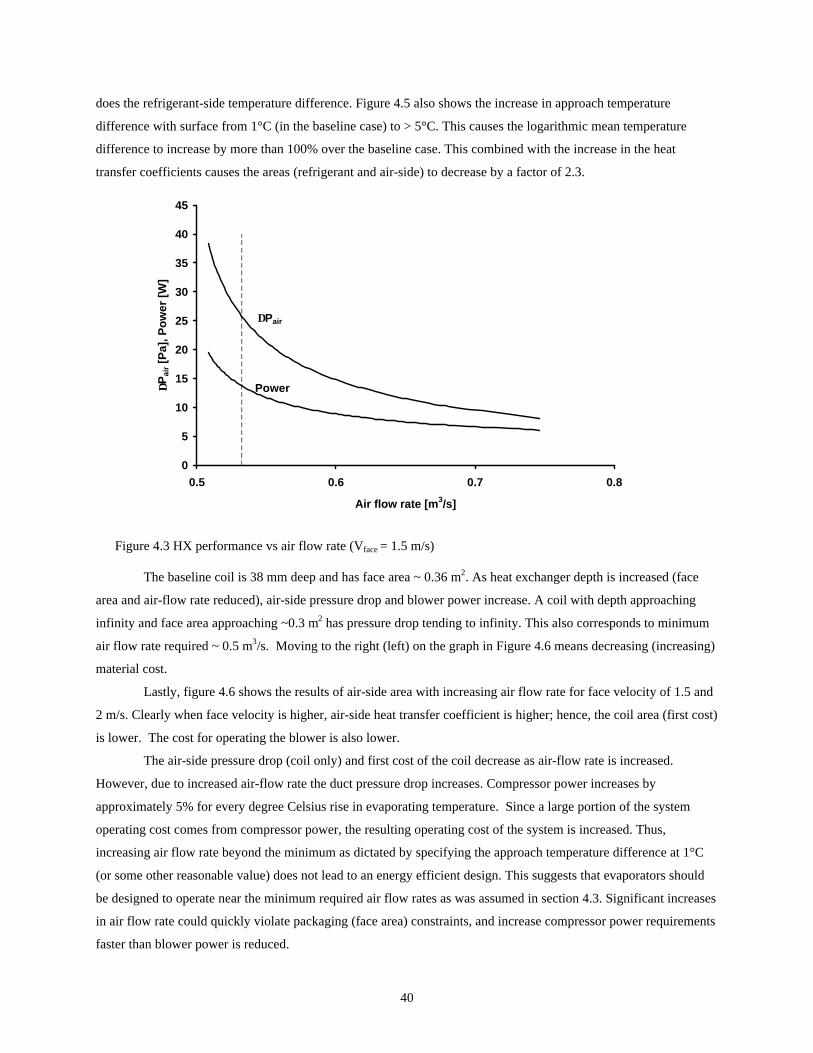
40
does the refrigerant-side temperature difference. Figure 4.5 also shows the increase in approach temperature
difference with surface from 1°C (in the baseline case) to > 5°C. This causes the logarithmic mean temperature
difference to increase by more than 100% over the baseline case. This combined with the increase in the heat
transfer coefficients causes the areas (refrigerant and air-side) to decrease by a factor of 2.3.
0
5
10
15
20
25
30
35
40
45
0.5 0.6 0.7 0.8
Air flow rate [m3/s]
∆Pai
r [P
a], P
ow
er [
W]
∆Pair
Power
Figure 4.3 HX performance vs air flow rate (Vface = 1.5 m/s)
The baseline coil is 38 mm deep and has face area ~ 0.36 m2. As heat exchanger depth is increased (face
area and air-flow rate reduced), air-side pressure drop and blower power increase. A coil with depth approaching
infinity and face area approaching ~0.3 m2 has pressure drop tending to infinity. This also corresponds to minimum
air flow rate required ~ 0.5 m3/s. Moving to the right (left) on the graph in Figure 4.6 means decreasing (increasing)
material cost.
Lastly, figure 4.6 shows the results of air-side area with increasing air flow rate for face velocity of 1.5 and
2 m/s. Clearly when face velocity is higher, air-side heat transfer coefficient is higher; hence, the coil area (first cost)
is lower. The cost for operating the blower is also lower.
The air-side pressure drop (coil only) and first cost of the coil decrease as air-flow rate is increased.
However, due to increased air-flow rate the duct pressure drop increases. Compressor power increases by
approximately 5% for every degree Celsius rise in evaporating temperature. Since a large portion of the system
operating cost comes from compressor power, the resulting operating cost of the system is increased. Thus,
increasing air flow rate beyond the minimum as dictated by specifying the approach temperature difference at 1°C
(or some other reasonable value) does not lead to an energy efficient design. This suggests that evaporators should
be designed to operate near the minimum required air flow rates as was assumed in section 4.3. Significant increases
in air flow rate could quickly violate packaging (face area) constraints, and increase compressor power requirements
faster than blower power is reduced.

41
0
5
10
15
20
25
30
0.5 0.6 0.7 0.8
Air flow rate [m3/s]
Are
a [m
2 ]
Aair
Aref
Figure 4.4 Air side area drops due to rising air flow rate (Vface = 1.5 m/s)
0
2
4
6
8
10
12
14
16
0.5 0.6 0.7 0.8
Air flow rate [m3/s]
Tem
per
atu
re [o C
]
∆T'app
Tevap
Figure 4.5 Evaporating and approach temperature difference vs air flow rate (Vface = 1.5 m/s)
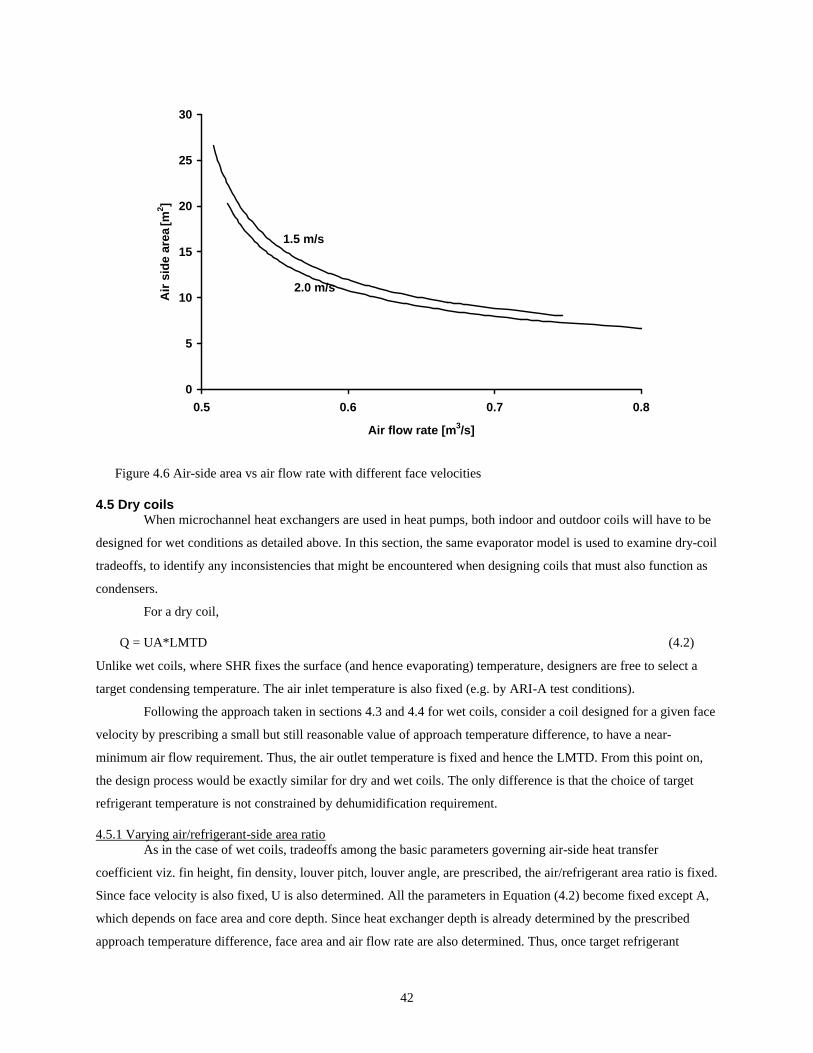
42
0
5
10
15
20
25
30
0.5 0.6 0.7 0.8
Air flow rate [m3/s]
Air
sid
e ar
ea [m
2 ]
1.5 m/s
2.0 m/s
Figure 4.6 Air-side area vs air flow rate with different face velocities
4.5 Dry coils When microchannel heat exchangers are used in heat pumps, both indoor and outdoor coils will have to be
designed for wet conditions as detailed above. In this section, the same evaporator model is used to examine dry-coil
tradeoffs, to identify any inconsistencies that might be encountered when designing coils that must also function as
condensers.
For a dry coil,
Q = UA*LMTD (4.2)
Unlike wet coils, where SHR fixes the surface (and hence evaporating) temperature, designers are free to select a
target condensing temperature. The air inlet temperature is also fixed (e.g. by ARI-A test conditions).
Following the approach taken in sections 4.3 and 4.4 for wet coils, consider a coil designed for a given face
velocity by prescribing a small but still reasonable value of approach temperature difference, to have a near-
minimum air flow requirement. Thus, the air outlet temperature is fixed and hence the LMTD. From this point on,
the design process would be exactly similar for dry and wet coils. The only difference is that the choice of target
refrigerant temperature is not constrained by dehumidification requirement.
4.5.1 Varying air/refrigerant-side area ratio As in the case of wet coils, tradeoffs among the basic parameters governing air-side heat transfer
coefficient viz. fin height, fin density, louver pitch, louver angle, are prescribed, the air/refrigerant area ratio is fixed.
Since face velocity is also fixed, U is also determined. All the parameters in Equation (4.2) become fixed except A,
which depends on face area and core depth. Since heat exchanger depth is already determined by the prescribed
approach temperature difference, face area and air flow rate are also determined. Thus, once target refrigerant
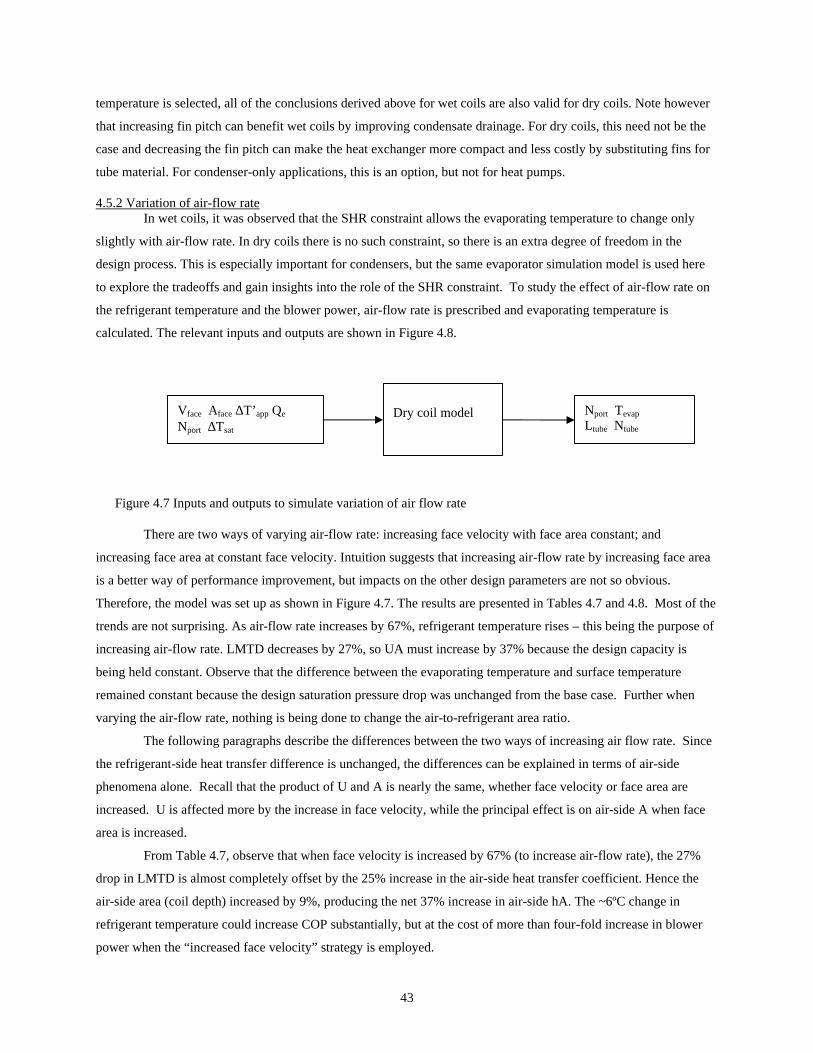
43
temperature is selected, all of the conclusions derived above for wet coils are also valid for dry coils. Note however
that increasing fin pitch can benefit wet coils by improving condensate drainage. For dry coils, this need not be the
case and decreasing the fin pitch can make the heat exchanger more compact and less costly by substituting fins for
tube material. For condenser-only applications, this is an option, but not for heat pumps.
4.5.2 Variation of air-flow rate In wet coils, it was observed that the SHR constraint allows the evaporating temperature to change only
slightly with air-flow rate. In dry coils there is no such constraint, so there is an extra degree of freedom in the
design process. This is especially important for condensers, but the same evaporator simulation model is used here
to explore the tradeoffs and gain insights into the role of the SHR constraint. To study the effect of air-flow rate on
the refrigerant temperature and the blower power, air-flow rate is prescribed and evaporating temperature is
calculated. The relevant inputs and outputs are shown in Figure 4.8.
Figure 4.7 Inputs and outputs to simulate variation of air flow rate
There are two ways of varying air-flow rate: increasing face velocity with face area constant; and
increasing face area at constant face velocity. Intuition suggests that increasing air-flow rate by increasing face area
is a better way of performance improvement, but impacts on the other design parameters are not so obvious.
Therefore, the model was set up as shown in Figure 4.7. The results are presented in Tables 4.7 and 4.8. Most of the
trends are not surprising. As air-flow rate increases by 67%, refrigerant temperature rises – this being the purpose of
increasing air-flow rate. LMTD decreases by 27%, so UA must increase by 37% because the design capacity is
being held constant. Observe that the difference between the evaporating temperature and surface temperature
remained constant because the design saturation pressure drop was unchanged from the base case. Further when
varying the air-flow rate, nothing is being done to change the air-to-refrigerant area ratio.
The following paragraphs describe the differences between the two ways of increasing air flow rate. Since
the refrigerant-side heat transfer difference is unchanged, the differences can be explained in terms of air-side
phenomena alone. Recall that the product of U and A is nearly the same, whether face velocity or face area are
increased. U is affected more by the increase in face velocity, while the principal effect is on air-side A when face
area is increased.
From Table 4.7, observe that when face velocity is increased by 67% (to increase air-flow rate), the 27%
drop in LMTD is almost completely offset by the 25% increase in the air-side heat transfer coefficient. Hence the
air-side area (coil depth) increased by 9%, producing the net 37% increase in air-side hA. The ~6ºC change in
refrigerant temperature could increase COP substantially, but at the cost of more than four-fold increase in blower
power when the “increased face velocity” strategy is employed.
Vface Αface ∆T’app Qe
Nport ∆Tsat
Dry coil model Nport Tevap
Ltube Ntube
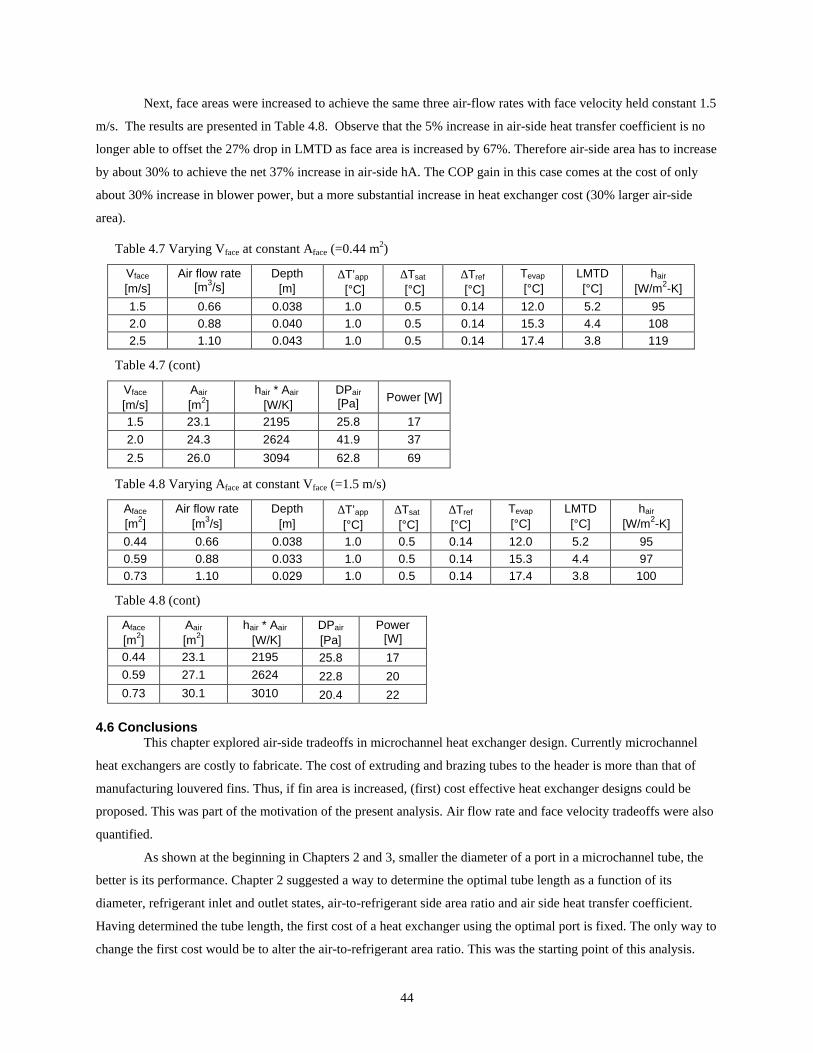
44
Next, face areas were increased to achieve the same three air-flow rates with face velocity held constant 1.5
m/s. The results are presented in Table 4.8. Observe that the 5% increase in air-side heat transfer coefficient is no
longer able to offset the 27% drop in LMTD as face area is increased by 67%. Therefore air-side area has to increase
by about 30% to achieve the net 37% increase in air-side hA. The COP gain in this case comes at the cost of only
about 30% increase in blower power, but a more substantial increase in heat exchanger cost (30% larger air-side
area).
Table 4.7 Varying Vface at constant Aface (=0.44 m2)
Vface [m/s]
Air flow rate [m3/s]
Depth [m]
∆T’app
[°C] ∆Tsat
[°C] ∆Tref
[°C] Tevap
[°C] LMTD [°C]
hair [W/m2-K]
1.5 0.66 0.038 1.0 0.5 0.14 12.0 5.2 95 2.0 0.88 0.040 1.0 0.5 0.14 15.3 4.4 108 2.5 1.10 0.043 1.0 0.5 0.14 17.4 3.8 119
Table 4.7 (cont)
Vface [m/s]
Aair [m2]
hair * Aair [W/K]
DPair [Pa] Power [W]
1.5 23.1 2195 25.8 17 2.0 24.3 2624 41.9 37
2.5 26.0 3094 62.8 69
Table 4.8 Varying Aface at constant Vface (=1.5 m/s)
Aface [m2]
Air flow rate [m3/s]
Depth [m]
∆T’app [°C]
∆Tsat
[°C] ∆Tref [°C]
Tevap
[°C] LMTD [°C]
hair [W/m2-K]
0.44 0.66 0.038 1.0 0.5 0.14 12.0 5.2 95 0.59 0.88 0.033 1.0 0.5 0.14 15.3 4.4 97 0.73 1.10 0.029 1.0 0.5 0.14 17.4 3.8 100
Table 4.8 (cont)
Aface [m2]
Aair [m2]
hair * Aair [W/K]
DPair [Pa]
Power [W]
0.44 23.1 2195 25.8 17 0.59 27.1 2624 22.8 20 0.73 30.1 3010 20.4 22
4.6 Conclusions This chapter explored air-side tradeoffs in microchannel heat exchanger design. Currently microchannel
heat exchangers are costly to fabricate. The cost of extruding and brazing tubes to the header is more than that of
manufacturing louvered fins. Thus, if fin area is increased, (first) cost effective heat exchanger designs could be
proposed. This was part of the motivation of the present analysis. Air flow rate and face velocity tradeoffs were also
quantified.
As shown at the beginning in Chapters 2 and 3, smaller the diameter of a port in a microchannel tube, the
better is its performance. Chapter 2 suggested a way to determine the optimal tube length as a function of its
diameter, refrigerant inlet and outlet states, air-to-refrigerant side area ratio and air side heat transfer coefficient.
Having determined the tube length, the first cost of a heat exchanger using the optimal port is fixed. The only way to
change the first cost would be to alter the air-to-refrigerant area ratio. This was the starting point of this analysis.
45
Since microchannel heat exchangers used in reversible split systems, would have to operate both under dry and wet
conditions, wet coil performance was investigated in a great detail.
Three parameters, viz. fin height, pitch and thickness were considered for modifying the area ratio. Fin
height is the least costly way to increase air-side area, but to offset the drop in fin efficiency, the air-side area has to
be increased; the refrigerant-side area decreased. The overall result was for the coil having taller fins UA for the coil
having taller fins is lower. Therefore the logarithmic mean temperature (enthalpy) difference had to increase and the
evaporating temperature was reduced. Therefore operating cost would increase both due to greater blower power
and compressor work. It was concluded that tall fins are only useful if the first cost (cost of tube manufacturing) is
the biggest concern.
Fin pitch was the next parameter considered. Increasing fin pitch is useful for wet coil to enhance
condensate drainage but it decreases air-to-refrigerant area ratio. The resulting deeper coil has higher first cost
(refrigerant-side or tube-side area has increased along with the overall surface area), but lower operating cost due to
lower blower power and higher evaporating temperature.
Additional simulations investigated the possibility of offsetting fin efficiency losses by increasing fin
thickness. Results showed that such a strategy would not only increase fin cost but also would penalize the system
much more by increasing the air-side pressure drop than the benefit of increasing fin efficiency.
Lastly all the three parameters were considered together, to see if benefits could be gained by increasing fin
pitch to control air-side pressure drop as fins were made taller and thicker. Results showed that the decrease in air-
side heat transfer coefficient necessitated large increases in the surface areas of fins and tubes alike. The end result is
that that maximizing efficiency calls for short thin fins at the minimum pitch required for condensate drainage.
There is only limited scope for making fins taller (substituting fin cost for tube cost).
The next wet coil designs to be considered have higher air flow rate than the minimum defined by
prescribing the approach temperature difference. It was found that such designs have lower first cost and lower cost
for operating blower but more compressor power due to reduced evaporating temperature. Thus, coils designed to
operate with minimum air-flow rate are also the most energy efficient.
These conclusions are applicable to dry coils also. If a coil is to be designed for operating under dry
conditions alone, all the above conclusions except fin pitch (since condensate drainage is not an issue) would still be
true.
Also in dry coils, it is possible to vary refrigerant temperature by changing air-flow rate. This was explored
in some detail in section 4.5. It was observed that air-flow rate increase (70%) does indeed contribute to COP
increase. This does come at the cost of more than four-fold increase in blower power when the “increased face
velocity” strategy is employed. Increasing air-flow rate by increasing face area alone requires only about a 30%
increase in blower power but a more substantial increase in heat exchanger cost (30% increase in air-side area).

46
Bibliography
Andrade, M.A. and Bullard, C.W., 2002. Modulating Blower and Compressor Capacities for Efficient Comfort Control. ASHRAE Trans., Vol. 108, part 2, pp. 631-637.
Azzopardi, B.J. and Whalley, P.B., 1982. The effect of flow pattern on two phase flow in a T junction. Int. J. Multiphase flow, Vol. 8, pp. 491-507.
Azzopardi, B.J., 1984. The effect of the side arm diameter on two phase flow split at a T junction. Int. J. Multiphase flow. Vol. 10, pp. 509-512.
Bandhauer, T.M. and Garimella, S., 2002, Condensation heat transfer coefficients in circular microchannel tubes. International mechanical engineering congress and exposition, New Orleans, LA, 2002.
Butterworth, D., 1980, Unresolved problems in heat exchanger design. Presented at Interflow 80 – the fluid handling conference, Harrogate, UK.
Beaver, A.C., Yin, J.M., Hrnjak, P.S. and Bullard, C.W., 1999. An Experimental Investigation of Transcritical Carbon Dioxide Systems for Residential Air Conditioning, ACRC CR-18, University of Illinois at Urbana-Champaign.
Beaver, A.C., Yin, J.M., Hrnjak P.S. and Bullard, C.W., 2000. Effects of distribution in headers of microchannel evaporators on transcritical CO2 heat pump performance, Proc. of the ASME, AES-Vol.40.
Boewe, D.E., Bullard, C.W., Yin, J.M. and Hrnjak, P.S., 2001. Contribution of Internal Heat Exchanger to Transcritical R-744 Cycle Performance, Int. J. of HVAC&R Research, Vol. 7, No. 2, pp. 155-164.
Bullard, C.W., Yin, J.M. and Hrnjak, P.S., 2002. Compact Counterflow Gas Cooler for R744. to be published in ASHRAE Trans. Vol. 108, part 1, pp. 487-491.
Cavallini, A., Censi, G. and Col, D., 2002. In-Tube Condensation of Halogenated Refrigerants. ASHRAE Trans., Vol. 108, part 2, pp. 146-161.
Chang, Y. and Wang, C., 1994. Air side performance of brazed aluminum heat exchangers. J. Enhanced Heat Transfer, Vol. 3, no. 1, pp.15-28.
Chang, Y. and Wang, C., 1997. A Generalized Heat Transfer Correlation for Louvered Fin Geometry. Int. J. Heat Transfer, Vol. 40, no. 3, pp. 533-544.
Cho, H., Cho K., Youn B. and Kim Y., 2002. Flow maldistribution in microchannel evaporator. Presented at 9th International Refrigeration and Air-Conditioning Conference at Purdue.
Churchill, S.W., 1977. Comprehensive Correlating equations for Heat, Mass and Momentum Transfer in Fully Developed Flow in Smooth Tubes. Ind. Eng. Chem. Fundam. Vol. 16, part 1, pp. 109-116.
Coleman, J., 2000. Flow Visualization and Pressure Drop for Refrigerant Phase Change and Air-water Flow in Small Hydraulic Diameter Geometries. Ph.D. Thesis, Mechanical Engineering, Iowa State University.
Collier, J.G. and Thome, J.R., 1994. Convective Boiling and Condensation, 3rd Ed. Oxford: Oxford University Press.
Fei, P., Cantrak, D. and Hrnjak, P., 2002. Refrigerant distribution in the inlet header of plate evaporators. World Congress, SAE paper, 2002-01-0948.
Friedel, L., 1979. Improved friction pressure drop correlation for horizontal and vertical two-phase pipe flows. Presented at European two-phase flow group meeting, Ispra, Italy, paper t2.
Garimella, S., 2002. Microchannel Gas Coolers for Carbon Dioxide Air-conditioning Systems. to be published in ASHRAE Trans., Vol.108, part 1, pp.492-497.
Gneilinski, V., 1976. New equations for Heat and Mass Transfer in Turbulent pipe and channel Flow, Int. Chem. Eng., vol.16: p. 359-368.
Heun, M.K. and Dunn, W.E., 1996. Principles of Refrigerant Circuiting with Application to Microchannel Condensers: Part I - Problem Formulation and the Effects of Port Diameter and Port Shape. ASHRAE Trans. Vol. 102, part 2, pp. 373-381.
47
Idelchik, I.E., 1994. Handbook of Hydraulic Resistance, 3rd Ed. CRC Press.
Incropera, F.P. and DeWitt D.P., 1996. Fundamentals of Heat and Mass Transfer, John Wiley and Sons, New York
Jacobi, A.M., 2001. High Performance Heat Exchangers for Air Conditioning and Refrigeration Applications (Non-circular tubes). ARTI 21-CR Project 20020-Phase 2.
Kattan, N., Thome, J.R. and Favrat, D., 1998. Flow boiling in Horizontal Tubes: Part 3 – Development of a New Heat Transfer Model Based on Flow Pattern. Trans. ASME, J. Heat Transfer, Vol. 120, pp. 156-165.
Kim, M., Youn, B. and Bullard, C., 2001. Effect of inclination on the air-side performance of a brazed aluminum heat exchanger under dry and wet conditions, Int. J. of Heat and Mass Transfer, Vol. 44, pp. 4613-4623.
Kim, M., Song, S. and Bullard, C., 2002. Effect of inlet humidity condition on the air-side performance of an inclined brazed aluminum evaporator. Int. J. Refrig., Vol. 25, pp. 611-620.
Kim, M. and Bullard, C., 2002. Air-side performance of brazed aluminum heat exchangers under dehumidifying conditions. Int. J. Refrig. Vol. 25, pp. 924-934.
Kirkwood, A.C. and Bullard, C.W., 1999. Modeling, Design and Testing of a Microchannel Split-System Air Conditioner. University of Illinois at Urbana-Champaign ACRC TR-149.
Kulkarni, T. and Bullard C.W., 2002. Optimizing Effectiveness of R744 Microchannel Evaporators. Proc. of 5th IIR-Gutsav Lorentzen Conference on Natural working fluids, pp. 253-259.
Kulkarni, T., Cho, K. and Bullard, C., 2002, Refrigerant side tradeoffs in microchannel evaporator, ACRCTR-198, University of Illinois at Urbana-Champaign.
Lazarek, G.M. and Black, S.H., 1982. Evaporative Heat Transfer, Pressure Drop and Critical Heat Flux in a Small Vertical Tube with R-113. Int. J. Heat Mass Transfer, Vol. 25, part 7, pp. 945-960.
Liu, Z. and Winterton, R.H.S., 1988. Wet Wall Flow Boiling Correlation with Explicit Nuclear Term. Presented at the 5th Miami Int. Symp. On Multiphase Transport and Particulate Phenomena.
Lombardi, C. and Carsana, C.G., 1992. A dimensionless pressure drop correlation for two-phase mixtures flowing up-flow in vertical ducts covering wide parameter range, Int. J. Heat and Technology, Vol. 10, No.1-2, pp.125-141.
Lorentzen, G. and Pettersen, J., 1993. A new, efficient and environmentally benign system for car air-conditioning. Int. J. of Refrigeration, Vol. 16, part 1, pp. 4-12.
McEnaney, R.P., Boewe, D.E., Yin, J.M., Park, Y.C., Bullard, C.W. and Hrnjak, P.S., 1998. Experimental Comparison of Mobile A/C Systems when Operated with Transcritical CO2 Versus Conventional R134a, International Refrigeration Conf. at Purdue, pp. 145-150.
Neksa, P, Dorin, F., Rekstad, H., Bredesen, A. and Serbisse, A., 1999. Development of Semi-Hermetic CO2
Compressors. IIR Congress, Sydney, Australia.
Nino, V., Payne, W., Hrnjak, P.S., Newell, T.A. and Infante Ferreira CA., 2001. Two-phase pressure drop in microchannels. IIF-IIR- Commission B1-Paderborn, Germany.
Park, C.Y. and Hrnjak, P.S., R410A air-conditioning system with microchannel condenser. 9th International Refrig. and Air conditioning Conf. at Purdue, 2002.
Pettersen, J., Rieberer, R. and Leister, A., 2000. Heat Transfer and pressure drop characteristics of super-critical carbon dioxide in microchannel tubes under cooling. 4th IIR-Gustav Lorentzen Conference on Natural Working Fluids at Purdue, West Lafayette, USA, 25-28 July, pp.99-106.
Pettersen, J., 2003. Two-phase Flow Pattern, Heat Transfer and Pressure Drop in Microchannel Vaporization of CO2 to be published in ASHRAE Trans.
Rieberer, R., 1999, CO2 properties. IIR-Workshop on CO2 technology in Refrigeration, Heat Pump and Air-conditioning Systems, Mainz, Germany.
Song, S. and Bullard, C.W., 2002. Experimental and Simulation Analysis of Microchannel Evaporators, ACRC CR-47, University of Illinois at Urbana-Champaign
48
Souza, A.L. and Pimenta, M.M., 1995. Prediction of pressure drop during horizontal two-phase flow of pure and mixed refrigerants. ASME conf. Cavitation and Multiphase Flow Vol. 21, pp. 161-171.
Stott, S.L., C.W. Bullard and. Dunn, W.E., 1999. Experimental analysis of a minimum-TEWI air conditioner prototype. University of Illinois at Urbana-Champaign, ACRC CR-21.
Thome, J.R., Kattan, N. and Favrat D., 1998. Flow boiling in horizontal tubes: Part1- Development of a diabatic two-phase flow pattern map. Trans of ASME Journal of Heat Transfer, Vol. 120, pp.140-147.
Tompkins, D.M., Yoo, T., Hrnjak, P., Newell, T. and Cho, K., Flow distribution and pressure drop in microchannel manifolds. 9th International Refrig. and Air Conditioning Conf. at Purdue, 2002.
Wattelet, J.P., Chato, J.C., Souza, A.L. and Christoffersen, B.R., 1994. Evaporative Characteristics of R-12, R-134a, and MP-39 at Low Mass Fluxes. ASHRAE Trans. Vol. 100, part 1, pp. 603-615.
Yin, J.M., Bullard, C.W. and Hrnjak, P.S., 2002. Single phase pressure drop measurements in a Microchannel Heat Exchanger. Heat Transfer Engineering, Vol. 23, pp. 1-10.
Zhang, M., and Kwon, S.L., 1999. Two-phase frictional pressure drop for refrigerants in small diameter tubes. Proceedings of the International Conference on compact Heat Exchangers and Enhancement Technology for the process Industries, Banff, Canada, pp. 285-292.
Zietlow, D.C. and Pedersen, C.O., 1998. Flow Regime Mapping and Analysis of R-134a in a Small-Channel Cross-Flow Condenser. ASHRAE Trans., Vol. 104, part 2, pp. 540-547.

49
Appendix A. House load calculations
Sensible and latent loads shown in Table 3.4 are based on the following assumptions (ASHRAE, 1989):
house volume 566.3 m3 (20,000 ft3); UA = 165 W/°C (313 Btu/h-°F) corresponding to an average value of R-10 (ft2-
F-h/Btu) exterior surface; infiltration 0.5 air changes per hour at 35°C outdoors for a medium-sealed house; internal
sensible and latent loads of 1.01 and 0.67 kW, respectively, for appliances, and 0.24 and 0.26 kW for occupants;
solar loads of 5.63 kW correspond to 40° North latitude with window area 15% of the walls and a shading
coefficient of 0.55.
50
Appendix B. Bypass tube dimensions
Pressure drop of vapor flowing through the adiabatic bypass tube is given by:
churchill2
vap f*G*v*(L/D)*1/2? P = (B.1)
where the friction factor f is a function of the refrigerant mass flow rate and tube diameter, so
v)µ,,mD,(L, offunction ? Pvap &∝ (B.2)
Since the tube is designed by selecting a convenient length and determining the appropriate D from the pressure
drop at the design condition, the off-design pressure drop is a function of mass flow rate and operating conditions
alone. Therefore
21 D)(L,D)(L, m? P
m? P
∂∂
≈
∂∂
&&(for same mass flow rate) (B.3)
Consider, for example, the pressure drop for laminar flow.
v*µ*)(L/D*m? P
or
µ*v*)(L/D*G ? P
D/µ*G Re
(L/D)*v*G*1/Re ? P
4vap
2vap
2vap
&
Q
∝
∝
=
∝
(B.4)
In this case, the different bypass tube dimensions will obey the identity
L/D4 = constant.
For turbulent flow (Re>105),
v*µ*m*)(L/D a? P
/Dm aG
v*µ*G*)(L/D a? P
D/µ*GRev*G*L/D*1/Re a? P
0.251.754.75 vap
2
0.251.751.25 vap
20.25 vap
&
&
Q =
(B.5)
In this case, different bypass tube dimensions will obey the identity L/D4.75 = constant.
When orifice tubes of diameter 3, 5 and 7 mm were designed to achieve the same pressure drop
(corresponding to saturation temperature drop of 0.5°C) and were fed the same mass flow rates, the pressure drops
across the tubes were same. This reinforces Equation (B.3). Thus, different bypass tube designs will have the same
pressure drop across them for a given mass flow rate.
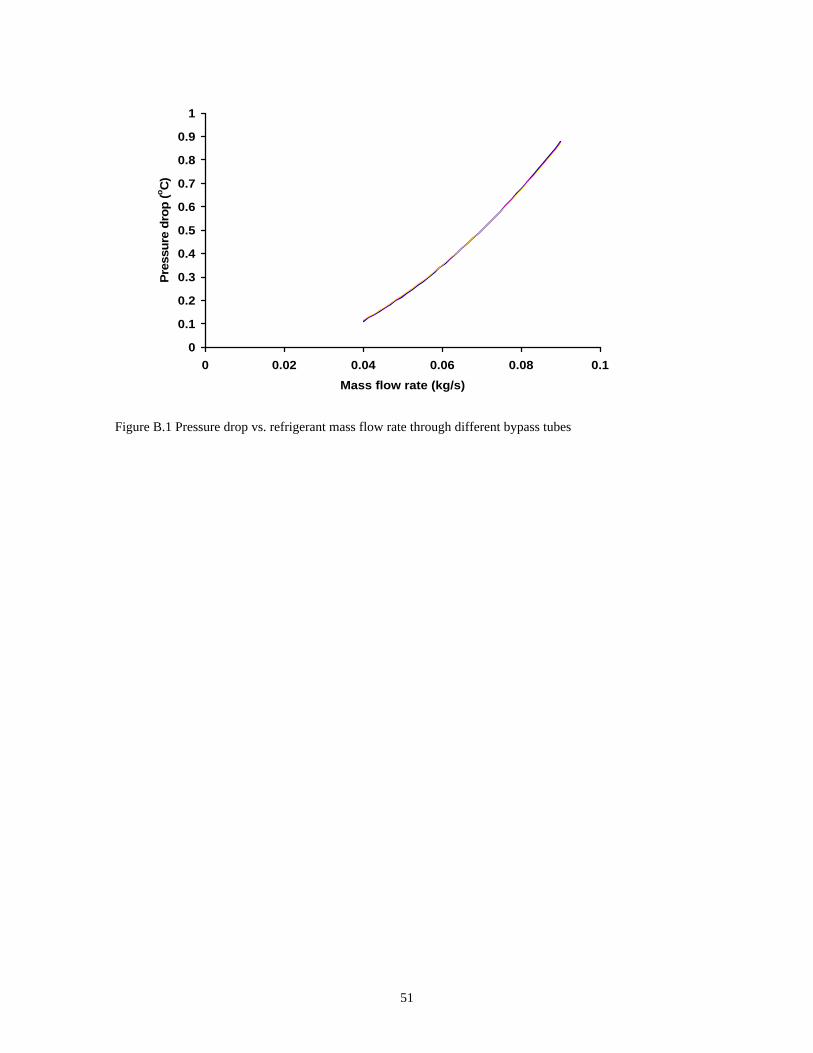
51
0
0.1
0.2
0.3
0.4
0.5
0.6
0.7
0.8
0.9
1
0 0.02 0.04 0.06 0.08 0.1
Mass flow rate (kg/s)
Pre
ssu
re d
rop
(o C)
Figure B.1 Pressure drop vs. refrigerant mass flow rate through different bypass tubes