design of tunnel drier for the non-centrifugal sugar industry
TRANSCRIPT

Design of tunnel drier for the non-centrifugal sugar
industry
S. P. Raj 1*, B. Sravya 1$, M. Srinivas 1#, Reddy KS2
1Department of mechanical engineering, BITS Pilani, Hyderabad Campus, India
2Heat Transfer and Thermal Power Laboratory, Department of mechanical engineering, IIT
Madras, Chennai, [email protected]
*Corresponding author. Tel.: +91 9618331321. E-mail: [email protected]
pilani.ac.in , [email protected] ,# [email protected]
pilani.ac.in
Abstract
The quality and shelf-life of NCS (Non-centrifugal sugar) mainly depend on the moisture
content present in it. NCS formed by the current practice of open sun drying contains moisture
substantially greater than the acceptable level of 3%. This paper presents the work taken up to
design a tunnel dryer to attain require moisture content in granular NCS for various load
conditions. Initially, an experimental investigation had been carried out on a laboratory scale
dryer to achieve require moisture content (< 3%) for various load conditions. This experimental
data was used for validating two drying models and found that one of the models is best suitable
for designing an industrial-scale dryer. For various load conditions on each tray and dryer exit
temperature, nine different cases were arrived at. The number of trucks, trays, drying time and
energy requirements were computed using the suitable theoretical model. Tunnel dryer with a
length of 18 m, a height of 1.2 m, a width of 1 m, number of trucks of 18 and 24 number of
trays on each truck was found to be the suitable dryer to dry 1 tone of NCS based on the
minimum energy requirement of 176.49 MJ, and a minimum drying time of 68 minutes.
Nomenclature
a Distance between the trays (m) Qair Air flow rate (m3/s)
b Width of the tray (m) T∞ Temperature of air at the inlet of the dryer
CNCS Specific heat of the NCS granules
(kJ/kg-K)
Ti Initial NCS bed temperature
Cair Specific heat of the air (kJ/kg-K) Vair Velocity of air above each tray (m/s)
Cp Specific heat of water (kJ/kg-K) Xc Critical moisture content (%)
G Rate of air mass flux X1 Equilibrium moisture content (%)
h Heat transfer coefficient (W/m2K) X Instantaneous moisture content (%)
hfg Latent heat of moisture ρair Density of air (kg/m3)
Preprints (www.preprints.org) | NOT PEER-REVIEWED | Posted: 13 February 2020 doi:10.20944/preprints202002.0172.v1
© 2020 by the author(s). Distributed under a Creative Commons CC BY license.

mwj Equivalent mass of moisture in terms of
NCS (kg)
Δp Pressure drop in the duct
mw Amount of moisture removed (kg)
�̇� drying rate (kg/s)
mNCS Mass of the NCS sample (kg)
1. Introduction
Non-centrifugal sugar (NCS), popularly referred to as jaggery, is a traditional and unrefined
sugar produced by sugarcane juice concentration. It is a rich mixture of essential nutrients and
is therefore considered as the healthiest kind of sugar for human consumption [1]. The
processing of NCS is a continuous process of heat and mass transfer involving clarification,
boiling and concentration of sugarcane juice [2]. A traditional NCS production unit typically
consists of a sugarcane juice crusher, an underground furnace fitted with single or multi-pan
systems, where the water is evaporated to concentrate the juice to produce NCS [3] [4]. In
India, a large portion of the NCS is manufactured in small-scale cottage level industry [5].
Figure 1 shows the basic production process of NCS production.
Figure 1. Basic production process NCS production [3]
NCS production in India starts in the month of October and continuous till mid of May and is
stored for the rest of the year [6]. The quality of stored NCS depends mostly on the moisture
content. The higher moisture in NCS is favorable for the inversion and growth of different
types of fungi and bacteria resulting in a change in taste and colour [7]. The growth of micro-
organisms and deterioration of NCS is maximum at10% moisture content and 30oC
Molding & packing
Sugarcane
Juice extraction
Juice clarification
Juice evaporation
Juice concentration
(drying)
Preprints (www.preprints.org) | NOT PEER-REVIEWED | Posted: 13 February 2020 doi:10.20944/preprints202002.0172.v1

temperature [8]. The freshly prepared NCS contents moisture about 13 to 15% but preferably
is below 3% for NCS storage for longer shelf-life [9]. Further, it has become a prerequisite for
the industry to maintain the optimal level of moisture content in NCS to meet the standards and
requirements in food hygiene and handling such as packing, transportation and distribution
[10]. Drying of NCS is one of the processes to remove the excess moisture content and further
increases the shelf-life of NCS during storing. It is a heat and mass transfer phenomenon in
which the heat energy is transferred from the surrounding to the NCS surface in different heat
transfer modes. Some part of heat supplied is used for sensible heating to increase the surface
temperature of NCS and a part is used for the latent heat of vaporisation to remove the moisture
present in the interior of NCS. The amount of moisture removed from the NCS depends upon
the induced vapour pressure difference between the NCS surface and the surrounding medium
[11].
Depending upon the method of drying, drying may be classified as open sun drying or
controlled drying [12]. To have better control over the drying rate, controlled drying would be
a better option than open sun drying that depends on weather conditions. However, in most of
the conventional NCS plant, open sun drying is the major practice for drying NCS. In this
process of drying, the NCS syrup formed after the concentration of sugarcane juice is moved
from the furnace and is continuously stirred with flat wooden stirrers for uniform cooling by
natural air. Then the obtained semi solidified syrup is transferred into aluminum mould or
aluminium tray to form solid NCS or granular NCS. The granular NCS is formed by the action
of severe shearing of semi solidified syrup in aluminium tray using wooden or stainless steel
scrappers. The moisture content in solid NCS and granular NCS formed by this process ranges
above 3%, which is not preferable for longer storage as it affects the quality and shelf-life of
NCS [13]. Every year, it is noted that more than 10% of NCS produced in India worth $0.6
million is lost due to moisture deterioration [14]. Therefore, to achieve a preferable moisture
content (that is below 3%), the drying rate should be controlled instead of depending on the
weather conditions. To have better control over the drying rate, a control dryer is to be designed
and analysed as per the requirement to remove moisture in NCS.
Controlled dryers are available in a wide variety to meet the requirement of the food industry.
The selection of dryers for a particular application depends mainly on the amount of moisture
to be removed, the scale of operation, method of heat energy supplied and cost [15]. The dryers
that are commonly used in food industries are tray dryers, tunnel dryers, drum dryers, fluidized
bed spray dryers, flash dryers, rotary dryers, belt dryers, vacuum dryers, and freeze dryers.
Preprints (www.preprints.org) | NOT PEER-REVIEWED | Posted: 13 February 2020 doi:10.20944/preprints202002.0172.v1

Among these dryers, the tunnel dryer is most extensively used because of its simple and
economic design and most importantly it produces uniform drying [16]. It can remove moisture
uniformly from the material with low moisture content to a material with high moisture content
without any deterioration. Unlike other dryers, the operation is simple and produces slow and
uniform drying [17].
Tunnel dryers are considered as the development of a tray dryer. Figure 2 shows the schematic
diagram of tunnel dyer. The trays arranged on the trolleys called trucks. The dryer contains
several such trucks/trolleys, each of which behaves as a separate batch tray dryer. The material
to be dried is placed uniformly on each tray. Then the air is blown over the trays in the tunnel
using the blower for proper circulation [16]. Forced convection heating takes place to remove
moisture from the material placed in trays. A truck of dried material is removed from the dry
end of the tunnel and the remaining trucks are pushed forward along the truck length and the
truck of wet material is rolled into the vacant space at the wet end of the dryer [18].
Figure 2. Schematic diagram of tunnel dyer to designed for drying NCS granules
This paper presents the works taken up to design a tunnel dryer to attain moisture content below
3% in granular NCS for various load conditions. Initially, a laboratory-scale dryer is considered
and the experimental analysis is carried out for drying NCS. This experimental data is used for
validating the drying models that were considered to design a suitable industrial tunnel dryer
for removing excess moisture in NCS, to produce quality NCS and can be retained during
storing.
2. Materials and methods
The schematic diagram of the methodology adopted for designing an industrial dryer to achieve
a moisture content below 3% in granular NCS is shown in Figure 3. The following sections
describe the methodology adopted.
Trolleys
Preprints (www.preprints.org) | NOT PEER-REVIEWED | Posted: 13 February 2020 doi:10.20944/preprints202002.0172.v1

Figure 3. Methodology adopted for designing an industrial tunnel dryer.
2.1 Experimental analysis for drying NCS
Initially, the experimental analysis was carried out on a laboratory scale forced
convective tray dryer with a tray area of 0.128 m2, to achieve the required moisture content in
NCS granules and to determine the drying time. Figure 4 represents the laboratory scale forced
convective tray dryer. The dryer is attached with the mass balance that ranges from 0 to 10 kg
to measure the change in mass of the material placed in the tray. It is also equipped with
necessary software and hardware support for data acquisition related to a reduction in mass
with respect to time. The tray with NCS was covered with an empty tray of the same area at a
distance of 0.05m to form an air duct and mimic the configuration in the real dryer with a
number of trays and trucks. The hot air required for drying the NCS granules is supplied by
means of blower and heater mounted at one end and along the air duct respectively. Air
temperature and velocity are the most important factors that influence the drying rate during
the drying process [19]. The temperature of air considered for the drying process should not
exceed the glass transition temperature of NCS which is 45oC, beyond which the NCS granules
will fuse [20]. The air velocity beyond 2m/s has no significant effect on the drying rate [21].
Therefore, inlet parameters such as velocity and temperature of the air to achieve required
moisture content in NCS are considered to be 2m/s and 45oC respectively.
Experimental analysis for drying NCS
Application of theoretical models and their
validation
Application of drying model to scale up to tray
area of 1m2
Development of industrial tunnel dryer for 1 ton
of NCS granules
1. Drying time
2. % of Moisture removal
1. Drying time 2. % of Moisture removal 3. Number of trucks 4. Energy required
1. Air inlet @ 45oC & 2m/s
2. NCS granules 0.3,0.4,0.5 kg
1. Air at 45oC & 2m/s
2. NCS granules 2.46,3.28,4.11kg
Preprints (www.preprints.org) | NOT PEER-REVIEWED | Posted: 13 February 2020 doi:10.20944/preprints202002.0172.v1

Figure 4. Laboratory scale forced convective tray dryer
For the experimental study, the NCS samples were sourced from an NCS plant at Erode,
Tamil Nadu, India. The initial moisture content of these samples is 4.57%. The study was
carried out for various loads of NCS samples from 0.3kg to 0.5kg with an increment of 0.1kg
on a 0.128 m2 tray. These loads were selected since, NCS sample below 0.3kg do not utilize
the tray area completely and beyond 0.5kg exceeds the drying time more than 1.5 hours (the
drying time in current conventional process) and the selected 0.3kg, 0.4kg and 0.5kg samples
are distributed on the tray with the uniform thickness of 1.5, 2 & 2.5mm respectively. Figure 5
shows the uniform distribution of the NCS sample on a tray area of 0.128 m2.
Figure 5. Uniform distribution of NCS sample on a tray area of 0.128 m2
The moisture content of the NCS sample was found to be 4.57% using the
thermogravimetric analyser, which should be reduced to 3%. In the process of drying, removal
of moisture from the surface and also from the interior of the material is essential, in which
drying rate plays a key role [22]. The percentage of moisture removed is assessed by weighing
the samples for every 30 seconds. Further, the drying rate is computed by equation 1.
Data recorder
Control panel
Blower
& heater
Mass weighing Material
holder
Temperature
& humidity
sensor
Preprints (www.preprints.org) | NOT PEER-REVIEWED | Posted: 13 February 2020 doi:10.20944/preprints202002.0172.v1
�̇� =𝑚𝑖−𝑚𝑓
𝑡 (1)
where mi is the mass of the NCS sample before drying, mf is the mass of the NCS sample after
drying and t is the drying time.
2.2 Theoretical drying models and their validation
To make use of the data obtained through the experiments to get a generalized theoretical
model that could be used for the design of an industrial dryer, the following two theoretical
models were considered to obtain percentage moisture removal rates.
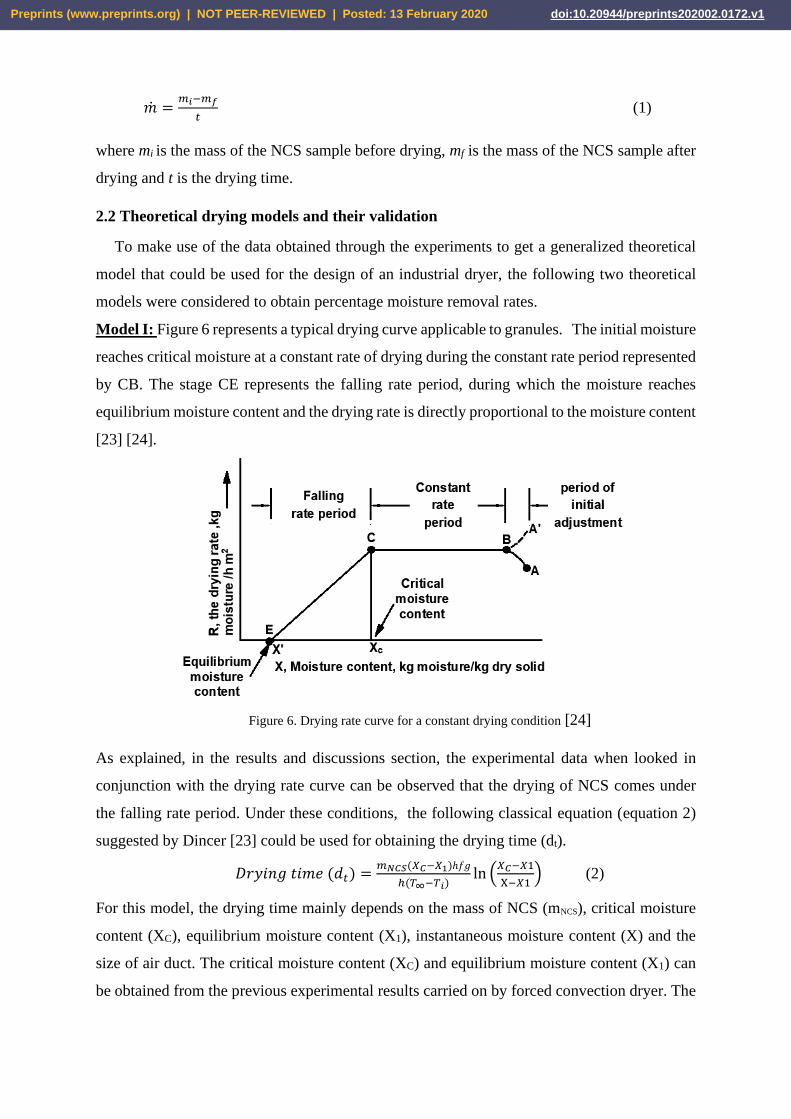
Model I: Figure 6 represents a typical drying curve applicable to granules. The initial moisture
reaches critical moisture at a constant rate of drying during the constant rate period represented
by CB. The stage CE represents the falling rate period, during which the moisture reaches
equilibrium moisture content and the drying rate is directly proportional to the moisture content
[23] [24].
Figure 6. Drying rate curve for a constant drying condition [24]
As explained, in the results and discussions section, the experimental data when looked in
conjunction with the drying rate curve can be observed that the drying of NCS comes under
the falling rate period. Under these conditions, the following classical equation (equation 2)
suggested by Dincer [23] could be used for obtaining the drying time (dt).
𝐷𝑟𝑦𝑖𝑛𝑔 𝑡𝑖𝑚𝑒 (𝑑𝑡) =𝑚𝑁𝐶𝑆(𝑋𝐶−𝑋1)ℎ𝑓𝑔
ℎ(𝑇∞−𝑇𝑖)ln (
𝑋𝐶−𝑋1
X−𝑋1) (2)
For this model, the drying time mainly depends on the mass of NCS (mNCS), critical moisture
content (XC), equilibrium moisture content (X1), instantaneous moisture content (X) and the
size of air duct. The critical moisture content (XC) and equilibrium moisture content (X1) can
be obtained from the previous experimental results carried on by forced convection dryer. The
Preprints (www.preprints.org) | NOT PEER-REVIEWED | Posted: 13 February 2020 doi:10.20944/preprints202002.0172.v1

values of instantaneous moisture content (X) could be the intermediate values between critical
moisture content to equilibrium moisture content. The length (l) and width (b) of the duct could
be considered to be the same as the laboratory tray dimensions (0.4 & 0.32m). Similarly, the
height (a) could be taken as the distance between the trays (0.05m).
Model II: As an alternative to the first model, in this second model, NCS with moisture in it
could be considered as a lump which in turn suggests that the drying time could be calculated
based on equation 3.
𝐷𝑟𝑦𝑖𝑛𝑔 𝑡𝑖𝑚𝑒 (𝑑𝑡) =(𝑚𝑁𝐶𝑆+𝑚𝑤𝑗)𝐶𝑁𝐶𝑆
ℎ𝐴ln (
𝑇𝑖−𝑇∞
𝑇(𝑡)−𝑇∞) (3)
For this model, the heat transfer coefficient can be determined by considering the rate of air
mass flux (G, which ranges from2450 to 29300 kg/hr.m2), as per the equation 4.
ℎ = 0.020𝐺0.8 (4)
Also, the drying time mainly depends on the mass of NCS (mNCS), equivalent mass of
moisture in terms of NCS (mwj), area of the tray and the temperature of NCS at a particular
time T(t). The equivalent mass of moisture in terms of NCS can be estimated based on the
energy balance as per the equation 5.
𝑚𝑤ℎ𝑓𝑔 = 𝑚𝑤𝑗𝐶𝑁𝐶𝑆(𝑇𝑖 − 𝑇∞) (5)
Using the above two theoretical models, the drying time with respect to the percentage of
moisture removal was computed and the results are compared with the experimental results to
ensure the applicability of these models for developing an industrial-scale dryer. As presented
in the results and discussion sections, the comparison ensured that the theoretical model I could
be used for the development of industrial-scale tunnel dryers.
2.3 Industrial tunnel drier design using theoretical models
The above verified theoretical model I is used to develop a tunnel dryer capable of drying 1
ton of NCS that brings down the moisture from 4.75% to 3% in an estimated time of around
1.5 hours (same as the drying time in conventional NCS plant). As depicted in Fig. 1, a two
steps process is followed for this.
2.3.1 Application of drying model I for tray area of 1m2
In the first step, the above theoretical model I was applied for of tray area of 1m2, initially, to
ensure the applicability of this theoretical model I. The NCS loads for 1m2 tray are obtained by
linearly transforming the loads used in experimental analysis. Accordingly, the NCS loads for
1m2 tray area are 2.46, 3.28 & 4.11 kg with corresponding layer thicknesses of 1.5, 2 & 2.5mm
respectively. Similar to the experimental analysis, the temperature and velocity of air are
Preprints (www.preprints.org) | NOT PEER-REVIEWED | Posted: 13 February 2020 doi:10.20944/preprints202002.0172.v1

considered to be 45oC and 2m/s respectively. Using this theoretical model I, the drying time
and percentage of moisture removal were then computed, and these results are compared with
the experimental and theoretical results that are obtained with the tray area of 0.128 m2. As
presented in the results and discussion sections, for the increased tray area, the results are in
agreement with the results obtained with the tray area if 0.128 m2. Therefore, the same
theoretical model I could be used for the development of industrial-scale tunnel dryers.
2.3.2 Development of tunnel dryer
The tunnel dryer is considered to be the improvement of the tray dryer. It contains multiple
trucks with each truck having several trays as shown in figure 2. The main parameters to be
arrived at, for this designing process, are (i) the number of trays that can be arranged in the
dryer (ii) energy required for the drying process.
The number of trays to be accommodated in the dryer depends on the vertical and horizontal
arrangement of trays. The horizontal arrangement of trays is called a truck and each truck has
several trays arranged vertically one over the other with a gap of 0.05m forming a duct to pass
hot air over it. A typical tunnel dryer can accommodate a minimum of 5 to a maximum of 20
trucks with each truck having 24 trays [18]. The number of trucks to be arranged in the dryer
also depends upon the exit air temperature of the dryer. The dryer exit temperature is found to
be 42oC with the minimum truck arrangement (5 trucks), as per the equation 4 and 5 (when air
at 45oC is passed at the inlet of the dryer). It is observed during the experimental analysis that
required moisture removal (from 4.49% to 3%) does not happen when the air temperature falls
below 38oC. Therefore, the three possible temperatures at the exit of drier could be 38oC, 40oC
& 42oC.
The air temperature at the inlet of the dryer increases the NCS granules temperature from
25oC by absorbing the moisture present in each truck. Due to this phenomenon, the air
temperature decreases as it passes from one truck to other and the amount of moisture removed
(mw) from the NCS will be vaporised. This decrease in air temperature at exist of each truck
(To) will be the inlet air temperature (Ti) for the subsequent truck. The decrease in air
temperature at exist of each truck can be estimated from energy balance as per equation 6. The
mass of the air (mair) can be estimated from equation 7. The required drying time to calculate
the mass of the air could be computed by theoretical model I. The air flow area ( Aflow), above
Preprints (www.preprints.org) | NOT PEER-REVIEWED | Posted: 13 February 2020 doi:10.20944/preprints202002.0172.v1

the NCS in the tray can be estimated by using the length of the tray (L=1m) and the distance
between the trays (a =0.05m).
𝑚𝑎𝑖𝑟𝐶𝑎𝑖𝑟(𝑇𝑖 − 𝑇𝑜) = 𝑚𝑁𝐶𝑆𝐶𝑁𝐶𝑆(𝑇𝑖 − 25) + 𝑚𝑤ℎ𝑓𝑔 + 𝑚𝑤𝐶𝑝(𝑇𝑖 − 25) (6)
𝑚𝑎𝑖𝑟 = 𝜌𝑎𝑖𝑟𝐴𝑓𝑙𝑜𝑤 𝑉𝑎𝑖𝑟 𝑑𝑡 (7)
The actual number of trucks that can be accommodated in the dryer is equal to the number of
trucks obtained when the outlet temperature of the last truck is equal to the final exit
temperature of the dryer. Table 1 represents the nine cases of various combinations of 2.46,3.28
& 4.11kg of NCS granules placed on each tray with various dryer exit air temperature viz. 38oC
40oC & 42oC.
Table 1. Different cases for drying 1 ton of NCS granules
Case
NCS power loaded on
each tray
(kg)
Dryer exit temperature
(oC)
C1 2.46 42
C2 3.28 42
C3 4.11 42
C4 2.46 40
C5 3.28 40
C6 4.11 40
C7 2.46 38
C8 3.28 38
C9 4.11 38
To achieve optimum dryer design among these nine case, it is necessary to estimate energy for
each case to dry 1 ton of NCS granules The total energy required for the drying 1 ton of NCS
granules can be estimated by computing the energy required by the blower and heater for
supplying air at inlet of 2 m/s and 45oC respectively. The energy required by the blower (Eblower,
kJ) and heater (Eheater, kJ), can be estimated from the following equations 8,9 with heater and
blower efficiencies as 90% and 70% respectively [25].
𝐸𝐻𝑒𝑎𝑡𝑒𝑟 = 𝑚𝑎𝑖𝑟𝐶𝑎𝑖𝑟(45 − 𝑇∞)𝜂ℎ𝑒𝑎𝑡𝑒𝑟 (8)
(9)
The air flow rate can be determined by taking into account the cross-sectional area of the tray,
over which the air flows at a constant velocity. The optimum dryer design can be obtained
𝐸𝑏𝑙𝑜𝑤𝑒𝑟 =𝑄𝑎𝑖𝑟 𝛥𝑝
𝜂𝑏𝑙𝑜𝑤𝑒𝑟
Preprints (www.preprints.org) | NOT PEER-REVIEWED | Posted: 13 February 2020 doi:10.20944/preprints202002.0172.v1

based on the minimum energy required by the heater and blower and minimum drying time to
remove moisture present in one tone of NCS granules.
3. Results & discussions
The analysis associated with the design of an industrial tunnel was carried out based on
earlier presented experimental data and the theoretical models. The following sections discuss
the findings to design an optimum tunnel dryer for achieving the required moisture content in
NCS.
3.1 Experimental results
The experimental analysis was carried out for various loads of NCS samples (0.3, 0.4 &
0.5kgs of NCS granules) on a laboratory scale forced convective tray dryer of 0.128m2 tray
area. The percentage of moisture removed with respect to drying time was determined. The
amount of moisture removed is estimated by weighing the sample for every 30 seconds. From
figure 7 & 8, it is observed that the drying of the NCS sample is found to be in the falling rate
period with average equilibrium moisture of 2.87%. The time required for drying 0.3, 0.4 &
0.5 kg of NCS samples to reach equilibrium moisture content was found to be 42, 65 & 81
minutes respectively. Also, the percentage of moisture removed is computed to be 30%, 35%
and 40% respectively. It is also observed that the rate of drying decreases with an increase in a
load of NCS samples on each tray.
Figure 7. Percentage of moisture content w.r.t drying rate for varied mass of NCS
Preprints (www.preprints.org) | NOT PEER-REVIEWED | Posted: 13 February 2020 doi:10.20944/preprints202002.0172.v1

Figure 8. Percentage of moisture removal w.r.t drying time for the varied mass of NCS
3.2 Validation of drying models with experimental results
Drying models, I & II presented earlier have been used to calculate the percentage of
moisture removal with respect to drying time with the same air inlet conditions considered for
the experimental analysis. From the figure 9, it is observed that the drying times required to
reach equilibrium moisture content in 0.3, 0.4 & 0.5 kg of NCS samples are 42, 65 & 80
minutes respectively with 30% of moisture removal as per the drying model I. Similarly,
according to drying model II, the drying time required to reach equilibrium moisture content
in 0.3, 0.4 & 0.5 kg of NCS granules was found to be 45, 71 & 90 minutes respectively with
35% of moisture removal. These theoretical results indicate that the experimental results are
consistent with drying model I. Also, it is observed that the result obtained by model II is
exceeding the experimental results with percentage error ranging from 25 to 30%. Therefore,
model-I is considered for the design of an industrial dryer.
(a) (b) (c)
Figure 9. Comparison of theoretical analysis with experimental results for (a) 0.3 kg (b) 0.4 kg (c) 0.5 kg of
NCS
3.3 Scale up tray area of 1m2 using drying models
Preprints (www.preprints.org) | NOT PEER-REVIEWED | Posted: 13 February 2020 doi:10.20944/preprints202002.0172.v1
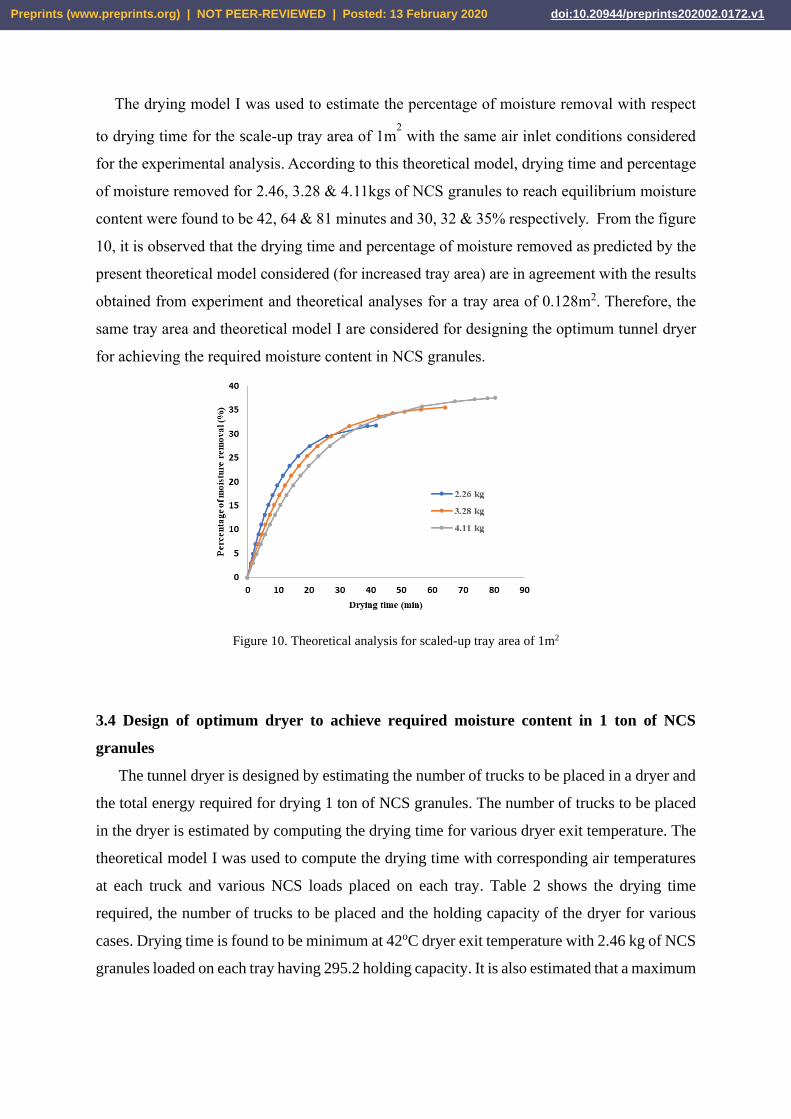
The drying model I was used to estimate the percentage of moisture removal with respect
to drying time for the scale-up tray area of 1m2 with the same air inlet conditions considered
for the experimental analysis. According to this theoretical model, drying time and percentage
of moisture removed for 2.46, 3.28 & 4.11kgs of NCS granules to reach equilibrium moisture
content were found to be 42, 64 & 81 minutes and 30, 32 & 35% respectively. From the figure
10, it is observed that the drying time and percentage of moisture removed as predicted by the
present theoretical model considered (for increased tray area) are in agreement with the results
obtained from experiment and theoretical analyses for a tray area of 0.128m2. Therefore, the
same tray area and theoretical model I are considered for designing the optimum tunnel dryer
for achieving the required moisture content in NCS granules.
Figure 10. Theoretical analysis for scaled-up tray area of 1m2
3.4 Design of optimum dryer to achieve required moisture content in 1 ton of NCS
granules
The tunnel dryer is designed by estimating the number of trucks to be placed in a dryer and
the total energy required for drying 1 ton of NCS granules. The number of trucks to be placed
in the dryer is estimated by computing the drying time for various dryer exit temperature. The
theoretical model I was used to compute the drying time with corresponding air temperatures
at each truck and various NCS loads placed on each tray. Table 2 shows the drying time
required, the number of trucks to be placed and the holding capacity of the dryer for various
cases. Drying time is found to be minimum at 42oC dryer exit temperature with 2.46 kg of NCS
granules loaded on each tray having 295.2 holding capacity. It is also estimated that a maximum
Preprints (www.preprints.org) | NOT PEER-REVIEWED | Posted: 13 February 2020 doi:10.20944/preprints202002.0172.v1

of 18 trucks are required when each tray is loaded with 3.38 kg of NCS granules at 38oC dryer
exit temperature.
Table 2. Different cases for drying NCS w.r.t to Model I
Case
NCS power loaded on
each tray
(kg)
Dryer exit
temperature
(oC) Number of trucks
Time
(min)
Holding
capacity of the
dryer (kg)
C1 2.46 42 5 55.02 295.2
C2 3.28 42 6 56.12 472.3
C3 4.11 42 6 61.60 591.8
C4 2.46 40 10 74.29 590.4
C5 3.28 40 11 83.82 865.9
C6 4.11 40 11 96.48 1085.2
C7 2.46 38 15 93.60 885.6
C8 3.28 38 18 105.98 1416
C9 4.11 38 17 119.20 1676.8
It is also observed that the drying time and the number of trucks are comparatively higher when
the dryer exit temperature is at 38oC. Similarly, the drying time and the number of trucks are
relatively minimum when the dryer exit temperature is at 42oC. Figure 11, shows the variation
of temperature with respect to each truck. It is observed that temperature is uniformly
decreasing from one truck to another truck in all the cases and the number of trucks is
increasing with decreasing in the exit temperature of the dryer.
(a) (b) (c)
Figure 11. Temperature variation w.r.t each truck by model I for exit temperatures of air (a) 42oC (b) 40oC (c)
38oC
Figure 12, shows the variation of drying time with respect to each truck. It is observed that, for
a given number of trucks, as the mass of the NCS is increasing the drying time is increasing.
The drying time is increasing progressively along the length of dryer indicating that the last
truck is at lower temperature resulting in longer drying time for that truck, in comparison with
the trucks at the entry.
Preprints (www.preprints.org) | NOT PEER-REVIEWED | Posted: 13 February 2020 doi:10.20944/preprints202002.0172.v1

(a) (b) (c)
Figure 12. Drying time variation w.r.t each truck by model I for (a) 42oC (b) 40oC (c) 38oC exit temperatures
Further, the design parameters such as the length of the dryer and total energy required for
drying 1 ton of NCS are estimated based on the above obtained results and the length of the
dryer is estimated based on the number of trucks.
Figure 13 shows the total energy required for drying 1 ton of NCS granules for varied
input conditions. It is observed that 150KJ of energy is required to blow the air at 2m/s and
45oC for case 1, 2& 3. That is the amount of energy required is minimum, when dryer exit
temperature decreases to 38oC with 2.46, 3.28 & 4.11kgs of NCS granules loaded on each tray
of 15, 18 and 17 trucks respectively. It is also observed that 350- 450KJ of energy is required
for case 1, 2& 3. That is the amount of energy required is maximum, when dryer exit
temperature decreases to 42oC with 2.46, 3.28 & 4.11kgs of NCS granules loaded on each tray
of 5 and 6 trucks respectively.
Figure 13. Energy required for drying 1 ton of NCS granules with respect to varied input conditions
0
20
40
60
80
100
120
140
160
180
200
0
100
200
300
400
500
600
Dry
ing
tim
e (m
in)
En
erg
y (
MJ
)
Case number
Energy Time
Preprints (www.preprints.org) | NOT PEER-REVIEWED | Posted: 13 February 2020 doi:10.20944/preprints202002.0172.v1

Therefore, based on the minimum energy required, the cases viz. C7, C8 & C9 are
considered for designing the optimum tunnel dryer to achieving the required moisture content
in 1 ton of NCS granules. Table 3. show the three optimum tunnel dryer designs for drying one
tone of NCS with air inlet temperature and velocity as 45oC and 2m/s respectively.
Table 3. Optimum tunnel dryer design
Case
Mass of NCS
granules loaded on
each tray (kg)
Exit
temperature
(oC)
Drying time
(min)
Number of
trucks
Energy
(MJ)
Length of
the dryer
(m)
C7 2.46 38 69.5 15 180.29 15
C8 3.28 38 68 18 176.49 18
C9 4.11 38 71.08 17 184.26 17
Tunnel dryer of length 18 m, height 1.2 m and width 1 m was found based on the
minimum energy requirement of 176.49 MJ and minimum drying time of 68 minutes to achieve
the required moisture content of 3% in 1 tone of NCS granules (case 6). In this particular
optimum case, the mass of NCS sample that can be loaded varies from 60 kg to 1085 kg with
varying number of trays on each truck.
4. Conclusions
In the present paper, an attempt has been made to design a tunnel dryer to attain moisture
content below 3% in NCS granules. Initially, the experimental analysis was carried out on a
laboratory scale forced convective tray dryer with a tray area of 0.128 m2 for various loads of
NCS. During this experimental study, the drying of the NCS sample is found to be in the falling
rate period with average equilibrium moisture of 2.87%. It is also observed that the rate of
drying is decreasing with an increase in a load of NCS samples on each tray. This experimental
data is used for validating two drying models and found that one of the models is best suitable
for designing an industrial-scale dryer. Nine different cases have arrived for various load
conditions on each tray and dryer exit temperature. Tunnel dryer with a length of 18 m, a height
of 1.2 m, a width of 1 m, number of trucks of 18 and 24 number of trays on each truck was
found to be the suitable dryer to dry 1 tone of NCS based on the minimum energy requirement
of 176.49 MJ, and a minimum drying time of 68 minutes to achieve the require moisture content
of 3% in 1 tone of NCS granules.
5. Acknowledgements
The research work presented in this paper is a part of “Sustainable technological solutions for
energy efficiency in jaggery industry (STEEJ)” project, funded by Royal academy of
Preprints (www.preprints.org) | NOT PEER-REVIEWED | Posted: 13 February 2020 doi:10.20944/preprints202002.0172.v1

Engineering (RAE) vide project reference # IAPP1R2\100083. The authors gratefully
acknowledge the RAE for funding this project.
Reference
[1] R. Kumar and M. Kumar, “Upgradation of jaggery production and preservation
technologies,” Renew. Sustain. Energy Rev.2018;96: 167–180.
[2] J. Singh, R. D. Singh, S. I. Anwar, and S. Solomon, “Alternative Sweeteners Production
from Sugarcane in India: Lump Sugar (Jaggery),” Sugar Tech.2011;13(4): 366–371.
[3] M. Srinivas, B. Sravya, and S. P. Raj, “Crushing method selection for non-centrifugal
sugar production by FAHP – ELECTRE I,” Inter. J. low carbon tech.2020: 1–8.
[4] P. V. Sai and K. S. Reddy, “4-E ( Energy-Exergy-Environment-Economic ) analyses of
integrated solar powered jaggery production plant with different pan configurations,”
Sol. Energy, vol. 2020; 197:126–143.
[5] F. Velásquez, J. Espitia, O. Mendieta, S. Escobar, and J. Rodríguez, “Non-centrifugal
cane sugar processing: A review on recent advances and the influence of process
variables on qualities attributes of final products,” J. Food Eng.2019;255: 32–40.
[6] Chand, K., Shahi, N. C., Lohani, U. C., & Garg, S. K. “Effect of storage conditions on
keeping qualities of jaggery,” Sugar Tech. 2011; 13(1):81-85.
[7] Uppal, S. K. “Storage of jaggery under low temperature for longer duration,” Sugar
Tech. 2002, 4(3-4): 177-178.
[8] D. P. Farooque, M., & Srivastava, “A new physico-chemical concept of the hygroscopic
property of gur (Jaggery).,” in In Proc. II Bien. Conf, 1954, SRDW: 602–607.
[9] K. Y. Shiralkar, S. K. Kancharla, N. G. Shah, and S. M. Mahajani, “Energy
improvements in jaggery making process,” Energy Sustain. Dev.2014; 18(1): 36–48.
[10] Ramya, H. N., Gowda, M. C., Jayamala, G. B., Krishnamma, P. N., & Shreedevi, M. S.
“Effect of ambient atmospheric conditions on change in physico-chemical properties of
stored jaggery,” International Journal of Applied Agricultural Research 2010, 5(1):9-
18.
[11] Prakash, O., & Tiwari, G. N. “Empirical expressions for convective and evaporative
heat transfer coefficients for the drying of concentrated sugar-cane juice,” International
journal of ambient energy 2005, 26(1):45-55.
[12] P. Taylor, O. Prakash, and A. Kumar, “Application of artificial neural network for the
Preprints (www.preprints.org) | NOT PEER-REVIEWED | Posted: 13 February 2020 doi:10.20944/preprints202002.0172.v1

prediction of jaggery mass during drying inside the natural convection greenhouse
dryer,” International Journal of Ambient Energy, 2014 : 37–41.
[13] P. Jagannadha Rao, M. Das, and S. Das, “Jaggery – A Traditional Indian Sweetener,”
Indian J. Tradit. Knowl.2007; 6(1): 95–102.
[14] S. R. M. and G. C. DE D. MANDAL*, S. TUDU, “Effect of Common Packing Materials
on Keeping Quality of Sugarcane Jaggery during Monsoon Season,” Sugar Tech. 2006;
8: 137–142.
[15] Chua, K. J., & Chou, S. K. “Low-cost drying methods for developing countries,” Trends
in Food Science & Technology 2003, 14(12):519-528.
[16] Suhaimi, Misha. “Review on the application of a tray dryer system for agricultural
products,” World applied sciences journal 2013, 22(3):424-433.
[17] Mabrouk, S. B., Khiari, B., & Sassi, M. “Modelling of heat and mass transfer in a tunnel
dryer,” Applied thermal engineering 20016, 26(17-18):2110-2118.
[18] Kilpatrick, P. W., Lowe, E., & Van Arsdel, W. B. “Tunnel dehydrators for fruits and
vegetables,” Advances in food research 1955, 6(360):60126-30.
[19] Krokida, M. K., Karathanos, V. T., Maroulis, Z. B., & Marinos-Kouris, D. “Drying
kinetics of some vegetables,” Journal of Food engineering 2003, 59(4): 391-403.
[20] Jagannadha Rao, P. V., Das, M., & Das, S. K. “Effect of moisture content on glass
transition and sticky point temperatures of sugarcane, palmyra‐palm and date‐palm
jaggery granules”. International journal of food science & technology 2010, 45(1):94-
104.
[21] R. N. Putra and T. A. Ajiwiguna, “Influence of Air Temperature and Velocity for Drying
Process,” Procedia Eng.2017;170: 516–519.
[22] Kumar, A., & Tiwari, G. N. “Effect of shape and size on convective mass transfer
coefficient during greenhouse drying (GHD) of jaggery,” Journal of food engineering
2006, 73(2):121-134.
[23] Dinçer, İbrahim, and Calin Zamfirescu. Drying phenomena: theory and applications.
John Wiley & Sons, 2016.
[24] Geankoplis, Christie J. Transport processes and separation process principles:(includes
unit operations). Prentice Hall Professional Technical Reference, 2003.
[25] Brkić, D. “An explicit approximation of Colebrook's equation for fluid flow friction
factor,” Petroleum Science and Technology 2011, 29(15):1596-1602.
Preprints (www.preprints.org) | NOT PEER-REVIEWED | Posted: 13 February 2020 doi:10.20944/preprints202002.0172.v1