design of the skybus sb-400 high capcity short range
TRANSCRIPT

Kennesaw State University Kennesaw State University
DigitalCommons@Kennesaw State University DigitalCommons@Kennesaw State University
Senior Design Project For Engineers Southern Polytechnic College of Engineering and Engineering Technology
Fall 12-5-2019
Design of the Skybus SB-400 High Capcity Short Range Transport Design of the Skybus SB-400 High Capcity Short Range Transport
Aircraft Aircraft
Alexander Barroso Kennesaw State University
Austin Klee Kennesaw State University
Chandler Palmer Kennesaw State University
Follow this and additional works at: https://digitalcommons.kennesaw.edu/egr_srdsn
Part of the Engineering Commons
Recommended Citation Recommended Citation Barroso, Alexander; Klee, Austin; and Palmer, Chandler, "Design of the Skybus SB-400 High Capcity Short Range Transport Aircraft" (2019). Senior Design Project For Engineers. 30. https://digitalcommons.kennesaw.edu/egr_srdsn/30
This Senior Design is brought to you for free and open access by the Southern Polytechnic College of Engineering and Engineering Technology at DigitalCommons@Kennesaw State University. It has been accepted for inclusion in Senior Design Project For Engineers by an authorized administrator of DigitalCommons@Kennesaw State University. For more information, please contact [email protected].

ISYE 4803: The Skybus SB-400 Short Range
Transport Aircraft
12-5-2019
Group Name:
Skybus
Members:
Austin Klee
(Project Coordinator, Financial Officer, Systems Engineer,
Propulsion Specialist)
Alex Barroso
(Airframe Engineer, Flight Dynamics Tester, Simulation Expert)
Chandler Palmer
(CAD Modeling Lead, CFD Expert, Airframe Engineer)

1 - SkyBus SB-400
Table of Contents Executive Summary 5
Chapter 1: Requirements and Mission Profile 6
1.1 Introduction 6
1.2 Overview 6
1.3 RFP Requirements 8
Chapter 2: Market Studies 9
Chapter 3: Initial Design 12
Chapter 4: Initial Sizing 14
4.1 Initial Weight Estimation 14
4.2 Thrust-to-Weight Ratio and Wing Loading 15
4.3 Initial Wing Geometry 16
4.4 Revised Weights 19
4.5 Revised Wing Geometry 20
4.6 Initial Tail Surface Sizing 21
Chapter 5: Aircraft Configurations 23
5.1 Fuselage Configurations 23
5.2 Wing Configurations 23
5.3 Tail Configurations 24
Chapter 6: Passenger Compartment Layout 25
6.1 Seats 25
6.2 Seat Layout 26
6.3 Fuselage Design 27
Chapter 7: Design Procedure 32
7.1 Wing Layout 32

2 - SkyBus SB-400
Chapter 8: Engine Selection 33
Chapter 9: Costs and Economics 38
Chapter 10: Final Design 42
Chapter 11: Conclusion 45
Chapter 12: Appendices 46
12.1 Acknowledgments 46
12.2 Appendix I: Initial Wing Geometry Equations 46
12.3 Appendix II: Revised Weights 47
Appendix III: Project Promotion Video Link 47
Chapter 13: Resources 48

3 - SkyBus SB-400
List of Figures
1.1 Passenger Airliner Mission Profile 7
2.1 Load Factor vs. Break Even Load Factor Bar Chart 10
4.1 NASA SC(2)-0714 AIRFOIL 18
4.2 Drag Polar Diagram of NASA SC(2)-0714 Airfoil 18
4.3 Lift vs. Angle of Attack Diagram for the NASA SC(2)-0714 Airfoil 19
4.4 SB-400 CAD Top View Drawing 22
6.1 Initial Seat Design 25
6.2 Business and Economy Seat Comparison 26
6.3 Preliminary Seat Layout 27
6.4 Dimensions for 3 by 3 Seat Configuration with a Single Aisle 28
6.5 Fuselage Cross Section in Economy Class 29
6.6 Isometric View of Fuselage Cross Section 30
6.7 SB-400 Side View Drawing 31
7.1 Section View of the Wing with the NASA SC(2)-0714 Airfoil 32
7.2 Front View of the Wing 32
8.1 Candidate Engine Efficiencies in Cruise and Max Thrust 35
9.1 Air Cargo Trade Shares 40
9.2 Rate for Cargo Transport vs. Demand 41
10.1 SB-400 CAD Model Isometric View 42
10.2 SB-400 CAD Model Front View 42
10.3 SB-400 CAD Model Side View 43
10.4 SB-400 CAD Model Top View 44

4 - SkyBus SB-400
List of Tables
1.1 AIAA RFP Requirements 8
4.1 Standard vs Composite Construction Trade Study 15
4.2 Required Wing Loadings for Differing Flight Conditions 15
4.3 Initial Wing Geometry Values 17
4.4 Revised Weights 20
4.5 Revised Wing Geometry 21
4.6 Values for the Initial Tail Surface Sizing 21
6.1 Seat Configurations and Respective Fuselage Dimensions 29
6.2 Seat Configurations and their Required Fuselage Sizes 30
8.1 Candidate Engine Performance Data 35
8.2 Comparison of Engine Parameters 36
8.3 Comparison Data between the SB-400 with the Trent 7000 Versus Current
Airliner Offerings
38
12.1 Spreadsheet for Revised (Improved) Weight Calculations 47

5 - SkyBus SB-400
Executive Summary
As air travel becomes more and more affordable and the world economy expands, so
does the demand for flights. Major commercial airports and their infrastructure are struggling to
keep up with this increased demand. The AIAA has identified this problem and has put out a
Request for Proposal for a High Density Short Range Transport Aircraft which can carry 400
people in a two class configuration up to 3,500 nautical miles. The Skybus SB-400 is our clean
slate design response to the AIAA’s RFP for a High DensityShort Range Transport Aircraft. an
increasing part of everyday life. Our focus for the design was to increase efficiency and therefore
economics utilizing new technologies in materials for structures, a modern engine selection, as
well as optimizing the design for a 700 nautical mile mission by way of aerodynamics and cargo
capacity.

6 - SkyBus SB-400
Chapter 1: Requirements and Mission
Profile
1.1 Introduction
As individual country’s economies have advanced and expanded alongside an ever
growing globalistic world, air travel has become an increasing part of everyday life. From the
way we conduct business to the way cross continental travel expands our world view and onto
the way we get the food we eat to the way we conduct war, air travel has had an incalculable
impact on the way humanity exists now and will in the future.
This growing demand for commercial air travel has led to an increasing congestion at
major airports worldwide and the gate capacity of the airports cannot keep up with the number of
flights demanded by the airlines. The problem we seek to solve is both meeting current and
future demand between major hubs while reducing airport congestion through a high capacity
short range aircraft, the Skybus SB-400.
1.2 Overview
The following section outlines the guidelines set in AIAA’s Request for Design Proposal
for a high density, short range airliner. The primary design mission is a 700 nmi passenger flight,
but the aircraft must be able to complete a 3,500 nmi flight with legal reserves so that will be the
design mission profile. The 3,500 nmi passenger flight with reserves is shown below in Figure
1.1. The mission profile requires that fuel for a possible diversion is accounted for in case of bad
weather or airport closure. A diversion distance of 150 nmi was assumed for the mission profile,
as that will allow the aircraft to reach a diversion airport within 30 minutes at cruise speed.

7 - SkyBus SB-400
Figure 1.1: Passenger Airliner Mission Profile

8 - SkyBus SB-400
1.3 RFP Requirements
Table 1.1: AIAA RFP Requirements

9 - SkyBus SB-400
Chapter 2: Market Studies
Regional air travel has not always been confined to 150-seat, smaller aircraft. The
problem with airport congestion is a new one, but aircraft capacity’s role in the issue is an
interesting story of air travel coming full circle. In past decades, airlines did in fact utilize
widebody higher-capacity aircraft for shorter trips. Coast-to-coast or shorter hops like trips from
Boston to Detroit were taken on 250-300 seater DC-10s, L-1011s or 747s. The first Airbus, the
A300, was a widebody plane designed specifically for short and medium-haul routes. The A300
as operated by Eastern actually used to shuttle 250 passengers on half hour flights between
Boston, New York and Washington [1].
So why did the airline industry adopt an approach that turned away from this model into
one that offers smaller aircraft more frequently? There are numerous reasons. Technological
advancement has allowed smaller jets with limited capacity to be profitable, which was not
possible during the prime of the A300. Additionally, the Airline industry has expanded and the
number of players in the game is substantially higher now than at any time in the past, providing
customers with a greater number of options to get from point A to B. Finally, the biggest factor
that led to the phasing out of higher capacity aircraft for short hops was the use of frequency as a
selling point. Having 6 flights daily between Atlanta and New York on a single airline allows
customers greater flexibility to travel according to their schedule instead of the airline’s.
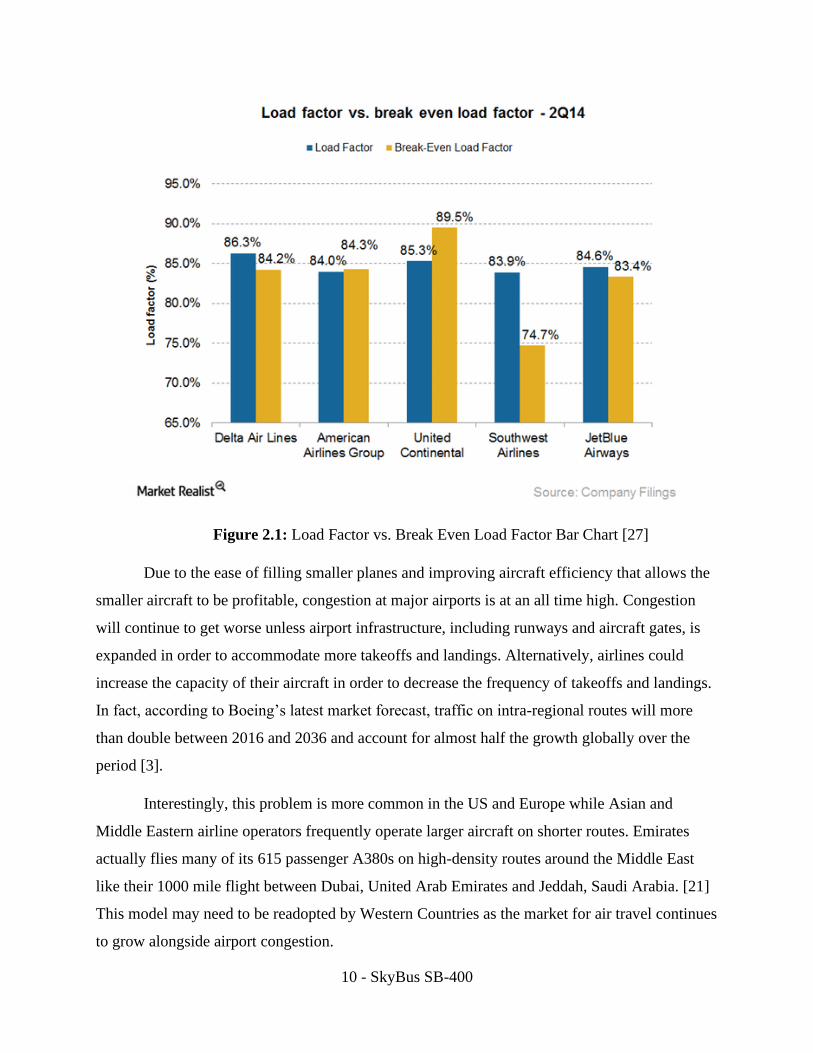
Airlines use a metric called breakeven load factor to determine what percentage of a
plane must be occupied to cover their costs. Perhaps one of the most compelling reasons airlines
currently utilize the smaller aircraft is because they are easier to fill and this allows them to hit or
exceed their breakeven load factor more reliably [2]. In 2018, the average airline load factor hit a
high of 81.7% indicating that airliners across the board were on average 81.7% full. Figure 2.1
below shows load factor vs their break-even load factor for various airlines below. The greater
the difference between these two numbers the more profitable the airline.
10 - SkyBus SB-400
Figure 2.1: Load Factor vs. Break Even Load Factor Bar Chart [27]
Due to the ease of filling smaller planes and improving aircraft efficiency that allows the
smaller aircraft to be profitable, congestion at major airports is at an all time high. Congestion
will continue to get worse unless airport infrastructure, including runways and aircraft gates, is
expanded in order to accommodate more takeoffs and landings. Alternatively, airlines could
increase the capacity of their aircraft in order to decrease the frequency of takeoffs and landings.
In fact, according to Boeing’s latest market forecast, traffic on intra-regional routes will more
than double between 2016 and 2036 and account for almost half the growth globally over the
period [3].
Interestingly, this problem is more common in the US and Europe while Asian and
Middle Eastern airline operators frequently operate larger aircraft on shorter routes. Emirates
actually flies many of its 615 passenger A380s on high-density routes around the Middle East
like their 1000 mile flight between Dubai, United Arab Emirates and Jeddah, Saudi Arabia. [21]
This model may need to be readopted by Western Countries as the market for air travel continues
to grow alongside airport congestion.

11 - SkyBus SB-400
In Australia, Qantas Airways is seeking to solve that exact problem. At Sydney Airport, a
flight takes off for Melbourne about every 10 minutes. Quantas mostly serves the Sydney-
Melbourne-Brisbane triangle with Boeing 737s that carry 174 passengers. To replace that with a
plane capable of carrying 240 people would shift the same number of passengers down to 73
percent of the landing slots. To replace that with a 400 passenger plane would further reduce that
to less than 50% of the landing slots allowing for greater on-time reliability as a result of reduced
congestion [3]. While there are already existing high density aircraft such as the A380, they are
designed for long range flights of 6,000+ nmi and are not optimized for the short range missions
which leaves an opening for a new, short range optimized design.

12 - SkyBus SB-400
Chapter 3: Initial Design
Minimum Success Criteria
We must minimize operating cost of the aircraft based on a reference mission of 700 nm.
Operating cost should include at a minimum: Fuel/energy cost, other consumables (oil, tires,
etc), pilot and flight attendant cost, and maintenance cost. We also must demonstrate reliability
equal or better than that of comparable aircraft, maintenance costs equal or better than that of
comparable aircraft, and an aircraft purchase price competitive with comparable aircraft while
using industry standard profitability models.
Verification Approach
Using existing fuselage, airfoil, and engine data, verification will be meeting required
aerodynamic criteria while simultaneously improving some flight characteristics (fuel efficiency,
flight time, thrust to weight, etc) relating to flights of 700 nm compared to current airliner
offerings. If time allows, once an initial CAD model and CFD analysis completed, the model and
simulation data will be transferred to a flight simulator in order to test flight characteristics
Problem Solving Approach
The first step to solving the challenge of efficient high capacity short range transport was
to document and understand the metrics and tradeoffs involved with improving aircraft
efficiency. We approached this problem from both an aerodynamic and propulsive perspective
alongside a flight economics standpoint, because of the multiple dimensions of efficiency in
play.
Methods of Improving Aircraft Efficiency
● TSFC
● Thrust/Weight
● Propulsive Efficiency
● L/D Ratio
● Wing/airfoil optimization for the given mission

13 - SkyBus SB-400
Methods of Improving Flight Economics
Increased Cargo
One of the methods we are researching into improving the overall economics of flight is
by way of increasing the cargo carrying capacity of our short range transport plane. In 2017,
$11.9 billion in cargo revenues were generated via cargo in passenger planes in aircraft cargo
holds representing 12% of all air cargo transport revenues [4]. Utilizing a larger, wide bodied
aircraft with a maximum range of 3,500 nm that will be optimized to serve 700 nm flights for
400 passengers, the potential for cargo revenue could help offset some costs required by the
necessary thrust and fuel requirements of a larger aircraft for these shorter flights. Specifically
when dealing with major hubs, the demand for cargo transportation will grow faster than the
demand for passenger flights with the rapid growth of e-commerce.
Decreased cost per hour/Passenger
A secondary aspect we have sought to benefit from as a product of utilizing higher
passenger aircraft is a lower cost per hour/passenger. With the greater the number of passengers,
we believe we can significantly reduce the costs per passenger per hour over existing smaller
aircraft with substantially more engine cycles and takeoffs and landings. This will be proven
through reducing the fuel, staffing, and maintenance requirements as well as airport landing and
gate fees and dividing them amongst the number of passengers. We believe that our break even
load factor can be reduced beyond what is currently capable amongst aircraft currently operating
in our target range of 700 nm by optimizing the aircraft for said mission.

14 - SkyBus SB-400
Chapter 4: Initial Sizing
4.1 Initial Weight Estimation
With the requirements for the transport aircraft specified, the initial weight estimation
technique from [5] was utilized to get a first estimation of the aircraft’s gross weight. The design
variables that had to be chosen were the wing aspect ratio in order to determine the lift to drag
ratio and the cruise speed. Existing aircraft were used as reference in order to make the required
initial design choices.
The Boeing 757, 767, 777, and 787 were used as benchmarks to base our aircraft’s wing
aspect ratio and design cruise speed. The aspect ratios of the reference aircraft were between 8
and 10.6 [6], with the more modern 787 utilizing the highest wing aspect ratio of 10.6 which it is
able to achieve thanks to the added strength of the composite wing structure [7]. The high aspect
ratio of the modern 787 points to a new design trend of increasing wing aspect ratio, so a middle
ground number of 9 was selected for initial weight estimation. The newer long haul Boeing 777
and 787 cruise at close to or at Mach 0.85 while the older short haul Boeing 757 and 717 cruise
at mach numbers between 0.77 and 0.80 [8], [9], [10]. A design cruise speed of 0.85 mach was
selected to match the more modern aircraft.
Using the design choices and the initial weight estimation techniques from [5], the
calculated gross weight rounded to the nearest hundred pound was found to be 405,100 lbs. A
trade study was then conducted in order to figure out the weight savings of composite
construction. Using Raymer’s composite construction fudge factor of multiplying 0.95 times the
calculated empty weight fraction, a result of a gross weight of 370,200 lbs was obtained which is
a 9% reduction in gross weight. The results of the trade study can be seen in Table 4.1 below.

15 - SkyBus SB-400
Table 4.1: Standard vs Composite Construction Trade Study
4.2 Thrust-to-Weight Ratio and Wing Loading
In order to determine the thrust-to-weight ratio (T/W) and subsequently the wing loading
(W/S) of our aircraft we consulted the techniques found in [5]. We utilized the statistical and
“Thrust Matching” techniques in order to determine a baseline T/W requirement. The statistical
method yielded a higher required T/W value that was somewhat greater than other existing
aircraft such as the Boeing 787-10 [8] while the “Thrust Matching” method resulted in a value
marginally lower than the B787-10. The higher value of 0.252 from the statistical method was
chosen as recommended by Raymer. With a T/W value selected, a W/S value could be
determined using Raymer’s equations for different flight conditions. The results of the solved
equations can be found in Table 4.2.
Table 4.2: Required Wing Loadings for Differing Flight Conditions
The requirements from Table 1.1 were used to determine the values for the variables in
the equations. For the stall condition, a stall speed of 111 knots was selected as the requirements
state an approach speed of 145 knots. FAR 25 requires that the approach speed to be 1.3 times

16 - SkyBus SB-400
the stall speed [5], which resulted in a stall speed of 111 knots. The stall condition provided the
lowest required wing loading of 100.24 lb/ft^2, which is reasonable but marginally low when
compared to other widebody aircraft. The Boeing 787-10 and 767-400 have takeoff wing
loadings between 138 and 144 lb/ft^2 [8], [11]. The maximum coefficient of lift may need to be
increased using a more advanced flap system in order to increase the wing loading for increased
cruise efficiency. With that in mind, a design lift coefficient of 105 lb/ft^2 was selected.
However, due to the short amount of time spent at cruise in the 700 nmi mission, the lower wing
loading could prove to be beneficial in the climb and descent regions of flight.
4.3 Initial Wing Geometry
With the required wing loading calculated, the initial wing geometry was designed using
equations from [5] which can be seen in Appendix I. Using the preliminary gross weight as
calculated in section 4.1 and the required wing loading found in section 4.2, the reference wing
area was found by dividing the gross weight by the wing loading. With the reference wing area
found, the wing span was calculated using the aspect ratio selected in section 4.1. The rest of the
initial wing geometry was selected by either referencing historical airliner wing geometry values
as well as values suggested by Raymer in [5]. For example, the typical historical value for the
wing dihedral on Boeing transport aircraft is 6 degrees [12], Raymer in [5] suggests a value of 3
to 7 degrees for a low, swept subsonic wing. An initial dihedral angle of 4 degrees was chosen
for our aircraft due to the composite wings which will flex more in flight, requiring less static
dihedral angle than conventional wings. The remaining wing geometry values can be found in
Table 4.3

17 - SkyBus SB-400
Table 4.3: Initial Wing Geometry Values
At this stage of the design, we have selected the NASA SC(2)-0714 supercritical airfoil
as our candidate airfoil. Utilizing a modern supercritical airfoil was necessary due to the high
subsonic cruise speed that we are targeting. A supercritical airfoil is “characterized by a large
leading-edge radius, reduced curvature over the middle region of the upper surface, and
substantial aft camber” [13].
These qualities make the supercritical airfoil well suited to high subsonic speeds where
airflow along the upper surface of the wing may be traveling at speeds above Mach 1. When
approaching the speed at which supersonic flow first appears on the upper wing surface, known
as “critical Mach”, shocks will form on the wing, causing boundary layer thickening and
eventually separation, resulting in a sharp increase in drag. The flatter upper surface of the
supercritical airfoil reduces the intensity of the shock, delaying the onset of boundary layer
separation and increasing the critical Mach number [5], [13].
While the Supercritical airfoils allow for an increase in high subsonic cruise through an
increase in critical Mach number, they do not sacrifice low speed and transient performance or
stability [13]. The selected supercritical airfoil has a maximum thickness to chord ratio of 14%,
as seen in Figure 4.1 which should provide ample coefficients of lift at high angles of attack in

18 - SkyBus SB-400
order to satisfy the takeoff, climb, and landing requirements. Airfoil data for modern airliners to
use as reference is difficult to come by as most airliners use application unique airfoils which are
held as trade secrets, however, limited data for the Boeing 767 is available. The Boeing 767
variants are known to use a proprietary supercritical airfoil with a maximum thickness to chord
ratio of 15.1% at the root and 10.3% at the tip [14]. This indicates that a 14% ratio should be a
good starting point and that it may be worthwhile to experiment with a thinner supercritical
airfoil at the tip of the wing.
Figure 4.1: NASA SC(2)-0714 AIRFOIL [15]
Figure 4.2: Drag Polar Diagram of the NASA SC(2)-0714 Airfoil [15]

19 - SkyBus SB-400
Figure 4.3: Lift vs. Angle of Attack Diagram for the NASA SC(2)-0714 Airfoil [15]
4.4 Revised Weights
With the initial wing geometry selected, an improved method of weight estimation
equations from [5] were utilized in order to provide a more accurate initial weight estimate. The
spreadsheet used for these calculations can be found in Appendix II. This method is more
accurate in numerous ways, including taking into account the fuel burned at each mission
segment and taking that weight loss into account for the fuel burn of the next mission segment.
The weight results from using the method as provided in section 6.3 of [5] are listed in Table 4.4,
and resulted in a gross weight estimation that was 16.1% greater than the initial weight
estimation.
However, when comparing the new weight results to the Boeing 787-8, the new result
seems reasonable. The B787-10 has a range of 6,430 nmi, 1.84 times greater than the SB-400’s
design range and a fuel weight of 248,866 lbs which is 1.96 times greater than the SB-400’s
calculated fuel weight. Both values are nearly two times that of the SB-400’s range and fuel
weight, which makes for a reasonable assumption that a modern composite aircraft with twice
the range of the SB-400 would require twice the fuel capacity.

20 - SkyBus SB-400
Table 4.4: Revised Initial Weights
4.5 Revised Wing Geometry
With the large increase in weight incurred after revising the weight estimate, the
wing geometry needed to be revised in order to meet the target wing loading. With a higher wing
area required in order to achieve the target wing loading, the wingspan and/or wing chord had to
be increased. At this point, it was decided that the aspect ratio could be increased to 10 in order
to further increase SB-400’s aerodynamic efficiency and more closely match the higher aspect
ratios of modern airliners. The only consideration towards limiting the aspect ratio is the wing
span and the logistical consequences of a large wing span.
Most all major airports are capable of handling Group V aircraft, or aircraft with a
wingspan up to but not including 214 ft. Aircraft with a wingspan of 214 ft up to but not
including 262 ft are considered Group VI aircraft consisting of only two aircraft, the Boeing 747-
8 and Airbus A380 [15], [16]. Group VI equipped airports are limited, as are the gates actually
equipped to handle Group VI aircraft at those airports. Therefore, it’s important that the SB-
400’s span be kept well under the Group VI threshold for ease of movement around the airport as
well as plenty of compatible gates. The revised wing geometry can be found in Table 4.5.

21 - SkyBus SB-400
Table 4.5: Revised Initial Wing Geometry
4.6 Initial Tail Surface Sizing
With the revised initial wing geometry completed and the length of fuselage known from
the layout completed in section 6.3, the tail surface areas could be calculated. The tail surface
areas were calculated using equations from [5] involving an estimated required tail moment arm
based upon the fuselage length. The results of the equations can be seen in Table 4.6 below.
Table 4.6: Values for the Initial Tail Surface Sizing
The dimensions specified as results of the revised wing and tail geometry can be seen in a
final CAD drawing in Figure 4.4.

22 - SkyBus SB-400
Figure 4.4: SB-400 CAD Top View Drawing

23 - SkyBus SB-400
Chapter 5: Aircraft Configurations
5.1 Fuselage Configurations
The main requirement for the fuselage is to accommodate the RFP’s requirement for 50
business class seats, 350 economy seats as well as enough galleys, lavatories, and exits that meet
14 CFR Part 25 requirements. The fuselage will need to have a minimum of two doors, but will
have more due to exit requirements for such a high passenger capacity aircraft. At least two
cargo doors beneath the passenger compartment will be necessary in order to load and unload
cargo and luggage from the cargo hold. The seating arrangement in regards to seat per-row is to
be determined by fuselage width to length ratios, or the fineness ratio, but it is known that at least
two separate isles will be required based upon historical reference aircraft. In regards to fuselage
shape, the traditional cigar shape as found on other airliners is known to be the most ideal shape
for the fuselage due to ease of construction and efficiency.
5.2 Wing Configurations
Most historical reference airliners utilize a low wing design. Other options including
high-wing, and even delta-wing configurations were considered. A delta wing design was
considered for a very high subsonic speed airliner, cruising somewhere around Mach .95-.98, but
it was decided that so little time is spent at cruise for the desired 700 nmi mission that the initial
purchase and operating expenses of such a complex aircraft could not be justified. The high-wing
configuration had the added benefits of easier loading and unloading of cargo and passengers as
well as being able to fit large diameter turbofans without a tall landing gear which reduces
landing gear weight. However, the trade-offs were numerous. The engines next to the fuselage
would cause increased cabin noise, the required T-Tail would complicate tail maintenance and
add increased mechanical complexity and weight, landing gear placement would involve
compromises, and the overall weight of the design would likely be higher. In the end, the
conventional low wing design was selected.

24 - SkyBus SB-400
5.3 Tail Configurations
The selection of the tail configuration for the SB-400 was straightforward. Without a high
wing design or plans for rear mounted engines, the added weight and complexity of a T-Tail was
unnecessary. T-Tails also have a tendency to suffer from deep stalls, a situation where the
elevator control surface on the T-Tail is blanketed by the wake from the wing when in a stall at
an extremely high angle of attack, causing an unrecoverable stall. Because of those factors a tried
and true conventional tail, with a horizontal stabilizer located low on the empennage and a
separate vertical stabilizer, was selected.

25 - SkyBus SB-400
Chapter 6: Passenger Compartment Layout
6.1 Seats
The first step we took to design the plane was defining our passenger seating and seat
layout. From the seat requirements defined by the proposal, a seat was designed for both the
economy and business class sections. The seats were placed in various configurations to
determine the best passenger compartment layout.
Figure 6.1: Initial Seat Design
The Business class seats are 21 inches wide with a 36 inch pitch. The seats are 52 inches tall to
accommodate the 95th percentile of the American population(1). The arm reset are 3 inches wide
to add to the ‘luxury’ of Business class when compared to Economy. The storage available
underneath each Business class seat is 21 inches wide by 12 inches tall by 22 inches deep to
make 3.2 cubic feet of individual passenger cargo space. The economy seat has a pitch of 32
inches, a seat width of 18 inches, and a height of 48 inches. The armrests are 2 inches wide and
the storage beneath each seat is 18 inches wide by 12 inches tall by 20 inches deep to make 2.5
cubic feet of personal cargo space, half of the overall requirement per passenger.

26 - SkyBus SB-400
Figure 6.2: Business and Economy Seat Comparison
6.2 Seat Layout
From the seat design, a preliminary floor layout can be created. Multiple seat
configurations were designed to get an idea of the best floor plan. To fit the required seats in the
fuselage, a 3-4-3 row layout was created for the Economy class in combination with a 3-3-3 row
layout for the Business class. This layout seats 350 passengers in Economy class and 54
passengers in Business class. Though this initial layout does not account for necessary
emergency exit doorways and proper galley areas, the layout allows us to get an idea of the
required fuselage length and diameter for initial sizing.

27 - SkyBus SB-400
Figure 6.3: Preliminary Seat layout
6.3 Fuselage Design
With the business and economy class seats designed to meet the specifications set forth,
the design of the fuselage can be created from the inside, out. The fineness ratio refers to the
ratio of an aircraft's fuselage length to its diameter. Using the seats that have been designed we
can determine the aircrafts inner diameter then find the overall fuselage length or that given
diameter. Comparing the length the fineness ratio determines will ultimately help determine the
seat layout within the cabin.
The outermost passenger in a row of seats must have a radius of 10 inches of head space from
where their eyes are. For an average sitting passenger their eyes, when accounting for seat width
and armrest width, is located 11 inches from the outermost part of the row and 48.5 inches from
the ground.

28 - SkyBus SB-400
Figure 6.4: Dimensions for 3 by 3 Seat Configuration with a Single Aisle
A 3-3, 2-3-2, 3-3-3, and 3-4-3 seat configurations were designed and the minimum
possible floor spans for the restrictions we have set in place can be seen in Table 6.1.
Table 6.1: Seat Configurations and Respective Fuselage Dimensions
Seat Configuration Floor Width Inner Diameter
3-3 144 in 151.65 in
2-3-2 186 in 191.67 in
3-3-3 226 in 230.48 in
3-4-3 246 in 250.03 in
An additional six inches is added on to account for structural thickness differences
between the outer and inner diameter [5]. This outer diameter for each seat configuration can
then be used to determine the respective fuselage length. For nearly all subsonic aircraft, the
fineness ratio falls between 6-8 [5]. We will assume a fineness ratio of 7 for our rough length

29 - SkyBus SB-400
approximations. With all the outer diameters determined, the fuselage length for each seat layout
is determined.
Table 6.2: Seat configurations and their respective required fuselage sizes.
Seat Configuration Outer Diameter Fuselage Length
3-3 157.65 in
(13.14 ft)
1103.52 in
(91.96 ft)
2-3-2 197.67 in
(16.47 ft)
1383.68 in
(115.31 ft)
3-3-3 236.48 in
(19.71 ft)
1655.33 in
(137.94 ft)
3-4-3 256.03 in
(21.34 ft)
1792.19 in
(149.35 ft)
Figure 6.5: Fuselage Cross Section in Economy Class

30 - SkyBus SB-400
Figure 6.6: Isometric View of Fuselage Cross Section
The completed fuselage assembly can be found in Figure 6.7. With the addition of the
nose/cockpit, the empennage section, the required emergency exits and galley areas, and the
selected 3-4-3 seat layout for economy class the total length of the fuselage came out to be 201’
and 11”.

31 - SkyBus SB-400
Figure 6.7: SB-400 Side View Drawing

32 - SkyBus SB-400
Chapter 7: Design Procedure
7.1 Wing Layout
Figure 7.1: Section View of the Wing with the NASA SC(2)-0714 airfoil
Figure 7.2: Front View of the Wing

33 - SkyBus SB-400
Chapter 8: Engine Selection
The new jet age will be one not marked by high performance afterburning engines and
aircraft more capable than the humans that fly them; rather, the new jet age is an efficiency
driven one that will see engines with ultra-high bypass ratios, geared turbofans, and materials
capable of withstanding temperatures unheard of. Our engine selection for the SB-400 required
an initial determination of required thrust. We utilized both the statistical method and the “Thrust
Matching” method and determined our optimal thrust/weight value will be 0.252. We previously
determined our empty weight to be 213,572 lb or 106,786 kgs. Using this we determined that we
needed engines that could produce at least 211.88 kN or 47,630 lbf of thrust, more once we
determined cargo, fuel, passenger and baggage weight. For similarly sized aircraft, we
determined that most aircraft had a maximum takeoff weight greater than double their empty
weight. selected five engines that produce between 327kN or 73,000lbfs and 419kN or
95,000lbfs of thrust and are currently in operation or have been tested for future use.
Baseline Engine: Pratt Whitney PW4052
We decided to use the Pratt Whitney PW4052 as our baseline engine because it produces thrust
in excess of our needs for an empty aircraft with 52,000 lbf or 231.3 kN and it has one of the
most efficient engines currently in operation with a stated TSFC of 0.312 or 8.834 g/s*kN. [28]
The PW4052 is currently utilized on the 767-200ER/-300ER.
Baseline Fuel Burn
One of the current aircraft we have designed our Skybus SB-400 around is the 777-300 due to its
similar passenger capacity and widespread use. In order to improve the economics of flight in
this size aircraft, we used the fuel burn at cruise for a 777-300 ER which is estimated at 7.5
tons/hour. [30] This equates to a fuel burn of 15,000lbs/hr as our benchmark value to beat. We
also believe we can beat the economics per passenger of an aircraft typically used in 700nm
flights, the 737-800.
Engine Summary

34 - SkyBus SB-400
We The five engines and performance data can be seen in Table 8.1 below. Baseline
Output, Pressure ratios, BPR, and fuel flow data was obtained from the ICAO databank [28] at
different flight conditions.
Table 8.1: Candidate Engine Performance Data
The data can be seen to indicate that the four engines all have similar thrust specific fuel
consumption rates and the rated output thrust is also close amongst all engines. In looking for a
dual engine setup capable of producing more than 600kN of thrust, all meet the minimum
requirements but not all are equally suited to our mission. In Table 8.2 below, it can be seen that
the lowest fuel per passenger per hour is for the baseline engines; however, the baseline engines
do not have adequate thrust for our purposes, lacking our minimum threshold by approx 140kN.
Therefore, the engine with the minimum fuel per passenger per hour that meets all requirements
is the Trent 7000-72.

35 - SkyBus SB-400
Table 8.2: Comparison of Engine Parameters
The engine comparison by TSFC at cruise as well as maximum thrust can also be seen in
Figure 8.1 below.
Figure 8.1: Candidate Engine Efficiencies in Cruise and Max Thrust
It should be noted that TSFC is lower than the values we would expect operationally. In a
paper Titled Analysis of Aircraft Fuel Burn and Emissions in Landing and Take Off Cycle using
Operational Data, Messrs. Chati and Balakrishnan detail the shortcomings of ICAO test methods,
which are conducted at static sea level static ISA (SLS-ISA) conditions. Additionally the data
collected is modeled only tor Landing and Takeoff cycles which represent only flight cycles that
happen below 3,000 ft above ground level (AGL) ICAO’s methodology assumes that

36 - SkyBus SB-400
irrespective of aircraft/engine type and the airport of operation, the takeoff roll occurs at a
constant 100% thrust setting for 42 seconds, the climbout at a constant 85% thrust setting for
240s and the taxi/ground idle at a constant 7% thrust setting for 1560s. [31] The aforementioned
paper utilizes data from flight data recorders (FDR) and adjusts them to equivalent SLS-ISA
conditions and found that the ICAO databank is found to typically overestimate the mean times
in various flight modes by as much as 52%, and typically underestimate the operational values of
fuel flow rates.
Despite the shortcomings of the ICAO testing, the data provided is objective and
represents performance data under near identical situations. This allows us to compare the data
and make a determination of the best engine for our need and gauge a rough estimate of range
and payload capacity.
Decision Making Process
To determine the best engine for our needs, we needed to also determine the economics
and value of adding thrust in terms of cargo carrying capacity. In that sense, the two most
important metrics for our determination were thrust as well as TSFC.
Engine Selection: Trent 7000-72
The Rolls-Royce Trent 7000 is designed as an exclusive engine for the Airbus A330neo family
and borrows architecture from the Trent 1000 TEN – the latest version of the Trent 1000 Engine,
technology from the Trent XWB – the world’s most efficient large civil engine, and the Trent
700 – the engine of choice for the current A330. The Trent 7000 reduces specific fuel
consumption by 10% and has twice the bypass ratio as compared to the Trent 700 and also has a
noise reduction of 6dB.
The Rolls-Royce Trent 7000 features a pressure ratio of up to 50, utilizes Advanced materials
and ceramic coatings on High Pressure turbine blades that operate in temperatures of 1700C, and
utilizes 24/7 engine health monitoring that relays performance information back to Rolls-Royce
allowing for immediate analysis and maintenance planning. [23]

37 - SkyBus SB-400
Based on ICAO testing, the engine has a rated output (Fmax) of 327.9 kN. For two engines, our
thrust output is 655.8 kN. At cruise the engine burns 1.34 kg/s of fuel which equates to a fuel
burn of 10,612 lbs/hr or 4824 kgs/hr. [28] When compared to the other engines as well as our
baseline fuel consumption model, our engine has a TSFC that is 22.9% better than the PW4052
and a fuel consumption per passenger per hour that is 23% better than the 737-800 and 41%
better than the 777-300ER.
As can be seen in Table 8.3 below, the Trent 7000-72 as installed on the SB-400 has
significantly reduced the cost per hour per passenger.
Table 8.3: Comparison data between the SB-400 with the Trent 7000 installed versus current
airliner offerings.

38 - SkyBus SB-400
Chapter 9: Costs and Economics
Current operating breakdown for US airlines is as follows:
• 44% is aircraft operating expense, which includes fuel, direct maintenance, depreciation,
and crew
• 29% is servicing expense
• Aircraft servicing (7%)
• Traffic servicing (11%)
• Passenger service (11%)
• 14% is reservations and sales expense
• 13% is overhead expense
• Advertising and Publicity (2%)
• General and Administrative (6%)
Our focus will be mostly on reducing aircraft operating expenses, however there will be
additional savings in servicing expenses by virtue of reduced takeoffs and landings due to greater
capacity. Our preliminary aircraft operating expenses as well as our targets for profitability
optimized for 700 nm flights are indicated below:
• Typical aircraft used in 700 nm flights
• Airbus A321
• Typical 700 nm flight ticket costs
• ATL - NYC (~660 nm) $129-$169 economy
• Hourly plane cost
• Airbus A321 (192 seats)
• $3,970/hr
• Fuel - $1,443

39 - SkyBus SB-400
• Aircrew - $570
• Maintenance - $727
• Income per flight: $169/seat x 192 seats = $32,448
• Cost per flight: 2 hours x $3,970 = $7,940
• Profit per ticket: $127.64 [29]
We are seeking to produce equal or greater profit per ticket than is currently available via
the Airbus A321 as well as substantially improved profitability over similar capacity aircraft on
the same 700 nm flight.
One of the methods we are seeking to improve this is by increasing cargo hold capacity to
tap into an underutilized market for passenger cargo hold transport. As e-commerce continues to
grow, we believe that to fully utilize the unique mission of this plane in serving major regional
hubs with a high capacity large body aircraft, we can offset and reduce the breakeven load factor
on a per passenger basis by increasing cargo carrying capacity. This also provides us the ability
to reach out and achieve the maximum range by reducing or eliminating extraneous non-
passenger cargo, thus reducing the weight and increasing fuel economy.
The value of goods carried by airlines is expected to exceed $6.2 trillion in 2018,
representing more than 35% of global trade by value [19]. This results in air cargo revenue in
excess of $100 billion, as shown in Figure 9.1 below.

40 - SkyBus SB-400
Figure 9.1: Air Cargo Trade Shares. [19]
To adequately portray the scale of the market and the growing trend, Boeing research
indicates the following:
“Overall, North America air cargo traffic grew 4.2 percent in 2016 and 10 percent in 2017. US domestic air cargo, which accounts for 96.4 percent of the North America market, grew 4.2 percent in 2016 and 10.3 percent in 2017, while Canadian domestic air cargo, 2.2 percent of the market, grew 4.8 and 4 percent, respectively, over the same time period. For 2017, transborder traffic from the United States to Canada made up 1.2 percent of the North America market; traffic in the opposite direction made up 0.2 percent.” [20]
Furthermore, Air Cargo World indicates:
“The number of airplanes in the worldwide freighter fleet will increase by more than 80 percent during the next 20 years, as demand for air cargo services nearly triples”[26]
Presently, only 30% of lower-hold capacity of new widebody aircraft has served primary
cargo airport routes. [22] This is because the bulk of widebody aircraft serves international long
distance travel and not the regional hub to hub transport sought for optimization by the SB-400.
“The vast cargo capacity of today’s large jets — the Boeing 777-300ER can carry more than 20
metric tons (44,000 lbs) in the holds in addition to a full load of 400 passengers — can make the
difference between profit and loss on a route. On average, 50% or more of international flights
are only profitable due to cargo’s contribution” [25]. Based on sabre airlines solutions’ pricing

41 - SkyBus SB-400
rates shown in Figure 9.2 below, this translates to revenue of $30,000 per flight in cargo in
addition to passenger revenue.
Figure 9.2: Rate for Cargo Transport vs. Demand [24]
The 777-300ER also has twice the range required by our aircraft and will primarily serve
hubs that are 10% of the maximum range of the 777-300ER. By taking advantage of the lesser
fuel requirements as well as the difference in typical passenger cargo requirements for an
international flight versus a regional flight, we are seeking to significantly increase the cargo
carrying capacity should the resulting math substantiate our belief that cargo can be a method for
increasing revenue without sacrificing optimum loads on 700 nm flights.

42 - SkyBus SB-400
Chapter 10: Final Design
Figure 10.1: SB-400 CAD Model Isometric View
Figure 10.2: SB-400 CAD Model Front View

43 - SkyBus SB-400
Figure 10.3: SB-400 CAD Model Side View

44 - SkyBus SB-400
Figure 10.4: SB-400 CAD Model Top View

45 - SkyBus SB-400
Chapter 11: Conclusion In conclusion, we were able to meet or exceed most minimum requirements while
simultaneously reducing the current cost per passenger on a 700 nm flight. Our carbon fiber
material choice prevents corrosion that can occur on aluminum aircraft, reducing maintenance, as
well as increasing the useful life cycle of the airframe all while reducing weight. The SkyBus can
carry 400 passengers burning 10,600 lbs/hr of fuel resulting in a fuel per passenger per hour rate
of 26.6 lbs/hr. As stated in Chapter 8, the SB-400 is more economical on 700 nm flights than
existing airliners which currently fulfill those routes. With an economically advantageous design,
airlines are more likely to show interest in the SB-400 which would lead to future success in
sales. However, more design refinement and analysis would need to be done in order to meet all
of the AIAA requirements. Therefore, a list of suggestions for future work has been placed
below.
● Further fleshing out of interior systems and more thorough weights and balances analysis
performed.
● Continued refinement of the main airfoil through CFD and flight sim analysis.
● Using simulation to confirm performance and stability of design.
● Continued wing and tail geometry iterations as the design develops with continued
analysis.

46 - SkyBus SB-400
Chapter 12: Appendices
12.1 Acknowledgments
Dr. Adeel Khalid: For his leadership and pioneering in KSU’s Aerospace minor program as
well as his continued support for students just like us in his Aerospace elective courses. Without
him, this project would not have been possible.
Dr. Charles Domercant: For his teachings in the Fundamentals of Aerodynamics course.
Ms. Christina Turner: For her role in keeping the Aerospace program running and her patience
in assisting us with our poster.
Mr. Daniel Kuemmerle: For his assistance in solving iteration problems with Microsoft Excel.
12.2 Appendix I: Initial Wing Geometry Equations
(1) 𝑆 =𝑊0
(𝑊/𝑆)
(2) 𝑏 = √𝐴 ∗ 𝑆
(3) 𝐶𝑟𝑜𝑜𝑡 =2∗𝑆
𝑏(1+𝜆)
(4) 𝐶𝑡𝑖𝑝 = 𝜆 ∗ 𝐶𝑟𝑜𝑜𝑡
(5) 𝑐 =(2/3)𝐶𝑟𝑜𝑜𝑡(1+𝜆+𝜆
2)
1+𝜆

47 - SkyBus SB-400
(6) 𝑌 = (𝑏/6)(1+2𝜆)
(1+𝜆)
12.3 Appendix II: Revised Weights
Table 12.1: Spreadsheet for Revised (Improved) Weight Calculations
Appendix III: Project Promotion Video Link
• https://youtu.be/BhcZjfpFztE

48 - SkyBus SB-400
Chapter 13: Resources [1] P. Smith, “Big Planes On Short Routes? What a Concept.,” Patrick Smith's ASK THE PILOT,
15-Feb-2018. [Online]. Available: https://www.askthepilot.com/big-planes-short-haul/.
[Accessed: 23-Sep-2019].
[2] B. Beers, “How does load factor impact airline profitability?,” Investopedia, 31-Jul-2018.
[Online]. Available: https://www.investopedia.com/ask/answers/041515/how-can-i-use-load-
factor-indicator-profitability-airline-industry.asp. [Accessed: 25-Sep-2019].
[3] D. Fickling, “Airlines Want Bigger Planes for Short-Haul Routes,” Skift, 09-Feb-2018.
[Online]. Available: https://skift.com/2018/02/09/airlines-want-bigger-planes-for-short-haul-
routes/. [Accessed: 25-Sep-2019].
[4] T. Crabtree, T. Hoang, R. Tom, and G. Gildemann, “WORLD AIR CARGO FORECAST
2018-2037,” Boeing, 2018. [Online]. Available:
https://www.boeing.com/resources/boeingdotcom/commercial/about-our-market/cargo-market-
detail-wacf/download-report/assets/pdfs/2018_WACF.pdf. [Accessed: 01-Oct-2019].
[5] D. P. Raymer, Aircraft Design: A Conceptual Approach, No. 6. Reston, VA: American
Institute of Aeronautics and Astronautics, Inc., 2018.
[6] L. R. Jenkinson, D. Rhodes, and P. Simpkin, Civil Jet Aircraft Design. London: Arnold,
1999.
[7] “ Boeing 787 -8 (Dreamliner) sample analysis. (2005) ,” Lissys Ltd. [Online]. Available:
http://www.lissys.demon.co.uk/samp1/index.html. [Accessed: 05-Sep-2019].
[8] “Boeing 787 Dreamliner Specs,” Modern Airliners, Dec-2015. [Online]. Available:
http://www.modernairliners.com/boeing-787-dreamliner/boeing-787-dreamliner-specs/.
[Accessed: 05-Sep-2019].
[9] R. Heisey, “717-200: LOW MAINTENANCE COSTS AND HIGH DISPATCH
RELIABILITY,” Boeing Aero, vol. 1, no. 19, pp. 20–31, Jul-2002.
[10] “757-200/300 Airplane Characteristics for Airport Planning,” 757-200/300 Airplane
Characteristics for Airport Planning. Boeing, 1999.

49 - SkyBus SB-400
[11] “Boeing 767 the first American Widebody Twin,” Modern Airliners, 18-Sep-2015.
[Online]. Available: http://www.modernairliners.com/boeing-767/. [Accessed: 05-Sep-2019].
[12] G. Goebel, “The Boeing 767, 777, & 787,” AirVectors, 01-Nov-2018. [Online]. Available:
https://airvectors.net/avb767.html. [Accessed: 16-Oct-2019].
[13] C. D. Harris, “NASA Supercritical Airfoils: A Matrix of Family-Related Airfoils,” Sci. and
Tech. Info. Div., NASA, Tech. Paper 2969, Mar. 1, 1990.
[14] D. Lednicer, “The Incomplete Guide to Airfoil Usage,” UIUC Airfoil Data Site, 15-Sep-
2010. [Online]. Available: https://m-selig.ae.illinois.edu/ads/aircraft.html. [Accessed: 21-Oct-
2019].
[15] “NASA SC(2)-0714 AIRFOIL (sc20714-il),” Airfoil Tools. [Online]. Available:
http://airfoiltools.com/airfoil/details?airfoil=sc20714-il. [Accessed: 21-Oct-2019].
[16] K. Dix-Colony and B. Bachtel, “Operating the 747-8 at Existing Airports,” Boeing AERO,
no. 39, pp. 14–19, Jul-2010.
[17] “Airplane Design Group (ADG),” SKYbrary Aviation Safety, 24-Jul-2017. [Online].
Available: https://www.skybrary.aero/index.php/Airplane_Design_Group_(ADG). [Accessed:
24-Oct-2019].
[18] “Airline Economics.” Avjobs, Inc., www.avjobs.com/history/airline-economics.asp.
[19] Boeing. World Air Cargo Forecast. World Air Cargo Forecast, Boeing Commercial
Airplanes, 2018.
[20] “Boeing's Market Outlook.” Boeing, 2018, www.boeing.com/commercial/market/cargo-
forecast/.
[21] Burnham, Andrew. “Emirates' Newest A380 Route Joins List of Short Superjumbo Flights.”
AirlineGeeks.com, 10 July 2019, airlinegeeks.com/2019/07/09/double-decker-claims-shortest-
a380-route-emirates-flies-twice-daily-to-muscat/.
[22] “Importance of Freighters in the Air Cargo Industry.” Boeing,
www.boeing.com/commercial/market/cargo-forecast/importance-of-freighters/.

50 - SkyBus SB-400
[23] “The Rolls-Royce Trent 700 Engine.” Rolls Royce Propulsion,
www.airbus.com/content/dam/corporate-
topics/publications/backgrounders/RollsRoyceTrent7000factsheet.pdf.
[24] Sabre Airline Solutions. “A Look at Cargo Revenue Management.” A Look At Cargo
Revenue Management,
www.sabreairlinesolutions.com/images/uploads/Cargo_Management_White_Paper.pdf.
[25] Slutsken, Howard. “How Airlines Make Big Bucks From Cargo.” The Points Guy, The
Points Guy, 11 Aug. 2018, thepointsguy.com/news/how-airlines-make-big-bucks-from-cargo/.
[26] Staff Reports, September 27, and Staff Reports. “Boeing Predicts Coming Wide-Body
Surge.” AIRCARGOWORLD.COM, 27 Sept. 2012, aircargoworld.com/allposts/boeing-predicts-
coming-wide-body-surge/.
[27] Cederholm, Teresa. “How Yield and Cost Structure Contribute to Southwest's Low Break-
Even Load Factor?” Market Realist, 21 Aug. 2014, articles2.marketrealist.com/2014/08/yield-
cost-structure-contribute-southwests-low-break-even-load-factor/.
[28] ICAO. “Emissions Databank - New Format (09/2019).” ICAO, Sept. 2019,
www.easa.europa.eu/easa-and-you/environment/icao-aircraft-engine-emissions-databank.
[29] ICAO. “Airline Operating Costs and Producivity.” Airline Operating Costs and Producivity,
23 Feb. 2017,
www.icao.int/MID/Documents/2017/Aviation%20Data%20and%20Analysis%20Seminar/PPT3
%20-%20Airlines%20Operating%20costs%20and%20productivity.pdf.
[30] GriN. “Fuel Consumption Table.” Airliners.net, 2017,
www.airliners.net/forum/viewtopic.php?t=1355819.
[31] Chati, Yashovardhan S., and Hamsa Balakrishnan. Analysis of Aircraft Fuel Burn and
Emissions in the Landing and Take Off Cycle Using Operational Data. 6th International
Conference on Research in Air Transportation, 2014, Analysis of Aircraft Fuel Burn and
Emissions in the Landing and Take Off Cycle Using Operational Data.