design of evaluation options of the system change grants
TRANSCRIPT

December 2006
Design of Evaluation Options of the System Change Grants
Final Report
Prepared for
Susan Radke Centers for Medicare & Medicaid Services
DHHS/CMS/ORDI Mail Stop C3-19-07
7500 Security Boulevard Baltimore, MD 21244-1850
Prepared by
Edith G. Walsh, Ph.D.
Angela M. Greene, M.B.A., M.S. Yevgeniya Kaganova, Ph.D.
RTI International 1440 Main Street, Suite 310
Waltham, MA 02452
RTI Project Number 02007959.003

_________________________________ RTI International is a trade name of Research Triangle Institute.
DESIGN OF EVALUATION OPTIONS OF THE SYSTEM CHANGE GRANTS
DRAFT FINAL REPORT
by Edith G. Walsh, Ph.D. Angela M. Greene, M.B.A., M.S.
Yevgeniya Kaganova, Ph.D.
Scientific Reviewer: Joshua M. Wiener, Ph.D.
Federal Project Officer: Susan Radke
RTI International
CMS Contract No. 500-00-0044 Task 003
December 2006
This project was funded by the Centers for Medicare & Medicaid Services under contract no. 500-00-0044 Task 003. The statements contained in this report are solely those of the authors and do not necessarily reflect the views or policies of the Centers for Medicare & Medicaid Services. RTI International assumes responsibility for the accuracy and completeness of the information contained in this report.

ACKNOWLEDGMENTS
We would like to thank our project officer, Susan Radke, for her direction, support and assistance in the course of conducting this project. In addition, we would like to thank Ed Mortimore of CMS for his assistance in working with the MDS and OSCAR data, Mindy Cohen of the Urban Institute for assisting us in using her analysis of MSIS data on state long-term care expenditures, Robert Mollica for sharing his typology of state nursing home level of care criteria, and Dan Crespin for ongoing research assistance. Other members of the RTI International Systems Change research team also assisted by providing feedback as we developed the analytic approach and shared preliminary findings. Finally, we appreciate the guidance and insights provided by Joshua Wiener who served as a senior advisor throughout the project.

iii
CONTENTS
EXECUTIVE SUMMARY .............................................................................................................1
SECTION 1......................................................................................................................................3 1.1 Introduction....................................................................................................................3 1.2 Overall Approach...........................................................................................................3
SECTION 2 RESEARCH DESIGN ................................................................................................5 2.1 Hypotheses.....................................................................................................................5 2.2 Analytic Approach .........................................................................................................5 2.3 Methods..........................................................................................................................6
2.3.1 Data Sources .........................................................................................................6 2.3.2 Variable Construction: State Policy Measures .....................................................9 2.3.3 State Level Supply Variables..............................................................................10
2.4 Analytic Methods.........................................................................................................10
SECTION 3 ADMISSION ANALYSIS........................................................................................11 3.1 Admission Sample Selection .......................................................................................11 3.2 Admission Analysis Variable Construction.................................................................12 3.3 Admission Analysis Descriptive Findings...................................................................13 3.4 Admission Analysis Multivariate Models ...................................................................25 3.5 Effect Decomposition Analysis ...................................................................................28
SECTION 4 DISCHARGE DESTINATION ANALYSIS ...........................................................31 4.1 Discharge Destination Analysis...................................................................................31 4.2 Discharge Destination Sample Selection .....................................................................31 4.3 Discharge Destination Variable Construction .............................................................32 4.4 Discharge Destination Analysis Descriptive Findings ................................................32 4.5 Discharge Destination Time Trends ............................................................................41 4.6 Discharge Destination Multivariate Analyses .............................................................41 4.7 Effect Decomposition Analysis ...................................................................................45 4.8 Marginal Effects Analysis............................................................................................45
SECTION 5 CONCLUSIONS AND RECOMMENDATIONS ...................................................47 5.1 Results of Hypothesis Testing .....................................................................................47 5.2 Summary of Substantive Findings ...............................................................................48 5.3 Methodological Findings .............................................................................................49 5.4 Limitations ...................................................................................................................50 5.5 Recommendations........................................................................................................51
REFERENCES ..............................................................................................................................53
APPENDIX SUPPLEMENTARY TABLES ................................................................................54

iv
List of Figures Figure 1 Health status measures derived from the MDS........................................................ 12 Figure 2 Mean ADL score by state—Under age 65............................................................... 15 Figure 3 Mean ADL score by state—Age 65 and over.......................................................... 16 Figure 4 Mean ADL score on admission by quarter—Under age 65..................................... 17 Figure 5 Mean ADL score on admission by quarter—Age 65 and over................................ 17 Figure 6 Mean CPS score on admission by quarter—Under age 65...................................... 18 Figure 7 Mean CPS score on admission by quarter—Age 65 and over................................. 19 Figure 8 Chronic diseases trends: Under age 65 .................................................................... 21 Figure 9 Chronic diseases trends: Age 65 and Over .............................................................. 21 Figure 10 RUG-III classification trends: Under age 65 ........................................................... 24 Figure 11 RUG-III classification trends: Age 65 and over ...................................................... 24 Figure 12 Nursing facility discharge destinations in U.S.—Under age 65 .............................. 36 Figure 13 Nursing facility discharge destinations in U.S—Age 65 and over .......................... 36 Figure 14 Community discharge by state—Under age 65 ....................................................... 37 Figure 15 Community discharge by state—Age 65 and over .................................................. 37 Figure 16 Community discharge with services by state: Under age 65 ................................... 38 Figure 17 Community discharge with services by state: Age 65 and over .............................. 38 List of Tables Table 1 Variable construction and sources ............................................................................. 7 Table 2 Admissions sample characteristics (January 2003–March 2005)............................ 14 Table 3 Examples of mean ADL scores on admission ......................................................... 16 Table 4 ADL scores on admission ........................................................................................ 18 Table 5 Distribution of MDS diagnostic categories by quarter ............................................ 20 Table 6 Distribution of RUGS-III categories over the study period (January 2003–March
2005) ........................................................................................................................ 23 Table 7 Summary changes over the study period by quarter (January 2003–March 2005) . 25 Table 8 Predicting ADL score on admission ........................................................................ 27 Table 9 Discharge sample characteristics (April 2003–June 2005)...................................... 34 Table 10 Selected discharge destinations in three states: Residents under age 65 (April 2003–
June 2005)................................................................................................................ 39 Table 11 Selected discharge destinations in three states: Residents over age 65 (April 2003–
June 2005)................................................................................................................ 40 Table 12 Community discharge destinations by Medicare/Medicaid dual eligibility status .. 40 Table 13 Probability of discharge to the community.............................................................. 42

1
EXECUTIVE SUMMARY
The goal of the project was to identify and pilot analyses useful for monitoring and evaluating state’s progress in reforming their long-term care systems, in part to evaluate the impact of the Systems Change grant program. The Centers for Medicare & Medicaid Services has awarded about $240 million since 2001 in approximately 300 separate grants to states and Independent Living Centers to foster long-term care reform. Because of the diversity of the grant goals, activities and scope, staggered implementation and a lack of quantitative data, it is not feasible to develop direct measures of the grant program as a whole or even of specific grant types. In addition, many projects lay the groundwork for future changes, such as establishing new waivers, but could not be expected to have a measurable impact in the short run. However, virtually every state is engaged in long-term care reforms consistent with the objectives of the Systems Change grant program that should ultimately prevent or delay institutionalization and facilitate return to the community for beneficiaries who have institutional stays. The challenge was to identify a quantitative approach to evaluate the impact of these activities and reforms that could provide information about how the nation as a whole and individual states are doing in reforming their long-term care systems as well as shedding light on the impact of specific features of state long-term care policy.
The common objective across grants and other long-term care reforms (to support community alternatives to institutionalization), combined with the availability of detailed information about nursing home residents collected through the Nursing Home Minimum Data Set (MDS), support the use of MDS data to analyze patterns related to facility admission and discharges and to use the results to make inferences about state long-term care reform. We hypothesized that well-developed home and community-based service systems could sustain people at higher levels of impairment in the community and that well integrated long-term care systems would support facility residents to return to community living. The first would be observable in the level of impairment of facility residents on admission, the second in the proportion of facility residents who are discharged back to the community. To test these hypotheses, we constructed a database combining over 2 years of MDS data, facility characteristics from the OSCAR data, state level supply variables, and state long-term care policy variables to monitor and evaluate the profile of new facility entrants and of discharge destinations. The analyses focus on long-stay residents, not those admitted to nursing facilities for short term rehabilitation or post-acute care.
This report details the use of admission and discharge assessment data from the Nursing Home Minimum Data Set (MDS) to observe state variation and changes over time in the profile of new entrants to nursing facilities and in discharge destinations. The results are used to make inferences about the strength of the home and community based system and states’ progress in moving towards long-term care reform. With some refinements the approach piloted in this study could be used as a monitoring tool, evaluating patterns of facility admissions and discharges nationally and on the state level. There are also several ways this pilot approach could be extended as a research project to further understand state variation and factors associated with facility admissions and discharges.
The pilot analyses show gradually increasing functional impairment levels of newly admitted long-stay nursing facility residents, and gradual increases in the proportion of long-stay

2
residents returning to the community, both potential indicators of the effects of state rebalancing efforts. There is state variation on these measures and on the rate of change. Furthermore, the ratio of Medicaid home and community-based long-term care expenditures to total Medicaid long-term care expenditures is a significant predictor of these outcomes, and has the greatest impact of the state policy variables included in multivariate models. As the proportion of long-term care dollars spent on home and community-based services increases, so does the likelihood of discharge back to the community.

3
SECTION 1
1.1 Introduction
The goal of the project was to identify and pilot analyses useful for monitoring and evaluating state’s progress in reforming their long-term care systems. Under the Systems Change grant program, the Centers for Medicare & Medicaid Services (CMS) has awarded about $240 million since 2001 in approximately 300 separate grants to states and Independent Living Centers. A review of the 2001 awards indicates that there are no direct measures readily available to evaluate the Systems Change grant program as a whole or specific types of grant activities due to the diversity of grants in goals and scope and timing and a lack of quantitative data about grant activities. In addition, many grants lay the groundwork for change that will not affect the service system in the short run- for example, developing new waivers or creating new service delivery options (Walsh, Greene and Brown, 2000). However, virtually every state is engaged in long-term care reforms and systems change activities that should ultimately prevent or delay institutionalization and facilitate return to the community for beneficiaries who have institutional stays.
Various types of activities fall under the rubric of long-term care reform. “Rebalancing” is generally used to refer to shifting the balance of funding from institutional care to spending more on home and community-based services (HCBS). This funding shift is accomplished through developing HCBS waivers, adding personal care services to the Medicaid state plan, and programs such as Money Follows the Person (MFP), which allows states to directly shift funds from facility to community care for individuals as they leave nursing facilities. Improving coordination across settings is another aspect of long-term care reform. Activities focused in this area include creating single entry points to the long-term care service system, enhanced case management activities, and projects like nursing facility transition programs that assist individuals to leave nursing facilities by linking them to community services. Other activities include efforts to increase the capacity of the home and community-based system, for example, through initiatives to recruit and train direct service workers and develop consumer directed personal care options.
1.2 Overall Approach
We used admission and discharge assessments from the Nursing Home Minimum Data Set, linked to facility characteristics from the OSCAR data, state supply variables, and several state-level LTC policy variables, to make inferences about the impact of HCBS on who is admitted and discharged from nursing homes. We hypothesized that in states with well-developed HCBS systems new entrants to nursing facilities would be more impaired, a higher proportion of long-stay residents would return to the community, and that these findings would be related to state LTC policies.
Across all rebalancing initiatives, the goal is to bolster the home and community service system, thus providing viable alternatives to nursing facility placement, and to help link people

4
to these alternatives. If effective, such activities ultimately would have an impact on nursing facility use, observable through analysis of the Nursing Home Minimum Data Set (MDS). This concept is based on a past qualitative research finding. Interviews with nursing facility administrators in Oregon, a state with an extensive and well organized HCBS system reported several changes they attributed to the state’s long-term care reforms. Facility length of stay had decreased substantially as consumers had alternative long-term care options both prior to facility care and through active efforts to assist consumers to return to the community. Facility discharge destinations included community settings as well as hospitals, facility transfers or death. Overall, new entrants had become substantially more impaired over time, as consumers were able to age in place longer and less impaired candidates for facility admission were diverted to other settings (Walsh, Kulas, and Khatutsky, 2000). In the same study, quantitative analysis of Oregon’s long-term care assessment data confirmed that facility residents in that state were substantially more impaired on average than other nursing home certifiable Medicaid beneficiaries.
Thus, aspects of nursing facility use and the characteristics of nursing facility residents might serve as measurable outcomes related to the effectiveness of the Systems Change projects, or more globally of state long-term care reform or rebalancing activities—regardless of the specific activity. Analyzing characteristics of facility residents on admission and discharge patterns could provide CMS and the states with important information about directions for future grant procurements and assessments. As a pilot, this project was designed to test the feasibility of using the MDS to compare the characteristics of new facility entrants and return to the community, across states and across time, and to relate these differences to long-term care reform measures.

5
SECTION 2 RESEARCH DESIGN
2.1 Hypotheses
The research hypotheses relate to the effects that the home and community service system, including waivers, service delivery models, service options, nursing facility transition and diversion activities and overall HCBS expenditures may have on the use of nursing facilities.
We have three hypotheses1:
H1: Well-developed HCBS systems can support people at high levels of impairment in the community.
The functional status of nursing facility entrants will be higher in states with strong HCBS systems and will increase over time as states engage in systems change. For example, this would occur as more alternatives to facility care become available, as states develop systems to link people to needed services are improved, and as the HCBS workforce is strengthened.
H2: Successful rebalancing or reform efforts would result in an increasing proportion of nursing facility discharges to the community, and an increasing proportion of facility discharges will be linked to HCBS
Nursing facility discharge destinations include return to the community, hospitalization, transfers across facilities, and death. As home and community service options and the systems to link people to community care increase, we would expect to see a higher proportion of discharges to the community.
H3: Any observed changes over time would be the result of ongoing reforms.
Changes in admission profiles or in discharge destinations could result from implemented reforms or from underlying changes in case mix due to factors like population aging or the compression of morbidity. While both may occur, if LTC reforms are effective, their impact would remain holding changes in case mix constant.
2.2 Analytic Approach
In summary, the analytic approach we piloted in this study includes the following:
• Use of admission assessments in the Nursing Home Minimum Data Set (MDS) to analyze and compare resident characteristics across states and over time.
• Use of MDS discharge assessments to analyze and compare discharge destinations across states and over time.
1 We also hypothesized that length of stay would be shorter in states with LTC reforms, but we could not test this
hypothesis. While the discharge assessments have a field for admission date it is frequently missing.

6
• Inclusion of state LTC policy measures in multivariate analyses to observe their relationship to resident characteristics on admission and discharge destinations.
• Inclusion of facility characteristics and state supply variables as controls in multivariate analyses.
2.3 Methods
2.3.1 Data Sources
The data sources are summarized in Table 1. The Nursing Home Minimum Data Set (MDS) provides detailed information about every facility resident. Assessments are conducted on admission, at discharge and at varying intervals including quarterly and annually. The data from the MDS is available quickly. Facilities submit data to their states monthly; states then forward the information to CMS, where it is quickly available for analysis. There is almost no lag in this process. Admission assessments include detailed information about demographics, insurance coverage, health, and functional status and can be used to generate various scores and Resource Utilization Groups (RUGS). The RUGS are measures of staffing intensity and are used to categorize residents for Medicare post-acute care payments, and in many states, as part of the Medicaid nursing facility payment formula. The discharge assessments have limited information, primarily discharge destination, demographics and insurance coverage. Although there is a field for admission date, this information is frequently missing and cannot be used to reliably to calculate length of stay.
We used MDS data from January 1, 2003–June 30, 2005 to create two samples: one to analyze characteristics of facility residents on admission, the second to analyze discharge destination patterns. We limited the samples to Medicaid beneficiaries, as these individuals would be eligible for Medicaid HCBS, and, as detailed in later sections, we eliminated individuals with stays of less than 30 days to avoid including people who were in a facility for rehabilitation or post acute care. For the admission sample, we dropped people with a second admission assessment or a discharge assessment within 30 days of admission. For the discharge sample, we dropped individuals who had another discharge or admission assessment in the previous thirty days.
We selected this time period for several reasons. First, we wanted to have the most recently available data at the time we constructed the files. Second, we wanted to allow time for the 2001 Systems Change grants to be operational and potentially having a measurable impact. We also wanted to have multiple years of data to observe time trends, and further divided the data into 10 quarters (3-month periods) to provide additional data points for trend analyses. The later sections describing each analysis will discuss details of the Admission and Discharge sample files.
For the admission analysis, our dependent variable is the ADL Score on admission, a measure of functional impairment. For the discharge analysis, we have two dependent variables: discharge to the community and a subset of this variable, discharge to the community with services. We provide additional detail about these variables in later sections.

7
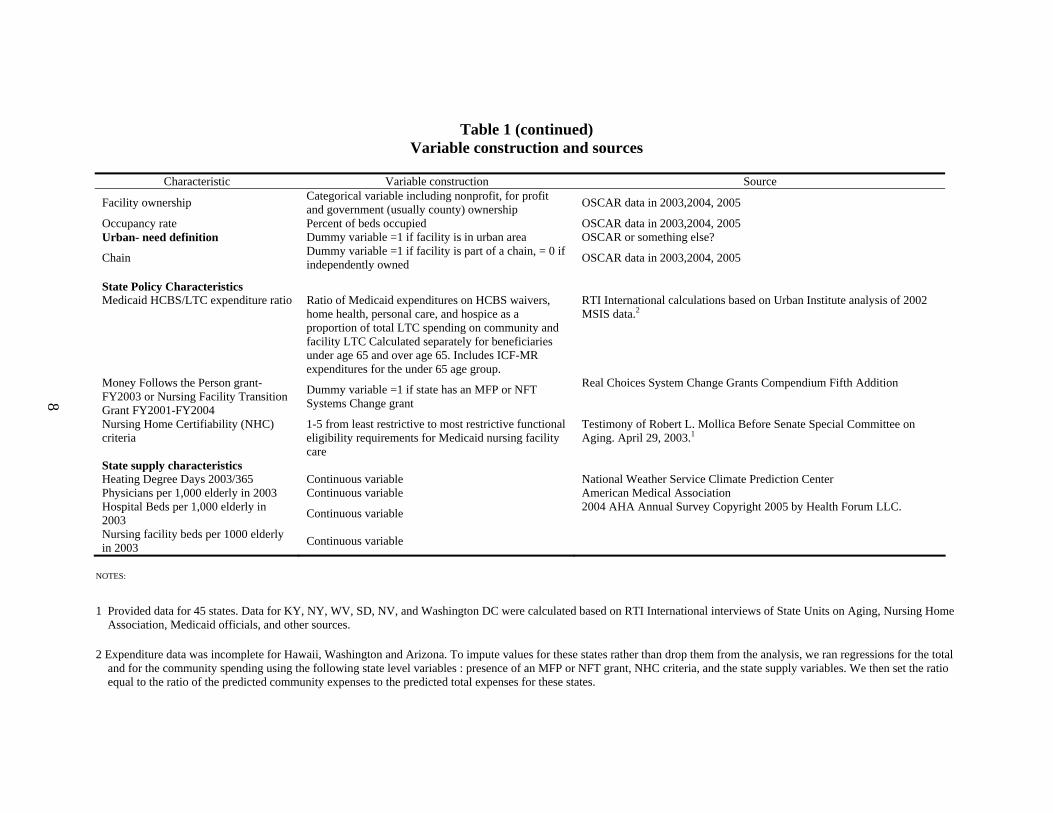
Table 1 Variable construction and sources
Characteristic Variable construction Source
Dependent Variables
ADL scores on admission 4-18 possible points based on level of dependence (1–5) in bed mobility, transferring, toileting and (1–3) eating
Admission assessment data from the Nursing Home Minimum Data Set, January 2003–March 2005
Discharge to community
Dichotomous variable based on Discharge destination = 1 if discharged to private home, or private home with home health, or assisted living.; =0 for all others including death, acute care hospital, psychiatric hospital, rehabilitation hospital, transfer to another nursing facility
Discharge assessment data from the Nursing Home Minimum Data Set, April 2003–June 2005
Discharge to community with services Dichotomous variable based on Discharge destination = 1 if discharged to private home with home health, or assisted living; 0 for all other destinations.
Discharge assessment data from the Nursing Home Minimum Data Set, April 2003–June 2005
Independent Variables
Demographic variables Age in years, dummy variables for gender, black-non-Hispanic, white-non-Hispanic, Hispanic, Asian, and other
Admission analysis: MDS admission assessment Discharge analysis: MDS discharge assessments
Medicare/Medicaid dual eligibility Dichotomous variable =1 based on having both Medicare and Medicaid numbers entered in the MDS assessment data.
Admission analysis: MDS admission assessment Discharge analysis: MDS discharge assessments
Cognitive Performance Score (used in Admission analysis only)
0-6 with 0 indicated cognitively intact and 6 indicating severe cognitive impairment
Admission assessment data from the Nursing Home Minimum Data Set, January 2003–March 2005
Diagnosis count (used in Admission analysis only) Count of individual conditions Admission assessment data
Diagnostic categories (used in descriptive analysis of admission data only)
Categorical variable based on MDS categorization of the individual conditions into 8 categories
Admission assessment data
RUGS-III categories (used in descriptive analysis of admission data only)
Categorical variable of 7 mutually exclusive categories Application of RUGS-III algorithms to the Admission assessment data
Facility Characteristics Number of Medicare or Medicaid certified beds Continuous variable OSCAR data in 2003,2004, 2005
(continued)
8
Table 1 (continued) Variable construction and sources
Characteristic Variable construction Source
Facility ownership Categorical variable including nonprofit, for profit and government (usually county) ownership OSCAR data in 2003,2004, 2005
Occupancy rate Percent of beds occupied OSCAR data in 2003,2004, 2005 Urban- need definition Dummy variable =1 if facility is in urban area OSCAR or something else?
Chain Dummy variable =1 if facility is part of a chain, = 0 if independently owned OSCAR data in 2003,2004, 2005
State Policy Characteristics Medicaid HCBS/LTC expenditure ratio Ratio of Medicaid expenditures on HCBS waivers,
home health, personal care, and hospice as a proportion of total LTC spending on community and facility LTC Calculated separately for beneficiaries under age 65 and over age 65. Includes ICF-MR expenditures for the under 65 age group.
RTI International calculations based on Urban Institute analysis of 2002 MSIS data.2
Money Follows the Person grant-FY2003 or Nursing Facility Transition Grant FY2001-FY2004
Dummy variable =1 if state has an MFP or NFT Systems Change grant
Real Choices System Change Grants Compendium Fifth Addition
Nursing Home Certifiability (NHC) criteria
1-5 from least restrictive to most restrictive functional eligibility requirements for Medicaid nursing facility care
Testimony of Robert L. Mollica Before Senate Special Committee on Aging. April 29, 2003.1
State supply characteristics Heating Degree Days 2003/365 Continuous variable National Weather Service Climate Prediction Center Physicians per 1,000 elderly in 2003 Continuous variable American Medical Association Hospital Beds per 1,000 elderly in 2003 Continuous variable 2004 AHA Annual Survey Copyright 2005 by Health Forum LLC.
Nursing facility beds per 1000 elderly in 2003 Continuous variable
NOTES:
1 Provided data for 45 states. Data for KY, NY, WV, SD, NV, and Washington DC were calculated based on RTI International interviews of State Units on Aging, Nursing Home Association, Medicaid officials, and other sources.
2 Expenditure data was incomplete for Hawaii, Washington and Arizona. To impute values for these states rather than drop them from the analysis, we ran regressions for the total and for the community spending using the following state level variables : presence of an MFP or NFT grant, NHC criteria, and the state supply variables. We then set the ratio equal to the ratio of the predicted community expenses to the predicted total expenses for these states.

9
We used the OSCAR data for 2003, 2004, and 2005 to identify characteristics of the facilities in which the sample members reside and used these in both the Admission and Discharge Analyses. We appended the individual level observations with the facility characteristics associated with the year in which the admission or discharge occurred. We included the number of certified beds as a measure of facility size, facility ownership (nonprofit, for profit and government), whether the facility was located in an urban area, and whether it was part of a chain.
2.3.2 Variable Construction: State Policy Measures
We created several state long-term care policy variables and included standard supply variables from various sources as detailed in Table 1. State level data are presented in the appendix, Table A-1. The state long-term care policy variables are the following:
LTC expenditure ratio—Medicaid home and community-based services as a proportion of total Medicaid LTC expenditures. We calculated this ratio using estimates developed by Urban Institute based on analysis of 2002 MSIS data. These estimates were derived separately for LTC expenditures for beneficiaries under age 65 and those age 65 and over. Thus, in our analyses we were able to use age group-specific expenditure ratios.
In keeping with our analytic approach, we hypothesize that states where community LTC expenditures are a higher proportion of total LTC expenditures would be able to delay facility admission and support discharges back to the community. Specifically, we expect the ADL scores on admission to be higher in states that spend a greater proportion of their LTC dollars on HCBS. We also expect to see a higher proportion of residents discharged to the community overall and discharged to the community with services in states with that spend a higher proportion of their LTC dollars on HCBS.
Nursing Home Certifiability (NHC) criteria—Each state has its own level of care criteria used to determine functional eligibility for nursing facility care. These vary greatly in how restrictive they are and in the types of requirements to qualify for Medicaid reimbursement of facility care. Mollica (2003) categorized these criteria into a five-point scale ranging from least to most restrictive for 45 states. To have complete information for our sample, we called the remaining five states and the District of Columbia to ascertain their NHC criteria and to sort them into the appropriate categories. We expect that more restrictive NHC criteria would be associated with higher ADL scores on admission.
Presence of a Money Follows the Person (MFP) or Nursing Facility Transition (NFT) grant—MFP and NFT Systems Change grants are specifically designed to identify facility residents who wish to return to the community and to assist them by linking them to HCBS, housing and other needed resources. To the extent the programs are operational, we expect a higher proportion of facility residents in states with MFP or NFT programs to be discharged to the community and that a higher proportion will be discharged to the community with services.

10
2.3.3 State Level Supply Variables
We included several standard supply variables including standardized measures of hospital bed supply, physician supply, and nursing home bed supply. The supply of hospital and physicians provide additional controls for the demand for nursing home care. The supply of nursing home beds was included to examine how nursing homes would respond to tighter bed supplies, a strategy commonly proposed as part of rebalancing. Given that nursing homes may have a financial incentive to admit light care over heavy care residents, tighter nursing home bed supplies may result in nursing homes triaging by accepting less disabled residents first, reducing average ADL scores and reducing discharges to the community.
We also included heating degree days (divided by 365 for ease of presentation). Heating degree days is a measure of how cold the climate is in a state. This measure has been associated in past research with the risk of institutionalization. In general, people living in colder states are more likely to become institutional residents than those in warmer states.
2.4 Analytic Methods
We used descriptive methods to determine means and distributions for national and state level characteristics for both the Admission and Discharge analyses. We used multivariate regression techniques with cluster adjustments (at the facility level) to examine longitudinal changes in ADL scores (Poisson regression) and longitudinal changes in prevalence rates of discharge destinations (logistic regression). All analyses are done separately for residents under age 65 and those age 65 and older as these populations and their associated LTC utilization are known to be different.
In Section 3 of this report, we provide details about the Admission Analyses. Section 4 provides a detailed description of the Discharge Destination Analyses.

11
SECTION 3 ADMISSION ANALYSIS
Institutionalization is generally considered the least desirable option for beneficiaries in need of LTC. From the individual perspective, it entails loss of autonomy, privacy and home. From government’s point of view it is costly. Thus, a major goal of LTC reform is to delay or prevent institutionalization through targeting and through effective provision of home and community-based supports. Because LTC reform is essentially about increasing the capacity of the home and community-based system to assist people with functional limitations, as reform progresses, the HCBS system should be able to care for people at increasing levels of impairment. This would be reflected in the facility population—the average level of impairment should be increasing among new entrants to nursing facilities as the HCBS system improves.
ADL score (a functional status measure) on admission, is the dependent variable in these analyses because of its usefulness as a summary measure of need for long-term care. For the descriptive analyses, we included a wide range of health and functional status measures to observe time trends in the facility population and identify appropriate control variables for multivariate analyses.
To see how individual states and the nation are doing in moving towards this aspect of LTC reform, we framed the following research questions:
• How do characteristics on admission for long-stay residents vary across states and over time?
• What factors are associated with variation in resident characteristics on admission?
• How do selected state LTC characteristics relate to observed differences?
3.1 Admission Sample Selection
We created the sample from the Minimum Data Set, starting with all Medicaid admission assessments between January of 2003 and March of 2005, for a total of nine quarters, including all 50 states, Puerto Rico, the Virgin Islands, and the District of Columbia. Medicaid status was based on the presence of a Medicaid number in the admission assessment. Our goal was to create a sample of Medicaid beneficiaries who were long-stay facility residents—those at most risk of sustained institutionalization. We defined long-stay as 30 days or longer, based on the advice of experts familiar with the MDS, as most post-acute stays last less than 30 days. As there is no way to directly identify length of stay from the MDS, we inferred length of stay greater than 30 days based on the absence of a discharge assessment or a second admission assessment within that time period. We eliminated any resident who had another admission assessment or a discharge assessment within 30 days.
The sample is further limited to those for whom the standard initial assessments were completed on admission. For some new admissions, a 7- or 14-day Medicare assessment is accepted as a substitute. Facility staff complete very brief reentry assessments for residents who have a short acute hospitalization. We did not include any of these types of assessments as they

12
provide substantially less information about the beneficiaries. We also postulated that the Medicare 7- and 14-day assessments are most often used for short term, rehabilitation-oriented facility stays and the reentry assessments do not actually represent a new admission. We further limited the sample to Medicaid beneficiaries (including those with and without Medicare in addition to their Medicaid benefits) as these beneficiaries would both be the targets of Systems Change activities and would be eligible for Medicaid HCBS.
3.2 Admission Analysis Variable Construction
Figure 1 provides definitions of the health and functional status measures we derived from the MDS. In addition, we include demographic characteristics such as age, race, gender, dual eligibility for Medicare and Medicaid, and previous living arrangement. In the descriptive analyses, we also tabulated responses on the state level to three questions related to the desire or potential to return to the community: the resident wishes to return to the community, the resident has the support of another person to return to the community and a measure of the facility staff’s assessment of the potential of the resident to return home.
Figure 1 Health status measures derived from the MDS
Activity of Daily Living score (ADL Score) 4–18 points Based on summing the level of dependence for each of four ADLs: (1–5) bed mobility, transferring, toileting, and (1–3) eating. Used in calculating RUGS-III categories based on the association between resident characteristics and facility resource utilization and costs. Selected as it is commonly used in MDS analyses and to maximize potential variation in scores.
Cognitive Performance Score (CPS) 0–6 from intact to very severe impairment
Diagnosis count Count based on the number of medical conditions and diagnoses indicated in the admission assessment.
Diagnostic categories The individual medical conditions included on the MDS are organized in to 8 categories: endocrine, cardiac, pulmonary, neurological, psychiatric, musculoskeletal, sensory impairments and infections.
Resource utilization group categories These categories are based on evaluating residents’ care needs from the MDS, taking into account the need for rehabilitation therapies, nursing treatments, medical monitoring, as well as functional, cognitive and behavioral status. The full RUGS-III 44 item hierarchy further differentiates care needs within these eight groups.

13
ADL score on admission is the dependent variable we selected for multivariate analyses because of its usefulness as a summary measure of need for long-term care. This ADL score is different from the common 0–6 ADL impairment count often used in determining nursing facility and HCBS eligibility. Bathing and dressing are not included in this score, presumably because all or most facility residents receive help with these ADLs and so they do not differentiate among residents with greater and lesser needs for assistance. Bed mobility, the ability to reposition oneself in bed, is not part of the standard ADL counts, but is an important aspect of the MDS ADL score. Residents who need assistance or are totally dependent on others for repositioning are at the far end of the functional status spectrum. For the descriptive analyses, we also included a wide range of health and functional status measures to observe other aspects of case mix trends in the facility population and to identify appropriate control variables for multivariate analyses. From the array of available health status variables, we selected the Cognitive Performance Scale (CPS) and a count of health conditions and diagnoses to include in the multivariate analyses.
3.3 Admission Analysis Descriptive Findings
Key descriptive findings in this analysis include: • The mean ADL scores across states varies substantially, ranging from 6.6 – 13.5 • Facility residents age 65 and over are more impaired, on average than younger
facility residents • Facility residents are becoming sicker over time (as measured by the condition
count and the percent of residents with various types of diagnoses) and more impaired--as measured by ADL scores and the proportion of residents in higher Resource Utilization Groups (RUGS-III).
The descriptive analysis includes detailed information about ADL scores on admission and to a lesser extent, information about the CPS, diagnostic and RUGS categories. We include summary tables and graphs in this section and detailed state-by-state data in the appendix.
Sample characteristics: National means—Table 2 shows the means for the sample characteristics (ADL score, CPS, diagnosis count, demographics), the facility characteristics associated with each sample member, state policy, and state supply variable characteristics. The sample includes 247,714 long-stay Medicaid residents under age 65 and 687,192 age 65 and over. The 65 and over sample is more impaired in terms of ADL scores and CPS and has more chronic conditions. Blacks are a higher proportion of the residents under age 65 group, compared to those age 65 and over. About a quarter of each sample lived alone prior to admission. While most (92%) of the over 65 group is dually eligible for Medicare, less than half of residents under age 65 are Medicare/Medicaid dually eligible.
The sample members were admitted to facilities with about 150 beds and with occupancy rates of about 86%. About one quarter of the facility residents are in non-profit facilities, three quarters in metropolitan areas, and about half in facilities that belong to a chain.

14
Table 2 Admissions sample characteristics
(January 2003–March 2005)
Under 65 65 and Over
Obs Mean Std Dev Min Max Obs Mean Std Dev Min Max
Age 247714 50.97% 11.12 0 64 687192 80.70% 8.16 65 117 Male 247639 53.7 0.50 0 1 687078 30.4 0.46 0 1 Black 246848 26.8 0.44 0 1 685381 16.9 0.37 0 1 Hispanic 246848 8.2 0.27 0 1 685381 7.5 0.26 0 1 Asian 246848 1.6 0.127127 0 1 685381 2.8 0.164878 0 1 White 246848 62.1 0.485133 0 1 685381 72.1 0.448587 0 1 Dual Eligible 247714 45.1 0.50 0 1 687192 92.2 0.27 0 1 Number of Beds 228642 154.91 115.38 2 1389 638391 143.37 95.45 2 1389 Non-Profit 247714 14.3 0.349583 0 1 687192 19.1 0.392913 0 1 For Profit 247714 73.6 0.44 0 1 687192 68.8 0.46 0 1 Government 247714 4.4 0.21 0 1 687192 5.0 0.22 0 1 Occupancy Rate 228642 83.6 0.14 0.0 1 638391 85.6 0.14 0.0 1 Urban 247714 76.3 0.43 0 1 687192 69.9 0.46 0 1 Chain 247714 51.6 0.50 0 1 687192 50.2 0.50 0 1 NHC Criteria (1-5) 247695 2.17 1.15 1 5 687147 2.31 1.19 1 5 Expenditure Ratio (0-1.0) 245774 0.57 0.13 0.28 0.97 677898 0.22 0.11 0.05 0.51 MFP or NFT Grant 247714 62.0 0.49 0 1 687192 63.4 0.48 0 1 Hospital Beds/1000 65+ 247695 2.83 0.64 1.8 6.1 687147 2.88 0.66 1.8 6.1 Physicians/1000 65+ 247695 21.94 5.32 12.8 64.4 687147 21.59 5.24 12.8 64.4 NF bed/1000 65+ 247695 45.09 12.43 17.2 71.0 687147 44.20 11.93 17.2 71.0 Heating Degree Days/365 247695 12.39 5.62 0 27.8 687147 11.86 5.72 0 27.8
SOURCE: RTI International analysis of MDS and OSCAR data, January 2003–March 2005.

15
The mean Medicaid HCBS/LTC expenditure ratios differ markedly between the two age groups. On average, states are spending 57% of their long-term care dollars on community services for people under age 65, while for older people, only 21% of total long-term care dollars are spent on community services. About 60% of both groups reside in states that had received a Systems Change grant for an MFP or NFT project by 2003.
Mean ADL Scores by State
Figures 2 and 3 are scatter plots showing the mean ADL scores on admission by state, with a line indicating the national mean in each figure. Detailed state by state mean ADL scores on admission are presented in the appendix, Table A-2. In Table 3, we provide several examples of individual state data. Maine has the highest ADL scores on admission for both sample groups of residents under and over age 65; Illinois has the lowest ADL scores for the under age 65 sample; and Oklahoma has the lowest mean ADL scores for the age 65 and over sample.
Figure 2 Mean ADL score by state—Under age 65
Time trends in mean ADL scores by state
We also examined time trends for the mean ADLS on admission nationally and for each state, looking at the means for each 3-month period to create a series of data points for analysis. The time trend analysis controls for CPS, demographics and the number of chronic conditions, to take into account potential changes in other case mix factors that would affect ADL scores. In other words, our goal was to look at changes in ADL scores above and beyond any changes in other health status or demographic characteristics. As seen in Figures 4 and 5, nationally the level of ADL impairment increased steadily by about one half a point over the study period for

16
residents in both age groups. Individual state detail is provided in Table A-3 in the appendix. In Table 4, we summarize some of these findings- ADL scores increased significantly in 22 states for residents under age 65, and in 39 states for residents over age 65, while only decreasing significantly in two states (under age 65 only). If this trend continues, ADL scores on admission will increase by one full point about every 4–5 years.
Figure 3 Mean ADL score by state—Age 65 and over
Table 3 Examples of mean ADL scores on admission
<65 65+
United States 9.7 11.2 Maine 12.5 13.5 Illinois 6.7 10.1 Oklahoma 8.6 9.5
SOURCE: RTI International analysis of Minimum Data Set, 2003–March 2005.

17
Figure 4 Mean ADL score on admission by quarter—Under age 65
Figure 5 Mean ADL score on admission by quarter—Age 65 and over

18
Table 4 ADL scores on admission
<65 65+
Increasing (p<0.05) 22 39 Decreasing (p<0.05) 2 0
SOURCE: RTI International analysis of Minimum Data Set, 2003–2005.
Cognitive performance score on admission—CPS values decreased over the study period for the admission cohort, though very slightly (Figure 6 and 7). While there is a definite downward trend, it is so small that it is probably not clinically meaningful (from 1.69 to 1.63 for those under 65 and from 2.41 to 2.32 for those age 65 and over). CPS for residents under 65 decreased significantly in 15 states, and for the over 65 in 28 states. CPS increased significantly only in Colorado for the under 65 population, and in no states for residents over 65. We include the CPS scores as control variables in multivariate analyses.
Figure 6 Mean CPS score on admission by quarter—Under age 65

19
Figure 7 Mean CPS score on admission by quarter—Age 65 and over
Diagnostic characteristics—The MDS initial assessment includes detailed information about medical conditions, which are categorized into endocrine, cardiac, musculoskeletal, neurological, psychiatric, pulmonary, and sensory conditions, and infections. We used the individual diagnoses within these categories to create a condition count used as a control variable in multivariate analyses.
Table 5 shows the percent of sample members with conditions in each diagnostic category for the total study period and for each quarter. The findings are shown separately for people under and over age 65. In both age groups we see that an increasing percentage of sample members have endocrine, cardiac, psychiatric, pulmonary conditions, and sensory disorders. The percentage with neurological conditions and infectious diseases is decreasing, and there is no change in the percentage with musculoskeletal conditions. Taken together these patterns suggest that the facility population is getting sicker over time. This information is presented graphically in Figures 8 and 9 (note: the sales vary across these graphs).
RUGS-III categories—Under Medicare and many Medicaid state reimbursement systems, nursing facility resident characteristics are sorted by a hierarchical method that takes into consideration health and functional status and rehabilitation potential. The full Resource Utilization Group (RUG-III) hierarchy, used for Medicare reimbursement of skilled nursing facility care, has 44 cells. A slightly more parsimonious version is used for Medicaid payments in about 30 states. Individual characteristics and treatments are entered into a hierarchical grouping so that facilities are paid based on the most intensive resource needs a person has. This hierarchy can be rolled up into seven mutually exclusive general categories. Within each of the seven general categories are multiple subgroupings that reflect additional characteristics like the

20
Table 5 Distribution of MDS diagnostic categories by quarter
Under 65 1 2 3 4 5 6 7 8 9 Total
Endocrine 41.2% 41.1% 40.7% 41.8% 42.9% 42.8% 42.6% 43.3% 43.9% 42.3% Cardiac 56.8 56.0 56.3 57.1 58.7 59.4 58.9 59.7 60.2 58.1 Musculoskeletal 20.9 20.5 20.1 20.7 21.1 21.5 21.2 21.4 21.3 21.0 Neurological 41.3 41.4 40.8 39.9 40.2 40.2 40.3 40.1 39.1 40.4 Psychiatric 49.8 51.0 50.7 51.4 51.8 53.0 53.4 53.2 53.2 52.0 Pulmonary 21.0 20.9 20.0 21.0 21.9 21.6 21.1 21.6 23.3 21.4 Sensory 52.1 51.1 50.8 51.4 51.9 52.2 53.0 52.8 53.4 52.1 Infections 72.8 72.5 72.5 72.1 72.9 72.8 72.0 67.9 68.3 71.5
Over 65 1 2 3 4 5 6 7 8 9 Total
Endocrine 49.6% 50.2% 50.2% 50.3% 50.8% 51.4% 51.5% 51.8% 51.9% 50.8% Cardiac 79.9 80.0 80.4 80.8 81.5 82.0 82.0 82.4 82.9 81.3 Musculoskeletal 41.5 42.0 41.8 41.8 41.6 42.7 42.5 42.7 41.6 42.0 Neurological 57.0 57.0 56.8 56.3 56.1 56.5 56.6 55.8 55.3 56.4 Psychiatric 38.2 39.3 39.5 39.6 39.6 40.4 41.0 40.8 39.9 39.8 Pulmonary 23.5 22.8 22.7 23.3 24.1 23.8 23.5 23.8 25.0 23.6 Sensory 55.5 55.5 56.0 56.2 56.6 57.4 57.0 57.6 57.0 56.5 Infections 77.3 76.9 77.5 76.2 76.4 76.7 76.0 70.8 71.0 75.5
SOURCE: RTI International analysis of Minimum Data Set, 2003–2005.

21
Figure 8 Chronic diseases trends: Under age 65
Figure 9 Chronic diseases trends: Age 65 and Over
musculoskeletal conditions. SO, WHAT DO YOU MAKE OF THAT?

22
degree of ADL dependency. Thus, all groups except “Behavior problems only” may have some degree of ADL dependency, while “Physical functioning reduced” is limited to people who have no rehabilitation, extensive care, special care needs. Table 6 shows the RUGS-III category distribution over the nine quarters of the time period. Figures 10 and 11 show this information graphically (note: the scales vary across these graphs).
There are interesting differences between the two populations and changes over time. For both the younger and older groups, new admissions falling into the Rehabilitation category is both the most common category and increasing over time. About a third of residents under age 65 fall into this category; close to half of residents over age 65 do. In contrast, there is a higher prevalence rate in the under age 65 group for extensive care and special care, with about twice as many under age 65 admissions (14%) falling into the special care group as for the over 65 (7.5%). In both age groups, the percentage of new admissions categorized as Special Care is decreasing over time, while Extensive Care is increasing in residents under age 65 and staying essentially stable in residents over age 65. The rehabilitation category is increasing for both age groups, while there are fewer admissions as a proportion of the total whose only needs relate to impaired cognition or reduced physical function. In sum, over the study period, from January 2003 to March 2005, long stay facility admissions appear to be increasingly medically complex with smaller proportion admitted only because of cognitive or functional deficits.
Desire and potential to return to the community in the admission sample—The MDS initial assessment includes questions about whether the beneficiary wishes to return to the community, whether the resident has the support of another person to return home, and when—if ever—facility staff expect the resident to return home. Nationally, 55% of the sample residents under age 65 and 41% of those over age 65 expressed the desire to go home when they were admitted to the nursing facility. Thirty-eight percent of the younger group and 29% of the older group both wish to go home and had the support of another person for returning to the community. Facility staff evaluated 60% of the younger group and 44% of the older group as potentially able to return to the community. Our coding of potential to return to the community may overstate the facility staff’s evaluation as it includes those about whom the staff are uncertain.
The means for these variables are correlated within each state and to some extent across age groups (not shown). Thus, the lowest means for each of these variables is found in Louisiana and Mississippi and the highest in Puerto Rico. However, in the Virgin Islands, while 100% of those under age 65 wish to go home, have support and are assessed as capable of returning home, the high ADL and CPS scores of the elderly may explain the lack of residents expressing a wish to return to the community or a support person available and that 50% are assessed as having the potential to return home.
Summary changes over the study period: ADL, CPS, desire/support/ potential to return home—Table 7 summarizes the changes over time for the samples of residents under and over age 65, regarding ADL scores on admission, CPS on admission, and the percent wishing to return to the community, with support to return, and evaluated as having the potential to return to the community. In summary we see that even as ADL impairment levels are increasing in the facility sample, there is an increase in the desire, support and perceived potential to return to the community.

23
Table 6 Distribution of RUGS-III categories over the study period (January 2003–March 2005)
Under age 65 1 2 3 4 5 6 7 8 9 Total
Behavior problems only 2.3% 2.7% 2.6% 2.6% 2.4% 2.6% 2.8% 2.8% 2.7% 2.6%Clinically complex 20.2 20.2 20.2 20.1 20.0 19.2 19.4 19.6 19.1 19.8 Impaired cognition 5.4 6.0 5.7 5.7 5.2 5.9 5.5 5.4 5.1 5.5 Physical functioning reduced 13.1 13.5 13.5 13.6 12.3 13.3 12.8 11.6 11.1 12.8 Rehabilitation 32.1 30.7 30.9 31.5 33.4 33.0 33.2 34.1 35.3 32.7 Extensive care 12.3 12.7 12.0 12.2 12.7 12.5 12.5 13.2 13.3 12.6 Special care 14.6 14.3 15.1 14.4 13.9 13.6 13.9 13.4 13.4 14.1 Behavior problems only 2.3 2.7 2.6 2.6 2.4 2.6 2.8 2.8 2.7 2.6
Over age 65 1 2 3 4 5 6 7 8 9 Total
Behavior problems only 0.5% 0.5% 0.5% 0.5% 0.5% 0.5% 0.5% 0.5% 0.5% 0.5%Clinically complex 15.8 15.9 15.9 15.4 15.2 15.1 14.9 14.4 13.9 15.2 Impaired cognition 7.4 7.6 7.6 7.0 6.8 7.0 6.9 6.3 6.0 7.0 Physical functioning reduced 13.1 13.9 13.6 13.2 11.9 12.6 12.9 12.4 11.1 12.8 Rehabilitation 44.5 43.4 44.0 45.2 47.4 47.0 47.6 48.7 50.6 46.4 Extensive care 10.9 10.7 10.6 10.9 11.0 10.5 10.2 10.5 10.9 10.7 Special care 7.8 7.9 7.9 7.8 7.3 7.3 7.1 7.1 7.0 7.5 Behavior problems only 0.5 0.5 0.5 0.5 0.5 0.5 0.5 0.5 0.5 0.5
SOURCE: RTI International analysis of Minimum Data Set, 2003–2005.

24
Figure 10 RUG-III classification trends: Under age 65
Figure 11 RUG-III classification trends: Age 65 and over

25
Table 7 Summary changes over the study period by quarter (January 2003–March 2005)
Characteristics of admissions
in the first quarter
Change from January 2003 – March 2005
Residents under age 65 # points on ADL scale (4-18) 9.60 Increasing # points on CPS (0-6) 1.68 Decreasing % wishing to return home 53% Increasing % wishing to return home and has support of another person 37% Increasing
% predicted to return home (includes those about whom staff are uncertain) 59% Increasing
Residents over age 65 # points on ADL scale (4-18) 11.03 Increasing # points on CPS (0-6) 2.41 Decreasing % wishing to return home 38% Increasing % wishing to return home and has support of another person 27% Increasing
% predicted to return home (includes those about whom staff are uncertain) 41% Increasing
SOURCE: RTI International analysis of Minimum Data Set, 2003–2005.
3.4 Admission Analysis Multivariate Models
We used Poisson regression to model ADL score on admission as a function of selected individual characteristics, facility characteristics, state level policy variables, and state level supply variables. Poisson regression is appropriate for a count variable such as ADL scores. Although ADL scores are essentially qualitative in nature (i.e., not pure interval data) they are consistently treated as such throughout the LTC literature. In addition, these ADL scores are related to facility resource utilization.2,3 We modeled the residents under and over age 65 separately since the services available to them are different, because we include age-specific LTC expenditure ratio data, and because the two groups of residents clearly differ in ADL
2 We also tried models using ADL cut-offs as the dependent variable (e.g., 1= ADL score > 4,8, 10, 12 or 14),
acknowledging the categorical nature of this variable. However, the results were similar regardless of the cut-off.
3 Because the NHC criteria is an ordinal, but not internal scale, we also ran a model using a set of dummy variables (i.e., as a categorical variable). The results are shown in Appendix Table A-5. We retained the ordinal variable in the main analysis for two reasons: (1) it allows us to see the effect of increasingly restrictive criteria and (2) we can model marginal effects with an ordinal, but not a categorical, variable.

26
scores, and most other health and functional status measures in the data. Table 8 displays the results for these models.
Impact of the state policy variables—The state policy characteristics are the key variables of interest, holding all other factors constant. Thus, even controlling for time trends, health status and other demographic characteristics, facility characteristics and state supply variables, the Medicaid HCBS/LTC expenditure ratio has a significant and positive effect on the ADL scores on admission for people over age 65, while it is not significant in predicting ADL scores on admission for residents under age 65. In other words, the higher the percentage of long-term care expenditures for home and community-based services, the higher the ADL levels in nursing homes. In contrast, stricter nursing home certifiability criteria have a positive effect on ADLs on admission for residents under age 65 (i.e., result in higher ADL levels on admission), but not for the over 65, and presence of an MFP or NFT grant increases the ADL scores on admission for both groups. These findings are less easily interpreted. As the impairment level is higher on average for the older group, it may be that state NHC thresholds have less impact for the older than younger beneficiaries. Theoretically, we would not expect the presence of an MFP or NFT program to directly effect facility admissions—they aimed at impacting discharge destinations. Perhaps it is an indicator of states with more extensive LTC reform efforts in general.
Impact of the health status and demographic characteristics—In these models, we see that the ADL score on admission increases with increasing cognitive impairment and an increasing number of chronic conditions for both the younger and older groups. This is what we would expect and controls for other case mix differences that might exist across states and facilities. The ADL levels also increase with age for those age 65 and older, but is not significant for younger people with disabilities. Men are admitted to facilities at lower ADL impairment levels for both groups. Younger black facility entrants have lower ADLs on admission, but older black beneficiaries are being admitted with higher ADL scores compared to other groups. Being Asian or Hispanic is also associated with higher ADL score on admission. Living alone prior to admission is associated with lower levels of ADL impairment on admission, while dual eligibility, which provides access to increased services such as the Medicare home health benefit, is associated with higher impairment levels at the time of facility admission.
Impact of facility characteristics—While most facility characteristics are significant predictors of ADL scores on admission, the size of the facility is not, for residents under age 65, the occupancy rate is not significant, and urban location is not for residents over age 65. For profit ownership decreases the ADL scores on admission for residents under age 65, while increasing it for residents over 65. For the older group this may indicate that for profit facilities target groups of beneficiaries for whom payment rates are best, which would be the more intense RUGS groups.
Government ownership is associated with lower levels of impairment on admission for both age groups. Residents of facilities that are part of a chain have higher ADL scores on admission.

27
Table 8 Predicting ADL score on admission
Variable Under age 65
odds ratio Age 65 and over
odds ratio
Time trend (quarter) 1.004*** 1.005*** Expenditure ratio 0.974 1.079*** NHC criteria 1.016*** 1.001 MFP or NFT grant 1.095*** 1.016*** Cognitive performance scale 1.084*** 1.066*** Diagnosis count 1.034*** 1.024*** Age 1.000 1.001*** Male 0.920*** 0.968*** Black 0.984** 1.052*** Asian 1.044*** 1.059*** Hispanic 1.021** 1.052*** Dual eligible 1.055*** 1.055*** Lived alone prior to admission 0.966*** 0.973** Number of certified beds 1.000 1.000 For profit 0.928*** 1.008 Government 0.954** 0.963*** Occupancy rate 0.992 1.074*** Urban 0.970*** 1.001 Chain 1.043*** 1.020*** Heating degree days/365 1.005*** 1.004*** Hospital bed supply/1000 elderly 1.088*** 1.019*** Physician supply/1000 elderly 0.999 1.002*** Nursing facility bed supply/1000 elderly 0.9934*** 0.997*** Constant 7.455*** 6.437***
NOTES: * p<0.05, ** p<0.01, *** p<0.001
SOURCE: RTI International analysis of MDS and OSCAR data, January 2003–March 2005.
Impact of state supply variables—Hospital bed supply and heating degree days are associated with higher levels of ADL impairment on admission for both groups, and physician supply significantly increases the ADL scores on admission for residents over age 65, but is not a significant predictor for residents under age 65. The greater the supply of facility beds in a state, the lower the level of ADL impairment of new admissions. This is a key research finding important to developing strategies for rebalancing. Policy makers sometimes consider constraining bed supply to target facility care to the most impaired, either directly through certificate of need regulations or indirectly by providing little financial incentive to increase bed supply. These results show that on average, facilities are behaving as one would hope: i.e., taking

28
more impaired residents when bed supply is tighter instead of choosing lighter care patients when bed supply is tight. However, interpreting this finding is complicated in light of the fairly low average occupancy rates (about 86%) observed in the data.
Comparison to non-Medicaid (Medicare-only) long-stay residents—As a sort of sensitivity analysis, we also modeled ADLs on admission for another sample: long-stay residents without Medicaid (not shown). We did this to see if the time trend variable showed a background trend of increasing ADL scores over time (it did) and also to see the impact of the state policy variables. We hypothesized that the Medicaid HCBS/LTC expenditure ratio would not affect ADL scores on admission for Medicare-only beneficiaries as they are not eligible for Medicaid HCBS. In other words, we expect Medicaid HCBS to help Medicaid beneficiaries remain in the community, but not beneficiaries who only have Medicare.
Over the 2.5 year study period, there were 1,568,606 long-stay nursing home entrants with Medicare but not Medicaid. The total included in this regression analysis, i.e., those without any missing data for variables in the model, was 1,456,676: 58,156 under age 65 and 1,398,520 over age 65. Thus while the under age 65 non-Medicaid residents are a small group, there were many non-Medicaid long-stay residents. We did not try to determine whether these reflect extended post-acute stays or long-term facility residents paying privately or with private LTC insurance.
For this population, the Medicaid HCBS/LTC expenditure ratio variable had a significant negative effect on number of ADLs at admission, while it had a significant positive effect for the Medicaid population. We see this result in both multivariate and univariate models. Since Medicaid service availability should not have a direct effect on Medicare beneficiaries’ facility use, we considered other possibilities. Our explanation is the following, hypothetically dividing candidates for nursing facility admission into two groups—“very sick” and “not very sick.” The “very sick” Medicaid and Medicare groups go to a nursing facility without choice, but if the "not very sick" Medicaid group is kept in the community by represented by the Medicaid HCBS/LTC expenditure ratio, the nursing facility vacuum is filled in by the remaining Medicare "not very sick" group. This way the average ADL score would increase for the Medicaid population and decrease for the Medicare population when the Medicaid HCBS/LTC expenditure ratio increases. If this is the case, then as Medicaid rebalances, Medicare beneficiaries may fill the resulting gap in nursing facility admissions. One test of this would be to evaluate occupancy rates over time.
3.5 Effect Decomposition Analysis
Changes in an outcome over time, such as we see in the ADL scores, can result from various sources. First, the case mix of the nursing facility population may change over time. For example, if the age distribution of new entrants changes or the diagnostic profile changes then the resulting proportion of residents with certain characteristics changes. This component of change is referred to as the characteristics effect or observed effect. Outcomes may also change over time if the value associated with various characteristics changes, for example, if the impact of Medicaid HCBS/LTC expenditure ratio becomes greater. This type of effect is often referred to as the unexplained or coefficients effects. The classic example of effect decomposition is analysis of changes in earnings by gender. A change in the proportion of women: men in the

29
workforce would be an explained or characteristics effect, while changes in the earnings values associated with being either female or male would be an unexplained or coefficient effect.
Using regression based decomposition analyses we decomposed the average change in ADL scores between the first and last quarters of the admission sample to the part due to case mix changes versus the contribution resulting from changes in the coefficient values associated with the variables.
For residents under age 65, this decomposition showed that the increase in mean ADL scores is almost all due to changes in the coefficients over time (95% of the effect), not to change in the underlying case mix over time (only 6% of the effect). In other words, any observed increases in ADL scores over time reflect the impact of the individual variables rather than shifts in the composition of the sample. The results are similar for residents age 65 and over with 87% of the increase related to changes in the coefficients over time, and only 13% due to changes in case mix.
Effect decomposition is also useful to rank the relative impact of independent variables. We grouped the variables by type into individual characteristics, facility characteristics and state policy variables and then ranked the effects of each variable within its type. Of the state policy variables, the Medicaid HCBS/LTC expenditure ratio makes the biggest contribution; age makes the biggest contribution of the individual level variables; and facility size has the greatest impact of the facility level variables.


31
SECTION 4 DISCHARGE DESTINATION ANALYSIS
4.1 Discharge Destination Analysis
As states increase their investment in HCBS and in coordinating systems of care, facility residents should have more support available to return to the community. First, if they were receiving services prior to admission, even if the admission were prolonged, they may be able to return to those. Second, even if they were not receiving services prior to admission, an enriched service system would provide more options for returning to the community- either back to their own homes or to less restrictive settings such as assisted living. Third, states might have programs specifically designed to identify people who wish to return to the community and link them to needed services. Finally, there are programs and policies designed to address obstacles to return after a long facility stay. These include assistance finding and paying for housing, purchasing appliances and basic furniture, as well as providing ongoing support services.
CMS has invested substantial resources in grant programs aimed specifically to accomplish these goals. Money Follows the Person (MFP) grants are intended to support states in their efforts to create a system of flexible financing for long term services and supports that allows funds to move with the individual to the most appropriate and preferred setting for that individual. Nursing Facility Transition grants provide states with funding to assist state efforts to develop a nursing facility transition and diversion program that identifies consumers in institutions wishing to transition to the community and supports them to do so. An NFT program is also a component of MFP. In addition, states have access to other funding sources to support these types of activities or have developed projects independently.
The MDS discharge assessment includes information about discharge destinations, in other words, the type of setting to which the beneficiary is being discharged. This allows us to address the following research questions:
• How does the proportion of long-stay Medicaid residents who are discharged back to the community (all community settings) vary across states and over time?
• How does the proportion of long-stay Medicaid residents who are discharged back to the community to a setting with support services vary across states and over time?
• What factors are associated with variation in discharge destinations?
• How do selected state LTC characteristics and facility characteristics relate to observed differences in discharge destinations?
4.2 Discharge Destination Sample Selection
The discharge sample includes all Medicaid residents with discharge assessments in the MDS and with stays of 30 days or longer between April 2003 and June 2005. We inferred length of stay longer than 30 days by eliminating individuals with a previous discharge assessment or initial assessment within a 30 day period. The initial sample includes 193,649 long-stay residents under age 65, and 828,449 over age 65. After eliminating observations with missing data on the
32
variables of interest (discharge destination, demographics and insurance) the data files we used in multivariate analysis include 192,248 discharges for residents under age 65 and 818,904 discharges of residents over age 65.
4.3 Discharge Destination Variable Construction
We used the same facility characteristics, state long-term care policy variables and state supply variables as used in the admission sample. The demographic variables available were limited to age, gender, race, and dual eligibility for Medicare and Medicaid. Although date of admission is an available field on the discharge assessment, it was missing too often to include it in the analysis. Thus we were neither able to study length of stay nor the relationship between length of stay and discharge destinations.
The discharge destinations available in these assessments are the following:
• Private home
• Private home with home health
• Assisted living
• Acute care hospital
• Psychiatric hospital
• Rehabilitation hospital
• Another LTC facility
• Death
We created two variables from these discharge destinations for use as dependent variables in the multivariate analysis. We created one dummy variable indicating if the whether the resident was discharged to the community, which we defined to include private home, private home with home health, and assisted living, and we set all other discharge destinations set to 0. We created a second dummy variable indicating if the resident was discharged to the community with services, identified on the discharge assessment as discharged with home health, or discharged to an assisted living facility, setting all other discharge destinations to 0. Some of those who are coded as returning to private homes without home health services may be receiving other HCBS, but this information is not available in the MDS discharge assessments.
4.4 Discharge Destination Analysis Descriptive Findings
• A higher proportion of people under age 65 are discharged from nursing facilities to the community compared to those 65 (both to the community and to the community with services)
• Discharge destinations vary across states
• Nationally and in several states, discharges to the community are increasing over time—even controlling for case mix changes and against the backdrop we observed in the admission analysis, that the facility admissions are increasingly impaired over time.

33
Table 9 displays the characteristics of the discharge sample, including basic individual demographics, characteristics of the facilities from which the residents were discharged and basic state level characteristics for states in which the resident discharges occurred, for both age groups: residents under age 65 and those age 65 and older. The mean age of residents under age 65 population is 51, and 83 in the residents over age 65. A little over half of those under age 65 are men, compared to less than a third of the older group. Facility residents in both groups are predominantly white, though blacks are a substantially higher proportion of the residents under age 65 sample (26%) compared to the residents over age 65 sample (13%). Not quite half of the younger group are Medicare/Medicaid dually eligible beneficiaries, compared to 93% of the residents over age 65.
As in the admission analysis, we used OSCAR data to examine the characteristics of the nursing facilities from which the sample is being discharged. The results are similar to those for the admissions analysis in terms of the average facility size, facility ownership, occupancy rates and chain versus independent ownership for both age groups. Residents under age 65, resided in- and were discharged from—somewhat larger facilities. Most were discharged from for profit facilities (77% of residents under age 65 and 69% of those over age 65), with similar occupancy rates (84% and 86%). Most individuals were discharged from nursing facilities in urban areas (83% of those under age 65 and 75% of those over age 65). Almost 60% of those under 65 years of age were discharged from facilities that were part of a chain during the study period, compared to a little more than half of the elderly.
We included the same state policy and supply variables as in the admission analysis. We hypothesize that the presence of an MFP or NFT program and higher Medicaid community LTC expenditures as a proportion of total Medicaid LTC expenditures would support community discharges, especially to settings with services. In other words, we expect residents in states with MFP or NFT programs to have a higher likelihood of being discharged to the community, especially to settings with services, compared to residents in states without these programs. We also expect that as the Medicaid HCBS/LTC expenditure ratio increases, the likelihood of being discharged to the community, especially to the community with services, also increases.
Because the literature has shown people who live in colder states are at higher risk for nursing home admission (Weissert, Elston, and Koch, 1990), we also wanted to examine heating degree days as a factor discharges to the community. One might hypothesize that in areas with a higher risk of institutionalization there would also be a lower likelihood of community discharge because both might be a function of limited HCBS. Further, we anticipated that nursing home admission criteria might have an affect on the percent of discharges to the community since those states with stricter nursing home admission criteria are more likely to admit individuals who are more frail than those with less stringent criteria, in this case potentially decreasing the likelihood of community discharge. Alternatively, states with stringent facility entrance criteria might also be states engaged in a wider array of LTC reforms and might be places where the likelihood of community discharge, or discharge with services would increase.

34
Table 9 Discharge sample characteristics
(April 2003–June 2005)
Residents under age 65 Residents age 65 and over
Obs Mean Std Dev Min Max Obs Mean Std Dev Min Max Community discharge 212229 49.9% 0.500 0 1 899254 20.7% 0.405 0 1 Community with services 212229 28.8 0.453 0 1 899254 14.5 0.352 0 1 Age 212359 51.07 10.986 0 64 899525 83.18 8.639 65 123 Male 212319 53.8 0.499 0 1 899438 29.0 0.454 0 1 Black 211582 26.0 0.438 0 1 897177 13.5 0.341 0 1 Hispanic 211582 7.5 0.264 0 1 897177 5.2 0.221 0 1 Asian 211582 1.5 0.122 0 1 897177 1.8 0.134 0 1 White 211582 63.7 0.480824 0 1 897177 79.0 0.407419 0 1 Dual Eligible 212359 48.0 0.500 0 1 899525 93.8 0.241 0 1 Number of Beds 194507 154.7 122.715 2 1389 830918 143.7 97.581 2 1389 Non-Profit 212359 16.4 0.370354 0 1 899525 22.9 0.420149 0 1 For Profit 212359 70.2 0.458 0 1 899525 63.8 0.481 0 1 Government 212359 5.0 0.218 0 1 899525 5.7 0.232 0 1 Occupancy Rate 194507 83.5 0.147 0.010 1 830918 86.1 0.137 0.010 1 Urban 212359 75.7 0.429 0 1 899525 69.1 0.462 0 1 Chain 212359 52.1 0.500 0 1 899525 49.9 0.500 0 1 NHC Criteria (1-5) 212343 2.19 1.165 1 5 899492 2.34 1.173 1 5 Expenditure Ratio (0-1.0) 210775 0.57 0.131 0.28 0.97 889107 0.20 0.109 0.05 0.51 MFP or NFT Grant 212359 62.6 0.484 0 1 899525 63.9 0.480 0 1 Hospital Beds/1000 65+ 212343 2.8 0.633 1.8 6.1 899492 2.9 0.648 1.8 6.1 Physicians/1000 65+ 212343 21.9 5.340 12.8 64.4 899492 21.5 5.299 12.8 64.4 NF bed/1000 65+ 212343 45.1 12.494 16.5 71.0 899492 45.1 11.978 16.5 71.0 Heating Degree Days/365 212343 12.6 5.661 0 27.8 899492 12.7 5.748 0 27.8
SOURCE: RTI International analysis of MDS and OSCAR data, April 2003–June 2005.

35
Community Discharges
Figures 12 and 13 are pie charts showing the proportion of the under and over age 65 samples associated with each discharge destination. We examined the percentage of discharges by type of discharge and by state for the under age 65 and the 65 and older resident population to identify differences across states. The scatter plots in Figures 14 and 15 show how individual states are dispersed relative to the national average, represented by the dark line through the center of the scatter plot. A detailed state-by-state table showing the number and percent of discharges to each potential discharge destination in Tables A-6a and A6b, found in the appendix.
Nationally, half of residents under age 65 were discharged from a nursing facility to the community during the study period (April 2003–June 2005), compared to about a fifth of residents over age 65. Of those under age 65, 29% were either discharged home with home health services or to an assisted living facility. Of those over age 65, only 15% were discharged to the community with services.
The analysis shows that several states are close to the national average for discharges to the community for residents under age 65. A few, including Oregon, Washington and New Hampshire, are more than 10 percentage points above the national average.
It is also noteworthy that a few states are more than 10 percentage points below the national average, including Iowa (39%), Louisiana (39%), and Mississippi (36%) with Mississippi being the farthest below the national average for discharges the community for the under age 65 population.
With regard to community discharges for older facility residents, a few states are doing substantially better than the national average of 21% (Figure 15). These include Alaska (37%), California (31%), and Oregon (31%) among others.4 A few states also fell below the national average by almost 10 percentage points, including New Hampshire (13%), Iowa (11%), and North Dakota (10%).
Discharged to the Community with Services
The proportion of individuals discharged to the community with services (a subset of those discharged to any community setting) nationally is shown visually in the earlier pie charts, Figures 12 and 13. The following scatter plots, Figures 16 and 17, show the dispersement of individual state discharges to the community with services around the national means.
4 Alaska only had 572 total discharges in the 65 and older sample during the study period, while California had
74,158; Florida had 13,858; and Oregon had 6,940.

36
Figure 12 Nursing facility discharge destinations in U.S.—Under age 65
Figure 13 Nursing facility discharge destinations in U.S—Age 65 and over

37
Figure 14 Community discharge by state—Under age 65
Figure 15 Community discharge by state—Age 65 and over

38
Figure 16 Community discharge with services by state: Under age 65
Figure 17 Community discharge with services by state: Age 65 and over

39
Comparing individual states to the national average for those discharged to the community with services, we found that nursing homes in a several states discharged a significantly larger percentage of individuals under age 65 to the community with services than the national average (29%). Facilities in Connecticut (49%), Massachusetts (45%) and Michigan (45%) each discharged almost twice the national percentage of residents under age 65 to the community with services and New Hampshire discharged more than twice of the national average (53%). In addition, nursing homes in a few states, such as Illinois (11%), Louisiana (10%), and Oklahoma (13%) discharged substantially fewer residents under age 65 to the community with services than the nation as a whole (see Figure 17 and Appendix Table A-6a).
The state standouts for discharges to the community with services for the elderly are California and Oregon. Nursing facilities in both states discharged more than twenty percent of elderly residents to the community with services compared to the national average of 15%. At the other end of the spectrum, other states are also noteworthy, but because the percentage of elderly discharged to the community with services is almost 10 percentage points below the national average. Iowa (8%), North Dakota (6%), Oklahoma (8%), and South Dakota (8%) are among those states where facilities are discharging a lower percentage of elderly persons to the community with support.
For illustrative purposes, Table 10provides several state examples of discharge destinations for residents under age 65. Washington State has one of the highest proportions of community discharges total (62%) and to assisted living specifically (14%). Maryland is as an example of state similar to the national average for these variables, and Louisiana is one of the states with the lowest proportion of discharges to the community total, especially with services.
Table 10 Selected discharge destinations in three states: Residents under age 65
(April 2003–June 2005)
Community–All
Community with services
Home w/o paid help
(%)
Home w/ home health
(%)
Assisted living (%)
Death (%)
United States 21 22 7 18 Washington 27 21 14 15 Maryland 20 23 7 18 Louisiana 29 9 1 29
SOURCE: RTI International analysis of Minimum Data Set, April 2003–June 2005.
Table 11 shows the same information for the over 65 sample. Again we see substantial differences in the proportion discharged with services, especially to assisted living.

40
Table 11 Selected discharge destinations in three states: Residents over age 65
(April 2003–June 2005)
Community–All Community with services
Home w/o paid help
(%)
Home w/ home health
(%)
Assisted living (%)
Death (%)
United States 6 12 3 58 Washington 6 10 10 58 Maryland 4 11 3 63 Louisiana 9 7 0.3 61
SOURCE: RTI International analysis of Minimum Data Set, April 2003–June 2005.
In Table 12, we separate the national samples by dual eligibility for Medicare and Medicaid. Theoretically, we might expect that a higher proportion of Medicare/Medicaid dually eligible beneficiaries would return to the community with services compared to Medicaid-only beneficiaries as they have access to additional, Medicare funded, home health benefits. This appears to be the case for residents under age 65, for whom 24% are discharged to a private home with home health compared to only 19% of those with Medicaid only. However, for residents over age 65, the proportion going home with home health is similar for the two groups (12%).
Table 12 Community discharge destinations by Medicare/Medicaid dual eligibility status
Under Age 65 Over age 65
Medicaid-only Dual Eligible Medicaid-Only Medicare-only
(n=110,442) (n=101,912) (55,480) (844,045)
Home 25% 17% 9% 6%
Home with home health 19 24 12 12
Assisted Living 7 8 3 3
Total Community discharges 51 49 24 21
SOURCE: RTI International analysis of Minimum Data Set, 2003–2005.
41
4.5 Discharge Destination Time Trends
Looking at descriptive data (not shown), it appears that nationally, and in many states, the proportion of facility residents being discharged back to the community, and to the community with services, increased between April 2003 and June 2005. However we wanted to examine these trends taking into underlying case mix changes that might effect these trends. While there is no health or functional status information available on the discharge assessments, there is demographic information.
Using logistic regression analysis we examined time trends for the likelihood of discharge to the community- nationally and for each state, controlling for demographic characteristics. Detailed national and state by state results are shown in the appendix, Table A-7, presenting odds ratios that show annualized trends. The trend analysis shows that most states are increasing in the proportion of nursing home residents being discharged to the community, controlling for resident case mix, but the finding is only statistically significant for five states—Florida, Indiana, Michigan, New York, and North Carolina—for residents under age 65, and 11 states—Arizona, California, Florida, Indiana, Missouri, New Jersey, North Carolina, Pennsylvania, South Carolina, Texas, and Washington—for residents over age 65 and older sample. One state—Illinois—shows a statistically significant decrease in the proportion of discharges to the community for both resident sample populations under age 65 and 65 and older.
4.6 Discharge Destination Multivariate Analyses
• State policy variables are significant predictors of the likelihood of community discharge, with the exception of the nursing facility admission criteria for residents over age 65
• The Medicaid HCBS/LTC expenditure ratio is an important policy variable – the higher the portion of spending for community LTC the higher the likelihood of individuals going home
Multivariate Findings
We estimated separate logistic regression models predicting the probability of being discharged to the community and to the community with services (separately for under and over age 65). Table 13 presents the results of these models. We also repeated these analyses splitting the residents into three age groups, under age 65, 65–74, and 75 and over (see Table A-8 in the appendix). The results are similar, though more marked for residents age 75 and over compared to the results shown here where all residents age 65 are included together.5
5 Because the NHC criteria is an ordinal, but not internal scale, we also ran a model using a set of dummy
variables (i.e., as a categorical variable). The results are shown in Appendix Table A-9. We retained the ordinal variable in the main analysis for two reasons: (1) it allows us to see the effect of increasingly restrictive criteria and (2) we can model marginal effects with an ordinal, but not a categorical, variable.

42
Table 13 Probability of discharge to the community
Under 65 65 and Over Under 65 65 and Over
Variable
Discharge to community odds ratio
(n=192,248)
Discharge to community odds ratio
(n=818,904)
Discharge to community
with services odds ratio
(n=192,248)
Discharge to community
with services odds ratio
(n=818,904) Time trend (quarter) 1.008 * 1.008 *** 1.015 *** 1.018 *** Expenditure ratio 1.579 *** 2.714 *** 1.805 *** 2.056 *** NHC criteria 0.961 *** 0.977 ** 0.997 1.008 MFP or NFT grant 1.094 ** 0.912 *** 1.302 *** 0.921 *** Age 0.991 *** 0.920 *** 0.998 0.929 *** Male 0.819 *** 0.721 *** 0.716 *** 0.684 *** Black 0.983 1.378 *** 0.852 *** 1.266 *** Asian 0.844 *** 1.948 *** 0.818 *** 1.443 *** Hispanic 1.055 2.105 *** 0.921 ** 1.645 *** Dual eligible 0.928 *** 1.122 *** 1.323 *** 1.281 *** Number of certified beds 1.000 1.000 * 0.999 ** 0.999 *** For profit 0.894 *** 0.950 * 0.870 *** 0.903 *** Government 0.856 * 0.740 *** 0.777 ** 0.720 *** Occupancy rate 0.786 ** 0.651 *** 1.155 0.784 ** Urban 0.988 0.978 1.170 *** 1.140 *** Chain 1.090 *** 1.062 *** 1.162 *** 1.090 *** Heating degree days 1.025 *** 1.008 *** 1.037 *** 1.019 *** Hospital beds/1000 elderly 0.989 0.963 * 1.061 * 0.943 ** Physicians/1000 elderly 0.998 1.005 ** 1.010 *** 1.013 *** Facility beds/1000 elderly 0.988 *** 0.990 *** 0.977 *** 0.983 *** Constant 2.494 *** 408.3 *** 0.291 *** 92.29 ***
NOTES: * p<0.05; ** p<0.01; *** p<0.001
SOURCE: RTI International analysis of MDS and OSCAR data, April 2003–June 2005.
Time Trend—We looked previously at the time trends for each state using only demographics as control variables. Controlling now for all case mix, facility and state characteristics, more individuals are being discharged to the community over time, indicating states are making progress towards moving individuals out of nursing homes. The analysis shows that every quarter, the probability of being discharged to the community increases by a factor of 1.008 for nursing home residents in both age groups, all other variables in the model being held constant. In other words, every quarter the likelihood of being discharged to community is increasing almost 1%, an annual rate of over 3%. When the dependent variable is defined as community discharge with services, i.e., home with home health or to an assisted living facility, change is increasing at a faster rate. Every quarter, the likelihood of being discharged to the community with services increases for both those under age 65 and for the elderly by a factor close to 1.02, all else constant (p<.001). In other words, the likelihood of being discharged to the

43
community with services increases almost 2% every quarter, or 6% annually for those under age 65 and over 7% annually for those over age 65.
Impact of the State Policy Variables—The Medicaid HCBS/LTC expenditure ratio is positively associated with the odds of being discharged to the community in all four models and is statistically significant. As the proportion of spending for community long term care within a state goes up, the odds of nursing home residents being discharged to the community and to the community with services increase for residents in both age groups. It is not easy to directly interpret the size of the effect from the odds ratio in this case, as a one unit increase in this variable is not meaningful. To understand the impact of this variable in the models, we calculated an increase of 10 percentage points in the HCBS expenditures. For example, raising the ratio by 0.1 from 0.57 to 0.67 in the model estimating community discharge for residents under age 65 the odds increase by a factor 1.105 (odds ratio 2.714 raised to the 1/10th power). To place this finding in terms of dollars, for every additional ten out of one hundred dollars spent for community long-term care, the likelihood of going home to the community increases by 4.7% for residents under age 65, and by 10.5% for residents over age 65. It also increases the likelihood of going home to the community with services by 6.1% for the younger group and 7.5% the elderly, controlling for all other factors.
States’ nursing facility admission level of care criteria also has a statistically significant effect on the probability of being discharged to all community locations for residents in both age groups. The more stringent a state’s nursing facility level of care criteria, the lower the likelihood of nursing home residents being discharged to the community for both those under age 65 and those age 65 and older. This finding supports the hypothesis that stringent admission criteria might be associated with a more frail facility population with less ability to return to the community. However, when the sample is subset to discharges to the community with support, nursing home level of care criteria is no longer a statistically significant predictor.
Nursing facility residents under age 65 who live in states with an MFP or NFT grant have a significantly higher probability of being discharged to the community and to the community with supportive services than those in states without one of these grants. The opposite is true for elderly nursing home residents in states with one these grants. The likelihood of being discharged to the community and to the community with services decreases for the elderly if they are in one of the states with these grants. It is difficult to interpret this finding or to be assured that this variable actually measures MFP or NFT activity in light of the small amount of progress states had made in implementing their MFP or NFT grant programs during the study period. Theoretically this finding could indicate that MFP and NFT programs are targeting residents under age 65. Alternatively, this variable may be a marker for some other state characteristic, or perhaps states with low rates of community discharge with services for older residents applied for MFP or NFT funding to address this problem.
Impact of Demographic Characteristics—Overall, demographic variables function in these models the way one would expect. As age increases, the odds of being discharged from a nursing facility to the community decreases by 1% for residents under age 65 and by 8% for residents over age 65. In contrast, age is not a statistically significant predictor of the likelihood of being discharged to the community with services for residents under age 65, but is a

44
significant predictor for the elderly. Being male significantly decreases the likelihood of being discharged to the community, and to the community with services in all models.
Of the racial categories, being black is a statistically significant predictor of outcomes, except of discharge to the community for residents under age 65, while being Asian is a statistically significant predictor in all four models. Being black or Asian decreases the likelihood of being discharged to the community and to the community with services for residents under age 65; however, the opposite is true for residents age 65 and over where being black or Asian increase the likelihood of being discharged to the community with services. Being Hispanic also operates differently in the models depending upon whether the individuals are under or over age 65, but is not statistically significant in predicting community discharge for residents under age 65. Being Hispanic compared to non-Hispanic increases the odds of being discharged to the community and to the community with services for those 65 and older by a factor of 2.1 and 1.6 respectively (p <.001).
Dual eligibility status is also a statistically significant predictor. Having dual eligibility status increases the odds of transitioning from a nursing facility to the community and to the community with services for the elderly and to the community with services for residents under age 65. The opposite is true for the dually eligible under age 65 being discharged to the community.
Impact of Facility Characteristics—The size of the facility is only slightly significant in predicting community discharge for residents over age 65, and has only a small effect on the likelihood of individuals 65 and older being discharged to the community. The analyses show that as the size of the facility increases, the likelihood of individuals in both age groups being discharged to the community with services decreases by a factor of 0.999. In other words, for each additional bed, the likelihood of being discharged with services decreases very slightly. Residents of all ages in for profit and government operated (usually county) facilities are much less likely to be discharged to the community or to the community with services than those in not-for-profit nursing facilities. Residents in facilities that are part of a chain compared to those in an independent facility have a significantly higher probability of being discharged to the community, whether in general or with supportive services.
Theoretically the occupancy rate of a nursing facility should be related to discharge patterns. Lower occupancy rates might reflect shorter stays or conversely, facilities with lower occupancy rates have less incentive to discharge their residents. Results of this analysis show that indeed the occupancy rate significantly affects the probability of transitioning to the community for residents in both age groups. The higher a facility’s occupancy rate, the less likely nursing home residents in either age group are to be discharged to the community. On the other hand, when the sample is restricted to discharges with services, the effect is only significant for the older age group.
Living in an urban area also significantly increases the probability of both sample populations being transitioned to the community with supportive services, all else constant, but is not significant for being discharged to the community.

45
Impact of State Supply Variables—Our finding regarding the number of heating degree days is significant in all the models. The colder the state in which nursing facility residents reside, the more likely they are to transition to the community, whether in general or with supportive services- despite the increased likelihood of admission reported in the literature. Thus, heating degree days may be a regional marker, separating northern and southern states, and the difference observed in these models may relate to regional differences in the availability of HCBS or other unobserved characteristics.
Of the state supply variables included in the models, only the number of nursing facility beds per 1000 elderly in a state has a significant effect in all models. The more nursing facility beds available in a state, the less likely nursing facility residents are to be discharged to the community and to the community with services.
Examining the remaining supply variables, increasing hospital bed supply is associated with a lower likelihood of discharged to the community or to the community with services for residents over age 65, but an increased likelihood of discharged to the community with services for residents under age 65. The more physicians per 1000 elderly in a state the greater the likelihood of nursing facility residents being discharged to the community with services regardless of age, and the greater the probability of the nursing facility residents under age 65 going home to the community in general. Neither of these variables is significant in predicting discharges to the community for the under age 65 sample population.
4.7 Effect Decomposition Analysis
Using the same methodology explained in section 3.5 of the admission analysis, we decomposed the changes over time in the proportion of residents discharged back to the community, and to the community with services. For residents under age 65, only 4% of the increase in the proportion discharged to the community was due to changes in the demographic characteristics of the sample over time, while 96% was due to the coefficients effects. For residents over age 65, 33% of the change is due to changing demographics (primarily age) while 67% is due to changes in the values associated with each variable.
Decomposing the change in the proportion discharged to the community with services is more consistent across age groups: the characteristics effects is only 4% for the residents under age 65 and only 2% for residents over age 65. In other words, almost all of the change is associated with the changing value of the coefficients—94% and 98% respectively.
4.8 Marginal Effects Analysis
We predicted the marginal effect of increasing the state Medicaid HCBS/LTC expenditure ratio on the probability of being discharged to the community. The marginal effect was calculated as the difference in the mean predicted value of the outcome using the raised vs. actual ratio. We used the calculation to show examples of the ratio increases, which will significantly increase the proportion of community discharges.
We found that the marginal effect of increasing the Medicaid HCBS/LTC ratio to a balanced (50/50) one for the elderly, (Oregon’s Medicaid HCBS/LTC expenditure ratio is 51%) would result in an increase of the average proportion of community discharges: the proportion

46
will increase by 4.7% for the community discharges nationally and by 3.0% for the community discharges with help, and both changes are 95% statistically significant. This finding confirms the earlier finding in the regression (Section 4.5) as the magnitude of the effects are in agreement.

47
SECTION 5 CONCLUSIONS AND RECOMMENDATIONS
Our goals in this pilot project were both methodological and substantive. Methodologically, we wanted to see if MDS analyses could be used to provide useful information about state long-term care reform efforts on a routine basis and to pilot the approach, identifying potential future refinements to the approach we piloted. Substantively, we wanted to analyze differences in long-term care users experience across states and across time taking state policy differences into account. This section has three parts. First, we summarize the substantive findings and discuss them in light of the original hypotheses. Second, we discuss the effectiveness and limitations of the pilot as a monitoring tool for seeing how the nation as a whole and individual states are doing in reforming their long-term care systems. Finally, we present recommendations for extending and refining this approach.
5.1 Results of Hypothesis Testing
H1: The original idea of this hypothesis was to examine how the community service system is developing by looking at the nursing home case mix. If the community service system and other long-term care reforms are maturing, then it would be possible to keep people with cognitive impairments at home and those at lower levels of ADL impairment. Nursing home will be filled with more functionally or clinically impaired people, and less with people with fewer care needs. In addition, over time, the community service system would be able to care for people at increasing levels of impairment.
This hypothesis was confirmed by the descriptive results:
• Over time nursing homes are admitting patients with higher on average ADL score and slightly lower on average CPS score (part 1 of Table 7),
• The structure of the nursing home case mix is changing, as well as the means for various health and functional status measures—over time the proportion of higher intensity residents (identified as Rehab groups under RUGS-III) is growing and the proportion of lower intensity residents is decreasing (Table 6).
• In terms of diagnoses, nursing homes residents are progressively sicker on admission (Table 5, and the average number of diagnosis goes up).
It is also interesting that although the resident population is getting sicker, the proportion of persons wishing and judged as having potential to go home is increasing; this might also be evidence of the development of good community supports or of facility staff’s growing awareness of community supports (part 2 of Table 7).
We then wanted to see if the observed time trends would still be significant controlling for the available demographic, facility, and state characteristics. The multivariate models confirmed these findings (Table 8). We also saw that the same time trends are significant for the majority of states, despite substantial state variation at the outset (Table 4).
H2: We evaluated community changes by looking at a discharge cohort: if the proportion of persons discharged to the community, particularly with services to the extent the MDS data

48
provides this information, is increasing over time then it would appear that long-term care reforms are having the desired effects. The analysis confirms this hypothesis.
• The proportion of discharges to the community, and especially with services, is increasing with time. The absolute increase is relatively small, but given the fact the admission case mix keeps getting sicker, one would expect to see a decrease in proportion of patients discharged to the community. The fact that we still see an increase suggests improvement in available community services or the linkages between facilities and the community.
• The multivariate analysis confirms that the positive time trend of community discharges is significant controlling for demographic, facility and state level variables. Time trend analysis on the individual state level also shows that this trend is significant in the majority of individual states despite all state variation.
• The other key finding of the discharge sample analysis was that the Medicaid HCBS/LTC expenditure ratio has a positive significant effect on the probability of being discharged to the community. This finding was strengthened by checking the impact of this variable in the non-Medicaid (Medicare-only) population where the Medicaid HCBS/LTC expenditure ratio did not increase the probability of being discharged to the community. This suggests that the effect associated with the Medicaid HCBS/LTC expenditure ratio was not due to other unknown state confounders in the discharge analysis.
H3: We hypothesized that the changes that we observe are mainly due to the implemented reforms, not due to differences in the case mix which occur with time.
Using effect decomposition techniques, we learned that the main part of the effects is attributed to the changes in the way the same variables work with time (coefficients effect), not to the changes in the variables (characteristics effect). These results show that the observed changes are mostly due to the changes in how the variables affect the outcomes, and supports this hypothesis.
5.2 Summary of Substantive Findings
The increasing functional impairment levels, the increased number of chronic conditions of newly admitted long-stay nursing facility residents, and the proportion of long-stay residents returning to the community are potential indicators of the effects of state rebalancing efforts. The time trends were significant in all models, indicating that even holding all other factors constant, the LTC system is moving gradually in the desired direction. Specifically, nationally and in many states, ADL scores on admission are increasing over time for beneficiaries under and over age 65. The likelihood of community discharge also increased over the study period, including the likelihood of being discharged with services. We also see that there is state variation on these measures and on the rate of change. These patterns are occurring against a backdrop of other changes in the health status of facility admissions that suggest facility residents are generally increasing in their acuity levels.

49
Financial rebalancing, indicated in this study by increasing Medicaid long-term care expenditures on community services as a proportion of a total Medicaid long-term care expenditures, is associated with the likelihood of discharge to the community for Medicaid beneficiaries. The effect is strongest in relation to discharge to the community with services. Simulations showed that increasing Medicaid home and community-based long-term care expenditure ratios could be expected to increase the likelihood of this outcome. In addition, effect decomposition analyses indicate that this variable has the greatest effect on outcomes of the state characteristics. The likelihood of community discharge for another population—long-stay residents with Medicare only—was not positively effected by the Medicaid community long-term care variable. This is inconsistent with a counter hypothesis that all observed changes might be due to background trends unrelated to state Medicaid long-term care policies.
In addition, we saw that the presence of an MFP or NFT grant in the states was associated with an increase in ADL scores on admission for both residents under and over age 65, and an increase in the likelihood of community discharges for residents under age 65. These results are harder to interpret, particularly because the impact of the MFP or NFT programs were unlikely to be large because of their slow start up. Indeed, in some states, the decision to request funding for an MFP or NFP program might reflect an awareness of the need to address unmet needs for community discharge (e.g. Louisiana). In other states, this may be a proxy for strength in their community LTC system as MFP initiatives in particular are complex “late stage” investments in LTC reform. For example, because the presence of an MFP or NFT grant was associated with higher ADL scores on admission, a measure we would not expect them to directly effect, it may indicate that states with MFP or NFT grants have already pursued utilizing more restrictive facility admission requirements.
The findings regarding state nursing home certifiability criteria as a predictor variable are more mixed. As a predictor of ADL scores on admission, state NHC criteria were significantly associated with higher levels of impairment only for the residents under age 65. This could reflect the weak association between the state NHC criteria and the level of ADL impairment measured by the ADL score, and differences between residents under and over age 65. However, the state NHC criteria do not have an effect on the likelihood of community discharges. The lack of a direct effect is logical, however, only if more impaired individuals are accessing facility care to begin with; then we would expect fewer residents to be able to return to the community.
5.3 Methodological Findings
First and foremost, this pilot study shows that it is feasible to use the MDS to monitor important aspects associated with long-term care reform of nursing home admissions and discharge for the long-stay Medicaid facility population. The differences across states are meaningful, and the fact that we could observe modest trends over time, even in such short time span (2 years and 3 months) suggests this is a dynamic and changing picture worthy of ongoing monitoring. The results of the multivariate analyses indicate that these are real changes associated with state policy variables and holding up after controlling for underlying changes and variation in case mix.
Within states, the information about differential likelihood of community discharge for types of residents and for residents of different types of facilities is important. These data could

50
be used to identify facility types and resident types to target for MFP or NFT activities. For example, a state might wish to target for-profit, government owned, and independent facilities for outreach or further investigate differences in discharge patterns by race if state specific analysis shows the same patterns as the national analysis reported here. Although states have shown interest in using the MDS data for case finding, much of that effort has focused on identifying people who have indicated that they wish to go home. Our analysis is not able to look at the relationship between that desire and future discharge, but it does show that the number and proportion of residents who have this desire, who have someone in the community who is supportive of this desire, and who are evaluated as having the potential to go home are all increasing. With some refinements and use of additional policy measures, states may also find this type of analysis useful in determining the impact of specific state policy measures. For example, a state might explore the relationship between personal care expenditures and nursing facility outcomes, or use the information from these analyses to communicate the value of HCBS expenditures to the state legislature.
State specific results and analyses could also be valuable to CMS in targeting future grant funding to states. CMS could use these data to identify the states with low community discharge rates, or low discharges to the community with services for future Systems Change grants. CMS could also use the state specific data to guide states in targeting their case finding efforts..
5.4 Limitations
There are several limitations to this study, often related to the MDS. We were unable to test our hypothesis related to length of stay since the field was often missing on the discharge assessments. If we had created a sample for which we had both admission and discharge assessments, we could have calculated length of stay and examined the relationships among length of stay, health and functional status on admission, and discharge destinations. We chose not to do this because it would have defined a smaller sample in the study period and truncated the observations available. It is difficult to define episodes of nursing facility care using MDS data alone.
Using the MDS alone means that we relied on the facility staff to have correctly identified Medicare and Medicaid status on the admission and discharge assessments. It is possible that facility staff may have only entered Medicare numbers on the initial assessments for dually eligible beneficiaries if the resident was initially receiving Medicare-reimbursed post acute care. Thus, it is possible that we undercounted beneficiaries with Medicaid in our samples. Correctly identifying Medicaid beneficiaries would require merging the MDS with Medicaid enrollment files.6 Similarly, we do not know how accurate the discharge assessment data are regarding discharge destination. Our definition of long-stay was not as conservative as if we had limited the analyses to residents with quarterly assessments, implying a stay of at least 90 days. However, this approach would also drop people whose stays exceeded any concept of post acute care. We also chose to keep individuals who may have had repeated admissions in our admission sample, as long as there was no evidence of leaving the facility less than 30 days after the first 6 CMS analyses indicate about one third of Medicare beneficiaries do not have a Medicare number included on an
MDS assessment so it is likely possible that time is also a substantial undercount of residents with Medicaid (personal communication with Edward Mortimore).

51
observed assessment during the study period (as measured by presence of a discharge assessment of a new admission assessment).We controlled for correlations between observations at the facility level, assuming that most beneficiaries who have repeat admissions would be entering the same facility.
As a pilot, we selected and tested a limited number of state program characteristics that could be associated with our dependent variables. There are not many state policy variables on which reliable information is available on a 50-state basis. The expenditure ratio proved to be an excellent choice. However, our MFP or NFT variable may not have been an optimal choice and the results related to this variable are hard to interpret. As we indicated, the Systems Change grants were slow to start and included varied levels of effort across states and even within a state where the effort may have been less than statewide. We selected states with MFP or NFT grants funded by the Systems Change grant program, yet we had no information about their level of implementation. Conversely, we did not incorporate information about MFP or NFT programs funded separately or implemented on a state level without external funding. This may have left out states with active programs or whose Systems Change MFP or NFT funding was used to further an existing program rather than start one from scratch.
There are other options that could be considered. States with a single point of entry model for accessing information and services could be expected to support delaying or preventing nursing facility entrance or assist facility residents to return to the community. Inclusion of personal care as a state plan benefit could also affect facility use, as would Medicaid coverage of assisted living or use of consumer directed options. Specific aspects of state policies and procedures might also be useful to incorporate, such as whether a state mandates frequent redetermination of nursing facility level of care for facility residents.
5.5 Recommendations
With some refinements, the approach piloted in this study could be used as a monitoring tool, evaluating patterns of facility admissions and discharges nationally and on the state level. There are also several ways this pilot approach could be extended as a research project to further understand state variation and factors associated with facility admissions and discharges.
Extensions of the data:
• Extend into additional years, and create annual statistics.
• Create an admission cohort and follow until discharge, to observe length of stay and to incorporate characteristics on admission as predictors of discharge destinations. This could include both health and functional status measures and the items about desire, support and potential to return to the community.
• Develop measures of disability types (psychiatric, physical, and intellectual) for inclusion in the analyses or as strata for separate analyses. This could be done based on diagnostic information within the MDS. It could also be enhanced by linking to the SSA data reason for disability information.
• Conduct additional simulations of policy changes using marginal effects techniques.

52
• Link to claims data to know more about where people have been prior to facility admission, what services they receive after admission and about costs. This would be a very rich analysis and provide CMS with useful information, though the time lag associated with claims data availability would have a negative effect on its usefulness as an ongoing monitoring tool.
Refinements of the approach:
• Model other potential measures of Systems Change of LTC reform. For example, it is possible to analyze the impact of the presence of personal care as a state plan benefit, or of consumer directed options, on ADL scores on admission and on discharge destinations.
• We selected the MDS ADL score as our measure of status on admission, however there are other options that could be considered. These could include constructing a different ADL scale that relates more closely to the types of ADL scales used in NHC criteria, looking at individual ADLs that might be especially challenging or easy to address in the community, summarizing ADL data into a hierarchical approach related to independence, support or dependence, or creating a typology that integrates level of cognitive function with ADL status.
• Consider other definitions of long-stay residents. Using MDS data alone, we could restrict the sample to residents with a quarterly assessment. Although there are many challenges and imperfections associated with this approach, it would ensure that the sample did not include residents admitted for short-term post-acute stays.
• Link the data to Medicare and Medicaid enrollment files to more accurately identify beneficiary status.
• Use a linked data set incorporating hospitalization and death data sources to more accurately evaluate discharge destinations. Data sets that would support this type of analysis, including the opportunity to assess length of stay, are under development at CMS.

53
REFERENCES
American Medical Association, Chicago, IL. “Physician Characteristics and Distribution in the U.S., annual (copyright),” http://www.census.gov/compendia/statab/tables/06s0153.xls. Accessed on October 11, 2006.
Greene, A.M., O’Keefe, J., Anderson, W., Brown, D., et al. “Real Choice Systems Change Grant
Program, Fourth Year Report: Progress and Challenges of the FY 2003 and FY 2004 Grantees: (October 1, 2004 – September 30, 2005),” Final Report to the Centers for Medicare and Medicaid Services. July 2006. http://www.hcbs.org/files/96/4770/4thAnnualRpt.pdf. Accessed on October 11, 2006.
Mollica, Robert L. “Testimony Before Senate Special Committee on Aging,” April 29, 2003.
http://aging.senate.gov/public/_files/hr98rm.pdf. Accessed on October 11, 2006. National Weather Service Climate Prediction Center.
ftp://ftp.cpc.ncep.noaa.gov/htdocs/products/analysis_monitoring/cdus/degree_days/archives/Heating%20degree%20Days/monthly%20states/2003/. Accessed on October 11, 2006.
Center for Medicare and Medicaid Services. “Real Choices System Change Grants Compendium
Fifth Addition,” http://www.hcbs.org/files/89/4410/Compendium5thEdition.pdf. Accessed on October 11, 2006.
U.S. Census Bureau. http://www.census.gov/compendia/statab/tables/06s0021.xls. Accessed on
October 11, 2006. Walsh, E.G., D. Brown, and A. Greene. “Policy Outcome Typology for Potential Systems
Change Evaluations,” Report. CMS Contract No. 50-00-0044, T.O. #003. September 25, 2003.
Walsh, E.G., E.D. Kulas and G. Khatutsky. The Interaction of the Long-Term Care System and
Medicaid Managed Care in Oregon, HCFA Contract No. 500-94-0056. June 15, 2000. Weissert, W.G., Elston, J.M., Koch, G.G. “Risk of Institutionalization: 1977-1985,” Prepared for
Office of Assistant Secretary for Planning and Evaluation US Department of Health and Human Services, Grant No. 88ASPE206A. July 24, 1990.

54
APPENDIX SUPPLEMENTARY TABLES

55
Table A-1 State policy and supply characteristics
State ID
Medicaid HCBS/LTC Expenditure
Ratio (under 65)
Medicaid HCBS/LTC Expenditure
Ratio (65 and over)
MFP Grant
NFT Grant
MFP or
NFT Grant
NHC Criteria
(1-5)
Total heating degrees/
365
Hospital beds/ 1000
elderly, 2003
# Physicians/1000
elderly
# Facility beds/ 1000
elderly
AK 0.88 0.41 0 1 1 3 27.8 2.2 34.4 16.9 AL 0.61 0.10 0 1 1 5 7.7 3.5 16.0 37.5 AR 0.53 0.26 0 1 1 2 9.2 3.6 14.5 59.5 AZ 0.74 0.26 0 0 0 4 4.7 1.9 16.0 16.2 CA 0.67 0.40 1 1 1 1 6.4 2.1 24.2 30.5 CO 0.84 0.26 0 1 1 3 18.7 2.1 25.7 40.7 CT 0.63 0.16 0 1 1 3 17.4 2.1 26.6 57.3 DC 0.35 0.14 0 0 0 1 11.9 6.1 64.4 43.6 DE 0.64 0.12 0 1 1 1 13.2 2.5 19.0 34.0 FL 0.64 0.14 0 0 0 3 1.9 3 14.4 25.7 GA 0.62 0.13 0 1 1 3 7.8 2.8 22.7 42.7 HI 0.79 0.31 0 0 0 5 0.0 2.5 22.7 16.2 IA 0.47 0.15 0 0 0 2 18.6 3.7 12.8 71.0 ID 0.65 0.27 1 0 1 3 16.5 2.5 14.6 35.0 IL 0.42 0.11 0 0 0 2 17.0 2.8 22.7 59.8 IN 0.40 0.06 0 1 1 2 16.2 3.1 17.3 58.7 KS 0.76 0.25 0 0 0 1 13.3 3.9 16.8 63.0 KY 0.71 0.16 0 0 0 2 12.3 3.6 18.0 47.1 LA 0.38 0.07 0 1 1 2 5.0 4 22.6 66.3 MA 0.71 0.13 0 1 1 3 18.6 2.5 33.3 55.4 MD 0.66 0.13 0 1 1 5 14.0 2.1 35.9 41.0 ME 0.91 0.29 1 0 1 5 22.0 2.8 18.4 38.1 MI 0.42 0.11 1 1 1 2 18.6 2.6 19.3 36.4 MN 0.79 0.16 0 1 1 2 22.8 3.2 22.9 55.3 MO 0.73 0.25 0 0 0 3 13.8 3.4 17.9 60.4 MS 0.28 0.14 0 0 0 2 7.3 4.5 14.8 43.5 MT 0.74 0.20 0 0 0 3 20.7 4.7 16.4 56.7 NC 0.59 0.33 0 1 1 4 9.3 2.8 20.6 39.5 ND 0.54 0.07 0 0 0 3 25.2 5.7 16.4 69.9 NE 0.63 0.13 0 1 1 2 16.8 4.3 18.2 65.1 NH 0.90 0.13 0 1 1 1 20.9 2.2 21.7 46.1 NJ 0.46 0.23 0 1 1 3 15.3 2.6 23.8 41.2 NM 0.71 0.41 0 0 0 3 11.5 2 19.5 28.2 NV 0.59 0.17 1 0 1 1 8.4 1.9 15.8 18.6 NY 0.53 0.32 0 0 0 1 17.1 3.4 30.1 46.2 OH 0.43 0.12 0 1 1 1 16.3 2.9 19.1 53.8 OK 0.65 0.16 0 0 0 2 9.7 3.1 13.0 58.1 OR 0.84 0.51 0 0 0 1 12.2 1.9 20.3 25.3 PA 0.38 0.05 1 0 1 3 16.5 3.3 19.2 44.7 RI 0.40 0.05 0 1 1 1 16.6 2.2 25.0 54.6 SC 0.55 0.16 0 1 1 3 7.8 2.7 18.3 29.4 SD 0.68 0.08 0 0 0 1 20.3 5.8 15.0 60.1 TN 0.47 0.06 0 0 0 5 10.9 3.5 20.6 48.7 TX 0.51 0.30 1 1 1 2 5.3 2.6 21.1 48.4 UT 0.65 0.12 0 1 1 4 16.2 1.9 24.0 33.9 VA 0.62 0.18 0 0 0 5 12.3 2.3 23.9 33.2 VT 0.97 0.28 0 0 0 2 22.5 2.4 27.9 40.2 WA 0.62 0.27 1 1 1 1 13.9 1.8 23.2 32.1 WI 0.67 0.16 1 1 1 2 20.7 2.7 19.2 53.2 WV 0.67 0.17 0 1 1 2 14.5 4.3 15.0 35.3 WY 0.81 0.12 0 1 1 1 21.2 3.5 15.8 43.9

56
Table A-2 Mean ADL scores on admission by state: Under & over age 65
Under 65 Over 65
State Number ADL score (4-18) Number ADL score (4-18)
US 247,504 9.67 686,591 11.22 AK 225 9.35 441 10.30 AL 2,816 10.45 10,937 10.83 AR 1,920 9.86 9,234 10.37 AZ 4,288 9.56 7,826 10.63 CA 32,912 9.50 82,794 12.00 CO 2,546 9.39 6,896 10.24 CT 3,746 8.80 10,616 10.87 DC 589 9.17 1,273 10.61 DE 394 10.53 1,241 11.15 FL 12,632 10.00 40,824 11.47 GA 5,218 10.34 21,042 10.91 HI 426 11.26 1,990 12.28 IA 1,928 10.04 6,975 9.96 ID 835 11.36 2,359 11.78 IL 21,929 6.65 26,893 10.11 IN 6,257 10.47 14,693 10.75 KS 1,975 8.48 5,435 10.05 KY 3,428 12.01 13,449 12.09 LA 5,035 9.61 14,760 10.53 MA 6,424 10.01 16,239 11.54 MD 3,891 9.83 7,240 11.96 ME 1,142 12.45 5,847 13.53 MI 5,628 10.62 17,691 10.76 MN 4,584 9.40 12,177 11.08 MO 7,257 8.53 19,533 10.22 MS 2,629 11.00 11,534 11.23 MT 727 9.06 2,145 9.73 NC 6,293 11.09 26,079 11.70 ND 376 10.68 1,609 10.37 NE 1,496 10.55 4,156 10.63 NH 426 10.31 1,950 10.17 NJ 5,240 9.42 15,324 10.83
(continued)

57
Table A-2 (continued) Mean ADL scores on admission by state: Under & over age 65
Under 65 Over 65 State Number ADL score (4-18) Number ADL score (4-18)
NM 974 9.44 3,390 10.32 NV 970 9.87 2,568 10.94 NY 20,046 9.51 57,683 11.51 OH 18,443 10.01 29,911 11.51 OK 3,588 8.56 10,181 9.52 OR 2,100 10.48 5,247 11.58 PA 5,803 11.83 21,020 12.25 PR 17 8.18 37 9.57 RI 995 8.80 4,636 10.25 SC 1,555 11.80 9,467 11.63 SD 622 10.26 2,341 10.54 TN 4,528 11.07 17,344 11.80 TX 15,791 9.56 53,853 10.63 UT 1,721 9.59 2,652 10.66 VA 3,825 11.59 14,401 11.92 VI 2 10.00 8 15.50 VT 285 10.47 1,400 11.67 WA 5,305 10.58 11,485 12.03 WI 4,003 10.49 12,592 10.91 WV 1,413 11.13 4,311 11.39 WY 306 9.14 862 10.20
SOURCE: RTI International analysis of MDS data, January 2003–March 2005.

58
Table A-3 ADL scores on admissions:
Annualized state trends, January 2003–March 2005
Under age 65 Age 65 and over
State Factor p-value +/- Significant Factor p-value +/- Significant
US 1.015 0.0000 + * 1.022 0.0000 + * AL 1.034 0.0003 + * 1.035 0.0000 + * AK 0.958 0.2131 - 0.956 0.0642 - AZ 1.037 0.0000 + * 1.043 0.0000 + * AK 0.958 0.2131 - 0.956 0.0642 - CA 1.020 0.0000 + * 1.022 0.0000 + * CO 1.009 0.3682 + 1.038 0.0000 + * CT 1.046 0.0000 + * 1.034 0.0000 + * DE 1.006 0.8099 + 1.014 0.2793 + DC 1.012 0.5907 + 1.001 0.9290 + FL 1.020 0.0000 + * 1.031 0.0000 + * GA 0.986 0.0371 - * 1.023 0.0000 + * HI 0.960 0.0825 - 1.029 0.0043 + * ID 1.018 0.2829 + 1.035 0.0002 + * IL 1.006 0.1371 + 1.019 0.0000 + * IN 1.036 0.0000 + * 1.046 0.0000 + * IA 1.014 0.2178 + 1.020 0.0006 + * KS 1.053 0.0000 + * 1.028 0.0000 + * KY 0.993 0.3627 - 0.995 0.2019 - LA 1.013 0.0616 + 1.017 0.0000 + * ME 1.024 0.0706 + 1.020 0.0002 + * MD 1.001 0.9128 + 1.021 0.0001 + * MA 1.016 0.0082 + * 1.022 0.0000 + * MI 1.025 0.0001 + * 1.017 0.0000 + * MN 1.010 0.2134 + 1.029 0.0000 + * MS 1.021 0.0207 + * 1.026 0.0000 + * MO 0.994 0.3780 - 1.016 0.0000 + * MT 0.982 0.3402 - 1.009 0.3955 + NE 1.036 0.0044 + * 1.021 0.0043 + * NV 0.988 0.4490 - 1.032 0.0008 + * NH 1.046 0.0550 + 0.996 0.7097 - NJ 0.992 0.2427 - 1.007 0.0570 + NM 1.078 0.0000 + * 1.021 0.0140 + * NY 1.022 0.0000 + * 1.022 0.0000 + * NC 1.018 0.0024 + * 1.023 0.0000 + * ND 1.055 0.0267 + * 1.042 0.0007 + * OH 1.019 0.0000 + * 1.027 0.0000 + * OK 1.003 0.7431 + 1.008 0.1311 + OR 1.043 0.0001 + * 1.041 0.0000 + * PA 1.006 0.2939 + 1.015 0.0000 + * RI 0.955 0.0059 - * 1.027 0.0002 + *
(continued)

59
Table A-3 (continued) ADL scores on admissions:
Annualized state trends, January 2003–March 2005
Under age 65 Age 65 and over
State Factor p-value +/- Significant Factor p-value +/- Significant SC 1.028 0.0148 + * 1.008 0.0851 + SD 1.053 0.0075 + * 1.057 0.0000 + * TN 1.009 0.2273 + 1.020 0.0000 + * TX 1.023 0.0000 + * 1.020 0.0000 + * UT 1.005 0.6505 + 1.027 0.0039 + * VT 1.016 0.5884 + 0.993 0.5500 - VA 1.001 0.8414 + 1.022 0.0000 + * WA 1.044 0.0000 + * 1.023 0.0000 + * WV 0.980 0.1033 - 1.020 0.0060 + * WI 1.030 0.0001 + * 1.030 0.0000 + * WY 1.032 0.2910 + 0.992 0.6513 -
NOTES:
Control variables: CPS, diagnosis count, age, male, Black, Asian, Hispanic, dual eligible, lived alone prior to admission
* p<0.05
SOURCE: RTI analysis of MDS 2003-2005

60
Table A-4 Predicting ADL scores on admission (3 age groups)
Variable Under 65 odds ratio
65-74 odds ratio
75 and over odds ratio
Time trend (quarter) 1.004*** 1.005*** 1.006*** Expenditure ratio 0.974 1.024 1.095*** NHC criteria 1.016*** 1.000 1.002 MFP or NFT grant 1.095*** 1.023*** 1.014*** Cognitive performance scale 1.084*** 1.059*** 1.068*** Diagnosis count 1.034*** 1.027*** 1.023*** Age 1.000 1.001** 1.002*** Male 0.920*** 0.946*** 0.977*** Black 0.984** 1.049*** 1.053*** Asian 1.044*** 1.082*** 1.052*** Hispanic 1.021** 1.041*** 1.057*** Dual eligible 1.055*** 1.069*** 1.049*** Lived alone prior to admission 0.966*** 0.970*** 0.973*** Number of certified beds 1.000 1.000 1.000 For profit 0.928*** 0.982*** 1.016*** Government 0.954** 0.945*** 0.968*** Occupancy rate 0.992 1.106*** 1.065*** Urban 0.970*** 0.996 1.002 Chain 1.043*** 1.020*** 1.020*** Heating degree days/365 1.005*** 1.003*** 1.004*** Hospital bed supply/1000 elderly 1.088*** 1.013** 1.021*** Physician supply/1000 elderly 0.999 1.001** 1.002*** Nursing facility bed supply/1000 elderly 0.993*** 0.997*** 0.997*** Constant 7.455*** 6.711*** 6.013***
NOTES: * p<0.05; ** p<0.01; *** p<0.001
SOURCE: RTI International analysis of MDS and OSCAR data, January 2003–March 2005.

61
Table A-5 Predicting ADL scores on admission (3 age groups)
Variable Under age 65
odds ratio Age 65 and over
odds ratio
Time Trend (quarter) 1.004*** 1.005*** Expenditure ratio 0.963 1.066*** NHC criteria 2 0.975* 0.967*** NHC criteria 3 1.012 0.981*** NHC criteria 4 1.032* 0.971*** NHC criteria 5 1.082*** 1.015** MFP or NFT grant 1.097*** 1.021*** Cognitive performance scale 1.084*** 1.065*** Diagnosis count 1.033*** 1.023*** Age 1.000 1.001*** Male 0.919*** 0.968*** Black 0.985** 1.052*** Asian 1.041*** 1.054*** Hispanic 1.023*** 1.054*** Dual eligible 1.056*** 1.057*** Lived alone prior to admission 0.965*** 0.971*** Number of certified beds 1.000 1.000 For profit 0.927*** 1.007* Government 0.953** 0.962*** Occupancy rate 0.983 1.068*** Urban 0.970*** 1.000 Chain 1.043*** 1.020*** Heating degree days/365 1.005*** 1.003*** Hospital bed supply/1000 elderly 1.086*** 1.018*** Physician supply/1000 elderly 0.998** 1.001 Nursing facility bed supply/1000 elderly 0.994*** 0.998*** Constant 7.827*** 6.617***
NOTES: * p<0.05, ** p<0.01, *** p<0.001
SOURCE: RTI International analysis of MDS and OSCAR data, January 2003–March 2005.

62
Table A-6a Discharge distribution by state: Under age 65
State Private home
Private home with
home health Assisted
living
Another nursing facility Hospital
Psychiatrichospital
Rehabilitationhospital Deceased Other Total
US 44,751 46,100 15,086 27,102 24,007 4,761 1,812 37,492 11,118 212,229 21.09 21.72 7.11 12.77 11.31 2.24 0.85 17.67 5.24 100
AK 110 19 31 5 15 1 2 61 2 246 44.72 7.72 12.6 2.03 6.1 0.41 0.81 24.8 0.81 100
AL 408 566 32 255 154 37 17 468 19 1,956 20.86 28.94 1.64 13.04 7.87 1.89 0.87 23.93 0.97 100
AR 392 270 43 260 140 39 23 384 17 1,568 25 17.22 2.74 16.58 8.93 2.49 1.47 24.49 1.08 100
AZ 1,073 910 434 508 379 48 25 410 251 4,038 26.57 22.54 10.75 12.58 9.39 1.19 0.62 10.15 6.22 100
CA 4,646 3,849 4,169 2,228 3,736 1,138 399 2,775 1,616 24,556 18.92 15.67 16.98 9.07 15.21 4.63 1.62 11.3 6.58 100
CO 369 591 218 306 158 36 14 480 98 2,270 16.26 26.04 9.6 13.48 6.96 1.59 0.62 21.15 4.32 100
CT 283 1,287 173 359 240 36 11 464 141 2,994 9.45 42.99 5.78 11.99 8.02 1.2 0.37 15.5 4.71 100
DC 79 129 9 33 51 5 0 115 27 448 17.63 28.79 2.01 7.37 11.38 1.12 0 25.67 6.03 100
DE 35 143 7 21 82 4 2 89 23 406 8.62 35.22 1.72 5.17 20.2 0.99 0.49 21.92 5.67 100
FL 2,339 2,857 868 1,392 1,550 138 54 1,944 621 11,763 19.88 24.29 7.38 11.83 13.18 1.17 0.46 16.53 5.28 100
GA 904 688 157 572 532 79 30 1,246 113 4,321 20.92 15.92 3.63 13.24 12.31 1.83 0.69 28.84 2.62 100
HI 96 50 28 27 70 3 3 91 15 383 25.07 13.05 7.31 7.05 18.28 0.78 0.78 23.76 3.92 100
IA 230 350 47 280 145 40 9 429 79 1,609 14.29 21.75 2.92 17.4 9.01 2.49 0.56 26.66 4.91 100
ID 146 201 84 71 43 13 10 136 11 715 20.42 28.11 11.75 9.93 6.01 1.82 1.4 19.02 1.54 100
IL 5,189 1,687 343 3,383 1,692 720 89 2,094 2,559 17,756 29.22 9.5 1.93 19.05 9.53 4.05 0.5 11.79 14.41 100
IN 1,535 1,055 158 872 268 61 40 995 105 5,089 30.16 20.73 3.1 17.13 5.27 1.2 0.79 19.55 2.06 100
KS 365 302 103 323 107 97 19 326 67 1,709 21.36 17.67 6.03 18.9 6.26 5.68 1.11 19.08 3.92 100
(continued)

63
Table A-6a (continued) Discharge distribution by state: Under age 65
State Private home
Private home with
home health Assisted
living
Another nursing facility Hospital
Psychiatrichospital
Rehabilitationhospital Deceased Other Total
KY 561 759 122 383 305 45 46 556 57 2,834 19.8 26.78 4.3 13.51 10.76 1.59 1.62 19.62 2.01 100
LA 1,244 390 44 895 248 101 64 1,254 97 4,337 28.68 8.99 1.01 20.64 5.72 2.33 1.48 28.91 2.24 100
MA 546 2,263 448 915 610 134 23 907 252 6,098 8.95 37.11 7.35 15 10 2.2 0.38 14.87 4.13 100
MD 766 858 261 313 661 20 12 673 187 3,751 20.42 22.87 6.96 8.34 17.62 0.53 0.32 17.94 4.99 100
ME 113 342 130 92 256 3 6 230 31 1,203 9.39 28.43 10.81 7.65 21.28 0.25 0.5 19.12 2.58 100
MI 602 1,397 391 411 337 24 29 914 95 4,200 14.33 33.26 9.31 9.79 8.02 0.57 0.69 21.76 2.26 100
MN 837 1,074 656 627 590 79 32 701 264 4,860 17.22 22.1 13.5 12.9 12.14 1.63 0.66 14.42 5.43 100
MO 1,126 881 365 854 468 263 54 938 208 5,157 21.83 17.08 7.08 16.56 9.08 5.1 1.05 18.19 4.03 100
MS 475 316 18 287 505 100 27 483 44 2,255 21.06 14.01 0.8 12.73 22.39 4.43 1.2 21.42 1.95 100
MT 211 114 46 80 69 15 13 113 28 689 30.62 16.55 6.68 11.61 10.01 2.18 1.89 16.4 4.06 100
NC 782 1,200 478 492 845 60 39 1,086 105 5,087 15.37 23.59 9.4 9.67 16.61 1.18 0.77 21.35 2.06 100
ND 81 52 26 41 45 14 8 109 13 389 20.82 13.37 6.68 10.54 11.57 3.6 2.06 28.02 3.34 100
NE 304 207 124 200 87 16 13 250 28 1,229 24.74 16.84 10.09 16.27 7.08 1.3 1.06 20.34 2.28 100
NH 33 178 36 33 22 7 3 90 2 404 8.17 44.06 8.91 8.17 5.45 1.73 0.74 22.28 0.5 100
NJ 671 1,177 280 646 446 74 28 1,224 153 4,699 14.28 25.05 5.96 13.75 9.49 1.57 0.6 26.05 3.26 100
NM 261 183 37 91 67 20 10 160 31 860 30.35 21.28 4.3 10.58 7.79 2.33 1.16 18.6 3.6 100
NV 184 203 46 83 100 5 6 153 41 821 22.41 24.73 5.6 10.11 12.18 0.61 0.73 18.64 4.99 100
NY 3,678 4,003 868 1,149 2,437 160 34 2,703 1,426 16,458 22.35 24.32 5.27 6.98 14.81 0.97 0.21 16.42 8.66 100
(continued)

64
Table A-6a (continued) Discharge distribution by state: Under age 65
State Private home
Private home with
home health Assisted
living
Another nursing facility Hospital
Psychiatrichospital
Rehabilitationhospital Deceased Other Total
OH 4,645 5,526 611 2,783 2,037 337 120 3,170 816 20,045 23.17 27.57 3.05 13.88 10.16 1.68 0.6 15.81 4.07 100
OK 735 333 40 700 202 99 35 630 69 2,843 25.85 11.71 1.41 24.62 7.11 3.48 1.23 22.16 2.43 100
OR 454 453 330 116 162 16 47 318 77 1,973 23.01 22.96 16.73 5.88 8.21 0.81 2.38 16.12 3.9 100
PA 877 1,910 410 547 684 79 124 1,969 338 6,938 12.64 27.53 5.91 7.88 9.86 1.14 1.79 28.38 4.87 100
PR 4 6 0 2 2 0 0 0 1 15 26.67 40 0 13.33 13.33 0 0 0 6.67 100
RI 94 224 48 95 85 8 3 93 84 734 12.81 30.52 6.54 12.94 11.58 1.09 0.41 12.67 11.44 100
SC 167 321 88 110 226 16 4 421 13 1,366 12.23 23.5 6.44 8.05 16.54 1.17 0.29 30.82 0.95 100
SD 159 75 24 52 26 27 3 107 28 501 31.74 14.97 4.79 10.38 5.19 5.39 0.6 21.36 5.59 100
TN 861 908 97 590 405 86 47 950 117 4,061 21.2 22.36 2.39 14.53 9.97 2.12 1.16 23.39 2.88 100
TX 2,663 2,192 734 2,294 1,307 260 97 2,161 344 12,052 22.1 18.19 6.09 19.03 10.84 2.16 0.8 17.93 2.85 100
UT 309 322 120 229 134 29 14 201 43 1,401 22.06 22.98 8.57 16.35 9.56 2.07 1 14.35 3.07 100
VA 522 952 212 289 521 49 13 770 77 3,405 15.33 27.96 6.23 8.49 15.3 1.44 0.38 22.61 2.26 100
VI 0 0 0 0 1 0 0 0 0 1 0 0 0 0 100 0 0 0 0 100
VT 32 119 23 13 14 0 3 56 7 267 11.99 44.57 8.61 4.87 5.24 0 1.12 20.97 2.62 100
WA 1,149 903 608 385 324 36 75 637 189 4,306 26.68 20.97 14.12 8.94 7.52 0.84 1.74 14.79 4.39 100
WI 1,006 923 404 263 256 51 17 648 58 3,626 27.74 25.46 11.14 7.25 7.06 1.41 0.47 17.87 1.6 100
WV 319 316 39 128 137 26 9 264 16 1,254 25.44 25.2 3.11 10.21 10.93 2.07 0.72 21.05 1.28 100
WY 81 66 18 19 24 7 7 46 15 283 28.62 23.32 6.36 6.71 8.48 2.47 2.47 16.25 5.3 100
SOURCE: RTI International analysis of MDS, April 2003–June 2005

65
Table A-6b Discharge distributions by state: Age 65 and over
State Private home
Private home with
home health Assisted
living
Another nursing facility Hospital
Psychiatrichospital
Rehabilitation hospital Deceased Other Total
US 55,923 104,393 26,112 86,176 88,580 3,708 1,337 523,687 9,338 899,254 6.22 11.61 2.9 9.58 9.85 0.41 0.15 58.24 1.04 100
AK 138 35 37 27 18 0 0 316 1 572 24.13 6.12 6.47 4.72 3.15 0 0 55.24 0.17 100
AL 679 1,651 79 1,240 897 84 16 8,065 71 12,782 5.31 12.92 0.62 9.7 7.02 0.66 0.13 63.1 0.56 100
AR 1,178 919 67 1,263 683 88 64 6,057 63 10,382 11.35 8.85 0.65 12.17 6.58 0.85 0.62 58.34 0.61 100
AZ 950 1,017 628 1,169 817 47 7 4,681 110 9,426 10.08 10.79 6.66 12.4 8.67 0.5 0.07 49.66 1.17 100
CA 7,363 12,204 3,577 7,326 11,704 380 192 30,593 819 74,158 9.93 16.46 4.82 9.88 15.78 0.51 0.26 41.25 1.1 100
CO 509 1,076 434 1,006 502 33 3 6,108 53 9,724 5.23 11.07 4.46 10.35 5.16 0.34 0.03 62.81 0.55 100
CT 263 2,621 214 1,608 1,303 43 4 8,460 89 14,605 1.8 17.95 1.47 11.01 8.92 0.29 0.03 57.93 0.61 100
DC 69 200 13 128 103 1 0 700 17 1,231 5.61 16.25 1.06 10.4 8.37 0.08 0 56.86 1.38 100
DE 46 293 26 105 356 9 2 1,241 58 2,136 2.15 13.72 1.22 4.92 16.67 0.42 0.09 58.1 2.72 100
FL 3,244 8,112 2,500 5,898 6,719 151 41 27,247 920 54,832 5.92 14.79 4.56 10.76 12.25 0.28 0.07 49.69 1.68 100
GA 1,626 2,234 445 2,059 2,789 84 19 15,397 304 24,957 6.52 8.95 1.78 8.25 11.18 0.34 0.08 61.69 1.22 100
HI 167 165 100 146 231 2 1 1,604 25 2,441 6.84 6.76 4.1 5.98 9.46 0.08 0.04 65.71 1.02 100
IA 413 769 101 941 647 39 3 8,153 215 11,281 3.66 6.82 0.9 8.34 5.74 0.35 0.03 72.27 1.91 100
ID 183 295 237 275 152 39 2 2,058 9 3,250 5.63 9.08 7.29 8.46 4.68 1.2 0.06 63.32 0.28 100
IL 2,918 3,021 487 4,460 3,113 149 45 22,476 596 37,265 7.83 8.11 1.31 11.97 8.35 0.4 0.12 60.31 1.6 100
IN 1,646 1,605 217 2,773 1,106 89 15 14,923 72 22,446 7.33 7.15 0.97 12.35 4.93 0.4 0.07 66.48 0.32 100
(continued)

66
Table A-6b (continued) Discharge distributions by state: Age 65 and over
State Private home
Private home with
home health Assisted
living
Another nursing facility Hospital
Psychiatrichospital
Rehabilitation hospital Deceased Other Total
KS 522 464 281 1,078 474 48 12 6,123 62 9,064 5.76 5.12 3.1 11.89 5.23 0.53 0.13 67.55 0.68 100
KY 1,142 2,004 408 1,601 1,693 69 33 9,235 255 16,440 6.95 12.19 2.48 9.74 10.3 0.42 0.2 56.17 1.55 100
LA 1,627 1,186 53 2,645 1,034 95 134 10,878 135 17,787 9.15 6.67 0.3 14.87 5.81 0.53 0.75 61.16 0.76 100
MA 503 3,778 611 2,457 2,146 244 26 18,120 88 27,973 1.8 13.51 2.18 8.78 7.67 0.87 0.09 64.78 0.31 100
MD 505 1,359 374 804 1,352 28 5 7,614 96 12,137 4.16 11.2 3.08 6.62 11.14 0.23 0.04 62.73 0.79 100
ME 216 883 857 494 1,061 9 5 4,215 32 7,772 2.78 11.36 11.03 6.36 13.65 0.12 0.06 54.23 0.41 100
MI 898 2,993 529 1,808 1,699 68 17 16,728 105 24,845 3.61 12.05 2.13 7.28 6.84 0.27 0.07 67.33 0.42 100
MN 1,028 1,789 1,159 2,072 1,226 78 20 14,525 106 22,003 4.67 8.13 5.27 9.42 5.57 0.35 0.09 66.01 0.48 100
MO 1,517 2,294 431 2,648 1,509 134 27 12,589 157 21,306 7.12 10.77 2.02 12.43 7.08 0.63 0.13 59.09 0.74 100
MS 1,077 1,050 61 1,334 2,650 146 44 7,121 117 13,600 7.92 7.72 0.45 9.81 19.49 1.07 0.32 52.36 0.86 100
MT 246 173 112 260 278 13 2 2,031 33 3,148 7.81 5.5 3.56 8.26 8.83 0.41 0.06 64.52 1.05 100
NC 1,259 3,354 1,605 2,153 4,423 123 18 15,016 204 28,155 4.47 11.91 5.7 7.65 15.71 0.44 0.06 53.33 0.72 100
ND 150 119 52 203 185 16 7 2,325 50 3,107 4.83 3.83 1.67 6.53 5.95 0.51 0.23 74.83 1.61 100
NE 388 369 336 529 315 17 7 4,254 47 6,262 6.2 5.89 5.37 8.45 5.03 0.27 0.11 67.93 0.75 100
NH 36 352 73 238 148 10 0 2,809 16 3,682 0.98 9.56 1.98 6.46 4.02 0.27 0 76.29 0.43 100
NJ 786 2,938 533 1,902 2,096 84 24 14,968 167 23,498 3.34 12.5 2.27 8.09 8.92 0.36 0.1 63.7 0.71 100
NM 454 480 61 517 361 24 5 2,276 32 4,210 10.78 11.4 1.45 12.28 8.57 0.57 0.12 54.06 0.76 100
(continued)

67
Table A-6b (continued) Discharge distributions by state: Age 65 and over
State Private home
Private home with
home health Assisted
living
Another nursing facility Hospital
Psychiatrichospital
Rehabilitation hospital Deceased Other Total
NV 178 333 110 325 389 19 2 1,741 46 3,143 5.66 10.59 3.5 10.34 12.38 0.6 0.06 55.39 1.46 100
NY 4,846 10,717 1,719 5,303 9,792 234 41 39,343 723 72,718 6.66 14.74 2.36 7.29 13.47 0.32 0.06 54.1 0.99 100
OH 3,187 7,354 389 5,451 4,510 137 70 32,254 351 53,703 5.93 13.69 0.72 10.15 8.4 0.26 0.13 60.06 0.65 100
OK 842 872 61 2,083 680 78 51 7,087 115 11,869 7.09 7.35 0.51 17.55 5.73 0.66 0.43 59.71 0.97 100
OR 549 687 937 414 510 28 9 3,760 46 6,940 7.91 9.9 13.5 5.97 7.35 0.4 0.13 54.18 0.66 100
PA 1,317 3,971 1,061 2,395 3,317 107 70 36,317 1,457 50,012 2.63 7.94 2.12 4.79 6.63 0.21 0.14 72.62 2.91 100
PR 5 12 1 2 4 0 0 0 1 25 20 48 4 8 16 0 0 0 4 100
RI 99 694 88 586 469 50 1 3,213 18 5,218 1.9 13.3 1.69 11.23 8.99 0.96 0.02 61.58 0.34 100
SC 591 1,321 340 704 1,348 25 12 7,087 91 11,519 5.13 11.47 2.95 6.11 11.7 0.22 0.1 61.52 0.79 100
SD 254 140 117 272 105 14 0 2,356 18 3,276 7.75 4.27 3.57 8.3 3.21 0.43 0 71.92 0.55 100
TN 1,272 2,838 258 1,885 1,944 96 43 13,218 294 21,848 5.82 12.99 1.18 8.63 8.9 0.44 0.2 60.5 1.35 100
TX 4,680 6,288 1,218 8,679 5,817 250 171 27,477 633 55,213 8.48 11.39 2.21 15.72 10.54 0.45 0.31 49.77 1.15 100
UT 200 364 263 346 318 7 2 1,947 21 3,468 5.77 10.5 7.58 9.98 9.17 0.2 0.06 56.14 0.61 100
VA 1,067 2,699 422 1,255 2,635 61 10 9,921 181 18,251 5.85 14.79 2.31 6.88 14.44 0.33 0.05 54.36 0.99 100
VI 1 2 0 0 0 0 0 5 0 8 12.5 25 0 0 0 0 0 62.5 0 100
VT 41 355 60 137 49 2 0 1,446 4 2,094 1.96 16.95 2.87 6.54 2.34 0.1 0 69.05 0.19 100
WA 841 1,465 1,386 1,191 907 69 20 8,346 100 14,325 5.87 10.23 9.68 8.31 6.33 0.48 0.14 58.26 0.7 100
(continued)

68
Table A-6b (continued) Discharge distributions by state: Age 65 and over
State Private home
Private home with
home health Assisted
living
Another nursing facility Hospital
Psychiatrichospital
Rehabilitation hospital Deceased Other Total
WI 1,599 1,769 900 1,283 1,087 50 16 14,396 52 21,152 7.56 8.36 4.25 6.07 5.14 0.24 0.08 68.06 0.25 100
WV 505 585 49 622 766 30 15 3,984 51 6,607 7.64 8.85 0.74 9.41 11.59 0.45 0.23 60.3 0.77 100
WY 103 125 35 76 143 7 4 883 12 1,388 7.42 9.01 2.52 5.48 10.3 0.5 0.29 63.62 0.86 100
SOURCE: RTI International analysis of MDS, April 2003-June 2005

69
Table A-7 Community discharge: Annualized state trends, April 2003–June 2005
Under age 65 Age 65 and over
State Factor p-value +/- Significant Factor p-value +/- Significant US 1.034 0.0000 + * 1.034 0.0000 + * AL 1.072 0.3325 + 1.045 0.2356 + AK 0.819 0.3663 - 1.111 0.4571 + AZ 0.976 0.6285 - 1.138 0.0005 + * AK 0.819 0.3663 - 1.111 0.4571 + CA 1.034 0.0933 + 1.042 0.0018 + * CO 0.980 0.7538 - 1.025 0.5521 + CT 1.083 0.1731 + 1.006 0.8568 + DE 0.788 0.1330 - 0.936 0.4804 - DC 0.906 0.5193 - 0.954 0.6822 - FL 1.064 0.0346 + * 1.043 0.0103 + * GA 1.015 0.7618 + 1.035 0.2093 + HI 1.179 0.3214 + 1.113 0.2264 + ID 0.989 0.9286 - 1.028 0.6966 + IL 0.874 0.0000 - * 0.956 0.0465 - * IN 1.184 0.0001 + * 1.151 0.0000 + * IA 0.951 0.5406 - 1.031 0.5250 + KS 0.967 0.6517 - 0.957 0.3700 - KY 1.106 0.0862 + 1.040 0.1910 + LA 0.975 0.6142 - 0.944 0.0741 - ME 0.904 0.2682 - 0.960 0.3394 - MD 1.100 0.0701 + 1.044 0.2605 + MA 1.033 0.4087 + 1.051 0.0613 + MI 1.158 0.0029 + * 1.012 0.6777 + MN 1.047 0.3270 + 1.034 0.2559 + MS 1.115 0.1185 + 1.023 0.5382 + MO 1.082 0.0796 + 1.059 0.0430 + * MT 1.035 0.7728 + 0.985 0.8509 - NE 1.042 0.6476 + 1.010 0.8607 + NV 0.844 0.1342 - 1.031 0.6682 + NH 1.140 0.4114 + 1.040 0.6424 + NJ 1.056 0.2452 + 1.110 0.0002 + * NM 1.101 0.3817 + 0.955 0.4331 - NY 1.165 0.0000 + * 1.029 0.0501 + NC 1.163 0.0007 + * 1.054 0.0254 + * ND 0.828 0.2441 - 1.101 0.3280 + OH 0.982 0.4120 - 1.012 0.5090 + OK 0.990 0.8682 - 0.958 0.3012 - OR 1.101 0.1952 + 1.059 0.1754 + PA 1.036 0.3524 + 1.059 0.0096 + * RI 0.885 0.3076 - 0.977 0.7007 -
(continued)

70
Table A-7 (continued) Community discharge: Annualized state trends, April 2003–June 2005
Under age 65 Age 65 and over
State Factor p-value +/- Significant Factor p-value +/- Significant SC 1.102 0.2661 + 1.112 0.0055 + * SD 0.945 0.6906 - 0.989 0.8927 - TN 1.090 0.0847 + 1.028 0.3105 + TX 0.996 0.8798 - 1.053 0.0019 + * UT 1.083 0.3462 + 1.071 0.2938 + VT 0.948 0.8001 - 1.187 0.0552 + VA 1.066 0.2441 + 1.043 0.1481 + WA 1.080 0.1158 + 1.115 0.0005 + * WV 1.019 0.8339 + 1.074 0.1813 + WI 0.982 0.7466 - 1.017 0.5482 + WY 1.073 0.7144 + 1.071 0.5581 +
NOTES:
Control variables: Age, male, Black, Asian, Hispanic, dual eligible
* p<0.05
SOURCE: RTI International analysis of MDS 2003–2005

71
Table A-8 Probability of discharge to the community (3 age groups)
Discharge to community Discharge to community with help Variables Under 65
odds ratio 65-74
odds ratio 75 and over odds ratio
Under 65 odds ratio
65-74 odds ratio
75 and over odds ratio
Time trend (quarter) 1.0076* 1.0078** 1.008*** 1.0154*** 1.0168*** 1.0183*** Expenditure ratio 1.5791*** 1.6166*** 3.2717*** 1.8054*** 1.0979 2.6144*** NHC criteria 0.96066*** 0.96371*** 0.98033* 0.9971 0.99954 1.0098 MFP or NFT grant 1.0935** 0.88861*** 0.9224*** 1.3021*** 0.92804** 0.92067*** Age 0.99146*** 0.94125*** 0.90957*** 0.9979 0.95603*** 0.9158*** Male 0.81914*** 0.69419*** 0.73627*** 0.71608*** 0.64754*** 0.70572*** Black 0.98272 1.1516*** 1.5018*** 0.85223*** 1.0701** 1.3776*** Asian 0.84429*** 1.4032*** 2.114*** 0.81835*** 1.1163 1.5425*** Hispanic 1.0545 1.6202*** 2.328*** 0.92072** 1.2737*** 1.8465*** Dual eligible 0.92753*** 1.2344*** 1.0242 1.3229*** 1.4144*** 1.1545*** Number of certified beds 0.99991 0.99948* 0.99965* 0.99938** 0.99904*** 0.99912*** For profit 0.89364*** 0.85478*** 0.97674 0.86997*** 0.81244*** 0.92993* Government 0.85574* 0.70712*** 0.74508*** 0.77736** 0.68327*** 0.72457*** Occupancy rate 0.78647** 0.78978** 0.60659*** 1.1549 0.98484 0.71458*** Urban 0.98826 1.0152 0.96375 1.17*** 1.2271*** 1.1088*** Chain 1.0895*** 1.0678** 1.0542** 1.1621*** 1.0953*** 1.0806*** Heating degree days 1.025*** 1.0157*** 1.0059*** 1.0372*** 1.0256*** 1.0171*** Hospital bed supply 0.98916 0.92548*** 0.9767 1.0605* 0.91754*** 0.95191* Physician supply 0.99777 1.0054* 1.0048** 1.0098*** 1.0131*** 1.0125*** Facility bed supply 0.98787*** 0.98913*** 0.99001*** 0.97723*** 0.98248*** 0.98364*** Constant 2.4935*** 85.289*** 0.1133*** 0.29076*** 11.24*** 328.45***
NOTES: * p<0.05; ** p<0.01; *** p<0.001
SOURCE: RTI International, MDS & Oscar data, April 2003–June 2005

72
Table A-9 Probability of discharge to the community
(nursing home certifiability modeled as a categorical variable))
Under 65 65 and over Under 65 65 and over
Variable
Discharge to community odds ratio
(n=192,248)
Discharge to community odds ratio
(n=818,904)
Discharge to community
with services odds ratio
(n=192,248)
Discharge to community
with services odds ratio
(n=818,904)
Time trend (quarter) 1.008 * 1.016 *** 1.015 *** 1.018 *** Expenditure ratio 1.581 *** 2.59 *** 1.665 *** 1.946 *** NHC criteria 2 0.897 ** 0.901 *** 0.786 *** 0.821 *** NHC criteria 3 0.877 *** 0.910 *** 1.057 1.004 NHC criteria 4 0.930 0.897 ** 0.980 1.004 NHC criteria 5 0.865 ** 0.920 * 0.902 * 0.966 MFP or NFT grant 1.092 ** 0.917 *** 1.281 *** 0.922 *** Age 0.992 *** 0.920 *** 0.998 0.929 *** Male 0.819 *** 0.721 *** 0.716 *** 0.684 *** Black 0.982 1.376 *** 0.857 *** 1.270 *** Asian 0.843 *** 1.933 *** 0.835 ** 1.452 *** Hispanic 1.059 * 2.122 *** 0.928 * 1.669 *** Dual eligible 0.929 *** 1.127 *** 1.328 *** 1.300 *** Number of certified beds 1.000 1.000 * 0.999 ** 0.999 *** For profit 0.894 *** 0.949 * 0.877 *** 0.905 *** Government 0.858 * 0.740 *** 0.782 ** 0.725 *** Occupancy rate 0.782 ** 0.646 *** 1.103 0.761 *** Urban 0.991 0.975 1.144 *** 1.119 *** Chain 1.088 *** 1.062 *** 1.162 *** 1.093 *** Heating degree days 1.024 *** 1.008 *** 1.036 *** 1.018 *** Hospital beds/1000 elderly 0.989 0.959 ** 1.038 0.931 *** Physicians/1000 elderly 0.996 1.003 1.006 * 1.009 *** Facility beds/1000 elderly 0.989 *** 0.991 *** 0.982 *** 0.987 *** Constant 2.400 *** 420.19 *** 0.327 *** 100.5 ***
NOTES: * p<0.05; ** p<0.01; *** p<0.001
SOURCE: RTI International analysis of MDS and OSCAR data, April 2003–June 2005.