design of an infrared system - archive.org
TRANSCRIPT

NPS ARCHIVE1959PHILLIPS, W.
KhI
DESIGN OF AN INFRARED SYSTEM
FOR MEASURING STAGNATION
POINT HEAT TRANSFER RATES IN AN
ELECTRO-MAGNETIC SHOCK TUBE
WILLIAM R. PHILLIPS
AND
LARRY G. VALADE
UmiHmJ
.I .'';! '
!-;>!!'
iHiin fummmMilnnniimmitit
mmim\MM\\mmM\M\ (>::.!:.,.
'mliillfililr
|}j|{fjf{j|Hjj:
IfMtinlih
•''. :';)?*;)(,';
nuintumini)
ill

t)l NAVAL POSTGRADUATE SCHOOL
MONTEREY, CALIFORNIA


DESIGN OF AN INFRARED SYSTEM
FOR MEASURING STAGNATION POINT HEAT TRANSFER RATES
IN AN ELECTROMAGNETIC SHOCK TUBE
By
William R. Phillips
Lieutenant, United States Navy
and
Larry G. Valade
Lieutenant, United States Navy
Submitted in partial fulfillment of
the requirements for the degree of
MASTER OF SCIENCEIN
ELECTRICAL ENGINEERING
United States Naval Postgraduate SchoolMonterey, California
1959

i"

DESIGN OF AN INFRARED SYSTEM
FOR MEASURING STAGNATION POINT HEAT* TRANSFER RATES
IN AN ELECTROMAGNETIC SHOCK TUBE
By
William R. Phillips
and
Larry G. Valade
This work is accepted as fulfilling
the thesis requirements for the degree of
MASTER OF SCIENCE
IN
ELECTRICAL ENGINEERING
from the
United States Naval Postgraduate School


ABSTRACT
Growing interest in the recovery of astrovehicles and artificial
planets has led to investigations of surface cooling at hypervelocities
(Mach numbers greater than 15). The simulation of these problems
using models in electromagnetic shock tubes has offered a direct
approach toward verification of predicted heat transfer rates. This
thesis is an analysis of a proposed experimental apparatus which will
measure the stagnation point heat transfer rate to models in highly
ionized flows in the electromagnetic shock tube.
It is proposed that stagnation point temperature measurements be
made with a photoconductive cell by measuring the infrared radiation
emitted from a metallic (gold) film placed on a quartz window in the
nose of the model. From the measured variation of temperature with
time, the heat transfer rate can be determined. The transmission
path of the infrared radiation is along a sapphire light pipe to a lead
sulphide dete'ctor external to the model. The device is capable of
operating under conditions where high ionization levels make the use
of resistance film gages impractical, and it may also be operated in
the presence of varying magnetic fields. The device is capable of
detecting heat transfer rates between approximately 2000 and
35,000 Btu/ft -sec. The lower value is determined by the available
period of observation (40 microseconds) while the upper value is
limited by the detector cell time response, melting temperature of
the gold film and the available period of observation. The response
time of the system limits observation periods to those equal to or
greater than the available minimum detector cell time constant (about
li


10 microseconds). Expected heat transfer rates are calculated and an
optimum operating wavelength is derived. Component specifications
are determined and calibration techniques are suggested.
The system concept and preliminary design work were originated
by Dr. R. W. Ziemer at the Physical Research Laboratory, Space
Technology Laboratories, Inc. , Los Angeles, California. The system
is presently being constructed and is expected to be in operation some-
time in 1959. This analysis was made by Larry G. Valade, Lieutenant,
U. S. Navy, and William Rees Phillips, Lieutenant, U. S. Navy, at the
Physical Research Laboratory through the kindness of Dr. Milton U.
Clauser, Director.
111


ACKNOWLEDGMENT
The authors are extremely grateful for the guidance and
assistance given so freely by Dr. Ziemer. Mr. William Bush
was most helpful in discussing certain aspects of the mathe-
matical derivations. Mrs. Mildred Anderson's calculations
and drawings, and Mrs. Goldie Sorkin's generous assistance
with the manuscript, are especially appreciated and have
aided greatly in the preparation of this paper.
IV


TABLE OF CONTENTS
sction Title Page
1. Introduction 1
2. Conditions of Heat Transfer Measurements in theElectromagnetic Shock Tube 4
3. Thin Film Requirements 10
4. Method of Radiation Transmission 17
5. Comparison of Infrared Signal and ExtraneousRadiation 20
6. Detector Cell Performance and Instrumentation 28
7. Calibration 39
8. Conclusions 44
9. References 46
10. Illustrations 48
11. Bibliography- 80


LIST OF ILLUSTRATIONS
Figure Page
1. An Electromagnetic Shock Tube in Operation 48
2. Details of the Shock Tube with the Test ModelInstalled 49
3. Typical Spectral Response of a Lead SulphideCell (noise-equivalent-power) 50
4. Schematic Diagram of the Shock Tube andAssociated Experimental Apparatus 51
5. Shock Wave Coordinate Relationshipswithin the Shock Tube 52
6. Free Stream Density Ratio and Free StreamVelocity in the Shock Tube 53
7. Predicted Heat Transfer Rates 54
8. Spectral Absorption Coefficient for Gold 55
9. Ratio of Emitted Energy to Transmitted Energy,W /W., for Various Film Thicknesses 56g t
10. Heat Flow in a Semi-Infinite Slab 57
11. Temperature- Time Profile in a Semi-Infinite Slab 58
12. Outer Surface Temperature for a Semi-InfiniteSlab as a Function of Time 59
13. Heat Flow Through a Parallel Wall Slab 59
14. Interface Temperature-Time Relationships 60
15. Schematic Diagram of Light Tube TransmissionSystem 61
16. Sapphire Spectral Absorption Coefficient 62
17. Transmission Efficiency of a Sapphire Light Pipe 63
18. Detailed System Assembly 64
19- Eddy Current Heating Considerations 65
20. Ratio of Emitted Power to Extraneous PowerIncident on the Detector Cell 66
VI


LIST OF ILLUSTRATIONS (Continued)
Figure Page
21. Desired Interference Filter Characteristics 67
22. Ratio of Emitted Power to Extraneous PowerIncident on the Detector Cell at a Wave Lengthof 2.8 Microns 68
23. Incident Signal Power on the Detector Cell asa Function of Time and Heat Transfer Rate 69
24. Approximating the Incident Power Relationship 70
25. Amplifier Frequency Response Requirements 71
26. Detector Cell Time Constant Response 72
27. Two Possible Detector Cell Circuits 73
28. Typical Lead Sulphide Cell ResponsivityCharacteristics 74
29- Correction to Responsivity Signal for ModulatingFrequency and Time Constant 75
30. Correction to Responsivity Signal for Cell Areaand Cell Resistance 76
31. Direct-Coupled Transistor Amplifier 77
32. Calibration Current Pulse Requirements 78
33. Proposed Calibration Circuit 79
Vll


TABLE OF SYMBOLS
A Area
B Magnetic field density, weber s/meter s
C Electrical capacitance, farads
D Differential operator
E Electrical potential, volts
I Current, amperes
K Thermal diffnsivity, ft /sec
M Mach number
P Power, watts, Btu/sec
R Resistance (electrical), ohms
R Responsivity, volts/watt
R Reflectivity (optical)
R Gas constant
S Jone s quantity
T Temperature
T. Transmission efficiency1
'
V Volume
W Emissive power, watts/cm -micron
a Speed of sound, ft/sec
c Velocity of light, cm/ sec
c Specific heat at constant pressure, Btu/lbm-°Fo
d Film thickness, A
f Frequency, cycles/sec
h Enthalpy, Btu/lbm
h Planck's constant
i Angle of incidence, degrees
vm


TABLE OF SYMBOLS (Continued)
k Boltzmann's Constant
1 Length
p Pressure, lbf/ft
q Heat transfer rate, Btu/ft -sec
r Energy ratio, Btu/Btu
s Laplace variable
t Time, seconds
u Velocity, ft/ sec
Greek
a Absorption constant, cm
a Thermal coefficient of resistivity, °K
y Specific heat ratio
e Emissivity
r| Index of refraction
K Thermal conductivity, Btu/sec-ft- "F
X. Wavelength, microns
p Density, lbm/ft
p Resistivity, ohm-cm
cr Stefan- Boltzmann constant
t Time constant, seconds
t Dummy variable of integration
cj> Magnetic flux, webers
oo Frequency, rad/sec
Subscripts
c Convection (heat transfer)
g Gold film
IX


TABLE OF SYMBOLS (Continued)
o Standard or reference condition
r Radiation (heat transfer)
s Shock wave
s Signal
s Stagnation point of model (enthalpy)
w Shock tube wall stagnation (enthalpy)


1. Introduction.
With the current interest in space vehicles and re-entry heating,
the problem of measuring the heat transfer rate to a blunt body in a
highly ionized, magnetoaerodynamic flow has become increasingly
important. A device is proposed for the measurement of the stagna-
tion point heat transfer rate on a test model and was designed for use
in the electromagnetic shock tube shown in Fig. 1. The basic concept
consists of placing a thin metallic film on the nose of the model, shown
in the shock tube in Fig. 2, and then observing the infrared radiation
at a selected wave length with a photoconductive detector cell. The
ultimate objective is to verify the magnetic cooling effect predicted
by Meyer [l] and Bush [2] . This design is a continuation of the mag-
netoaerodynamic research work performed by Dr. R. W. Ziemer and
W. B. Bush, Space Technology Laboratories, Los Angeles, California,
in determining the magnetic field effects on hypervelocity flow about a
blunt body (3J .
Resistance film heat transfer gages have been utilized with a
great deal of success for this type of measurement [4j. However, at
the higher Mach numbers (above approximately 15), the ionized parti-
cles striking the resistance gage generate noise greater than the
normal signal, making the system impractical for such flows.
Successful observations of explosion temperatures by photo-
multiplier color pyrometers [5j suggested radiometric measurement
of the surface temperature of projectiles fired at hypervelocities.
This method is being employed at the U. S. Naval Ordnance Test
Station, China Lake, California, [6 J utilizing electron photomultiplier
tubes operating at wave lengths of 0.55 to 0.75 micron. The application


of this technique in the infrared spectrum to the magnetoaerodynamic
heat transfer problem was suggested by Ziemer.
The problem of detecting infrared radiation from the model in a
shock tube with an approximate stream temperature of 8000 °K, and
shock layer temperatures up to 35,000°K, presents many interesting
considerations. In addition, the short duration of steady state condi-
tions (15 to 40 microseconds), the necessity of shielding the detector
cell from the free stream and shock layer radiation, and the need for
electromagnetic shielding of the electronic components, places stringent
requirements on the system.
Initial calculations indicated that model nose film temperatures
from 300 to 1200°K could be expected. The wave length of peak
radiationat these temperatures lies between two and ten microns. The
greater sensitivity of lead sulphide cells (over other photoconductive
detectors) will be required for maximum system response. Typical
spectral response characteristics [7] of a lead sulphide cell are shown
in Fig. 3. Peak response of this cell lies between 1.9 and 3.5 microns.
The high temperature radiation from the free stream gases [8j exhibits
an apparent minimum at a wave length of 3. 1 microns. These considera-
tions suggest an initial spectrum of interest between wave lengths of
two and four microns.
In designing the system, the following will be considered,
(1) A study of the shock tube characteristics and evaluation of the
expected heat transfer rates
(2) Selection of the metallic film material and thickness
(3) Determination of a suitable energy transmission path
(4) Selection of an optimum wave length


(5) Detector cell performance
(6) Instrumentation
(7) Calibration.


2. Conditions of Heat Transfer Measurements in the Electromagnetic
Shock Tube.
In order to design a heat transfer measurement system it will be
necessary to first examine those conditions under which the measure-
ments will be made. It will be shown later that the system must be
capable of measuring extremely high transfer rates up to 35,000 Btu/
2ft -sec. The measurements must be made within the 15 to 40 micro-
second steady-state times inherent in electromagnetic shock tubes. The
device must also be insensitive to strong electromagnetic radiation
from the shock tube gases and the electrical circuitry.
The test model is shown in Fig. 2. The physical dimensions
closely approximate those of models used in previous work with the
shock tube. The operation of this particular shock tube has been
described in detail by Ziemer. [9] The following basic principles are
outlined for the reader unfamiliar with this device.
A high voltage electrical discharge at the base of the tube suddenly
adds driving energy to a portion of the gas. As the gas rapidly expands,
a simultaneous magnetic pinch forces the gas down the shock tube. A
very strong shock wave with Mach numbers of 40 or more is generated.
The main equipment associated with the tube consists of the shock tube
assembly, electrical spark gap switch, high voltage power supply,
condenser bank, trigger pulse circuitry, high current pulser for
applying the magnetic field at the nose of the model, and a vacuum
system for evacuating the tube. The complete system is shown
schematically in Fig. 4.
Various shock tube operating conditions are obtained by evacuating
the tube to various initial pressures in the range from 30 to 300 microns.


2. Conditions of Heat Transfer Measurements in the Electromagnetic
Shock Tube.
In order to design a heat transfer measurement system it will be
necessary to first examine those conditions under which the measure-
ments will be made. It will be shown later that the system must be
capable of measuring extremely high transfer rates up to 35,000 Btu/
2ft -sec. The measurements must be made within the 1 5 to 40 micro-
second steady-state times inherent in electromagnetic shock tubes. The
device must also be insensitive to strong electromagnetic radiation
from the shock tube gases and the electrical circuitry.
The test model is shown in Fig. 2. The physical dimensions
closely approximate those of models used in previous work with the
shock tube. The operation of this particular shock tube has been
described in detail by Ziemer. [9j The following basic principles are
outlined for the reader unfamiliar with this device.
A high voltage electrical discharge at the base of the tube suddenly
adds driving energy to a portion of the gas. As the gas rapidly expands,
a simultaneous magnetic pinch forces the gas down the shock tube. A
very strong shock wave with Mach numbers of 40 or more is generated.
The main equipment associated with the tube consists of the shock tube
assembly, electrical spark gap switch, high voltage power supply,
condenser bank, trigger pulse circuitry, high current pulser for
applying the magnetic field at the nose of the model, and a vacuum
system for evacuating the tube. The complete system is shown
schematically in Fig. 4.
Various shock tube operating conditions are obtained by evacuating
the tube to various initial pressures in the range from 30 to 300 microns.


The tube is usually operated with air, but could be filled with any
gas of interest. Shock Mach numbers are approximately inversely
proportional to the initial tube pressure at the time of firing.
In order to fire the tube, a high voltage supply charges the capaci-
tor bank to about 25 kilovolts, which is applied between the ring and
lower spark gap electrodes. The spark gap prevents current flow until
the 15-kilovolt pulse is applied to the lower switch plate. Then the
voltage between the lower switch plate and the trigger wire exceeds the
breakdown potential, and this initial discharge ionizes the gas in the
spark gap, which becomes conductive. This permits the capacitors
to discharge, and current flows from the center electrode to the ring
electrode and down the six copper straps placed around the outside of
the tube's conical section. The resulting high current produces a
magnetic field which pinches and further heats the ionized gas in the
cone, driving the shock wave down the tube.
A high current can be pulsed through the coil located in the nose of
the model, resulting in maximum magnetic field strengths of about
40 kilogauss at the stagnation point. The current is supplied by an
.L-C circuit whose resonant frequency is approximately 2000 cps.
The shock tube is fired just prior to the time when the field strength
is at its peak value. This provides an essentially constant magnetic
field over the 40-microsecond test period due to the relatively long
500-microsecond period of the L-C pulsing circuit.
In order to determine the thermodynamic conditions existing in
the tube, the shock wave velocity is measured experimentally by
means of the rotating mirror camera. [10] Knowing the shock velocity


together with the initial pressure or density, is sufficient to calculate
the characteristic properties of the flow.
The shock tube flow characteristics, free stream density ratio,
p-,/p , and the free stream velocity, u?
, as functions of shock Mach
number are determined as follows:
From the continuity equation,
plU
l
= p2U2
and from the diagrams of Fig. 5,
u
Pl
u Mu - U-,s 2
u u_s 2 M
s a.
Let M' be defined as
M2 =
M2
Y2T2
^1T
l
u.
then
(Ms- M' ) p 2/ Pl = M
M! Mg
(1 -Pl/p 2 )
= M,^2 T
2
^1 T1
Since
u.
M.


then
U2
a2— = M — = M
a, Z a, Z
^zRT
z
vl RT
X
Utilizing the Hugoniot shock wave relationships and the thermodynamic
properties of high temperature air reported by Gilmore, [l lj the desired
quantities are readily obtained for various shock tube initial conditions,
and these are presented graphically in Fig. 6.
The operating characteristics of the shock tube using air may be
summarized as follows:
Shock Mach number, M 15 to 40s
/-4 -5
Initial density ratio, p/p 3x10 to 3x10
Free stream density ratio, p->/p 3.6 x 10 to 6 x 10
Free stream Mach number, M?
Z.9 to 3.9
Free stream velocity, u2
15,000 to 41,000 ft/sec
Free stream temperature, H 6000 to 11,000°K
Shock layer temperature, T, Z0,000 to 35,000°K
Test duration 15 to 40 microseconds
Pressure shock tube experiments for determining the stagnation
point heat transfer rate on similar test models have been reported by
Detra[lZJ of the Avco Research Laboratory, Everett, Massachusetts.
It was found that at test shock Mach numbers of up to 17, the following
empirical relationship described the observed heat transfer rates.
17,600q s
= "T-3.15/" h - h
U ^ [S W 1 „, I r. Z
/P„ T- L -\ " Btu/ft'-sec


where R is the body nose radius, u is taken as a reference velocity,
26,000 ft/sec, and h , and h , the wall and stagnation enthalpies,' w s
respectively.
Making the assumptions that,
h » hs w
hs» hw300
the expression reduces to
17,600R
P->'/ \3.15
7
\t ft)BtuAt " sec
Substitution of the previously determined thermodynamic properties
into the equation above results in the heat transfer rate curve as a
function of shock Mach number and is shown in Fig. 7. The validity
of this relationship becomes suspect above the range of Detra's
experimental verification, because it would seem that the radiation
effects from the shock layer and free stream gases may be contri-
buting substantially to the heat transfer rate. These effects are
probably just becoming significant at the highest velocities observed
by Detra.
It should be noted that the Detra equation is valid for atmospheric
free stream or actual flight conditions and substituting values obtained
in the electromagnetic shock tube into this expression will yield errone-
ous values. Free stream temperatures in the shock tube are about
8000 °K, while actual flight stream temperatures will be of the order of
100°K and will vary with altitude density. When this was taken into


account, preliminary calculations indicated that the heat transfer rate
in the shock tube will be approximately 25 per cent greater than that
shown in Fig. 7.
An analytical study by Meyerott[l3] reported the effect of radiation
heat transfer is governed by the relation
3/2 _ 10q ^vp ' Ru
while the convective heat transfer appears as
1/2 -l/2 3qc
'v p ' R u
The expression for convective heat transfer agrees closely with
Detra's expression. However, a comparison of the two heat transfer
rates, q and q , within the range of interest indicates that ther c
radiative contribution is of the order of ten per cent or higher of the
convective portion. This means that the estimated heat transfer rate
in the shock tube will be greater than that calculated for pure con-
vective heating. Hence, due to both the "artificial 11 conditions in the
shock tube, and the radiative heat effects, the total heat transfer rate
to the test body in the shock tube will be appreciably greater than that
predicted by Detra's equation.


3, Thin Film Requirements.
Several factors must be considered in selecting the metallic film
to be placed on the test body. A maximum temperature rise is desired
in the short time available for measurement in order to obtain a high
emissive power. This requires a film material of high thermal diffusi-
vity, evaporated on a substrate of low thermal diffusivity. Moreover,
the film should be of minimum thickness so that the temperature
gradient within the film will be small.
The emitted radiation from the film must be observed from behind
the film so that the observed radiation does not have to pass through
the hot and also radiating gases in the free stream and shock layer.
However, thin metallic films may permit appreciable transmission of
radiant energy fl4] in the spectrum of interest. In order to have the
film opaque to this radiation, the film should have a high reflectivity,
a high absorption coefficient and a certain minimum thickness. There-
fore, because of conflicting thermal and optical requirements, a
compromise film thickness must be determined.
Thermal and optical properties of various film and substrate
materials must be considered. The desirability of a gold film and a
quartz substrate is evident from examination of the properties of the
most promising materials listed below.
The chemical inertness of gold is another factor that makes its use
attractive. Certain grades of quartz are opaque above wave lengths of
2.5 microns, but selected fuzed quartz has excellent transmission out
to about 4 microns, f 1 5J
These properties and those physical constants used throughout thethesis were largely obtained from American Institute of PhysicsHandbook, McGraw-Hill, New York, 1957.
10


Thermal Specific Spectral AbsorptionMaterial Diffusivity Heat Emissivity Coefficient
2 -
1
ft /sec Btu/hr-ft-°F 2-4|jl 2-4|jl cm
20.0
3.4
Gold 12.64 x 10" 4 0.031 0.03
Platinum 2.72 x 10" 4 0.032 0.03
Quartz 9.00 x 10" 60.18 --
Pyrex 7.00 x 10" 60.20 --
Sapphire 9.77 x 10" 50.18 0.03
The transmissivity of the gold film must be investigated in order
to determine an optimum thickness which will permit a minimum
temperature gradient from the outer to the inner film face, and a
maximum ratio of emitted film radiation to transmitted hot gas radia-
tion. The transmitted energy is made up of radiation from both the
free stream and shock layer gases and may be expressed in terms of
the incident radiant energy on the gold film as
Wt
= (W + W2)(l - R) exp > d
2tto. —A.
where R is the reflectivity constant, a, the absorption coefficient
and d, the film thickness.
The ratio of the emitted energy to the transmitted energy for all
wave lengths may be expressed in terms of Planck's Law as,
11


w
(W, + W1)(l - R) exp
X-
2 .I
c d\e Zuc hg
' X, X~ expchl
LkXTJ
e?
Ztt c hdX
X, X expchkXT.
PX-
- 1
+ €,2170 hdX
X, X expch
kXTiJ
(1 - R)exp \-2ita -r\
For a single wavelength, the above equation reduces to
W—& =w
t
/exp ch'kXT
1,2exp
ch 1kXT
2J
- 1 expchkXT
1J
- 1
(1 - R) exp[-2Tra^]
Assuming black body radiation from the gases,
61,2
= el
= e2
= X
Substituting the value of
e = 0.03 for 2|x < X < 5u
and then evaluating the energy ratio as a function of X for various
thickness with
Tl
= 35,000°K
T2
= 8000°K
R = 0.983
a = f(X) from Fig. 8
12


yields the curves of Fig. 9. This graph indicates that a thickness of
5000 A gives a ten to one ratio of emitted energy to transmitted energy
for wave lengths of interest.
o
The temperature profile in the substrate for a 5000 A thick film
is determined next as a function of time and heat transfer rate. The
differential equations describing the heat flow are well known and the
solution has appeared in several references. [l6] , fl 7 J The method of
solving the problem is to first assume the thin film to be a semi-
infinite slab as shown in Fig. 10. The solution to this configuration is
later used in the exact solution for a film of finite thickness on a
substrate of different thermal properties. The differential equation
describing this temperature rise-time relationship in the semi-infinite
slab is
M = K S_| for 8(x,t)at ax^
where
K ^K
c p
9(x, t) = T(x, t) - T(x, o)
and
T (x, t) = temperature at any point, x, in the slab at time, t
The boundary conditions to be satisfied are
e(x, o) = o (i)
lim 9(x, t) = (2)
x -*> CO
13


for t>0
8xx=0
_ £K
(3)
Using Laplace transform methods,
L(e) = e(s)
then
s8 = K dZ edx
2
°2~ f '
and
0(s) = c, exp1
Kx + c
?exp
K
Applying boundary conditions (2) and (3) to evaluate constants c, and
c ?> it is found that
and
Cj =
dOdx
x=0
a AK \S = -ol
Ks
giving
ili -3/2K
. © (s) = ^ s ' expK I
K
Taking the inverse transform, [l8] the solution is
e(x,t) =<KK f2 ^ — exp -1/4
xKT
--2- erfcf-i -^-ifT
14


This temperature rise-time versus depth relationship is shown
graphically in Fig. 11 for the general case, and the surface tempera-
ture solution is plotted in Fig. 12. If the properties of the substrate
are used in this solution, the approximate solution is obtained for a
very thin film on a semi-infinite substrate, for which the presence
of the film has negligible effect.
However, the solution to the particular problem of a thin film of
finite thickness mounted on a semi -infinite slab, as shown in Fig. 13,
remains to be determined. One solution to this temperature rise-time
relationship [l9J is
t7 * J tFrT
1 dT
00
+ 2 bn=l
n
4K (t - t )
0(2ni - x , t) + 0(2ni + x , t)
where
and
i|i(x i> = temperature rise at any point,
x, , in the film at time t
b =n — 1 + a
a = substrateKfilm 1
K filmK substrate
It can be shown algebraically that
9(x,t) = -±- 12-
fP K
pt
3iil
o f
expt - T
1
4K(t - t)dr
15


where 9(x, t) is the previous solution for the semi-infinite slab of
the film material.
For evaluation of the interface temperature rise as a function of
time
Xj = i
then, simplifying the general expression yields
co
iMl, t) = S hn ~ l
(1 + b) 9 (2n - l)i , t
n=lL J
The outer face temperature rise may be expressed as
co
vjj (0,t) = 9(0, t) + 2 2 bn0(2ni, t)
n=l
o
Evaluating the general expression for the 5000 A thick gold film
on a quartz substrate for various heat transfer rates, and assuming
a room temperature of 300°K, gives the interface temperature versus
time curves of Fig. 14.
16


4. Method of Radiation Transmission.
The problem of transmitting the radiated energy from the gold
film to the infrared detector cell will be considered next. Knowing
the characteristics of a typical detector cell, [?J the minimum detect-
able power level which must fall on the sensitive area of the detector
can be determined. The temperature-time history of the film inter-
face is known for the shock tube operating conditions, and therefore
the power emitted by the film through the quartz substrate is also
known.
The transmission problem, then, is to determine whether
W x T. — P , . . , ,
g i detectable
in which W = emissive power from the gold film©
T. = transmission efficiency of the system
P , , , = minimum power detectable by infrared celldetectable r 3
The problem is reduced to choosing a method of transmission with
sufficient efficiency such that the lower limit established by
PT -> detectable
Wg
is exceeded or that T. closely approaches 100 per cent.
The efficiency of any transmission system will be a function of the
wave length of the transmitted energy. The operating wave length
remains to be selected at a later stage of the analysis, and, therefore,
no valid approximation is available for a probable value of T. for a
particular method. Therefore, the optimum transmission efficiency
of a number of possible transmission methods will be examined, making
the problem one of choosing the most efficient technique.
17


The first transmission system considered is an optical lens
arrangement which will focus the emitted energy and direct it to the
detector's sensitive area. Various lens-mirror arrangements were
considered and it was found that the maximum transmission efficiency
of any optical system is about 13 per cent The geometry of the aero-
dynamic body restricts the efficiency of this method by limiting the
collecting area of the first lens in the system.
The successful use of a sapphire rod as a light pipe, in silicon
crystal growth control, [20J suggested a similar application to this
problem. A study of the optical properties of crystals in the infrared
region indicated that the transmissivity of sapphire, in thin samples,
approaches 90 per cent for wave lengths up to approximately five
microns. The proposed transmission system incorporating a sapphire
light pipe is shown in Fig. 15. Based on this diagram, the trans-
mission efficiency of the rod may be expressed as
tt/2
T A = 2rod
cos (3 exp aL sec i di
in which L. = length of the rod. From Snell's Law for the refraction
of light
sin (3 2
sin i ri
in which r\ is the spectral refractive index of the transmitting
material. Then
"tt/2
diT a = zrod
Jo
sin i exp -a L. sec i
1
18


A lower bound for the transmission efficiency can be determined
by evaluating the expression
fli
T , — 2rod )
1 - — sin i exp -aLseci di
where the angle, i , is that angle below which total reflection occurs.
The spectral coefficient, a, for sapphire appears in Fig. 16.
The integral above was solved graphically over a range of wave lengths
of two to five microns, and the results plotted in Fig. 17.
It is interesting to note that the use of the quartz substrate
improved the transmission efficiency of the system. The refractive
index of quartz is sufficiently less than that for sapphire so as to pro-
vide a focusing effect that permits more energy to fall on the face
between the substrate and the light tube.
This study showed that a sapphire light pipe is a highly efficient
means of transmitting energy in the infrared spectrum. The expected
transmission efficiency of this configuration can be as high as 95 per
cent in the near infrared and hence, the light pipe was selected in
preference to the lens system.
19


5. Comparison of Infrared Signal and Extraneous Radiation.
The intensity of the signal power from the gold film received at
the cell must be compared to the incident power emitted by all other
sources. At the lower wave lengths, considerable power is trans-
mitted through the film from the shock tube gases. At the longer
wave lengths, power comparable to the signal power is emitted by the
light pipe, substrate, and the test model walls. Hence, an optimum
operating wave length will be determined to maximize the ratio of the
signal power to the extraneous power. This investigation will require
selection of the physical dimensions of the apparatus as it is mounted
on the shock tube.
The diameter of the sapphire light pipe should be a maximum, in
order to achieve greater transmission efficiency. However, this
dimension is limited by the available space within the magnetic coil
core. Further a small diameter is desirable to minimize the rod
surface area, and, therefore, reduce the incident transverse power
into the rod. Furthermore, it is advantageous to have the gold film
diameter the same as the light pipe diameter. However, a minimum
gold film area is required in order to approximate closely the stagna-
tion point conditions. As a compromise, a diameter of 0.15 inch
was selected for the initial assembly and subsequent calculations will
be based on the resulting area for the gold film, substrate, sapphire
rod, and infrared components.
The detail design of the test apparatus is shown in Fig. 18. The
housing above the model will be utilized for the detector cell, circuitry,
and other necessary electronic components. The housing is made of
thick copper walls in order to shield the electrical components of the
20


system from stray electromagnetic radiation. The 3/l6-inch minimum
thickness used will permit penetration of only two per cent of 5000-cps
radiation.
Returning to the problem of maximizing the signal to background
power ratio, it will be necessary to investigate all possible sources of
infrared radiation that will be incident on the cell, and if possible, to
select a restricted spectral band in which the ratio of the emitted power
from the gold film to the emitted power of all other sources will be a
maximum. An interference filter will be required to limit the cell
spectral response to a discrete bandwidth, permitting an optimum
signal to background power ratio. Possible sources of undesirable
noise radiation will include,
(1) Substrate
(2) Interference filter
(3) Incident heat flux on the model's structural surfaces, other
than at the stagnation point
(4) Eddy current heating of the film by the magnetic field
(5) Light tube
(6) Free stream gases
(7) Shock layer gases
Sources 1 and 2 are negligible when the magnitude of emissivity
is considered for thin layers of quartz and germanium. The radiation
level from these sources remains at room temperature throughout the
test period as indicated by Fig. 11.
The structural source level 3, is small, limited by the shielding
effect of the copper and will be minimized by highly polishing the tube
21


surrounding the sapphire rod. Also the outer surface of the model
will be fabricated with an opaque plastic material.
The heating of the gold film by the eddy currents induced by the
magnetic field, is investigated and the magnitude of the temperature
rise determined. The physical picture of the effect is illustrated in
Fig. 19- The energy dissipated in the film can be determined by
assuming a uniform flux density over the entire film of
= A B sin wtr mm
and using the basic relationships
E =d<£
dt
dP =FTR
R = A
From the geometry of Fig. 19, the dissipative power is
P =
pr=D/2, 2^2 2 3,dirco B cos ootr drm
2p
dlTUJ Bm fD\4
2—^
—
[tj cos wt
evaluated for
B =4 webers/sq meterm
co = 1.05 x 10 rad/sec
D/2 = 0.075 in.
p = 2.42 p. ohm - cm
ZZ


yielded
P = 0.19 cos cot watts
The temperature rise in the film was estimated by means of the
relation
c pVA TP
where t, = 600 jjl sec, which resulted in
AT = 4.1 x 10"4 °K/cycle
which can be ignored.
The sapphire rod, while nearly transparent to infrared radiation,
has an emissivity comparable to that of the gold film in the spectrum
of interest. This room temperature radiation from the sapphire rod
is significant at the longer wave lengths and must be considered in
choosing an optimum operating wave length. Using the familiar
expression,
T , + € + a , = 1rod rod rod
and assuming
then,
a , =rod
e . = (1 - T ,)rod rod
where
rod *'
23


from which the emitted power of the sapphire rod at 300 °K may be
expressed as
Wrod
2 ir c h
0\.-
d\(l - T J* rod
X.
,5X. exp
1l300kXJ
1
Radiation from the sources 6 and 7 will be transmitted through
the film as a function of film thickness and wave length as discussed
in Sect. 3. This energy will be significant at the shorter wave lengths
and, therefore, should be considered in arriving at an optimum waveo
length for system operation. For a film thickness of 5000 A, and,
assuming
a =
el
= 612
8000°K
20,000°K
f(X)
1
R = 0.983
the radiation from the gases which is transmitted through the gold film
can be expressed by
W12
= e12
Z7TC hdX.
,5X. exp
T
d\
' ch I
8000kXj1
,5X. exp
ch20,000k\
1
(1 - R) exp[-2ua^]
24


The selection of an optimum wave length will depend on evaluating
the ratio
W (\, T)= r(\, T)
12 * ' rod
at different wave lengths and various temperatures, then determining
that wave length which gives
r(\, T) = rx ' max
The results of this computation clearly indicate, in Fig. 20, an
optimum signal at
\ = 3|JL
The selection of a proper bandwidth is made by comparing the
spectral response of the detector in Fig. 3 with the curves of Fig. 20.
A wide bandwidth is desirable in order to have maximum incident power
on the cell. However, a narrow bandwidth is required to obtain a high
quality signal so that the ratio, r, is greater than some arbitrary
value corresponding to a satisfactory signal-to-noise ratio.
It seems appropriate to select a bandwidth
A\ = 0.4u
centered at
X. = 2.8u
in order to take advantage of maximum detector response. An inter-
ference filter, with characteristics as shown in Fig. 21, will be placed
in front of the detector cell. This will limit the shorter wave length
response, and the detector cell will limitthe longer wave length response.
25

'

The power ratio,
Wr =
12 rod
is evaluated at
\ = 2.8|jl
as a function of the gold film temperature and plotted on Fig. 22. This
indicates that a film temperature of 380°K will be required in order to
achieve a signal with
r > 6
The incident signal power on the detector from the gold film may
be calculated from the temperature-time relationships in Fig. 14 by
the following approximation:
We 2ir c h
ondetector
,5X. exp
chk\T
' AX • A T • Trod filtei
where
AX. = 0.4M-
A = 0.1152 cm
T = 0.8rod
TVn- = 0.3filter
X. = 2.8u
This equation is evaluated for three different heat transfer rates
and the results appear graphically in Fig. 23.
26


Steady- state flow conditions are reached in the shock tube about
five microseconds after the tube is fired. In order that the emissive
power at this time be detected, the cell must be capable of sensing a
minimum incident signal power of 0.015 microwatts for low shock
Mach numbers.
27


6. Detector Cell Performance and Instrumentation.
Having determined the variation and amplitude of the incident
radiation on the detector cell, the ability of an infrared cell to detect
this aperiodic signal will be investigated next. A study of response
characteristics of infrared cells indicated that lead sulphide cells
have a superior relative response \Z1J
in the spectrum of interest
when compared with cells made up of other photoconductive materials
such as lead telluride, lead selenide, and indium antimonide.
Before considering the minimum detectable signal of a cell, it
will be helpful to define certain terms associated with infrared detector
application. Noise-equivalent-power, P, is defined as that incident
radiation on the cell which produces a signal to noise power ratio of
unityJj7J Another basic parameter, the "Jones quantity," S, is defined
at some arbitrary reference level by the following relationship, \2Z]
S =f <J7*
in which A = sensitive cell area and f?
and f , are the upper and
lower amplifier bandwidth half-power frequencies, respectively. The
time constant, t > is defined as the time required for the response to
a step input to build up to 63 per cent of its maximum value and it has
been observed that
St = constant = C
Combining these two equations yields the somewhat simpler and more
useful expression for noise-equivalent-power,
28


p = £( Aln ^1/2
Noise-equivalent-power is generally presented graphically as a function
of wave length, as in Fig. 3, for specified reference values of t, A,
i?
and f . . By combining
% (a°,1/2
r i.1/2
and
4(A)
where the subscript, "o", applies to the standard reference condition
and the superscript, "*", identifies those values for a particular cell-
amplifier application. The noise-equivalent-power for a particular
cell can be evaluated, when t , A , f_ and f have been deter-
mined for proper signal output, by the expression
pI
-2-o\ *
A 1/2 (lnlj/fj)
^V^o"
1/2
Thus, the noise-equivalent-power, or minimum detectable signal
power, is directly proportional to the square roots of the cell sensitive
area and the logarithmic frequency ratio. The quantity is inversely
proportional to the time constant. In order to evaluate the noise
-
equivalent-power, it will be necessary to investigate the bandwidth
and time constant required to develop a meaningful signal across the
detector cell. The majority of military and commercial applications
29


involve modulating the incident radiation as it strikes the detector and
observing the entire spectrum of the emission source which is visible
to the cell. Literature and manufacturers' data are presented with
these applications in mind and, as a consequence, a special analysis
will be required to determine the desired cell characteristics for this
pulse input application.
The bandpass required to amplify the signal without excessive
distortion will be determined first. The cell input signal as a function
of time corresponding to
q = 5000 Btu/ft -sec
has been selected for design purposes. This signal is approximated
by the parabola shown in Fig. 24 and can be expressed as
f(t) = t^O
f(t) = 625 t2 — t <40 x 10" 6
sec
f(t) = t — 40 x 10~ sec
Then, by means of the familiar Fourier integral relations, [23j
poo
f(t) = g (go) dco ejwt
CO
g(w) =2tt
CO
f (t) dt ejwt
CO
it is possible to determine the magnitude of the frequency response as
a function of frequency, from which the required amplifier bandwidth
30


is determined. A minimum bandwidth is desired in order to achieve
minimum noise-equivalent-power. Proceeding then,
g(w) =2tt
P40xl0'
f (t) dt eJW " +jwt A
1
2tt
U-coOoo
f (t) dte'jut
1
2ttf (t ) dt e
jwt
40x10
1
2tt
40x10
f (t) dt e'jt0t
For a = 40 x 10 sec, the approximate test duration in the shock tube,
we obtain
f 22tt
625 § ("> = e -J aoo 2a
002
+ J 17 ' -00
3 "'i
OJ 00
+ j —rr = —^ COS aooJ 3 2
+ (jT ~~S) sinaco
+ j
2 2a /a 2 1—
r
— —r- sinaul — — —r cos a coj 2 I oo 3/
00 CO V 00 /
If
then
2a2
R (oo) =
00
3."
00sm a oo
T / v 2 2a /aI (oo) = —R- r- sm aoo + —
j ^ l oooo oo V
cos a oo
oo
g(u)6252tt
R2 (co) + I2
(to)
31


Nondimensionalizing by means of
IfiM
where
lim |'g(w)|
co-» o
lim g (go) =
G0-» O
G(oo)
W f
and expressing G (u>) in decibels permits a simpler form in which to
evaluate the frequency response for
1 ^ w — 10 rad/sec
which is shown in Fig. 25. The magnitude is down 20 db at
f2
= 15 kc
which defines a conservative upper frequency limit for the amplifier.
Representing the signal as a single pulse is somewhat misleading.
However, an exact solution would have entailed rather tedious com-
putations not commensurate with the desired accuracy. Inasmuch as
the system is eventually expected to be used in longer duration shock
tubes, a wider bandwidth,
* 3f = 50 x 10 cps
f1
will be utilized. Since the term in the noise-equivalent-power
expression, In (f /f ), becomes indeterminate as f approaches
zero, the approximation,
1
irT 410 cps
will be made for design considerations.
32


The next characteristic to be investigated is the effect of the cell
time constant on the detector output signal. It should be noted that the
cell time constant and the noise-equivalent-power are extremely sensi'
tive to cell temperature, exhibiting the following characteristics: [7J
Time Constant Noise-Equivalent-PowerCell Temperature (microseconds)
10 to 1000
(watts)
25°C P , say
75°C 2 to 200 ^ 10 Po
-78°C 100 to 10,000 w o- 3 po
-196°C 200 to 10,000 W 0.16 Po
A minimum time constant can be achieved by heating the cell, but
this increases the noise-equivalent-power, reducing the cell sensi-
tivity. The input radiation signal is assumed as before to be
2 6f (t) = 625 t < t < 40 x 10 sec
f (t) = for all other t
and a transfer function for the cell is assumed to be of the form,
H(b) =1 + ST
where s is the Laplace variable. Then, using Laplace transforms,
the output signal can be expressed as
LM = {(tttf) 4^*11
L[f(t)] = F(s)
L[o(t)] = O(s)
33


F(s)
O(s)
1Z5Q3
s
H(s)F(s)
2 x 625
o(t)
.s (s + 1/t).
f (t) - 1250t ft - T (1-t/r ;
e )
The output signal is determined for values of t = 1, 5, and 10 micro-
seconds and is plotted in Fig. 26. It is indicated by these curves that
a minimum time constant is desirable, preferably less than five
microseconds. This precludes the use of detector cooling and suggests
heating the cell. However, heating the detector will provide an addi-
tional source of radiation that will be comparable to that emitted by the
film, so the alternative of operating with an expected time constant of
ten microseconds at room temperature must be accepted. Certain
manufacturers have suggested the possibility of reducing this value of
t by a selection process and an attempt to procure a minimum time
constant cell should be made.
For this analysis, the time constant will be assumed to be
t = 10 microseconds
The sensitive cell area will be taken as that of the light tube,
A = 0.1152 cm 2
Having determined the three basic parameters, it is now possible to
evaluate the expected noise-equivalent-power based on the reference
values in Fig. 3.
34


1/2
= Po \ *VT j
A
(ln^/fj)*
<lnVfl>o
1/2
3x10io n o.oi
12 /180W0.1152
-9
1/2In
50x10'
io"4
In1005995
1/2
= 8.5 x 10 watts
This value indicates that an acceptable signal to noise ratio of the cell
of six is reached at time
t = 6 microseconds
when the film temperature
T = 360°K
However, a signal which is distinguishable from the background
radiation is not available until r = 6, at which time
T = 380°K
t = 8 microseconds
Steady state conditions in the shock tube are reached at about this
same time, so this means that the period of observation should begin
at
t = 10 microseconds
The magnitude of the output signal from the cell will be deter-
mined next. This quantity is commonly called responsivity and is
expressed in units of output volts per watt of incident radiation. The
cell is placed in a series circuit as shown in Fig. 27. Closing and
opening the switch just before and after each test run will permit use
35


of maximum voltage across the detector without excessive heating of
the cell. A high bias voltage gives the greatest signal. Hence, an
applied battery voltage of 400 volts will be used, which is a practical
upper limit.
A series resistor is used to match the cell resistance for maximum
power delivery to the amplifier. The cell resistance varies somewhat
with manufacture and will be assumed to be one megohm, which is a
representative value. The signal from the detector is generated by
the change in cell conductivity caused by the incident photons.
The responsivity varies with cell area, cell resistance, cell
voltage, cell temperature, time constant, modulating frequency, and
source temperature. The responsivity of an individual cell is usually
determined by experimental means at some standard conditions. The
data from such tests for a typical lead sulphide cell are presented in
Fig. 28. The tests consist of focusing the radiation from a constant
temperature black body source on the cell sensitive area. The tempera-
ture can be set at any desired level and the black body emitted power is
distributed over the spectrum in accordance with Planck's spectral
distribution law. Since the cell only responds to radiation between
about 1.9 and 3.5 microns, a very small part of the incident energy
will be in the cell's "visible" spectrum for the lower temperatures.
However, as the black body temperature is increased, a greater
portion of the incident power will lie in the detectable wave length
range, resulting in a greater response for the same total power input.
For the proposed application in which an interference filter is used,
all the energy in the selected operating bandwidth lies within the region
of maximum response of the detector and hence all filtered incident
36


radiation will be "seen" by the cell. It follows, then, that the cell
responsivity should correspond to the maximum temperature line on
Fig. 28. The maximum response for the cell closely approximates
the 2000-3000°K black body curve, and this will be used for design.
The responsivity given by this curve must be corrected for those
parameters differing from the standard conditions, for example, the
time constant, cell area, and cell resistance. Typical correction
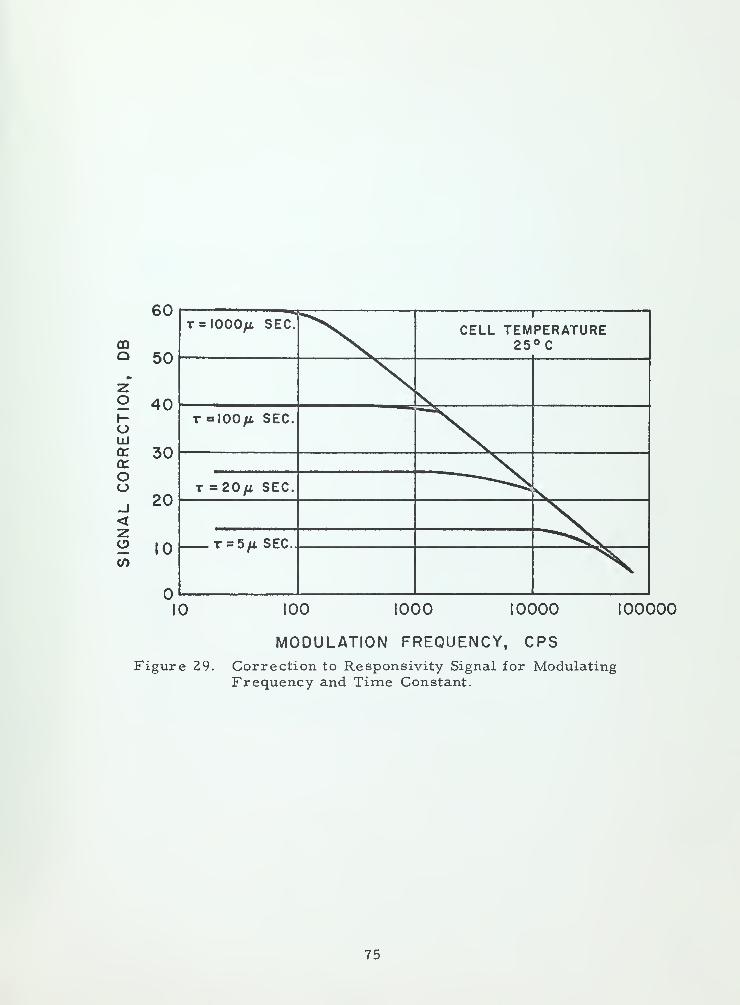
curves are shown in Figs. 29 and 30. Evaluating the following
expression,
R(db) = R . , , + AR , , + AR ..x
' standard time const cell area resistance
yields a cell responsivity of
R(db) = 40+15 + 5 = 60 db/microwatt
which is
R = 1000 volts/watt
For the selected design radiation signal of Fig. 24, a signal level of
approximately 100 to 1000 microvolts is predicted for the detector
output.
This signal must be amplified and transmitted to the end device.
The amplifier should have a bandwidth from 0-50 kilocycles and
amplify the microvolt signal to an acceptable level for coaxial cable
transmission. An oscilloscope, such as the Tektronix 535, should
serve quite satisfactorily as an end device, with the addition of a
Land Camera, to record the output trace.
A most critical problem will be the prevention of stray pickup
by the transmission leads and by the circuitry within the shock tube
37


instrument housing. Radiation from the stray electromagnetic fields
will be quite extensive. The 25-kilovolt discharge in the shock tube
and the intense magnetic field from the nose coil and the associated
leads will generate a great deal of this spurious radiation. To shield
the oscilloscope, it will be placed in a copper screen room about
20 feet from the shock tube. The detector -amplifier unit will be
enclosed in the copper housing which leaves only the coaxial cable
lead from the housing as a source of stray pickup. The use of a
differential amplifier at the oscilloscope will minimize the effect
of this stray pickup. Elementary tests should be conducted to
determine whether or not additional shielding is required.
The amplifier unit should have a high input impedance matching
the detector cell resistance. An amplifier gain of approximately
1500 should be ample. Power supply space is extremely critical
and the unde sir ability of operating the amplifier with a remote
supply, due to stray pickup, suggests the use of transistors. The
direct-coupled amplifier design in Fig. 31 with a grounded collector
input stage should prove to be adequate.
38


7. Calibration.
The analysis of the preceding sections suggests that the magnitude
accuracy of the measured heat transfer rate will be somewhat in doubt.
The transmission path attenuation values, expected cell and interference
filter performance and many other factors were estimated as closely as
possible, but to measure the heat transfer rate quantitatively, it
becomes necessary to devise a means of calibrating the system. The
most obvious method is to subject the film to an electrical energy input
that dynamically simulates the heat energy input of the shock tube tests,
and record the detection system response. The joule heating of the
gold film will simulate the heat flux and it should be possible to record
various readings for various magnitudes and durations of current pulses
through the film. The peak current required for the 5000 A thick gold
film appears excessive for usual methods of current pulsing, due to the
low resistance offered by the film. Extrapolating the findings of
Holland, [24J it is expected that for film thicknesses somewhat greater
o
than 1000 A, the bulk resistivity for gold is valid. From the resistance
relationship,
R = P aohms
and assuming a square film, 0.38 centimeter on a side, the resistance
-2is found to be approximately 5x10 ohms.
Simulating a heat transfer rate of 5000 Btu/sec-ft would require
650 watts of power or about 115 amperes discharged through the film
for the desired time interval. The difficulty in controlling this magni-
tude of current gives rise to the undesirable, but perhaps necessary,
alternative of calibrating the system with a thinner film, and then
replacing the 5000 A film for measurements. High currents of long
39


time duration would very likely physically destroy the film, or arc
over at the contacts, preventing dissipation of the desired energy input.
Hot spots would probably disturb the homogeneity of the film surface
and destroy the infrared opacity. Based on values reported by Holland,
o
a 100 A thick gold film will have a resistance of approximately 40 ohms.
Calibrating with this film will permit dynamic heating of a foil to the
expected experimental temperatures with a current of about three to
o
four amperes. The radiation given off by the 100 A film should closely
o
approximate that energy emitted by the 5000 A film. Interchanging the
film- substrate configuration for calibration purposes will undoubtedly
lead to a variation in transmission path efficiency, due to physical
differences in the interfaces between the gold film and the substrate,
and between the substrate and the sapphire light tube. Also the physi-
cal properties of the quartz substrates may not be identical.
However, a calibration would seem of interest even if the accuracyo
is only within 50 per cent of the true value. The 100 A film can be
pulsed for a desired time interval with various current magnitudes
corresponding to different heat transfer rates. Equating the joule
heating rate to the heat transfer rate,
IZ R = qA
the magnitude of the current pulse in terms of time and heat transfer
rate can be determined by
i(q> t) = 4qA
RTqTiyamPeres
40


where
R = R (HaAT)o x '
a = thermal coefficient of
resistivity
It is desired to express the change in temperature in the expression
above as a function of time. For very thin films, as shown in Sect. 3
and elsewhere, (25J the temperature change of the film can be expressed
as,
0(x, t) = AT(x, t) =Zq
- jT for x =
^cppk'
where the physical properties are those of quartz.
A T(0, t) = 8.5 qft" (°K)
then
I(q, t) = \jr1 (1 + 8.5aqfT)"l/2 ampR
o
er es
Assuming the bulk value for the thermal coefficient of resistivity is
valid, the current pulses corresponding to different heat transfer rates
for a film resistance of 100 ohms are plotted in Fig. 32. This indicates
that a current supply network capable of one to five ampere pulses,
with a duration of 15 to 40 microseconds, should prove adequate for
heat transfer rates of interest. Average current values will be used
here approximating the actual curves of Fig. 32.
In order to handle the magnitude of currents required in the
desired time duration, the use of electronic switching is suggested.
Thyratrons with the required current carrying capacity such as
type 3D22A can be utilized as switches. In order to supply this
41


current, conventional power supplies of milliampere capacity will not
suffice. It seems logical to store the required charge on a high voltage
capacitor. The circuit shown in Fig. 33 was suggested by the authors
and appears to meet the requirements. The two thyratrons are nor-
mally off, with the control grids held negative by the grid bias. The
capacitor, C , is charged to the desired plate voltage, with the
switch in position No. 1. When the capacitor has been charged, the
switch is shifted to position No. 2, the desired current magnitude set
up by means of the potentiometer, R , and the pulse duration, At,ir
selected on the pulse generator and delay network. When the pulse
generator is triggered, pulse No. 1 turns thyratron No. 1 on, per-
mitting current to flow through the gold film. Pulse No. 2 turns
thyratron No. 2 on after the desired pulse duration, and shorts the
potentiometer and gold film to ground.
However, experimental determination of the conductivity charac-
teristics of the 100 A thick film should be made prior to actually
pulsing the film. The conductivity of the film should be investigated
over the temperature range of interest, and the values obtained used
to determine current pulse characteristics such as those shown in
Fig. 32. When this has been accomplished, then the actual calibration
can take place, utilizing the described network.
Other means of calibration that could be investigated are:
(1) Heating a film on a separate substrate, and then placing the
configuration in contact with the sapphire rod
(2) Alternating current joule heating
(3) Ignitron current pulsing.
42


Suggestions 1 and 2 are static methods, but would seem simple to
perform, and could give quite accurate calibration for known film
temperatures. A thermocouple could be utilized to provide precise
film temperature measurements at the time of calibration.
o
Method 3 offers the hope of dynamic calibration of the 5000 A
film with electronic control. However, as stated previously, whether
or not the film can physically withstand current pulses of the required
magnitude remains to be determined.
43


8. Conclusions.
It is concluded from this analysis that the proposed infrared
system will be capable of measuring stagnation point heat transfer
rates on test bodies subjected to simulated space flight conditions
in an electromagnetic shock tube. The ultimate design consists of
a thin metallic film evaporated on a quartz window. Radiation
through the quartz window is transmitted via a sapphire light pipe
to a sensitive lead sulphide detector cell. The output of the cell is
amplified and observed on a conventional oscilloscope.
It was found that optimum system performance will be achieved by
(1) Use of a gold film evaporated on a fused quartz substrate
(2) A film thickness of 5000 A
(3) A sapphire light pipe as a most efficient means of energy
transmission in the near infrared spectrum
(4) Selection of a lead sulphide cell
(5) Choosing a spectral bandwidth of 0.4 micron centered at a
wave length of approximately 2.8 microns
(6) An interference filter to limit the lower wave length energy
striking the detector cell
(7) Electromagnetic shielding of all electrical circuitry.
The apparatus will be useable under the ionized flow conditions
in which present resistance film gages are inoperative. It is believed
that heat transfer rates of approximately 2000 to 35,000 Btu/ft -sec
can be measured within the 15 to 40 microsecond observation periods.
The upper value is limited by the melting temperature of the gold film
or the detector cell time constant. The lower limit is the minimum
44


heat transfer rate which will produce a detectable film temperature
within the maximum available test time.
The accuracy of the absolute heat transfer rate measurement will
be somewhat doubtful, until a more appropriate means of calibration is
devised. The proposed method should suffice for preliminary experi-
mentation and relative measurements, but more precise calibration of
the apparatus will be of future value. Further calibration studies
should be undertaken to achieve the ultimate system capability.
Investigation of the following subjects of current interest could be
undertaken with this apparatus.
(1) Radiative, convective, and recombination heat transfer
to bodies in hypersonic flow
(2) Effect of magnetic fields on radiative, convective, and
recombination heat transfer rates.
The system will be assembled and ready for experimental work
during the summer of 1959. Experimental difficulties remain to be
found and remedied, but it is believed no major problem should arise.
The first application of the apparatus will be to verify the theoretical
work done in magnetoaerodynamic cooling. The successful completion
of this experimental work should greatly contribute to future space
vehicle design and performance.
45


References.
1. R. C. Meyer, On Reducing Aerodynamic Heat Transfer Ratesby Magnetohydrodynamic Techniques, Preprint No. 816,Institute of the Aeronautical Sciences, January, 1958.
2. W. B. Bush, Unpublished Note on Magnetohydrodynamic-Hyper sonic Flow Past a Blunt Body, Space TechnologyLaboratories, Note PRL-9-07, February 4, 1959-
3. R. W. Ziemer and W. B. Bush, Magnetic Field Effects onBow Shock Stand-off Distance, Physical Review Letters,vol. 1, no. 2, July 15, 1958.
4. R. J. Vidal, Model Instrumentation Techniques for HeatTransfer and Force Measurements in a Hypersonic ShockTunnel, Report AD-91 7-A- 1 , Cornell AeronauticalLaboratory, Inc., Buffalo, New York, February, 1956.
5. F. S. Harris, Jr. , Measurement of Temperature in
Explosives, Explosives Research Group, University of
Utah, Salt Lake City, Utah, August, 1953.
6. E. B. Mayfield, Four-Color Radiometric Temperature of
Hypervelocity Projectiles, paper presented at 1958 SummerMeeting in the West of the American Physical Society at
Vancouver, British Columbia, August, 1958.
7. Infratron Lead Sulphide Photoconductor s, Brochure, InfraredIndustries, Inc. , Waltham, Massachusetts, September, 1958.
8. T. Wentink, Jr. , W. Planet, P. Hammerling, and B. Kivel,
Infrared Continuum Radiation from High- Temperature Air,Journal of Applied Physics, vol. 29, April, 1958.
9. R. W. Ziemer, An Electromagnetic Shock Tube forAerodynamic Research, Space Technology Laboratories,Report GM-TR-0127-00419, June, 1958.
10. E. B. Turner, Description of the Revolving Mirror StreakCamera Built by the Aeronautical Research Laboratory,The Ramo- Wooldridge Corporation, Report ARL-7-40,September, 1957.
11. F. R. Gilmore, Equilibrium Composition and ThermodynamicProperties of Air to 24,000°K, Rand Corporation, ReportRM-1543, August, 1955.
12. R. W. Detra, N. H. Kemp, and F. R. Riddell, Addendum to
Heat Transfer to Satellite Vehicles Re-entering theAtmosphere, Jet Propulsion, vol. 27, no. 11, December,1957.
46


13. R. E. Meyerott, Radiation Heat Transfer to HypersonicVehicles, Lockheed Aircraft Corporation, Missile SystemsDivision, Report LMSD-2264-R1 , September, 1958.
14. O. S. Heavens, Optical Properties of Thin Solid Films,p. 55, Academic Press, Inc. , New York, New York, 1955.
15. Fused Quartz Catalog, No. Q6, General Electric Company,1957.
16. R. V. Churchill, Modern Operational Mathematics inEngineering, McGraw-Hill Book Company, 1944.
17. P. H. Rose, Development of the Calorimeter Heat TransferGage for Use in Shock Tubes, Avco Research Laboratory,RR-17, pp. 34-37.
18. A. Erdelyi, W. Magnus, F. Oberhettinger and F. G. Tricomi,Table of Integral Transforms, vol. I, p. 246, McGraw Hill
Book Company, Inc. , New York, New York, 1954.
19- Rose, pp. 38-41.
20. Sapphire Rod as a Radiation Pipe, Linde Air ProductsCompany, Bulletin No. 4, New York, New York, January,1957.
21. P.J. Klass, Infrared Revival Challenges Radar, AviationWeek, Reprint, McGraw-Hill Publishing Company, Inc. ,
1957.
ZZ. R. C. Jones, Performance of Detectors for Visible andInfrared Radiation, Advances in Electronics, vol. V,
pp. 67-68, Academic Press, Inc. , New York, New York.
23. E. A. Guillemin, Communication Networks, vol. II, p. 468,John Wiley and Sons, Inc. , New York, New York, 1935.
24. L. Holland, Vacuum Deposition of Thin Films, pp. 232-239,John Wiley and Sons, Inc. , New York, New York, 1956.
25 J. Rabinowicz, M. E. Jessey and C. A. Bartsch, ResistanceThermometer for Heat Transfer Measurement in a ShockTube, GALCIT, Memo. 33, July 2, 1956.
47


Figure 1. An Electromagnetic Shock Tube in Operation.
48


MAGNETIC COIL
3 ID. PYREX PIPE
RING ELECTRODE
6 RETURN STRAPS
25-30KV
MELAMINEINSULATOR
NITROGENLINE
CERAMIC INSULATOR15 KV TRIGGER
Figure 2. Details of the Shock Tube with the TestModel Installed.
49


10-92
in
tr
<
OLLU
10
10
10
I I
MAX. ALLOWABLE NEP
-II
- ^"^
Xc= 3.0 TO 3.2 fi
(30%, OF PEA K)\
-10
—
-9
—
STANDARD CONDITIONS
CELL AREA = 1 MM x 1 MM- MOD. FREQ.* 1000 CPS- BANDWIDTH = 5 CPS" OPERATING TEMP. * 25°
-8111
I \12 3 4
SPECTRAL RESPONSE (MICRONS)
Figure 3. Typical Spectral Response of a Lead SulphideCell (noise-equivalent-power).
50


>-
> K.
"*-v»
ZKOtt W
Ul
aa << _l
IS>
iSt
(D
O
abl
»S< UJ
Z >— Xou
u
3 -J* <"1
a- Ul
£ o •-^1 M —o
o * a
ui
K Ul
>
s£w>j
=S2
*< KU. O4.t— o1 <
< »5
*1
<>
-aart
<u
ui
^u al
CO
a.
<a) i—i
<-W cO <L»
£ s•rH
rd J-
u <u
Cut) 0*«J X•Hn W
T3
go
71 en
CO <
a)
H3
•r-i
51


SHOCK WAVE
a. =
TU2
T,
u. C
Stationary Model Coordinate System
^s-U-2
f>9 » V P 2
IX,u. = a,
p,.vt
, C
Moving Model Coordinate System
Figure 5. Shock Wave Coordinate Relationshipswithin the Shock Tube.
52


SHOCK WAVE
u, =
TU2
T,
u. C
Stationary Model Coordinate System
u s -a 2
Po »T2> P 2
u.,u. = u,
pl-'l
'T
l C
Moving Model Coordinate System
Figure 5. Shock Wave Coordinate Relationshipswithin the Shock Tube.
52


.008
o?
«? .006
l-<or
>•
co .004zUJQ
<UJOT
CO
UJUJor
.002
>/ FREE STREAM <
N. FREE STREAM DENSITY RATIO
40000
'tLUtll T qUl
30000 wh-U.
oo
20000 u
<UJorI-
1 0000 £u.
20 30
SHOCK MACH NUMBER
40
Figure 6. Free Stream Density Ratio and Free StreamVelocity in the Shock Tube.
53


16000
20 30 40
SHOCK MACH NUMBER
Figure 7. Predicted Heat Transfer Rates,
54


40
i
2o
Z<</>
OozoHQ.a:o</>
CD<
30
20
10
2 3 4
WAVELENGTH, IWCRONS5
Figure 8. Spectral Absorption Coefficient for Gold.
55


crUJ
oQ.
QUJ
<
(ZUJ
o
OUJ
UJ
h-
<
COh-
<
2000 3000 4000 5000 6000
FILM THICKNESS, ANGSTROMS
Figure 9. Ratio of Emitted Energy to Transmitted Energy,W /W\, for Various Film Thicknesses.
£ t
56


»»1
1
fc-
1 0(x,t)
»»
v „l
X
»- A
1
1
Figure 10. Heat Flow in a Semi -Infinite Slab.
57


10
10"
o
OLlJ
3fe
10-3
10-4
10-5
t = I00/x SEC.
\. \
t=35/a SEC.
T=I0 /i SEC.
t= 1 p SEC.^^^ \ \
—
1
I0"6 I0"5 !0~4
DEPTH, FEET
r3 !0"2
Figure 11. Temperature -Time Profile in a Semi-Infinite Slab.
58


CD
oUJ
*
1000
TIME, MICROSECONDSFigure 12. Outer Surface Temperature for a Semi-Infinite
Slab as a Function of Time.
*•
»»
*- % (x,t) ^2 (X,t)
*- X
te-x
l
X2
Figure 13. Heat Flow Through a Parallel Wall Slab.
59


800
>t 700
UJ
UJo
LUtr
id
<<rUJ0.
5UJ
r 600
500
400
300» 10 20 30 40
TIME, MICROSECONDS
Figure 14. Interface Temperature- Time Relationships.
50
60


GOLD FILM QUARTZ SAPPHIRE ROD
V = INDEX OF REFRACTION
<f>= ANGLE OF TOTAL REFLECTION
Figure 15. Schematic Diagram of Light Tube Transmission System.
61


V)UJz
UJ
CJ
UJoo
a.cc
oenCD<
WAVELENGTH, MICRONS
Figure 16. Sapphire Spectral AbsorptionCoefficient.
62


100
2UJocrUJQ.
>"ozUJ
oU-u.UJ
o</>
:£
<or
80
60
40
20
^
14 6
WAVELENGTH* MICRONS
Figure 17. Transmission Efficiency of aSapphire Light Pipe.
63


OUTPUT TORECORDER
INSTRUMENTATIONHOUSING
LEADS
TO VACUUMPUMP
COPPER HOUSING
GOLD FILM
DETECTOR CELL
INTERFERENCEFILTER
SUBSTRATE
Figure 18. Detailed System Assembly.
64


D=.I50
<£ MAGNETIC LINESOF FLUX
GOLD FILM
EDDY CURRENTS
ELEMENT OF INTEGRATION
Figure 19. Eddy Current Heating Considerations.
65


I0«
COH<
a:UJ
o
<
trUJ
o
ozoore>
u<00
12 3 4
WAVELENGTH, MICRONS
Figure 20. Ratio of Emitted Power to Extraneous PowerIncident on the Detector Cell.
66


60
zO<rhia.
zoCOCO
COz<
50
40 -
30
20
2.0 2.2 2.4 2.6 2.8
WAVELENGTH, MICRONS
Figure 21. Desired Interference Filter Characteristics.
67


I0 4
<
q:
O
<
a:Id
o
QzOa:e>:*:
o<
10
o-»
/x = 2.8/a
300 400 500 600 700
TEMPERATURE, DEG KELVIN
Figure 22. Ratio of Emitted Power to Extraneous PowerIncident on the Detector Cell at a Wave Lengthof 2.8 Microns.
68


COh-
<
Ou
en
o
10 20 30 40
TIME, MICROSECONDS
Figure 23. Incident Signal Power on the Detector Cellas a Function of Time and Heat TransferRate.
69


I-
<
Oo
q:uJ
O0.
10 20 30 40 50
TIME, MICROSECONDS
Figure 24. Approximating the Incident Power Relationship.
70


>
uzUJ3oUJ<ru.
oo
£
•3
cr
0)
(0
oa,CO
0)
oav
cr1
u0)
s<
OCVJ
o oI
o00
I
81381030 1VN9IS
LT)
m
•1-1
71


CO
<
Oq:u
trUJ
oQ.
t -\fi SEC.
t = 5/i. SEC.
t= lO/i SEC.
20 30 40
TIME, MICROSECONDS
Figure 26. Detector Cell Time Constant Response,
72

I

sw^
R<
—E^y^cB
—
NFRARED DETECTOR
*|l|l
OUT
< i o
b —
Series Circuit
sw
DETECTOR j>|R c
Li!
oo:
it
_ior
oor
CMII
_l
or e OUT
t
Bridge Circuit
Figure 27. Two Possible Detector Cell Circuits.
73


*GOQ
<Z<£
CO
100
80
60
40
20
-20
-40
STANDARD CONDITIONS
1. MODULATION FREQUENCY- 90CPS2. CELL TIME CONSTANT- \p SEC.
3. CELL AREA -I CM X ICM
4. CELL TEMPERATURE 25°
* REFERENCE LEVEL -I /x WATT
.01 0.1 1.0 10 100
MICROWATTS, RMS
Figure 28. Typical Lead Sulphide Cell Responsivity Characteristics.
74

COO
60
50
2 40HOLJo: 30cc
oo. 20
<£ 10
t = 1000/1 SEC.I
CELL TEMPERATURE25°C
t=I00/a SEC.
^T=20^i SEC.
\T=5/i SEC. ~-^s
^"v
10 100 1000 10000 100000
MODULATION FREQUENCY, CPSFigure 29. Correction to Responsivity Signal for Modulating
Frequency and Time Constant.
75


CDO
zoh-oLU(Toroo
<z
60
40
20
20
40
to -60
-80
^^"L =0.01 CM
""" ^^^^-*"l = o.i Z\A^^ ^^^^
^*^L = 0.5£M^^
^^-^L = 5.0 CM
""
.001 .01 0.1 1.0
CELL RESISTANCE, MEGOHMS
10
Figure 30. Correction to Responsivity Signal for Cell Areaand Cell Resistance.
76


p-n-p p-n-p n-p-n
e,M?
OUT
Figure 31. Direct- Coupled Transistor Amplifier.
77


4.0
3.0
if)
UJccUJQ.
- 2.0
zUJccct
o
q<v-•BTUFT 2-SEC.
q = 10000
q = 7500
q = 5000
q = 2500
q= 1000
10 20 30 40
TIME, MICROSECONDS
50
Figure 32. Calibration Current Pulse Requirements.
78


PULSEGENERATOR
ANDTIME DELAY
L
PULSE #Z \ * PULSE *l
PULSE #l
3D22A
3D22A
O < I
PULSE *2 I •
RADIANT
ENERGY
swo o-
Cc^H. V.
POWERSUPPLY
U_h_
GOLD FILMR
OSCILLOSCOPE
Figure 33. Proposed Calibration Circuit.
79


BIBLIOGRAPHY
R. G. Breckenridge, B. R. Russell and E. E. Hahn, Photoconductivity-Conference, held at Atlantic City, November, 1954, John Wiley andSons, Inc. , New York, New York, 1956.
E. R. G. Eckert, Introduction to the Transfer of Heat and Mass,McGraw-Hill Book Company, Inc. , New York, New York, 1950.
J. A. Fay and F. R. Riddell, Theory of Stagnation Point Heat Transferin Dissociated Air, Avco Research Laboratory, ,RR- 18, June, 1956(revised April, 1957).
Saul Feldman, Hypersonic Gas Dynamic Charts for Equilibrium Air,Avco Research Laboratory, January, 1957.
N. H. Kemp and F. R. Riddell, Heat Transfer to Satellite VehiclesRe-entering the Atmosphere, Jet Propulsion, vol. 27, no. 2, part 1,
p. 132, February, 1957.
J. F. Kinnard, Applied Electrical Measurements, John Wiley and Sons,Inc. , New York, New York, 1956.
R. K. M. Landshoff, Magnetohydrodynamics, Stanford University Press,Stanford, California, 1957.
R. K. M. Landshoff, The Plasma in a Magnetic Field, StanfordUniversity Press, Stanford, California, 1958.
H. W. Liepmann and A. E. Puckett, Introduction to Aerodynamics of aCompressible Fluid, John Wiley and Sons, Inc. , New York, New York,1947.
W. H. McAdams, Heat Transmission, Third Edition, McGraw-HillBook Company, Inc. , New York, New York, 1954.
H. O McMahon, Thermal Radiation from Partially TransparentReflecting Bodies, Journal of the Optical Society of America, vol. 40,
no. 6, June, 1950.
H. T. Nagamatsu and R. E. Geiger, A Fast Response Device for
Measuring Heat Transfer, General Engineering Laboratory,Schenectady, New York, May, 1957.
J. P. Raizer, On the Brightness of Strong Shock Waves in Air, SovietPhysics JETP, vol. 6, no. 1, January, 1958.
P. H. Rose and W. I. Stark, Stagnation Point Heat TransferMeasurements in Dissociated Air, Avco Research Laboratory,RR-24, revised April, 1957.
80


BIBLIOGRAPHY (Continued)
W. R. Sears, General Theory of High Speed Aerodynamics, HighSpeed Aerodynamics and Jet Propulsion, vol. 6, Princeton UniversityPress, Princeton, New Jersey, 1954.
A. H. Shapiro, The Dynamics and Thermodynamics of CompressibleFluid Flow, vol. 1, Ronald Press Company, New York, New York,1953.
R. F. Shea, Principles of Transistor Circuits, John Wiley and Sons,Inc. , New York, New York, 1953.
W. E. Smith and R. J. Vidal, Some Problems Associated withInstrumenting Shock Tubes for Hypersonic Research, paper presentedat ARS meeting in Buffalo, New York, September, 1956.
J. Strong, Procedures in Experimental Physics, Prentice- Hall, Inc. ,
New York, New York, 1938.
F. E. Terman, Radio Engineering, Third Edition, McGraw-HillBook Company, Inc. , New York, New York, 1947.
81

a


thesP486
Design of an infrared system for measun
3 2768 001 97890 1
DUDLEY KNOX LIBRARY
.
ilplIIWriliffiISSSIi
'),.:'
mMmtt
illlilllii^l 1'
''-'
''
Mmm|
tljjffejff
RK
II
1
.
II
H'mtiMMfmBfhtliffSSI
'(;''
SllillirNuWHlllflnrH Wli\\\
'i'I * ' ' \l\W\ !m •"
i
:T i
';
i' Unl fiMjt
,
..
iliiiiiilzlMliltiiulIti
Wilil
rtil Iff
fltimf
Sldl
•r' IP'iiiwill'Ii
iiiiwiifiii
iltffir
IIUntil
11il1fllw'* t
: ''•.'* {> ''-*l*
it li