design of an electrochemical cell cytosensor · design of an electrochemical cell cytosensor mario...
TRANSCRIPT

Design of an Electrochemical Cell Cytosensor
by
Mario Moscovici
A thesis submitted in conformity with the requirements for the degree of Masters of Applied Science
The Institute of Biomaterials and Biomedical Engineering University of Toronto
© Copyright by Mario Moscovici 2012

ii
Design of an Electrochemical Cell Cytosensor
Mario Moscovici
Masters of Applied Science
The Institute of Biomaterials and Biomedical Engineering
University of Toronto
2012
Abstract
A sensitive and simple cell counting method is necessary in many pathologies including HIV [1]
and cancer [2]. Cell counting sensors are used in the clinic for diagnosis of leukemia [3] or HIV
[4]. Furthermore, genetic analysis of these cells is crucial for better prognosis and diagnosis [5].
However, a simple method for cell counting that allows further analysis is still lacking. This
study aims to design a sensor that counts cells in the complex matrix of cell media or in the
presence of non-target cells. The chip designed uses the anti-EpCAM antibody to selectively
count cells via differential pulse voltammetry. The device can selectively count prostate cancer
cells in both complex media with serum and a mixed cell population with a sensitivity of 125
cells per sensor. A simple and sensitive cell cytosensor was designed that can be used to count
cancer cells effectively.

iii
Acknowledgments
First I would like to thank Dr. Shana O. Kelley, my thesis supervisor for her continuous support
and guidance throughout this project. Dr. Kelley has opened the world of research to me and
provided countless ideas throughout the project. It was an unparalleled learning experience and
one that I will not forget.
I would like to thank all of the Kelley Lab members for their support and encouragement
throughout my Master’s degree. Every single one of the Kelley Lab members has helped my
project in a way: through training, moral support and experiment planning. I would like to
specifically mention Brian Lam and Justin Besant for their help with microfabrication and device
design; as well as Alya Bhimji and Dr. Ludovic Live for their continuous help with assay
development and chemical work. I would also like to thank Dr. Jagotamoy Das for introducing
me to electrochemical sensors and getting me started with the project. I would also like to thank
Andrew Sage for proof reading and organization help for this thesis.
I would also like to thank my committee members: Dr. Christopher Yip, Dr. Craig Simmons and
Dr. Ted Sargent for their feedback and guidance with the project.
Finally, I would like to thank my parents Doru and Violet Moscovici for their encouragement
and moral support – for always being there throughout my undergraduate and graduate studies. I
would also like to thank my friends Aaron Rosen, Salva Sadeghi and Simon Sharon Gordon for
constant encouragement and providing motivation during the project. Lastly, I would like to
thank Nika Shakiba for providing constant positivity and showing me support throughout my
Master’s experience.

iv
Table of Contents
Acknowledgments .......................................................................................................................... iii
Table of Contents ........................................................................................................................... iv
List of Figures ............................................................................................................................... vii
List of Appendices .......................................................................................................................... x
List of Equations ............................................................................................................................ xi
List of Terms ................................................................................................................................. xii
Introduction ................................................................................................................................ 1 1
1.1 Cell counting ....................................................................................................................... 1
1.2 Electrochemical Counting of Biological Particles .............................................................. 4
1.3 Electrochemical Methods and Diagnostic applications ...................................................... 4
1.4 Immobilization of antibodies on a gold surfaces ................................................................ 8
1.5 Antibody conjugation methods to gold surfaces ............................................................... 10
1.5.1 Physisorption ......................................................................................................... 10
1.5.2 Glutaraldehyde coupling ....................................................................................... 10
1.5.3 NHS/EDC chemistry ............................................................................................. 11
1.5.4 Streptavidin-biotin link ......................................................................................... 12
1.5.5 Antibody Reduction .............................................................................................. 14
1.6 The blocking assay methodology ...................................................................................... 14
1.7 Project Summary ............................................................................................................... 16
Thesis Objectives ..................................................................................................................... 17 2
Experimental Methods ............................................................................................................. 18 3
3.1 Cell Culture and Sample Preparation ................................................................................ 18
3.2 EpCAM antibody conjugation to the gold surface ........................................................... 18
3.3 EpCAM Detection Assay .................................................................................................. 19

v
3.4 Cell Counting using macro-electrodes .............................................................................. 19
3.5 Sensor Design and Microfabrication ................................................................................ 20
3.6 Sensor Monolayer formation ............................................................................................ 22
3.7 Counting Cells with Fabricated sensor ............................................................................. 22
Results ...................................................................................................................................... 24 4
4.1 EpCAM detection Assay ................................................................................................... 24
4.2 Cell Counting Using Macro-Electrodes ............................................................................ 24
4.3 Sensor Design and Microfabrication ................................................................................ 26
4.4 Sensor Monolayer Formation ........................................................................................... 29
4.5 Counting Cells with Fabricated Sensor ............................................................................. 30
4.6 Important parameters for electrochemical cell sensors ..................................................... 32
4.6.1 Aperture Size ........................................................................................................ 32
4.6.2 Concentration of Ferrocyanide and Ferricyanide ................................................. 34
4.6.3 Sample Incubation Time ....................................................................................... 35
4.7 Assay Duration and Sensor Storage .................................................................................. 36
4.8 Counting Cells in Complex Samples ................................................................................ 37
4.8.1 Counting Cells in Media ....................................................................................... 37
4.8.2 Counting mixtures of target and non-target cells .................................................. 38
Discussion ................................................................................................................................ 40 5
5.1 EpCAM detection Assay ................................................................................................... 40
5.2 Cell Counting Using Macro-Electrodes ............................................................................ 40
5.3 Sensor Design and Microfabrication ................................................................................ 41
5.4 Sensor Monolayer Formation ........................................................................................... 42
5.5 Counting Cells with Fabricated Sensor ............................................................................. 43
5.6 Important design parameters for electrochemical cell sensors ......................................... 43
5.6.1 Aperture Size ........................................................................................................ 43

vi
5.6.2 Concentration of Ferrocyanide and Ferricyanide ................................................. 45
5.6.3 Sample Incubation Time ....................................................................................... 45
5.7 Assay Duration and Sensor Storage .................................................................................. 45
5.8 Counting Cells in Complex Samples ................................................................................ 46
Conclusions and Future Directions .......................................................................................... 47 6
Bibliography ................................................................................................................................. 48
Appendix A: Kelley Laboratory electrochemical chip ................................................................. 55
Appendix B: List of materials and chemicals used……………………………….……………...56

vii
List of Figures
Figure 1: (a) Hemocytometer from Reichert (b) the hemocytometer grid under 10X
magnification (photo credit: Jeffrey M. Vinocur) ........................................................................... 1
Figure 2: Buffy coat counter for complete blood count [12]. ........................................................ 2
Figure 3: Schematic of an operational flow cytometer [12]. ......................................................... 3
Figure 4: Schematic of a Pt/HBr|AgBr/Ag electrode [27] ............................................................. 6
Figure 5: Current vs. voltage for Pt/H|AgBr/Ag electrode [27]. ................................................... 6
Figure 6: Voltage applied during a typical DPV scan [30]. ........................................................... 7
Figure 7: Peak current response due to applied voltage (shown in Figure 6) for DPV [27]. ....... 8
Figure 8: The structure of a typical antibody where C refers to constant regions and V refers to
variable regions. .............................................................................................................................. 9
Figure 9: Schematic of the glutaraldehyde coupling reaction. .................................................... 11
Figure 10: Complete reaction for EDC/NHS chemistry for biomolecule coupling [39] ............. 11
Figure 11: chemical formulas for (a) mercaptopropioic acid (MPA) and (b) mercaptohexanoic
acid. ............................................................................................................................................... 12
Figure 12: Schematic of the chemistry of biotin-streptavidin interaction. .................................. 13
Figure 13: Blocking assay schematic, showing the physical blocking of ferrocyanide and
ferricyanide from the surface when the antigen binds to the antibody. The physical blocking of
the surface causes an overall current decrease, which is measurable using a potentiostat. .......... 15
Figure 14: Schematic of cell cytosensor device where the attachment of a target cell blocks the
gold surface, reducing the overall current that is produced. ......................................................... 16
Figure 15: Schematic of the fabrication protocol for the cell counting chip; step are shown from
chip side view – i.e. along the chip’s thickness. ........................................................................... 21

viii
Figure 16: Top – Experimental setup for the cell count sensor; bottom – close-up of
experimental setup, including (a) PCB board seen in Figure 20.a; (b) PCB board seen in Figure
20; (c) Cell count chip; (d) BaSI potentiostat; (e) Reference electrode; (f) Platinum wire; and (g)
Scanning solution. ......................................................................................................................... 23
Figure 17: EpCAM antigen detection results. Error bars represent ± standard deviation, n=5. .. 24
Figure 18: DU-145 cell counting using the blocking assay methodology. (a) % current change
vs. cell concentration. (b) Visual cell counts using microscope. Error bars are ± standard
deviation, n=9. .............................................................................................................................. 25
Figure 19: (a) Isometric view of the cell counting chip. (b) Top view of the cell counting chip.
(c) AutoCAD schematic of chip. .................................................................................................. 27
Figure 20: (a) PCB board for easy connection to each individual lead (b) PCB connector for
chip. ............................................................................................................................................... 27
Figure 21: A microscopic image (10X magnification) of the gold electrodes defined by the
yellow colour and the SU-8 apertures defined by the circle on the gold electrodes. Scale bar is
300μm ........................................................................................................................................... 28
Figure 22: Peak current from DPV method after every reaction step in the antibody conjugation
method. Error bars represent ± standard deviation, n=6. Numbers in brackets signify the step
number. ......................................................................................................................................... 29
Figure 23: Image at 10X magnification of cells bound to the gold surface; 150μm aperture
device. Scale bar is 300μm. .......................................................................................................... 30
Figure 24: Cell counting experiment. (a) Current change per electrode vs. cell number present
on electrode. (b) Total cell count added to the chip vs. cell concentration added per sensor. (c)
Total signal for the chip vs. cell concentration added per sensor. Error bars represent ± standard
error of the mean, n=4. Aperture size is 150μm. .......................................................................... 31
Figure 25: Microscopic images (10X magnification) with target cells bound with (a) 300μm, (b)
150μm and (c) 50μm aperture size. Scale bar is 300μm. .............................................................. 32

ix
Figure 27: Graphical representation of the calculated: (a) limit of detection for the sensor vs.
aperture size of the sensor and (b) range – 0 to maximum number of cells that can be counted vs.
aperture size of the sensor. ............................................................................................................ 34
Figure 28: Solution concentration effect on signal per gold electrode. (a) 200μM, (b) 2mM, (c)
20mM and (d) 200mM ferrocyanide and ferricyanide. Error bars represent ± standard error of the
mean, n=6. Aperture size is 50μm. ............................................................................................... 35
Figure 29: Total signal vs. the incubation time with cells. Blue markers indicate total signal for
target cells (DU145) and red indicates non-target cells (U937), both at 625 total cells in sample
per sensor. Error bars represent ± standard deviation, n=3. .......................................................... 36
Figure 30: Chip storage experiment for a 2 week period. Error bars represent ± standard error of
the mean, n=4. No statistical significance found between chips at different weeks. * shows
statistical significance relative to the negative control. ................................................................ 37
Figure 31: Cell counting experiment in the presence of cell media with 10% FBS, the total
signal vs. cells in sample per sensor is presented. Error bars are ± standard error of the mean,
n=3. ............................................................................................................................................... 38
Figure 32: Cell count experiment with 625 U937 non-target cells as background mixed with
target cells at varying concentrations. (a) The total signal vs. target cell concentration (b) Cell
count using immunohistochemistry procedure described in section 3.7. Error bars in figure show
± standard error of the mean, n=3. ................................................................................................ 39
Figure 33: Prefabricated chip used in Kelley Laboratory [59]. ................................................... 55

x
List of Appendices
Appendix A: Kelley Laboratory electrochemical chip………………………………………….55
Appendix B: List of materials and chemicals used……………………………………………...56

xi
List of Equations
Equation 1: Reduction reaction for AgBr/Ag cell ......................................................................... 5
Equation 2: Oxidation reaction for AgBr/Ag Cell ........................................................................ 5
Equation 3: Percent ΔI calculation where I is the peak DPV current at an electrode and Io is the
average blank DPV current – i.e. background current with no target ........................................... 24
Equation 4: Current change, where I is the peak current at an electrode with cells and Io is the
average blank scan current – i.e. no target .................................................................................... 26

xii
List of Terms
CMOS Complementary metal-oxide-semiconductor is a technology that uses
transistors to build integrated circuits for electronics and biosensors
CTC A Circulating Tumour Cell is a cell that is released from the primary
tumour into the systemic circulation. These cells are thought to
contribute to the metastasis process
CV Cyclic voltammetry, an electrochemical technique that linearly sweeps a
voltage range and is used to measure the output current from a chemical
reaction
DPV Differential pulse voltammetry, an electrochemical technique that applies
a square wave as the input voltage, Figure 6, and measures the output
current as a result of a chemical reaction
EpCAM Epithelial cell adhesion molecule, a surface marker present on most
carcinomas and is thought to be used as a cell-cell adhesion molecule
%ΔI % signal change from a chemical reaction calculated by Equation 3
ΔI Signal change from an electrochemical reaction calculated by Equation 4
LOD The limit of detection is the smallest signal detectable usually defined by
statistical difference between the negative control and the smallest signal
with a confidence interval of three standard deviations
IPA Isopropyl alcohol is a solvent commonly used for cleaning or
disinfection of surfaces from biological agents.

1
Introduction 1
1.1 Cell counting
Traditionally, cell counting has been used both in the research setting and the clinical setting for:
cell culturing, blood pathologies, and immunohistochemistry. For example, one of the most
common clinical tests is the complete blood count (or CBC). Counting the number of blood cells
(red blood cells, T cells, lymphocytes, platelets, etc.) is used to monitor pathologies such as HIV,
where T-cell count is important [4], Leukemia, where red blood cell count can be important [3],
and various other anemias where loss of blood cells is common [6].
The most established and simplest method for cell counting is manual counting using a
hemocytometer (Figure 1). Hemocytometers have a calibrated grid that houses a set volume of
sample. Knowing the volume and counting the cells within the grid manually under the
microscope allows for the determination of the cell concentration. This technique is quite simple
and many patents have been applied to improve on this concept [7], [8].
The concept of the hemocytometer was upgraded to include automated cell counters using image
analysis [9] and even more sophisticated methods using quartz crystals as the sensing platform
[10]. However, these particular methods cannot count specific types of cells, requiring additional
processing using antibody labeling. Furthermore, this method uses small sample sizes (generally
under 10uL), which can make the counting inaccurate for low cell numbers. There has been
some work done to use larger volumes for counting; however, this is not extensively used [11].
Figure 1: (a) Hemocytometer from Reichert (b) the hemocytometer grid under 10X
magnification (photo credit: Jeffrey M. Vinocur)
(a) (b)

2
Currently, there are several common techniques for cell counting that are being used in the
clinic. For high concentrations of cells where very accurate counting is not required a simple
method using a buffy coat density rod is used (Figure 2). A capillary tube that floats in a vial of
blood is used to separate out the white blood cells into layers and the height of the layer is used
to determine the overall cell count within one order of magnitude accuracy [12].
Figure 2: Buffy coat counter for complete blood count [12].
Other common counting techniques involve using a flow cytometer with either a fluorescence or
impedance module as the sensing platform. A flow cytometer is a large apparatus that uses
complex flow mechanisms to direct a cell sample into single file stream of cells for analysis. The
flow cytometer uses forward and side scatter profiles resulting from interactions between passing
cells and lasers to detect the cells. Reflectance, or forward scatter, from the laser can detect the
cell size while refractance, or side scatter, from the laser gives insights into cell morphology. In
addition a flow cytometer also includes lasers at different wavelengths for fluorescence studies
which require antibody or molecular labeling of the cells [12]. An impedance platform can also
detect information about the size and internal morphology of the cells. In the hospital these
machines are used in parallel to perform a complete blood count [12]. The flow cytometer can be
augmented by a platform for cell sorting which allows separation of the different cell types for
further analysis; however, this adds to the complexity of operation and cost of the system.

3
Figure 3: Schematic of an operational flow cytometer [12].
Even though flow cytometery techniques are quite accurate there are a few drawbacks. First, this
equipment requires trained staff and an extensive budget for purchasing and maintenance. In
addition, if a sample is formalin-fixed and permeabilized for fluorescent labeling the genetic
material is lost and cannot be analyzed further. Lastly, flow cytometery cannot accurately count
cells that are infrequently represented in the sample.
Considering the drawbacks of the previous systems there has been much effort in the research
community to design a simple-to-use, cost-efficient, and sensitive cell counter.
Microfluidics has been employed to address this problem through many systems that mimic the
inner workings of the flow cytometer. For example, using a simple and cheap laser system a
microfluidic chip was design to count as few as 100 cells/μL [13],[14]. In an effort to integrate
an on-chip analysis system, CMOS sensors have also been integrated into cell counting chips.
CMOS sensors can detect changes in impedance of the transistor due to attachment of cells onto
the surface [15]. Another class of technologies using electrochemical methods for the purpose of
counting cells will be discussed in more detail in section 1.2. However, all these methods require
relatively pure samples (devoid of proteins or non-target cells), and often require complicated
external measurement devices such as a laser system. Moreover, no system combines cell
counting, analysis and cell culturing on the same platform.

4
1.2 Electrochemical Counting of Biological Particles
Electrochemical methods are an attractive option for biosensors. First, electrochemical methods
are generally label-free; in other words, the sensor does not require secondary antibodies or
tagged molecules, which increases the complexity and cost of the assay. Second, electrochemical
apparatuses are lower in cost compared to a microscope system with fluorescence and a camera.
Lastly, fluorescence methods require an established protocol to be developed, which requires
trained personnel. Therefore many researchers are interested in incorporating electrochemical
methods into various sensors with the obvious success story of the glucose sensor in mind [16].
Most methods that are presented in literature use the impedance spectroscopy method which
measures changes in resistance/impedance as a function of frequency [17]. In order to effectively
use this method in measurements, an empirical circuit model is applied to fit the data measured
using the apparatus. From the measurements a Nyquist plot can be made which shows the real
vs. imaginary part of the impedance; changes in the plot are used in biosensors [18].
Several studies show the detection of bacterial species as a potential detector for contaminated
sources of food or water. For example, E. coli was detected using a secondary antibody for as
low as 600 bacteria per milliliter [19]. Other projects show similar results with E. coli (CGSC
5073 K12) [20], Salmonella (Χ3339) [21] or Staphylococcus aureus (MSSA 476) [22].
Other information can be gained from electrical properties of the cell by applying different
models. Successful monitoring of biological cell cycle growth and identification of the different
cycle phases using electrochemical methods was achieved [23]. Some research has even shown
the monitoring of different differentiation states in messenchymal stem cells [24].
1.3 Electrochemical Methods and Diagnostic applications
Electrochemical methods allow sensing that is mediated by an electrochemical reaction (i.e. the
chemical reaction is coupled by electron transfer to a measurement electrode). There are a few
important differences between electrochemical reporters and other sensors. First, electrochemical
sensors require an active metallic surface that serves as a boundary on which the reaction takes
place. Second, an electrochemical sensor requires a reporter mechanism that converts the

5
molecule in question to an electrical signal. Thirdly, the reaction requires a potentiostat or an
impedance analyzer that can measure the changes in electrical signal (voltage, current or
resistance) [25].
Every electrochemical reaction and sensor can be described in terms of a cell where the reactions
at each of the electrodes are described under a set of standard conditions. A typical
electrochemical cell can be seen in Figure 4. A cell is described as either electrocatalytic if a
voltage is applied to drive a reaction or galvanic if the cell generates a voltage due to the reaction
occurring. Next, the reference electrode is selected; this electrode will serve as a ground or
reference from which the voltage will be measured [26]. In the example shown below the
Ag/AgBr electrode is the reference. The composition of silver and silver bromide is in
equilibrium and changes negligibly due to the reaction occurring. The working electrode is
defined as the electrode where the reaction under study is occurring; in this example it is the
Pt/HBr. Note that in this case the electrode is in liquid form. Finally the counter electrode is the
electrode that is used to measure the current in the cells, which in this case is the Pt electrode.
This particular chemical reaction is as follows:
⇔
Equation 1: Reduction reaction for AgBr/Ag cell
⇔
Equation 2: Oxidation reaction for AgBr/Ag Cell
Both of the reactions above occur in pairs as a redox couple – i.e. reduction and oxidation
reactions. The voltage that is produced or that needs to be applied to drive the reaction is
determined by the chemicals being used and the reference electrode which the voltages are
measured against. A characteristic curve of voltage vs. current can be generated for each set of
reactions (see Figure 5).

6
Figure 4: Schematic of a Pt/HBr|AgBr/Ag electrode [27]
Figure 5: Current vs. voltage for Pt/H|AgBr/Ag electrode [27].

7
To generate a typical curve for an electrochemical cell a method of measurement must be
employed in order to detect a change in signal for a sensor. The graph above illustrates a typical
curve for the CV scan. In this particular method a voltage is applied and linearly varied – for the
reaction in Figure 4 between 1.5 to -0.5 volts. Each of the reactions occurs at a particular voltage
range, which generates a current according to the graph above. In electrochemical sensors, a
reporter molecule catalyzes the conversion of a biological event into electrons and a
characteristic CV is seen [28]. A very popular sensor that is widely available in North America is
the glucose sensor. The glucose sensor uses the enzyme glucose oxidase which converts glucose
into hydrogen peroxide. A different enzyme, FAD, releases electrons and forms O2 and H2 from
hydrogen peroxide. The electrons transferred can be measured and are directly proportional to
the concentration of glucose [16]. In order to manage diabetes more easily glucose sensor
research is heading towards implantable technology. The sensor will be inserted under the skin
and constantly take measurements while a pump will release insulin gradually when necessary –
i.e. an artificial pancreas [29].
A second scheme commonly used in electrochemical sensors is DPV. In this method an
incrementally increasing square wave (see Figure 6) is applied resulting in a peak that represents
the change in current due to the electrochemical reaction occurring (see Figure 7).
Figure 6: Voltage applied during a typical DPV scan [30].

8
Figure 7: Peak current response due to applied voltage (shown in Figure 6) for DPV [27].
The DPV method is used due to the increased sensitivity that can be achieved. To produce the
peak seen in Figure 7, the apparatus measures the current from the reaction before the
application of a pulse, see Figure 6, and at the peak of the pulse. By subtracting the peak current
from the current measured before the pulse, the apparatus outputs only the ΔI, or current change.
This can eliminate capacitive currents and non-faradic currents in the scan, thus increasing the
sensitivity [27].
1.4 Immobilization of antibodies on a gold surfaces
When linking a biological molecule to a surface it is important to understand what functional
groups are effective at reacting with the surface and which functional groups react with the
antibody molecule. The second fact to consider is whether the functional groups can be used to
directly conjugate the molecule or whether a second species must be used as a linker between the
surface and the antibody.
Gold has several advantages over other surfaces. First, gold is very unreactive which means it is
not subject to quick oxidation. When a metal oxidizes the chemical bond that was conjugated to
the surface will be disrupted as well and the molecule will not be bound. Gold-thiol bonds are
stable enough that the surface will be stable for a few months [31]. Second, gold-thiol chemistry
has been very well studied which means many established protocols exist for coupling biological
molecules to gold as well as patterned gold with microfabrication [32]. On the other hand, gold

9
surfaces are relatively expensive in comparison with other metals such as chrome or silver. There
are several main methods for conjugating antibodies to a gold surface all using either the primary
amines or primary carboxyl groups in amino acids of antibodies.
The antibody structure can be separated into three main parts: light chain (variable chain), heavy
chain and the hinge. The light chain refers to the binding region, which changes sequences based
on the antigen and antibody being used. The heavy chain is non-variable since it does not depend
on the antigen in question. Generally, antibody type is classified based on the heavy chain which
has 5 different categories: IgM, IgD, IgG, IgA and IgE – every different heavy chain (or
“constant region”) has a different sequence. Finally, the hinge is the area that connects the left to
the right half of the antibody which has several cysteine amino acids to form a di-sulfide bond R-
S-S-R where R is any functional group [33].
Figure 8: The structure of a typical antibody where C refers to constant regions and V refers to
variable regions.

10
1.5 Antibody conjugation methods to gold surfaces
1.5.1 Physisorption
The simplest method that can be used for coupling an antibody to a gold surface is physical
adsorption. This method involves incubating the particular sensor with the antibody either at 4oC
or room temperature. This will cause the antibody to adsorb to the surface and bond via weak
Van der Waals forces [34]. The advantage of this method is that it is quite quick, simple and does
not require additional reagents or surface preparation. However, this method has a low success
rate since the activity of the antibody is not guaranteed once it is bound to the surface. The
tertiary structure of the antibody must remain stable throughout this process in order for it to
remain active, thus making this method unpopular. However, some promising results have been
published with detection of pig serum [35] and E. Coli [36].
1.5.2 Glutaraldehyde coupling
Gluteraldehyde coupling is a reaction (see Figure 9) that requires two steps before the addition
of the antibody using two molecules: first cysteamine and then gluteraldehyde.
After the aforementioned procedure, the surface is active and can be incubated with the antibody,
resulting in a covalent bond. This method has the advantage of using simple reagents that are not
quickly reactive in air or solution, which makes the reaction simpler and the storage easier.
Second, cystamine has an amine group that forms a monolayer on the surface. The amine group
is also positively charged at 7.4 physiological pH, which helps boost the overall signal for
electrochemical sensing (see section 1.6). Third, cystamine reacts with the surface very quickly,
producing an 80% surface coverage in the first 5 minutes of the reaction [37]. On the other hand,
glutaraldehyde has a propensity to self-polymerize which can affect the reaction efficiency [38].

11
Figure 9: Schematic of the glutaraldehyde coupling reaction.
1.5.3 NHS/EDC chemistry
NHS/EDC chemistry along with glutaraldehyde coupling are perhaps the most widely used and
studied methods for biomolecule coupling. The complete NHS/EDC chemistry reaction is
outlined in Figure 10. In this reaction, as compared to the glutaraldehyde coupling, the
Figure 10: Complete reaction for EDC/NHS chemistry for biomolecule coupling [39]
backbone of the reaction is carboxylic acid rather than an amine (cystamine from previous
section). There are several molecules that can be used to create a monolayer of carboxylic acid

12
functional groups so that the EDC/NHS chemistry can be performed. Examples include MPA
(mercaptopropioic acid) and MHA (mercaptohexanoic acid), which can be seen in Figure 11.
MPA or MHA can be added followed by EDC to activate the surface in conjunction with sulfo-
NHS, which activates the surface to a suflo-NHS ester form that can react with an amine-
containing biomolecule as seen in Figure 10.
Figure 11: chemical formulas for (a) mercaptopropioic acid (MPA) and (b) mercaptohexanoic
acid.
NHS/EDC chemistry creates a very reactive surface, which can react with the antibody quickly
and efficiently. Moreover, this method is one of the most studied methods for antibody
conjugation and has seen much success in literature in the biosensor field; for example, in the
DNA detection field [40–42]. On the other hand, activated ester surfaces are quite reactive and
can result in lower efficiency of reaction with antibodies if not properly stored. Secondly, the
reaction requires additional steps as compared to glutaraldehyde coupling. Thirdly, the desired
boost in signal for electrochemical measurements is not possible since carboxylic acid possesses
a negative charge at physiological pH. It is important to note that many coupling methods are
based on this chemistry; for example, DTSSP is a molecule that has a form of the activated NHS-
ester, requiring one single step reaction on the surface. The disadvantage of DTSSP is that its
storage has to be at 4OC under nitrogen and very dry conditions to prevent molecule degradation.
1.5.4 Streptavidin-biotin link
A third class of methods that is quite popular involves the use of protein linkers rather than short
molecules. The most used protein link system involves streptavidin-biotin interaction (see
Figure 12). Streptavidin is a bacterial protein that has 4 binding sites for biotin in an especially
strong interaction (among the strongest non-covalent interactions) [43]. Biotin binds to
streptavidin using hydrogen bonds and thus biotin-conjugated antibodies can be purchased and

13
added to the surface during the last step. The molecule presented in Figure 12(a) is a modified
thiol-PEG-biotin molecule that shortens the surface preparation to one step. Without this
molecule NHS-EDC chemistry can be used to create the thiol-PEG to biotin bond, which
requires additional steps. Streptavidin (Figure 12(b)) is added to the surface followed by the
biotin-conjugated antibody (Figure 12(c)). The link system presented is quite robust and easy to
use. Moreover, the biotin-streptavidin system can be used with biomolecules that are not rich in
primary amines, which is a limitation in the previous methods. On the other hand, the system
requires many reagents that are quite expensive compared to the other methods. Also,
streptavidin is a large protein which occludes the surface and reduces electrochemical signals.
This method has been used in several sensors, for example for detecting proteins [44], [45].
Figure 12: Schematic of the chemistry of biotin-streptavidin interaction.
Other protein systems are available that have a unique advantage over the previously presented
methods. Antibodies can bind to the surface in any orientation depending on where the amines
are located. It has been shown that Protein G can be used to orient the antibodies. In other words

14
Protein G is used to bind the heavy chain of the antibody, ensuring that the antigen binding area
is not blocked. Protein G methods for antibody orientation on the surface have been shown to
function more efficiently than non-oriented methods [46], [47]. On the other hand, this method
requires an additional step of conjugating the antibody to the surface, which complicates the
antibody conjugation method. Also, Protein G is an expensive protein, which increases the
overall cost of the assay.
1.5.5 Antibody Reduction
The last class of antibody conjugation methods involves using a different property of the
antibody structure. Since antibody heavy chains are held together via disulfide bonds [47], the
bonds can be broken to create the –S-H functional group. This group, as seen previously, can be
used to directly bind to the gold surface in use. This method has been presented in literature by
using DTT treatment to reduce the disulfide bond [48].
1.6 The blocking assay methodology
For this particular project a gold surface is used that is functionalized with a specific antibody.
The antibody being used for this work is against EpCAM, or epithelial cell adhesion molecule.
The molecule is thought to be expressed in almost all carcinomas in the body and is involved in
cadherin-catenin adhesion; however, the exact details of the mechanism are still under
investigation [49]. It has been proposed as a potential universal marker for carcinomas [50].
The binding event, i.e. the target attaching specifically to the surface via the antibody, must be
converted to an electrically readable signal. In order to achieve this task a secondary reporter
system that is electrochemically active is used.
The blocking assay uses a secondary reporter system, the redox couple ferrocyanide and
ferricyanide, which reacts on the gold surface when in contact with the solution and a voltage is
applied.
When a gold surface has an antibody present there is a high current on the surface due to the
redox reaction of ferrocyanide and ferricyanide. Since the redox reaction can only occur at the

15
boundary layer – i.e. gold surface – when the antigen is bound to the antibody the surface will be
blocked and the reaction will not occur. The binding of the antigen to the antibody will thus
cause the overall current to decrease, which translates to a signal change (see Figure 13).
Figure 13: Blocking assay schematic, showing the physical blocking of ferrocyanide and
ferricyanide from the surface when the antigen binds to the antibody. The physical blocking of
the surface causes an overall current decrease, which is measurable using a potentiostat.
As previously mentioned, the gluteraldehyde conjugation method is used for the purpose of this
assay. One of the advantages of using this particular method is due to the positive charge caused
by the monolayer of cystamine (primary amine group) on the surface. The charge on the surface
attracts ferrocyanide and ferricyanide to the surface via an electrical gradient since both the
molecules are negative. This causes the initial high signal, which increases the sensitivity and
resolution of the assay when using small gold surfaces. This schematic was previously shown to
detect the CA-125 cancer marker with 0.1 U/mL sensitivity [51].

16
1.7 Project Summary
There has been some progress in the field of electrochemical cell counting, most of which has
focused on improving sensitivity of detection. In the field of white blood cell counting for T-
helper cells, single cell detection was achieved [1]. In order to selectively bind T-helper cells an
anti-CD4 antibody is used and impedance spectroscopy is employed. Interestingly, single cell
resolution was achieved by designing the active sensing area (gold electrode) to a size that was
comparable to the cell size – i.e. 15 μm. The drawback to very small electrodes is that a larger
sample where the surface area requirements are greater will require too many connections to
make the device feasible. Some projects have been aimed at miniaturizing a microfluidic
impedance spectroscope for the same application with similar success rates [52]. Recently, in the
area of CTC counting it was shown that the electrode size is a significant contributor to the
sensitivity of the sensor [2]. To augment the current work, this thesis aims to present a
systematic study of the important parameters for designing a simple cell counter that uses the
DPV method. Moreover, this thesis also aims to present electrochemical counting with impure
samples containing various biomolecules and non-target cells. An overview of the proposed
device workflow is shown in Figure 14 below.
Figure 14: Schematic of cell cytosensor device where the attachment of a target cell blocks the
gold surface, reducing the overall current that is produced.

17
Thesis Objectives 2
Purpose Design and validate a sensitive cell cytosensor capable of counting
biological cells without compromising their viability (for cell culturing or
further testing) in the presence of various biomolecules and non-target cells
(see Figure 14).
Objectives (1) Functionalize a gold surface successfully with anti-EpCAM antibody
(2) Detect purified EpCAM antigen
(3) Demonstrate proof-of-principle electrochemical cell counting
(4) Determine critical design parameters that allow for accurate
electrochemical cell counting
(5) Perform counting measurements in a complex matrix with a mix of
target and non-target cells
Research
Motivation
Many applications can benefit from accurate and sensitive cell counting.
One of the problems with the current methodology for cell counting is the
need for trained staff and expensive equipment. Thus, there exists a need for
a method that is simple, cost efficient, quick and has the potential to count
cells in the presence of a mixture of biomolecules and non-target cells.
Moreover, further cell culturing or analysis of the captured cells can be
useful. This requires a device that can count the cells without fixing or
causing degradation of the cells. Having a device that can fill this niche will
further contribute towards an integrated platform, combining cell counting
and further genetic analysis.

18
Experimental Methods 3
All reagents and chemicals used are presented in Appendix B.
3.1 Cell Culture and Sample Preparation
Cells are thawed from -80OC in a 37
OC water bath and placed in 9mL of appropriate media –
MEM α for DU-145 with 10% FBS and RPMI 1670 with 10% FBS for U937 cells. Cells are
centrifuged at 200g for 10 minutes and the media is aspirated and discarded. The cells are
resuspended in 10mL of respective media and placed in a culture flask for either adherent cells
(DU145) or for suspension cells (U937). The cells are cultured until reaching confluence, 80%
surface coverage while replacing media every two days.
DU145 cells are trypsinized in 0.25% trypsin for 5 minutes at 37OC to remove from culture flask.
2.5 mL of cells are recultured in 10mL of media into a new flask while the remaining sample is
centrifuged at 200g for 10 minutes and resuspended in 1X PBS for experiments.
2 mL of U937 cells are extracted and placed in 20 mL of media and recultured into a new flask.
5mL of cells are centrifuged at 200g for 10 minutes and resuspended in 1X PBS for experiments.
The cells are used until passage number 30 or until very large deviation in cell size is observed;
for complex media counting the cells are suspended in 10% FBS with media instead of 1X PBS.
3.2 EpCAM antibody conjugation to the gold surface
The gold surface is cleaned using 5 minutes sonication in acetone, 5 minutes sonication in
isopropanol and thorough rinsing in Millipore H2O followed by drying with N2 stream. The gold
surface is also plasma treated for 60 seconds at 15Watt power before the conjugation procedure
(this procedure is not used for macro electrodes).
10mM cysteamine solution is prepared in DI H2O and incubated on the gold surface for 10
minutes. The surface is washed in a DI H2O water bath for 2 minutes (procedure is repeated
twice). A 10% glutaraldehyde solution is prepared in DI H2O and incubated on the surface for 30
minutes followed by 2 minute washing in DI H2O water bath (wash repeated twice). The gold
surface is thoroughly dried using N2 stream. The EpCAM antibody (or IgG for macro electrode

19
negative control) is diluted to 100μg/mL in 1X PBS and incubated on the surface for 1 hour. A
DI H2O bath is used to wash the surface twice for 5 minutes each time. A 1% BSA solution is
incubated on the surface for 1 hour – used to block the surface from non-specific binding. After
three washes in a DI H2O bath for 5 minutes each the surface is ready for experiments.
3.3 EpCAM Detection Assay
The blocking assay uses a standard three electrode arrangement – reference Ag/AgCl electrode,
platinum counter electrode and a gold electroplated electrode on a chip previously reported by
the Kelley Laboratory [51] (see Appendix A). The electrodes were immersed in a 20mM gold
chloride solution in 0.5M HCl. Each lead of the chip was prepared by applying 30nA of current
with respect to Ag/AgCl electrode and electroplating gold for 50 seconds. The EpCAM antibody
was conjugated to the surface according to section 3.2. The target EpCAM antigen was incubated
at 37OC for 40 minutes at varying concentrations.
The electrodes are immersed in a scanning solution of 2.5 mM K3[Fe(CN)6] (Potassium
hexacyanoferrate(III)); 2.5 mM K4[Fe(CN)6] (Potassium hexacyanoferrate(II)); 0.1 M KCl in
10mM phosphate buffer (prepared from powder and titrated to pH of 7.4). To scan each
electrode, the DPV method was used with the following scanning parameters: potential range of
0mV to 400mV; pulse width 50msec, pulse period, 100msec, pulse amplitude of 50mV with a
step increase of 5mV.
3.4 Cell Counting using macro-electrodes
A standard gold electrode from BaSI was used to validate electrochemical counting which has a
round and flat surface area with 1.6 mm diameter. The electrode was first cleaned by abrasive
polishing using alumina powder for 1 minute on each electrode. Subsequently, the electrodes
were sonicated in acetone and IPA for 5 minutes each. The electrodes were then cleaned with DI
H2O. A CV was done in 50mM sulphuric acid at a range of -100mV to 1500mV at a scan rate of
100mV/sec, which was repeated for 20 cycles as part of the electrode cleaning.
The antibody was conjugated to the gold surface by using the procedure outlined in 3.2. 50uL of
target cells, DU145, and non-target cells, U937, were incubated for 30 minutes at room
temperature. The three-electrode arrangement with Ag/AgCl reference electrode, platinum

20
counter electrode and the gold macro electrode were immersed in the scanning solution. The
scanning solution was made with 2 mM K3[Fe(CN)6] (Potassium hexacyanoferrate(III)); 2 mM
K4[Fe(CN)6] (Potassium hexacyanoferrate(II)) in 1X PBS solution.
A standard DPV scan was used with the following scanning parameters: potential range of 0mV
to 400mV; pulse width 50msec, pulse period, 100msec, pulse amplitude of 50mV with a step
increase of 5mV. The results were recorded and are shown in section 4.2.
3.5 Sensor Design and Microfabrication
The substrate used is a 4-by-4 inch glass substrate coated with a 5nm chrome layer and 100nm
gold layer as shown in Figure 15. The manufacturer performs the first step (Telic INC): spin-
coating the AZ1500 resist, resulting in a 500nA thickness, followed by metal deposition by the
E-beam evaporation technique. E-beam evaporation directs a strong electron beam onto a gold or
chrome metal pellet, causing the metal to evaporate into a chamber and deposit onto the glass
surface via diffusion. The chrome is deposited underneath the gold via E-beam evaporation for
adhesion purposes since gold cannot adhere to glass directly – the gold surface is 100nm in
thickness and the chrome layer is 5nm. The next steps are completed in the ECTI cleanroom
facilities at the University of Toronto.
To fabricate the chip, standard soft photolithography was used. Photolithography refers to a
process by which UV light is used to pattern features on a substrate in a cleanroom environment.
The entire fabrication is outlined in Figure 15.
The SU-8 resist serves as a passive non-conductive layer on which the apertures are formed.
Scanning solution that is in contact with SU-8 does not produce an electrical current thereby
providing a constant signal from each portion uncovered by SU-8 where gold is present. SU-8 is
a negative resist which requires that portions of the SU-8 desired to remain on the surface be
exposed to UV light. In other words, the apertures of the device are not exposed to UV and SU-8
developer develops the resist.
A mask designed with the gold pattern of the device is used to selectively expose the AZ1500
resist (the AutoCAD drawing of the mask can be seen in Figure 19(c)). MF-321 developer

21
provided by the ECTI facility was used for 1 minute and 40 seconds to dissolve all exposed
AZ1500 resist.
Gold etchant solution was used for 30 seconds to remove the gold that is unprotected by resist
followed by use of CR4 etchant for 15 seconds to remove the chrome layer underneath the gold –
similarly only unprotected portions will be removed. AZ1500 resist was removed from the
surface using AZ300T resist stripper for 5 minutes (provided by ECTI facility) followed by a
spin-coat step of SU-8-3005 resist at 3000 RPM for 46 seconds. The SU-8 layer is then baked at
95 degrees for 2 minutes followed by an exposure step for 30 seconds at 13.5mW/cm2. The SU-8
layer is dissolved by SU-8 developer for 1 minute. Afterwards, the SU-8 is cured completely for
2 hours at 200OC making it permanent and resistant to acetone and IPA.
Figure 15: Schematic of the fabrication protocol for the cell counting chip; step are shown from
chip side view – i.e. along the chip’s thickness.

22
3.6 Sensor Monolayer formation
The fabricated sensor outlined in section 3.5 was prepared with the EpCAM antibody in
accordance with section 3.2. After each step in the conjugation method a DPV scan was used
with the following parameters: potential range of 0mV to 400mV; pulse width 50msec, pulse
period, 100msec, pulse amplitude of 50mV with a step increase of 5mV. The scanning solution
was made with 2mM K3[Fe(CN)6] (Potassium hexacyanoferrate(III)); 2mM K4[Fe(CN)6]
(Potassium hexacyanoferrate(II)) in 1X PBS solution.
3.7 Counting Cells with Fabricated sensor
The fabricated sensor outlined in section 3.5 was prepared with the EpCAM antibody in
accordance with section 3.2. DU145 are referred to as the target cells and are incubated on the
surface for 30 minutes at room temperature. The U937 cells are referred to as the negative
control or non-target cells and are also incubated for 30 minutes at room temperature. The sensor
fabricated was used with an electrode size of 150μm in diameter. After incubation with the
sample a DPV scan was used with the following parameters: range of 0mV to 400mV; pulse
width 50msec, pulse period, 100msec, pulse amplitude of 50mV with a step increase of 5mV.
The scanning solution was made with 2mM Potassium hexacyanoferrate(III); 2mM Potassium
hexacyanoferrate(II) in 1X PBS solution. After every chip was scanned using the DPV method, a
microscope image at 10X magnification was used for counting the cells on the surface.
The complex media experiment used MEM α media instead of 1X PBS. The mixed cell
population experiment used a 1,000,000cells/mL cell concentration with DU145 cells at varying
concentrations mixed into each sample. The experimental setup arrangement can be seen in
Figure 16.
After the DPV scans were done, the chip was incubated with 10μg/mL anti-CD45 antibody for
30 minutes at 4OC; followed by extensive washing steps with PBS. CD45 is a general white
blood cell marker and is also expressed by the U937 cell line [53]. Following the primary
antibody incubation, the chip was incubated with 10μg/mL anti-IgG antibody for 30 minutes at
4OC; followed by extensive washing steps with PBS. The cells were then incubated with
100ng/mL DAPI.

23
Figure 16: Top – Experimental setup for the cell count sensor; bottom – close-up of
experimental setup, including (a) PCB board seen in Figure 20.a; (b) PCB board seen in Figure
20; (c) Cell count chip; (d) BaSI potentiostat; (e) Reference electrode; (f) Platinum wire; and (g)
Scanning solution.
(a) (b)
(c)
(d)
(e)
(f)
(g)

24
Results 4
4.1 EpCAM detection Assay
The results for the assay can be seen in Figure 17; the limit of detection for the EpCAM antigen
is 100ng/mL with respect to the negative control (1% BSA). All conditions are statistically
significant using a one-way ANOVA with p<0.05. It can be noted that the negative control is
also not statistically different than the blank scan (PBS alone) where n represents the number of
experiment repeats for each condition.
Figure 17: EpCAM antigen detection results. Error bars represent ± standard deviation, n=5.
4.2 Cell Counting Using Macro-Electrodes
The results from this set of experiments are presented in Figure 18 for total percent current
change, %ΔI. All values marked with * are statistically significant relative to both negative
controls, using the U937 cell line with EpCAM antibody and using DU-145 cells with IgG
antibody, where n is the number of repeats for each condition The limit of detection (LOD) for
this experiment was calculated as 12,500 cells total in the sample. Note that %ΔI is calculated in
the following way:
Equation 3: Percent ΔI calculation where I is the peak DPV current at an
electrode and Io is the average blank DPV current – i.e. background
current with no target
0
1
2
3
4
PBS BSA 10 ug/mL 1 ug/mL 0.1 ug/mL
Pea
k C
urr
ent
(nA
)
Condition *

25
0
10
20
30
40
50%
ΔI
0
500
1000
1500
2000
2500
3000
3500
Tota
l Nu
mb
er o
f ce
lls
Antibody EpCAM IgG EpCAM EpCAM EpCAM EpCAM EpCAM
Cell type None DU-145 U937 DU-145 DU-145 DU-145 DU-145
Total cells
in sample None 50,000 50,000 50,000 25,000 12,500 5,000
Figure 18: DU-145 cell counting using the blocking assay methodology. (a) % current change
vs. cell concentration. (b) Visual cell counts using microscope. Error bars are ± standard
deviation, n=9.
Antibody EpCAM IgG EpCAM EpCAM EpCAM EpCAM EpCAM
Cell type None DU-145 U937 DU-145 DU-145 DU-145 DU-145
Total cells
in sample None 50,000 50,000 50,000 25,000 12,500 5,000
*
*
*
*
*
(a)
(b)
*
*

26
4.3 Sensor Design and Microfabrication
An image of the SU-8 apertures (150μm in size) on the gold electrode (300μm in size) can be
seen in Figure 21. Note that SU-8 is transparent under a light microscope and only a thin black
line on the gold electrodes – i.e. the edge of the aperture – can be seen. The area seen in the
middle of the gold electrode defined by the circular line is exposed gold that can sense cells.
A simple 4-by-4 array of circular gold electrodes was designed – see Figure 19. The electrode
arrangement allowed for sampling of cells on the sensor as well as allowing for changes in the
aperture size for future optimization studies. The chip is comprised of a glass substrate with gold
electrodes and an SU-8 resist layer on top for defining the aperture size. The top of the chip was
designed to fit a PCB board connector for easy connections with the BaSI potentiostat. The PCB
boards used were designed by Brian Lam in the Kelley Laboratory and can be seen in Figure 20.
Note that the chip has two areas of active electrodes: the left side where a 4-by-4 grid of circular
electrodes can be seen and the right side where a 2-by-2 grid of circular electrodes can be seen
(see Figure 19(b)). The 4-by-4 grid is used as a sensing platform on which the cell sample is
placed while the 2-by-2 grid is used for a blank scan with PBS only. The blank scan is used to
measure a background current to which the sensing electrode results are compared. All graphs
reporting current vs. cell count in this chapter show ΔI, or the change in current relative to the
background.
Equation 4: Current change, where I is the peak current at an electrode with cells and Io is the average blank scan current – i.e. no target
The dimension of each circular gold electrode is 300μm, while the connections between the
electrodes to the top of the chip are 100μm in width. The SU-8 layer insulates most of the gold,
excluding the exposed apertures on the gold electrode. The top gold connections that fit inside
the PCB connector have dimensions of 400μm by 1cm with a spacing of 250μm between each
connection.

27
Figure 19: (a) Isometric view of the cell counting chip. (b) Top view of the cell counting chip.
(c) AutoCAD schematic of chip.
Figure 20: (a) PCB board for easy connection to each individual lead (b) PCB connector for
chip.
(a)
(b)
(c)
(a) (b)

28
Figure 21: A microscopic image (10X magnification) of the gold electrodes defined by the
yellow colour and the SU-8 apertures defined by the circle on the gold electrodes. Scale bar is
300μm
29
4.4 Sensor Monolayer Formation
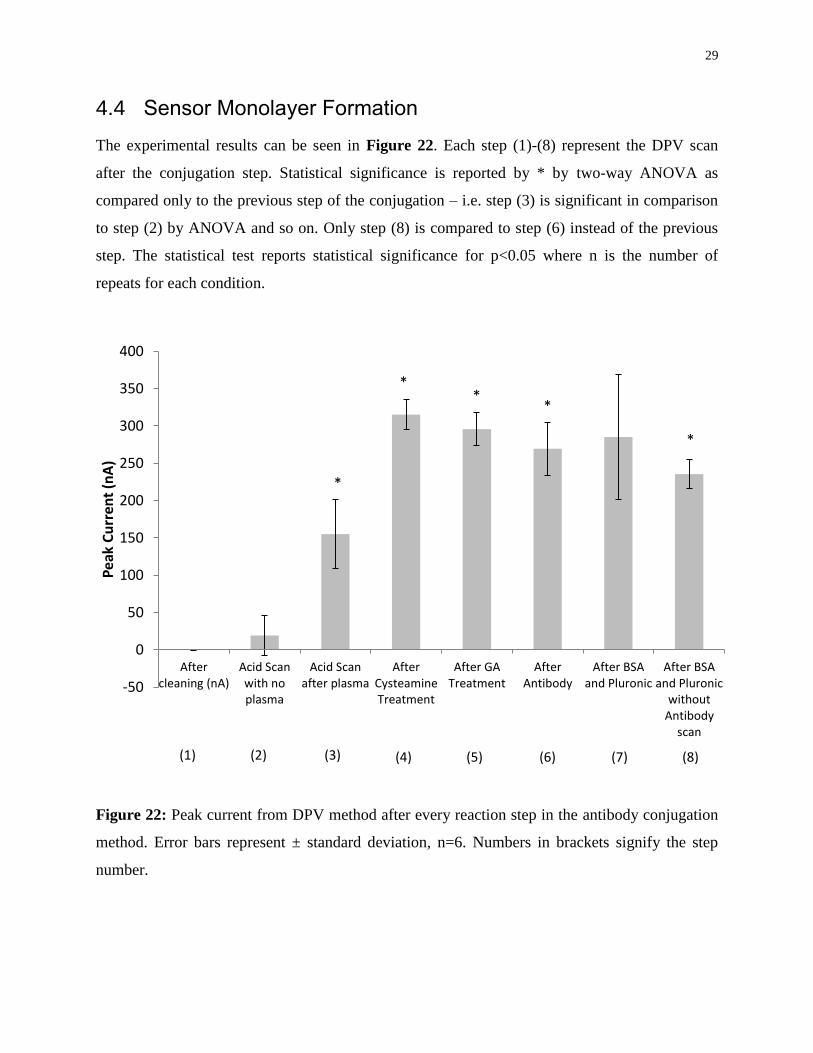
The experimental results can be seen in Figure 22. Each step (1)-(8) represent the DPV scan
after the conjugation step. Statistical significance is reported by * by two-way ANOVA as
compared only to the previous step of the conjugation – i.e. step (3) is significant in comparison
to step (2) by ANOVA and so on. Only step (8) is compared to step (6) instead of the previous
step. The statistical test reports statistical significance for p<0.05 where n is the number of
repeats for each condition.
Figure 22: Peak current from DPV method after every reaction step in the antibody conjugation
method. Error bars represent ± standard deviation, n=6. Numbers in brackets signify the step
number.
-50
0
50
100
150
200
250
300
350
400
Aftercleaning (nA)
Acid Scanwith noplasma
Acid Scanafter plasma
AfterCysteamineTreatment
After GATreatment
AfterAntibody
After BSAand Pluronic
After BSAand Pluronic
withoutAntibody
scan
Pea
k C
urr
ent
(nA
)
(1) (2) (3) (4) (5) (6) (7) (8)
*
* *
*
*

30
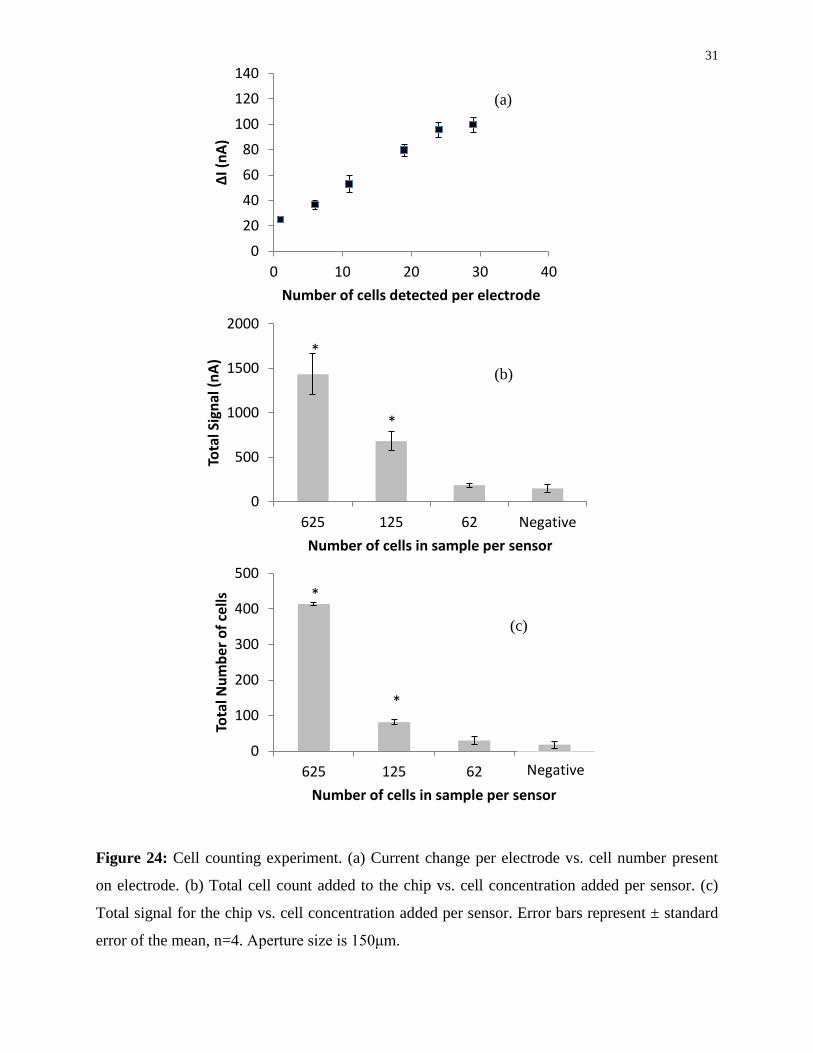
4.5 Counting Cells with Fabricated Sensor
Figure 24(a) reports cells detected per electrode and the peak current corresponding to the cell
count. Using ANOVA by comparing every possible combination of cell counts to its respective
current, the sensitivity and limit of detection was found to be 8 cells per electrode. The total
current (sum of all electrodes per individual chip) was compared to the concentration of the cells
applied to the surface and is reported in Figure 24(a). In addition, the total number of cells
visually counted using the microscope images is graphed with respect to concentration of the
cells applied to the sensor in Figure 24(b). It can be observed that the 150μm chip has detected
125 cells per sensor. All statistically significant values are marked with * and are reported when
p<0.05. A simple linear regression for Figure 24(c) revealed a correlation coefficient of 0.98
where n is the number of experimental repeats for each condition.
ΔI is calculated according to Equation 4. All data is analyzed, sorted and analyzed using
MATLAB 2008 software.
Figure 23: Image at 10X magnification of cells bound to the gold surface; 150μm aperture
device. Scale bar is 300μm.
31
0
20
40
60
80
100
120
140
0 10 20 30 40
ΔI (
nA
)
Number of cells detected per electrode
0
500
1000
1500
2000
625 125 62 Negative
Tota
l Sig
nal
(n
A)
Number of cells in sample per sensor
0
100
200
300
400
500
625 125 62 Neg
Tota
l Nu
mb
er o
f ce
lls
Number of cells in sample per sensor
Negative
Figure 24: Cell counting experiment. (a) Current change per electrode vs. cell number present
on electrode. (b) Total cell count added to the chip vs. cell concentration added per sensor. (c)
Total signal for the chip vs. cell concentration added per sensor. Error bars represent ± standard
error of the mean, n=4. Aperture size is 150μm.
(a)
(b)
(c)
*
*
*
*

32
4.6 Important parameters for electrochemical cell sensors
4.6.1 Aperture Size
The results for each aperture size is presented in Figure 26 where (a) through (c) represent the
current measured for each electrode vs. the number of cells per electrode that were counted using
a microscope. A simple linear regression revealed a correlation coefficient of 0.99. Figures (d)
through (f) show the total current measured as a sum of the electrodes vs. the total number of
cells in the sample per sensor. Statistical significance is marked with * and represents
significance with p<0.05. Sensitivity and range was calculated using MATLAB 2008 and the
summary results are shown in Figure 27. Figure 25 shows sample images of the active sensor
area using 10X magnification after incubation of target cells for different sized apertures.
Figure 25: Microscopic images (10X magnification) with target cells bound with (a) 300μm, (b)
150μm and (c) 50μm aperture size. Scale bar is 300μm.
(a) (b)
(c)

33
0
50
100
150
200
250
300
350
0 20 40 60 80 100 120
ΔI (
nA
)
Number of cells detected per electrode
(b)
0
2
4
6
8
10
12
0 1 2 3 4
ΔI (
nA
)
Number of cells detected per electrode
(a)
0
20
40
60
80
100
120
140
0 10 20 30 40
ΔI (
nA
)
Number of cells detected per electrode
(c)
0
20
40
60
80
100
120
625 125 62 Negative
Tota
l Sig
nal
(n
A)
Number of cells in sample per sensor
(d) *
0
500
1000
1500
2000
625 125 62 Negative
Tota
l Sig
nal
(n
A)
Number of cells in sample per sensor
(e) *
*
0
500
1000
1500
2000
2500
3000
3500
625 125 62 Negative
Tota
l Sig
nal
(n
A)
Number of cells in sample per sensor
(f) *
Figure 26: Results from aperture size experiment (a)-(c) Peak current per electrode vs. cell number
per electrode for 50μm, 150μm, 300μm – top to bottom, (d)-(f) Total peak current vs. cell
concentration for 50μm, 150μm, 300μm – top to bottom. Error bars represent ±standard error of the
mean, n=3.

34
0
5
10
15
20
25
300 μm aperture
150 μm aperture
50 μm aperture
Nu
mb
er
of
cells
pe
r e
lect
rod
e
0
20
40
60
80
100
120
300 μm aperture
150 μm aperture
50 μm aperture
Nu
mb
er
of
cells
pe
r e
lect
rod
e
Figure 27: Graphical representation of the calculated: (a) limit of detection for the sensor vs.
aperture size of the sensor and (b) range – 0 to maximum number of cells that can be counted vs.
aperture size of the sensor.
4.6.2 Concentration of Ferrocyanide and Ferricyanide
The experimental results can be seen in Figure 28 and are represented as DPV signal per
electrode vs. the number of cells bound to each electrode. A simple linear regression showed that
the correlation coefficient is 0.87, 0.99, 0.92, 0.91 for Figure 28(a), (b), (c), and (d) respectively.
The lowest concentration in Figure 28(a) results in signals that are quite variable and a closer
analysis of the raw data revealed that the signal was decreasing with time, implying local
depletion of the solution. If the solution was left to equilibrate for a few minutes the scans
returned to normal (data not shown). The sensitivity of the sensor was 0 cells, 1 cell, 2 cells and
2 cells for 200 μM, 2mM, 20mM and 200mM solutions respectively. It is important to note that
at 200mM ferrocyanide and ferricyanide there was noticeable cell death.
(a) (b)

35
0
2
4
6
8
10
12
0 1 2 3 4
ΔI (
nA
)
Number of cells detected per electrode
0
0.5
1
1.5
2
2.5
0 1 2 3 4
ΔI (
nA
)
Number of cells detected per electrode
0
20
40
60
80
100
120
140
0 1 2 3 4
ΔI (
nA
)
Number of cells detected per electrode
0
50
100
150
200
250
300
0 1 2 3 4
ΔI (
nA
)
Number of cells detected per electrode
Figure 28: Solution concentration effect on signal per gold electrode. (a) 200μM, (b) 2mM, (c)
20mM and (d) 200mM ferrocyanide and ferricyanide. Error bars represent ± standard error of the
mean, n=6. Aperture size is 50μm.
4.6.3 Sample Incubation Time
Lastly, in order to minimize the non-specific binding, which is significantly higher for the 50μm
aperture, and maximize target cell binding, the incubation time with the cells was varied from 1
minute to 1 hour. The results of different incubation times vs. the total signal seen for the 150μm
apertures can be seen in Figure 29. No significance was observed with incubation times less than
15 minutes. It can be seen that the total signal saturates at 30 minutes with no statistical
(a) (b)
(c) (d)
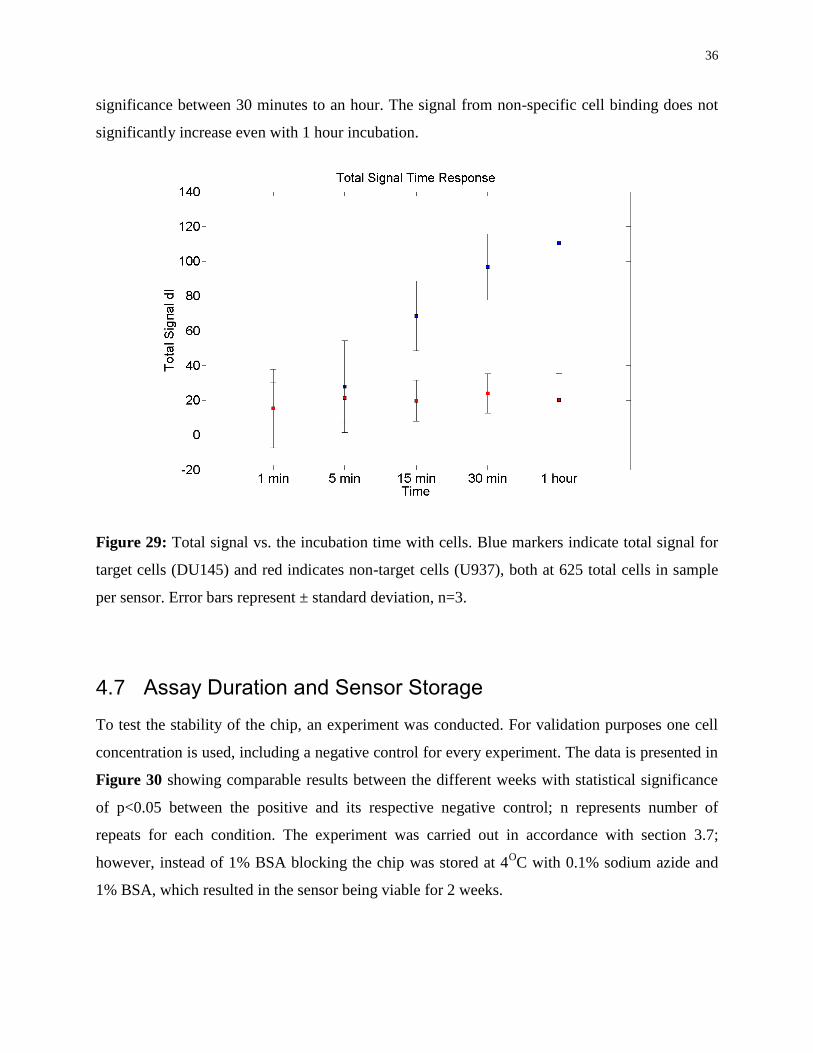
36
significance between 30 minutes to an hour. The signal from non-specific cell binding does not
significantly increase even with 1 hour incubation.
Figure 29: Total signal vs. the incubation time with cells. Blue markers indicate total signal for
target cells (DU145) and red indicates non-target cells (U937), both at 625 total cells in sample
per sensor. Error bars represent ± standard deviation, n=3.
4.7 Assay Duration and Sensor Storage
To test the stability of the chip, an experiment was conducted. For validation purposes one cell
concentration is used, including a negative control for every experiment. The data is presented in
Figure 30 showing comparable results between the different weeks with statistical significance
of p<0.05 between the positive and its respective negative control; n represents number of
repeats for each condition. The experiment was carried out in accordance with section 3.7;
however, instead of 1% BSA blocking the chip was stored at 4OC with 0.1% sodium azide and
1% BSA, which resulted in the sensor being viable for 2 weeks.

37
Figure 30: Chip storage experiment for a 2 week period. Error bars represent ± standard error of
the mean, n=4. No statistical significance found between chips at different weeks. * shows
statistical significance relative to the negative control.
4.8 Counting Cells in Complex Samples
4.8.1 Counting Cells in Media
The sensor was able to count the cells in the presence of serum and proteins. To illustrate this,
the same experiment shown in section 4.5 is repeated in cell media (MEM α media) with 10%
FBS – a mixture that has high concentrations of proteins, small molecules and nutrients as
potential agents to interfere with the sensor. The experimental result is shown in Figure 31. It
can be seen that in comparison to data presented in
Figure 24, there is no statistical difference. Moreover, the media-only data also shows that the
proteins and serum in the solution do not affect the results. The data showed statistical
significance of p< 0.05 relative to the negative controls (media only and U937 cells). The limit of
detection was calculated as 125 cells per sensor, which is comparable to measurements without
the media.
0
200
400
600
800
1000
1200
1400
1600
1800
625 Negative
Tota
l Sig
nal
(n
A)
Number of cells in sample per sensor
0 weeks
1 week
2 weeks
* * *

38
Figure 31: Cell counting experiment in the presence of cell media with 10% FBS, the total
signal vs. cells in sample per sensor is presented. Error bars are ± standard error of the mean,
n=3.
4.8.2 Counting mixtures of target and non-target cells
The procedure for the experiment can be seen in section 3.7. Data for the experiment is presented
in Figure 32. Statistical significance for Figure 32(a) is determined relative to the negative
controls of the experiment in the previous section and show significance with p<0.05. Figure
32(b) shows cells counted using the microscope and immunohistochemistry procedure in section
3.7. Statistical significance can be seen as compared to the negative cell count with p<0.05. Error
bars in figure show ± standard error of the mean with total n=3, where n is the number of repeats
for each condition.
As with previous sections the limit of detection was calculated as 125 total cells per sensor,
which is comparable to previous sections.
0
200
400
600
800
1000
1200
625 312 125 62 Media Negative
Tota
l Sig
nal
(n
A)
Number of cells in sample per sensor
*
*
*

39
Figure 32: Cell count experiment with 625 U937 non-target cells as background mixed with
target cells at varying concentrations. (a) The total signal vs. target cell concentration (b) Cell
count using immunohistochemistry procedure described in section 3.7. Error bars in figure show
± standard error of the mean, n=3.
0
200
400
600
800
1000
1200
1400
625 312 125
Tota
l Sig
nal
(n
A)
Number of cells in sample per sensor
0
50
100
150
200
250
300
350
400
625 312 125
Tota
l Ce
ll N
um
ber
Number of cells in sample per sensor
Positive Cells
Negative Cells
(a)
(b)
*
*
*
*
*
*

40
Discussion 5
5.1 EpCAM detection Assay
The redox couple in the solution is [Fe(CN)6]3-
and [Fe(CN)6]4-
where ferricyanide ([Fe(CN)6]3-
)
reduces to ferrocyanide ([Fe(CN)6]4-
). The oxidation reaction occurs between ferrocyanide to
ferricyanide on the gold electrode, which produces the current seen in Figure 17. However,
when the antigen is bound to the surface the redox couple did not react on the surface, thus
producing a smaller signal.
The limit of detection for the assay is not as low as previously reported [51]. EpCAM antigen is
significantly smaller than the CA-125 antigen previously tested. Therefore, EpCAM blocks a
smaller portion of the gold surface, resulting in a smaller signal change as compared to the blank
scan. This idea is consistent with the blocking assay methodology which favors larger antigens.
Due to this fact, it can be expected that cells would produce larger signal changes on comparable
electrode sizes. In other words, a cell would completely block the 8μm electrode used for
EpCAM detection which would result in a large signal change.
Alternatively, since cells are larger and can elicit a larger signal change a small electrode is not
necessary to create a sensitive sensor. As part of the project goals the electrode size was
investigated to determine its effect on sensor sensitivity and range.
5.2 Cell Counting Using Macro-Electrodes
In order to transfer the sensing scheme to cellular detection for proof-of-concept purposes the
scanning solution and gold surface was reconsidered. A short experiment (incubating cells in
scanning solution for 10 minutes) revealed that the target cells (DU-145) die in the scanning
solution. The most likely reason for this is the 0.1 M KCl concentration in the solution.
Alternatively, as seen in the experimental methods section, a scanning solution of 2mM
K3[Fe(CN)6] and 2mM K4[Fe(CN)6] in 1X PBS solution provides sustainable conditions for the
cells throughout the scanning procedure. However, the overall conductivity was reduced since
the KCl concentration was decreased, thus decreasing the initial signal.

41
Considering DU-145 cells are significantly larger (12±2 μm diameter average) than the EpCAM
antigen, a larger electrode can be used for the experiment. Since the total current is also
proportional to the electrode size, a larger electrode helps increase the overall signal. This is
done in order compensate for the decreased conductivity of the solution. Considering the changes
to the scanning solution the active ferrocyanide and ferricyanide concentrations are investigated
to determine their effects on sensor sensitivity and range in subsequent sections.
From this experiment it is important to observe important parameters that can affect assay
design. One, the sample volume affects assay sensitivity since the total cell count will be reduced
with smaller samples. Second, centrifuging the sample being used can alter the limit of detection.
However, it is important to note that impurities in the sample will also be concentrated following
centrifugation; therefore, the sensor must also count cells in the presence of high non-target cell
numbers. Third, important design parameters must be optimized: such as gold surface size,
ferrocyanide and ferricyanide solution concentrations and cell incubation time.
5.3 Sensor Design and Microfabrication
There are a few considerations that need to be taken into account when designing a cell counting
sensor using electrochemical methods. First, cells settle and will not diffuse to the active sensing
area in contrast to protein or DNA targets. In order to sense a cell sample and count it effectively,
an evenly spaced array of active sensing area must be distributed across the location where the
cells are deposited. Cells can also be dispensed to the sensor via microfluidic channels.
Biological cells, more so for epithelial cells such as the DU-145 cell line used here, have several
mechanisms that enable them to effectively bind non-specifically to surfaces. A multitude of
proteins that are displayed on the cell membrane make the cell easily adherent to surfaces that
are hydrophobic. Moreover, cells extend their membrane in order to make better contact with the
surface since without adhesion to the surface epithelial cells will die [54]. Both these facts make
cells challenging to deal with and a careful non-specific blocking method must be employed.

42
5.4 Sensor Monolayer Formation
In the following paragraphs all steps (1) through (8) are referring to the scans conducted after
each step of the antibody conjugation procedure, represented in Figure 22. As noted, there is no
signal present without any treatment. Afterwards, a procedure known as acid scanning is
performed for 20 cycles [55]. The purpose of the procedure is to clean the gold surface from
contaminants, which in this case did not make any changes to the signal peak.
It should be noted that SU-8 is quite hydrophobic, thus preventing any hydrophilic solutions
(including the scanning solution) from reaching the surface, which can be the cause of the signal
loss. To clean the SU-8 surface as well as the gold and make the SU-8 hydrophilic, oxygen
plasma is applied at 15 W for 60 seconds before proceeding to the next step. As can be seen in
Figure 21, the plasma treatment increases the DPV signal on the gold to typical values for
150μm apertures. Plasma treatment also increases the hydrophilicity of the surface, which helps
reduce non-specific binding [56].
As per the glutaraldehyde coupling procedure, cysteamine is added to the surface. Since
cysteamine is positively charged the signal from the scanning solution should significantly
increase (refer to section 1.6) – this change is seen from step (3) to (4). Next, the added
glutaraldehyde reacts with a portion of the amine groups on the surface which decrease the
overall charge and therefore decrease the signal – this effect is also consistent between step (4)
and (5).
Next, the addition of the antibody physically blocks a portion of the surface which decreases the
overall signal, similar to the effect of antigen addition in section 1.6. Next, 1% BSA and 5%
pluronic F-68 is used to block the surface from non-specific binding. The scan after blocking
(step (7)) produced a quite variable scan, which can be interpreted as damage to the antibody
from excessive scanning. The addition of cells to the surface indicate no binding, which is
consistent with inactive antibody (data not shown).
To rectify this situation, no electrochemical scan is performed after the antibody addition step
since the antibody is not stable enough under those conditions. As seen in step (8) there is no
large variation and the signal is consistent – i.e. blocking with BSA should reduce the signal due

43
to physical blocking. Since the scans after each step are consistent with the chemistry the
antibody activity and the assay must be tested before continuing to the next thesis goal, which
aims to identify the important parameters for designing a cell counting device.
5.5 Counting Cells with Fabricated Sensor
As a potential application for the sensor, circulating tumor cells can be counted. A typical CTC
sample of 1,000cells/mL in 10mL of whole blood can be concentrated when extraction is
performed from blood [50]. However, for CTC extraction technologies as an example, the
samples are not pure and therefore the sensor must count cells in the presence of many non-target
cells. Since the cells that were counted maintain cell viability throughout the procedure the assay
can be used in conjunction with other molecular marker analysis, such as DNA or RNA.
5.6 Important design parameters for electrochemical cell
sensors
In order to maximize the sensitivity of the chip while minimizing the non-specific binding of the
non-target cells (U937 cell line) several important factors that affect the assay sensitivity are
investigated. Aperture size and concentration of ferrocyanide and ferricyanide were previously
mentioned to be important and results are shown in this section. Moreover, the incubation time
of the sample on the surface is also optimized in order to increase cell binding and minimize
non-specific adhesion.
5.6.1 Aperture Size
Since the reaction peak current is dependent on the surface area of the conductive gold it is
reasonable to hypothesize that the size of the gold electrodes will affect sensor sensitivity. As
previously mentioned, when a target cell binds to the surface it will reduce the overall signal (see
section 1.6 for further details). If the target cell covers a larger percentage of the electrode
surface, as is the case with smaller electrodes, the signal change will be larger. Therefore, it can
be expected that decreasing the size of the electrode will increase the sensitivity of the sensor –
consistent with previously published data [2].

44
Figure 24 shows that the large aperture (Figure 24(a)) requires numerous cells to cover the
active gold area while the small aperture (Figure 24(c)) requires only a few cells. However,
there is a trade-off between the sensitivity and the range of the sensor – i.e. the maximum
number of cells that the sensor can count is significantly smaller when the sensitivity is
increased.
From the data presented in Figure 25, it can be seen that as the aperture size decreases less cells
are required to elicit a statistically significant response. In other words, Figure 25(a)-(c) show
that the 50μm aperture can detect 1 cell per aperture while with 300μm aperture 22 cells produce
the minimum detectable signal. It is also important to note that the limit of detection of the
overall device changes to 125 cells per sensor when decreasing the aperture from 300μm to
150μm size. However, from 150μm to 50μm the device is not able to detect 125 cells even
though the sensitivity of the assay increases significantly.
This can be explained by considering the dead space of the sensor. When decreasing the aperture
to 50μm the sensor has less exposed gold area than with 300μm apertures. Since cells are not
able to diffuse to the active gold area and only settle, a significantly large non-sensing space will
result in many cells not being detected. In order to take advantage of the large sensitivity
increase of the 50μm apertures the number of electrodes can be increased. These will cover the
same area and will also take advantage of the sensitivity increase. It can be noted that the
negative control signal increases with decreasing aperture size.
Considering the total number of cells that non-specifically bind is similar between aperture sizes,
when the sensor becomes more sensitive, the non-specific signal will increase. To decrease the
non-specific binding, efficient molecules such as PEG molecules [57] or pluronic [58] should be
investigated in the future. The summary of the calculated sensitivity and sensor range for each
aperture size can be seen in the results section in Figure 27.
Therefore, when designing a cell electrochemical sensor the aperture size should be made small
and the non-sensing area should also be minimized. Theoretically an aperture size that is of an
equal size to a cell will elicit a 100% signal response; however, practically that will require more
numerous connections, making individually addressed electrodes a difficult challenge.

45
5.6.2 Concentration of Ferrocyanide and Ferricyanide
Noting from the previous section that the most sensitive signal was achieved for 50μm electrodes
the optimization experiments were done with the aforementioned aperture size. The principle
idea is that, as with any chemical reaction, the rate is proportional to the reactant concentration.
This means that the current produced will also vary with the reaction concentration. It can be
hypothesized that there will be an optimal concentration where the signal will have maximum
sensitivity. If the concentration is too low the reaction will be diffusion-limited and will have too
great a variability from lead-to-lead while if the concentration is too high the signal will saturate
with high cell numbers.
5.6.3 Sample Incubation Time
The incubation time should be minimized considering that cells at room temperature will slowly
lose viability, causing the count to be inaccurate. On the other hand, short incubation time
decreases the number of cells that can bind onto the surface. Antigen-antibody interactions with
the surface require time. Also, when studying a mixed cell population where cells can adhere to
each other the incubation time should be minimized since a mixture of cells has higher likelihood
for non-specific binding. Therefore, from Figure 29, it can be concluded that 30 minute
incubation at room temperature is optimal without compromising the cells or increasing the non-
specific binding significantly.
5.7 Assay Duration and Sensor Storage
An important factor that affects the practicality of a sensor is the assay time and the stability of
the sensor while not in use. For the cell count sensor presented in this thesis the assay time
involves a 30 minutes incubation period with the sample and a 10 minute period for scanning the
chip using the DPV method as well as a setup time. However, the chip preparation time for
antibody conjugation involves a 4 hour procedure. In order to ensure that the sensor can be
practically used in the future as a potential clinical tool it must have a reasonable shelf life.
Moreover, storage of the chip also ensures adequate stock if necessary.
In order to increase the storage time a different storage media such as 5% trehalose can be used.
Alternatively, a glycerol-based solution can be used to prevent freezing of the liquid on the

46
sensor with storage at -20OC which could increase the shelf life to a few months rather than a
few weeks [52].
5.8 Counting Cells in Complex Samples
Normally, real clinical samples in multiple fields shown previously – T-cell counting for HIV or
CTCs for cancer – present with impurities such as proteins, DNA and small molecules. As a
proof-of-concept a sensor should be able to count in conditions where multitudes of molecules
are mixed with the target sample. For cell counting this can imply two separate conditions: a
mixture of proteins and small molecules and a mixture of non-target cells. The cell counter in
this thesis is shown to be able to count target cells in the presence of serum from media and in
the presence of non-target cells.
Currently, identification of non-target cells in a cell population requires immunohistochemistry
which involves the use of multiple antibodies and molecules that are fluorescently labeled. As
previously mentioned, this can require trained technicians to develop a protocol for a particular
cell target as multiple reagents. This makes immunohistochemistry costly and impractical for
clinical application. However, with the cell sensor presented in this thesis that requires 40
minutes total for the assay, bringing such a tool to both a research and clinical setting can be
more feasible.

47
Conclusions and Future Directions 6
This thesis project has shown the potential of a cell counting sensor to be used with a complex
sample and a mixed cell population using the DPV method, which has not been previously
shown in literature. The thesis also presented important design parameters that were optimized
and considered for effective cell counting.
Considering the parameters optimized, a chip will be designed in the future that includes more
gold electrodes with the smaller aperture size of 50μm in diameter. This will move the project
towards more efficient counting with higher sensitivity. Moreover, the new chip design can be
potentially used with gold standard methods available for CTC isolation such as the OncoQuick
system, which extracts CTCs in the presence of many non-target cells. This application could be
ideal in the future since it exploits the sensitivity of the sensor and the ability to count cells in the
presence of a high background signal.

48
Bibliography
[1] X. Jiang and M. G. Spencer, “Electrochemical impedance biosensor with electrode pixels
for precise counting of CD4+ cells: a microchip for quantitative diagnosis of HIV
infection status of AIDS patients.,” Biosensors & bioelectronics, vol. 25, no. 7, pp. 1622-
8, Mar. 2010.
[2] S. K. Arya, K. C. Lee, D. B. Dah’alan, D. Cant, and A. R. A. Rahman, “Breast Tumor
Cell Detection at Single Cell resolution Using Electrochemical Impedance Technique,”
Lab on a Chip, 2012.
[3] E. L. Sievers et al., “Selective Ablation of Acute Myeloid Leukemia Using Antibody-
Targeted Chemotherapy: A Phase I Study of an Anti-CD33 Calicheamicin
Immunoconjugate,” Blood, vol. 93, no. 11, pp. 3678-3684, Jun. 1999.
[4] S. D. Douglas et al., “Peripheral blood mononuclear cell markers in antiretroviral therapy-
naive HIV-infected and high risk seronegative adolescents,” AIDS, vol. 13, no. 13, 1999.
[5] S. Maheswaran et al., “Detection of mutations in EGFR in circulating lung-cancer cells,”
New England Journal of Medicine, vol. 359, no. 4, pp. 366-377, 2008.
[6] M. C. Walters and H. T. Abelson, “Interpretation of the complete blood count.,” Pediatric
clinics of North America, vol. 43, no. 3, pp. 599-622, Jun. 1996.
[7] W. E. Tolles and L. Hwy, “Disposable Volumetric Slide,” U.S. Patent 05/8980871978.
[8] H. Fukushima and K. Sugiyama, “Cell Counting Board,” U.S. Patent 200900734182009.
[9] Invitrogen, “Comparison of image-based cell counting methods,” 2009.
[10] D.-J. Kim et al., “A quartz nanopillar hemocytometer for high-yield separation and
counting of CD4(+) T lymphocytes.,” Nanoscale, vol. 4, no. 7, pp. 2500-7, Apr. 2012.
[11] P. Lutz and W. Dzik, “Large-volume hemocytometer chamber for accurate counting of
white cells (WBCs) in WBC-reduced platelets: validation and application for quality

49
control of WBC-reduced platelets prepared by apheresis and filtration,” Transfusion, vol.
33, no. 5, pp. 409-412, May 1993.
[12] D. B. Denicola, “Advances in hematology analyzers.,” Topics in companion animal
medicine, vol. 26, no. 2, pp. 52-61, May 2011.
[13] D. Garcia, I. Ghansah, J. LeBlanc, and M. J. Butte, “Counting cells with a low-cost
integrated microfluidics-waveguide sensor,” Biomicrofluidics, vol. 6, no. 1, 2012.
[14] M. M. G. Grafton et al., “Microfluidic MEMS hand-held flow cytometer,” in Proceedings
of SPIE - The International Society for Optical Engineering, 2011, vol. 7929.
[15] Y. Hosseini and K. V. I. S. Kaler, “Integrated CMOS optical sensor for cell detection and
analysis,” Sensors and Actuators, A: Physical, vol. 157, no. 1, pp. 1-8, 2010.
[16] N. S. Oliver, C. Toumazou, A. E. G. Cass, and D. G. Johnston, “Glucose sensors: a review
of current and emerging technology.,” Diabetic medicine : a journal of the British
Diabetic Association, vol. 26, no. 3, pp. 197-210, Mar. 2009.
[17] A. Lasia, “Electrochemical Impedance Spectroscopy and its Applications,” in Modern
aspects of electrochemistry, 1st ed., Quebec: Kluwer Academic, 1999, pp. 143-248.
[18] J. R. McDonald, “Impedance Spectroscopy,” Annals of Biomedical Engineering, vol. 20,
pp. 289-305, 1992.
[19] C. Ruan, L. Yang, and Y. Li, “Immunobiosensor Chips for Detection of Escherichia coli
O157 : H7 Using Electrochemical Impedance Spectroscopy,” Society, vol. 74, no. 18, pp.
4814-4820, 2002.
[20] X. Muñoz-Berbel et al., “Real Time Automatic System for the Impedimetric Monitoring
of Bacterial Growth,” Analytical Letters, vol. 44, no. 16, pp. 2571-2581, 2011.
[21] J. T. La Belle et al., “Label-Free and Ultra-Low Level Detection of Salmonella enterica
Serovar Typhimurium Using Electrochemical Impedance Spectroscopy,” Electroanalysis,
vol. 21, no. 20, pp. 2267-2271, Oct. 2009.

50
[22] T. N. Tun and A. T. A. Jenkins, “An electrochemical impedance study of the effect of
pathogenic bacterial toxins on tethered bilayer lipid membrane,” Electrochemistry
Communications, vol. 12, no. 10, pp. 1411-1415, 2010.
[23] M. A. Kafi, T.-H. Kim, J. H. An, and J.-W. Choi, “Fabrication of cell chip for detection of
cell cycle progression based on electrochemical method.,” Analytical chemistry, vol. 83,
no. 6, pp. 2104-11, Mar. 2011.
[24] M. Angstmann, I. Brinkmann, K. Bieback, D. Breitkreutz, and C. Maercker, “Monitoring
human mesenchymal stromal cell differentiation by electrochemical impedance sensing.,”
Cytotherapy, vol. 13, no. 9, pp. 1074-89, Oct. 2011.
[25] R. Chang and J. Overby, “Redox Reactions and Electrochemistry,” in General Chemistry:
The Essential Concepts, 6th ed., New York: McGraw Hill, 2008, pp. 661-703.
[26] L. R. Faulkner, “Understanding electrochemistry: some distinctive concepts,” Journal of
Chemical Education, vol. 60, no. 4, p. 262, 1983.
[27] A. J. Bard and L. R. Faulkner, Electrochemical Methods: Fundamentals and Applications,
2nd ed. New York: John Wiley & Sons, 2001.
[28] D. H. Evans, K. M. O’Connell, R. A. Petersen, and M. J. Kelley, “Cyclic Voltammetry,”
Journal of Chemical Education, vol. 60, no. 4, p. 4, 1983.
[29] E. S. Wilkins, “Towards implantable glucose sensors: a review,” Journal of Biomedical
Engineering, vol. 11, no. 5, pp. 354-361, Sep. 1989.
[30] BaSi, “PULSE VOLTAMMETRY/POLAROGRAPHY,” 2009. [Online]. Available:
http://www.basinc.com/mans/EC_epsilon/Techniques/Pulse/pulse.html. [Accessed: 12-
Jun-2012].
[31] M. Mrksich and G. M. Whitesides, “USING SELF-ASSEMBLED MONOLAYERS TO
UNDERSTAND THE INTERACTIONS OF MAN- MADE SURFACES WITH
PROTEINS AND CELLS,” Annual reviews of biophysics and biomolecular structure,
vol. 25, pp. 55-78, 1996.

51
[32] J. C. Love, L. A. Estroff, J. K. Kriebel, R. G. Nuzzo, and G. M. Whitesides, “Self-
Assembled Monolayers of Thiolates on Metals as a Form of Nanotechnology,” Chemical
Reviews, vol. 105, pp. 1103-1169, 2005.
[33] “The structure of a typical antibody molecule.” Garland Science, 2001.
[34] E. Baldrich, O. Laczka, F. J. Del Campo, and F. X. Muñoz, “Self-assembled monolayers
as a base for immunofunctionalisation: Unequal performance for protein and bacteria
detection,” Analytical and Bioanalytical Chemistry, vol. 390, no. 6, pp. 1557-1562, 2008.
[35] A. Kojima, C. K. Hyon, T. Kamimura, M. Maeda, and K. Matsumoto, “Protein sensor
using carbon nanotube field effect transistor,” Japanese Journal of Applied Physics, Part
1: Regular Papers and Short Notes and Review Papers, vol. 44, no. 4 A, pp. 1596-1598,
2005.
[36] M. B. Mejri, H. Baccar, T. Ktari, M. Aouni, and A. Abdelghani, “Detection of E.coli
bacteria using impedance spectroscopy and surface plasmon resonance imaging based
biosensor,” Sensor Letters, vol. 9, no. 6, pp. 2130-2132, 2011.
[37] S. Y. Lee, J. Noh, E. Ito, H. Lee, and M. Hara, “Solvent Effect on Formation of
Cysteamine Self-Assembled Monolayers on Au(111),” Japanese Journal of Applied
Physics, vol. 42, no. Part 1, No. 1, pp. 236-241, Jan. 2003.
[38] D. R. Walt and V. I. Agayn, “The chemistry of enzyme and protein immobilization with
glutaraldehyde,” TrAC Trends in Analytical Chemistry, vol. 13, no. 10, pp. 425-430, Nov.
1994.
[39] G. T. Hermerson, Bioconjugation techniques, 2nd ed. New York: , 2008, pp. 214-233;
234-275.
[40] K. Kerman, D. Ozkan, P. Kara, B. Meric, J. J. Gooding, and M. Ozsoz, “Voltammetric
determination of DNA hybridization using methylene blue and self-assembled alkanethiol
monolayer on gold electrodes,” Analytica Chimica Acta, vol. 462, no. 1, pp. 39-47, 2002.

52
[41] D. Ozkan et al., “Electrochemical detection of hybridization using peptide nucleic acids
and methylene blue on self-assembled alkanethiol monolayer modified gold electrodes,”
Electrochemistry Communications, vol. 4, no. 10, pp. 796-802, 2002.
[42] X.-H. Lin, P. Wu, W. Chen, Y.-F. Zhang, and X.-H. Xia, “Electrochemical DNA
biosensor for the detection of short DNA species of Chronic Myelogenous Leukemia by
using methylene blue,” Talanta, vol. 72, no. 2, pp. 468-471, 2007.
[43] N. M. Green, “Avidin and streptavidin,” Methods in Enzymology, vol. 184, pp. 51-67,
1990.
[44] Y. Cui, Q. Wei, H. Park, and C. M. Lieber, “Nanowire nanosensors for highly sensitive
and selective detection of biological and chemical species,” Science, vol. 293, no. 5533,
pp. 1289-1292, 2001.
[45] A. J. Haes and R. P. Van Duyne, “A nanoscale optical biosensor: Sensitivity and
selectivity of an approach based on the localized surface plasmon resonance spectroscopy
of triangular silver nanoparticles,” Journal of the American Chemical Society, vol. 124,
no. 35, pp. 10596-10604, 2002.
[46] B.-K. Oh, W. Lee, B. S. Chun, Y. M. Bae, W. H. Lee, and J.-W. Choi, “The fabrication of
protein chip based on surface plasmon resonance for detection of pathogens,” Biosensors
and Bioelectronics, vol. 20, no. 9, pp. 1847-1850, 2005.
[47] S. Wang, M. Esfahani, U. a Gurkan, F. Inci, D. R. Kuritzkes, and U. Demirci, “Efficient
on-chip isolation of HIV subtypes.,” Lab on a chip, pp. 1508-1515, Mar. 2012.
[48] M. M. Billah, C. S. Hodges, H. C. W. Hays, and P. A. Millner, “Directed immobilization
of reduced antibody fragments onto a novel SAM on gold for myoglobin impedance
immunosensing.,” Bioelectrochemistry Amsterdam Netherlands, vol. 80, no. 1, pp. 49-54,
2010.

53
[49] M. Balzar, M. J. Winter, C. J. de Boer, and S. V. Litvinov, “The biology of the 17-1A
antigen (Ep-CAM).,” Journal of molecular medicine (Berlin, Germany), vol. 77, no. 10,
pp. 699-712, Oct. 1999.
[50] S. Nagrath et al., “Isolation of rare circulating tumour cells in cancer patients by
microchip technology,” Nature, vol. 450, no. 7173, pp. 1235-1239, 2007.
[51] J. Das and S. O. Kelley, “Protein Detection Using Arrayed Microsensor Chips: Tuning
Sensor Footprint to Achieve Ultrasensitive Readout of CA-125 in Serum and Whole
Blood,” Analytical Chemistry, vol. 83, no. 4, pp. 1167-1172, 2011.
[52] D. S. Boyle, K. R. Hawkins, M. S. Steele, M. Singhal, and X. Cheng, “Emerging
technologies for point-of-care CD4 T-lymphocyte counting,” Trends in Biotechnology,
vol. 30, no. 1, pp. 45-54, 2012.
[53] U. Båve, H. Vallin, G. V. Alm, and L. Rönnblom, “Activation of natural interferon-α
producing cells by apoptotic U937 cells combined with lupus IgG and its regulation by
cytokines,” Journal of Autoimmunity, vol. 17, no. 1, pp. 71-80, 2001.
[54] X. Zheng, L. S.-L. Cheung, J. A. Schroeder, L. Jiang, and Y. Zohar, “Cell receptor and
surface ligand density effects on dynamic states of adhering circulating tumor cells.,” Lab
on a chip, Aug. 2011.
[55] D. A. J. Rand and R. Woods, “A study of the dissolution of platinum, palladium, rhodium
and gold electrodes in 1 m sulphuric acid by cyclic voltammetry,” Journal of
Electroanalytical Chemistry and Interfacial Electrochemistry, vol. 35, no. 1, pp. 209-218,
Mar. 1972.
[56] F. Walther et al., “Surface hydrophilization of SU-8 by plasma and wet chemical
processes,” Surface and Interface Analysis, vol. 42, no. 12–13, pp. 1735-1744, 2010.
[57] R. Marie, J. P. Beech, J. Vo¨ro¨s, J. O. Tegenfeldt, and F. Ho¨o¨k, “Use of PLL-g-PEG in
Micro-Fluidic Devices for Localizing Selective and Specific Protein Binding,” Langmuir,
no. 22, pp. 10103-10108, 2006.

54
[58] S. H. Au, P. Kumar, and A. R. Wheeler, “A new angle on pluronic additives: advancing
droplets and understanding in digital microfluidics.,” Langmuir : the ACS journal of
surfaces and colloids, vol. 27, no. 13, pp. 8586-94, Jul. 2011.
[59] L. Soleymani et al., “Hierarchical Nanotextured Microelectrodes Overcome the Molecular
Transport Barrier To Achieve Rapid, Direct Bacterial Detection,” ACS Nano, vol. 5, no. 4,
pp. 3360-3366, 2011.

55
Appendix A: Kelley Laboratory electrochemical chip
Figure 33: Prefabricated chip used in Kelley Laboratory [59].

56
Chemical Supplier Catalog number
cysteamine Sigma Aldrich 60-23-1
glutaraldehyde Sigma Aldrich 111-30-8
DI H2O Invitrogen 10977023
EpCAM R&D systems 960-EP-050
Anti-EpCAM antibody R&D Systems MAB960
Ag/AgCl reference BaSI MF-2078
Pt wire Omega Electronics SPPL-001
Potassium hexacyanoferrate(III) Sigma Aldrich 13746-66-2
Potassium hexacyanoferrate(II) Sigma Aldrich 13746-66-1
KCl Sigma Aldrich 7447-40-7
Phosphate monobasic Sigma Aldrich 13472-35-0
BSA Sigma Aldrich 9048-46-8
DU-145 cell line ATTC HTB-81
U937 cell line ATTC CRL-1593.2
Standard gold electrode 1.6mm diameter BaSI MF2014
Gold on glass substrate 4x4’’ TELIC Custom quote
Gold etchant Transene GE-8110
Chrome etchant Cyantek CR4 etchant
AZ300T stripper Capitold scientific INC AZ300TSTRIP
SU-8 Microchem INC SU-8-3005
SU-8 developer Microchem INC SU-developer
Pluronic F-68 Sigma Aldrich 9048-46-8
MEM alpha media Invitrogen 12571089
FBS Invitorgen 16000044
Anti CD45 antibody R&D systems MAB1430
DAPI Invitrogen D1306
Anti IgG antibody R&D systems NL009
Gold chloride solution 1.45M Sigma Aldrich 27988-77-8
Appendix B: List of materials and chemicals used

57
Hydrochloric Acid Sigma Aldrich 7647-01-1
Acetone Sigma Aldrich 67-64-1
IPA Sigma Aldrich 67-63-0
Sulphuric Acid Sigma Aldrich 7664-93-9
Adherent culture flasks VWR (BD Falcon) CABD353133
Suspension culture flasks VWR (BD Falcon) CABD353136
Trypsyn EDTA Invitrogen 15050057