design of an airborne launch vehicle for an air launched
TRANSCRIPT

NASA-CR-|95534
_//Y -/a- -o,,_
j _ _/_ 3 5_--
Design of an Airborne Launch Vehicle for anAir Launched Space Booster
University of MichiganAerospace 490/590 Advanced Airplane Design
Winter 1993
(NASA-CR-195534) DESIGN OF AN
AIRBORNE LAUNCH VEHICLE FOR AN AIRLAUNCHED SPACE BOOSTER (Michigan
Univ.) 184 p
N94-24860
Unclas
G3/15 0204285
=.
https://ntrs.nasa.gov/search.jsp?R=19940020387 2020-06-16T16:33:23+00:00Z


ABSTRACT
DESIGN OF AN AIR.BORNE LAUNCH VEHICLE FOR AN
AIR LAUNCHED SPACE BOOSTER
University of Michigan
Aerospace 490/590 Advanced Airplane Design
Winter 1993
A conceptual design is presented for a carrier vehicle for an air launched space booster. This
airplane is capable of carrying a 500,000 pound satellite launch system to an altitude over 40,000
feet for launch. The airplane features a twin fuselage configuration for improved payload and
landing gear integration, a high aspect ratio wing for maneuverability at altitude, and is powered by
six General Electric GE-90 engines. The analysis methods used and the systems employed in the
airplane are discussed. Launch costs are expected to be competitive with existing launch systems.
Team Members:
Chin Chao
Rich Choi
Scott Cohen
Brian Dumont
Mauricius Gibin
Rob Jorden
Stefan Poth, Team Leader
Advisor:
Dr. David Levy
Graduate Assistant:
John Blow
\\

?

TABLE OF CONTENTS
TH'LE PAGE
ABSTRACT
TABLE OF CONTENTS
LIST OF SYMBOLS V
LIST OF FIGURES & TABLES xi
ACKNOWLEDGMENTS XV
I. INTRODUCTION
, MISSION DEFINITION
2.1 Design Criteria
2.2 Mission Profile
3
3
3
3. CONHGURATION DESCRIPTION
3.1 Design History
3.2 Configuration Overview
3.3 Comparison with Existing Aircraft
3.4 Analysis Overview
5
5
6
6
12
° PROPULSION
4.1 Introduction
4.2 Discussion
19
19
19
. AERODYNAMICS
5.1 Assumptions & PertinentData
5.2 Airfoil Selection& Data
5.3 LiftCurves & Wing Moment Coefficients
5.4 Drag Polars
5.5 Flap Sizing
25
25
27
34
34
35

5.6 Thrust Required
5.7 Spanwise Lift Distribution
5.8 Performance Analysis
37
37
38
o STRUCTURES & WEIGHTS
6.1 V-n Diagram
6.2 Estimation of Component Weights
6.3 Determination of the Longitudinal Center of Gravity
6.4 Summary of Weight & Balance Calculations
6.5 Structural Considerations
43
43
43
47
48
48
o STABR,rI'Y & CONTROL
7.1 HorizontalTailSizing& LongitudinalStability
7.2 ElevatorSizing& LongitudinalControl
7.3 Lateral& DirectionalStabilityAnalysis
51
51
54
56
. SYSTEMS
8.1 Payload Integration
8.2 Landing Gear Integration
8.3 Hydraulic system layout
8.4 Electrical System Layout
8.5 Flight Control System
8.6 Fuel System
8.7 Crew Issues
61
61
68
75
85
90
91
97
o COST ANALYSIS
9.1 Cost AnalysisMethod: Overview
9.2 ProjectViability
9.3 TotalMission Cost
9.4 Future Recommendations
101
101
101
107
108
10. WIND TUNNEL TESTING
10.1 Model Fabrication
10.2 Test Results
109
109
109
11. CONCLUSIONS &RECOMMENDATIONS 113

12. REFERENCES 119
APPENDICES
A. Project Gryphon Summary Paper
B. Aerodynamics Calculations
C. Performance Calculations
D. General Electric Engine Data
E. Wing Weight Calculations
F. Landing Gear Calculations
117
117
129
143
165
175
179
iii

(Thispageleft intentionally blank.)
iv

LIST OF SYMBOLS
Variables
Symbol
A
A
b
C
C
CEF
CD
Cdo
COil
COt2
CL
CLa
C1
tipCISA
CISR
Cn[_CnSA
CnSR
cy
O,'_.CYSA
CYSR
D
d
F
Fy
g
h
k
L
LCC
Area
Aspect ratio
Span
Chord
Cost
Cost escalation factor
Drag coefficient
Zcm lift drag
Linear lift induced drag constant
Parabolic lift induced drag constant
Lift coefficient
Lift curve slope
Rolling moment coefficient
Change in rolling moment due to side slip
Change in roiling moment due to lateral control
Change m rolling moment due to directional control
Change m
Change m
Change m
Side force
Change in
Change in
Change in
Drag
Distance
Force
Side force
Gravitational acceleration
Altitude
Constant
Lift
Life cycle cost
yawing moment due to side slip
yawing moment due to lateral control
yawing moment due to directional control
coefficient
side force due to side slip
side force due to lateral control
side force due to directional control
Unitin2, ft 2
ft
ft
$
rad-1
rad-1
tad-1
tad-1
rad-1
rad-1
rad-1
rad-1
rad-1
rad-1
lbf
ft
lbf
lbf
ft/sec 2
ft
lbf
$
PI_(:;;_DtNG PAGE BLANK NOT Ff/.MEDv _.,4;.. I J

LT
1
rh
M
M
N
NT
n
OWE
P
P
r
S
S
SM
T
t
U1
V
V
W
X
X
Rolling moment
Moment arm
Airflow
Mach number
Moment
Number
Yawing moment
Load factor
Operational weight empty
Power
Pressure
Radius
Field length
Reference area
Static margin
Thrust
Time
Velocity
Velocity
Volume coefficient
Acceleration
Weight
Distance
Distance
Greek symbols
A
8
P
A
%
,
Angle of attack
Side slip angle
Change in
Deflection angle
Density
Efficiency
Sweep angle
Taper ratio
Bank angle
ft-lbf
ft
slug/see
ft.lbf
ft.lbf
g
lbf
hp
psi
ft
ft
ft 2
%
lbf
hr, min, sec
ft/sec
mph, kts, ft/sec
ft/sec 2
lbf
ft
UnitO
O
O
slug//ft 3
O
O
vi

Pf
Shearstress
Staticcoefficient of friction
lbf/'m 2
Subscripts
_vmbol
A
A
ACQ
a
a
ac
aedr
ampr
app
arm
av
bleed
c
c/4
cg
CONSMAT
cool
cr
cr
D
DEPOT
DISP
dst
e
eft
electrical
emergency
extracted
F
f
f
Aileron
Airplane
Acquisition
Absolute
Air
Ao-odynamic cente,
Airframe engineering and design
Empty structure
Approach conditions
Hydraulic arm
Available
Bleed air
Capmre
Quarter-chord
Center of gravity
Consumable materials
Cooling
Critical
CMtise
Dive
Depot
Disposal
development support and testing
Elevator
Effective
Electrical
Emergency landing conditions
Total exuacr_l
Fuselage
Flaps
Fuel
vii

fin
flaps
fta
fro
gas
h
hydraulic
inl/'m¢
L
LE
launch
launch turn
lever
lira
M]SC
max
mechanical
mission
OPS
0
ol
PERSIND
PERSDIR
POL
PROT
P
pin
pneumatic
pro
R
R
RDTE
r
ramp
ref
Financing
Flaps
Flight test airplane
Flight test operations
Gaseous flow
Horizontal taft
Hydraulic
Inlet
Landing
Leading edge
Launch conditions
During launch turn
Laver arm
Limit
Miscellaneous
Maximum
Minimum control
Mechanical
Completemission
Operations
Effective
Zero lift
Indirect personnel
Direct personnel
Fuel, oil, and lubricant
Prototype
Payload
Eclipse/Gryphon connection pin
Bleed air
Profit
Root
Rudder
Research, development, test, and evaluation -
Root
Ramp conditions
Reference location
vm

req
reqd
stall
SPARES
TO
t
to
touch down
tsf
tsVav
ult
V
WB
W
Required
Required
Stall conditions
Spare parts
Take off conditions
TipTake off conditions
Touch down conditions
Test and simulation facilities
Uninstalled available
Ultimate
Vertical tail
Wing and body
Wing
Abbreviations
APU
CAD
CFD
CNC
GD
IMU
NC
OSC
RAT
aamAuxiliary power unit
Computer aided design
Computational fluid dynamics
Computer numerical control
General Dynamics
Inertial measurement unit
Numerical control
Orbital Sciences Corporation
Ram air turbine
ix

(This page left intentionally blank.)
X

LIST OF FIGURES & TABLES
Figures
2.2.1
3.2.1
3.2.2
3.2.3
3.2.4
3.3.1
4.2.1
4.2.2
4.2.3
4.2.4
4.2.5
5.1.1
5.1.2
5.1.3
5.1.4
5.2.1
5.2.2
5.2.3
5.5.1
5.7.1
5.7.2
6.1.1
6.1.2
6.4.1
7.1.1
7.1.2
8.1.1
8.1.2
8.1.3
8.1.4
8.1.5
8.2.1
Mission profile
Eclipse top view
Eclipse front view
Fuselage longitudinal cross sections
Eclipse isometric view
Airplane comparison
Nacelle and pylon side view
Nacelle and pylon front view
Power extracted at take off for various field altitudes at standard conditions
Power extracted at maximum climb rate for various altitudes at standard conditions
Installed thrust available at maximum climb for various altitudes at standard conditions
Overlay of equivalent wing and actual wing
Main wing planform
Horizontal tail planform
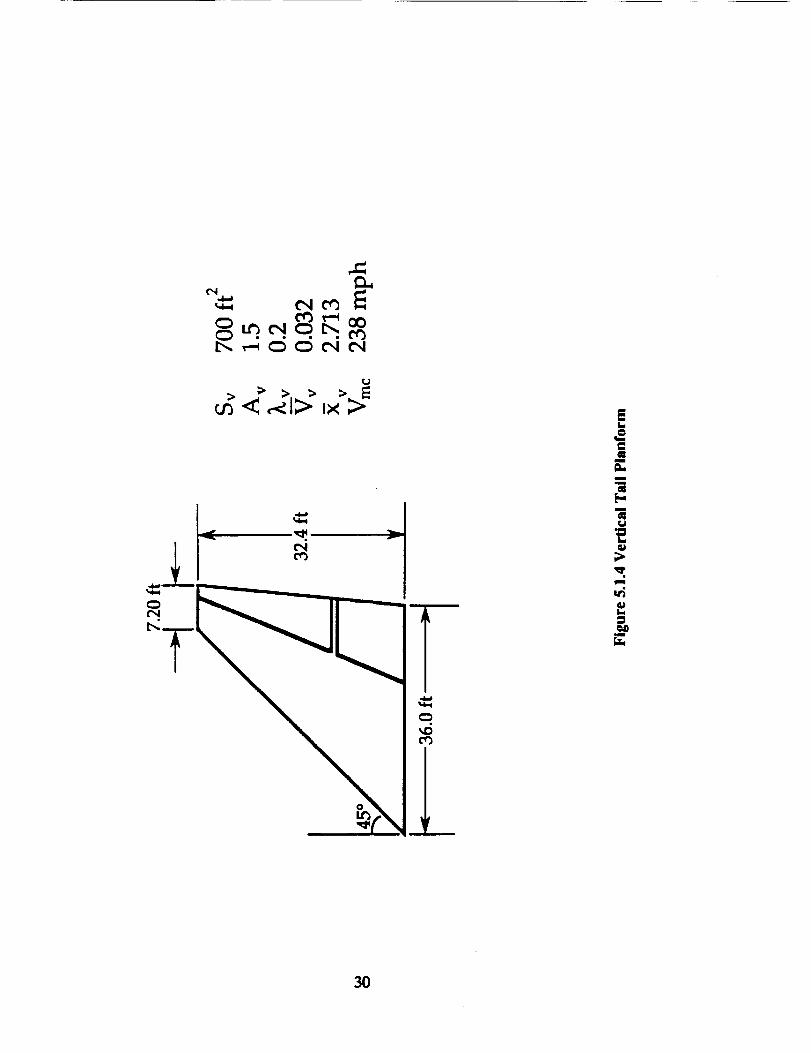
Vertical tail planform
Airfoil cross-section
Lift coefficient versus angle of attack for NASA 14-percent thick supercritical airfoil
Drag polar for NASA 14-percent thick supercritical airfoil
Main flap configuration
Spanwise effective angle of attack / absolute angle of attack at cruise
Lift distribution at cruise
V-n gust diagram
V-n maneuver diagram
Longitudinal center of gravity
Take off rotation analysis
X-plot at cruise conditions
Side view layout of release mechanism geometry (before release)
Side view layout of release mechanism geometry (after release)
Top down location of attachment pins on Gryphon
Hook dimensions showing side and front views
Launch panel operator station
Main gear bogey isometric
xi ,IPltiC_liOtN_; PAGE BLANK NOT FILMED PA_E. Ii_TE_TiG_",_P,LL'/BLANK

8.2.2
8.2.3
8.3.1
8.3.2
8.3.3
8.3.4
8.3.5
8.3.6
8.4.1
8.4.2
8.5.1
8.5.2
8.5.3
8.5.4
8.5.5
8.6.1
9.2.1
10.2.1
10.2.2
Left fuselage lateral cross sections
Left fuselage longitudinal cross sections
Servo-actuator
Distribution of hydraulic power to flight controls
Distribution of hydraulic power to secondary systems
Schematic hydraulic diagram: left and right systems
Schematic hydraulic diagram: center and auxiliary systems
Hydraulic routing
Electrical system layout
Schematic electrical diagram
Lateral control layout
Longitudinal control layout
Directional control layout
Hight control cable layout
Throttle control layout
Fuel system layout
Cost per mission versus number of missions
Wind tunnel lift curve comparison with predicted results
Wind tunnel drag polar comparison with predicted results
Tables
3.2.1
3.3.1
3.4.1
3.4.2
3.4.3
3.4.4
3.4.5
5.1.1
5.1.2
5.4.1
5.5.1
5.8.1
5.8.2
5.8.3
Major airplaneparameters
Airplanecomparison
Thrustvaluesperengine
Drag polars
Performanceparameters
Horizontal tail parameters
Verticaltailparameters
Equivalent wing parameters
Aerodynamic parameters
Drag polars
Importantflapparameters
Pcaformanccresults
Minimum fuel mission performance
Ferry missionperformance
xii

6.1.1
6.2.1
6.4.1
7.2.1
7.3.1
7.3.2
7.3.3
7.3.4
7.3.5
8.1.1
8.1.2
8.3.1
8.3.2
8.3.3
8.3.4
8.3.5
8.3.6
9.1.1
9.1.2
V-n diagram parameters
Fixed equipment weights
Weight and balance summary
Aileron characteristics
Resultsof therollingmoment cocfficicntcalculation
Resultsof the side-forcecocfficicntcalculation
Resultsof the yawing moment coefficientcalculation
Verticaltailparameters
Force and moments forone engine-outduringtakeoff
SteelalloyASTM-A242 properties
Important system aspectsof theGryphon/Eclipse interface
Primary and secondary systems for theEclipse
Main characteristicsof hydraulicdesign
Characteristicsof hydraulicpumps
Hydraulic pump distribution
Emergency operationof secondary systems
Individualsystem functionsbreak-down
Airplanecostanalysisspecifications
Eclipselifecyclecost
o..
xln

(This page left intentionally blank.)
xiv

ACKNOWLEDGMENTS
The Aerospace 490/590 Advance Airplane Design team would like to thank the following people
without whose aid this project would not have been possible:
Dr. David Levy - for committing the time so we could undertake this project
John Blow - for his help as teaching assistant
Mr. Bob Lovell of OSC - for giving us the idea for this project
Prof. William Anderson - for his help with the wing weight calculations
W'Lancc Kallenberg - for his help generating the NC mill cutter paths
Prof. Peter Washabaugh - for his help with model fabrication
Mr. Terry Larrow - for his help with model fabrication
Mr. Warren Eaton - for his help with wind tunnel testing and model fabrication
Mr. Darren I_ Zceuw - for use of his Quadtree CFD code and for his help in boundary layer
modeling
Mr. Dennis Berry of Boeing - for providing us with useful methods in propulsion calculations
Mr. Ron Bengelink of Boeing - for helping us integrate the drag of the booster into the airplane
drag
and especially all those people who took Aerospace 481 in the Fall of 1992 and started us on this
journey:
Te un
Steve Battle
Mike Fisher
Enrique Garcia
Frank Gulczinski
Scot May
Kevin McGuirk
Rob Mitchell
Thuc Nguyen
Benjamin Plar_
Tract Scott
Guan Soh
Matt Taylor
Ryan Waddington
Matthew Wagn¢=
Charla Widme=
Bmtt Deutscher
Jeff Felkowski
Andrew Flotten
Roll Kappe
Kevin K.ilbum
Jack Kobus
Sara Lewis
Brian Nehez
Michael Ol
BilalRathur
Rance Stehower
CynthiaTart
Kcvin W'_amson
xv
d ._
"/ I ,vr.-'"-_n'," ' VPAGE/'S.-Z.-L--IN, c:'_I,u:'_,;-L- _k&._!K
PR_EC_DING PAG_ BLANK NOT FILMED

(This page left intentionally blank.)
xvi

1. INTRODUCTION
One way of reducing the total weight of a booster is to launch the booster from an airborne
platform. This allows for a lower booster vehicle weight for the same payload capacity. Among
the advantages to this approach are that the kinetic and potential energy of the airborne platform
are added to that of the space booster and that the launch takes place above a substantial portion
of the atmosphere so that aerodynamic drag forces are reduced. One such design is the Pegasus,
manufactured by the Orbital Sciences Corporation. The Pegasus has a total weight of 42,000
pounds and a payload weight of 900 pounds. It has been carded aloft and launched by a Boeing
B-52 and future launches are planned from a modified Lockheed L-101 I.
In the future there may be a market for an air launched booster an order of magnitude larger. A
space booster of this size would be capable of placing one or more satellites into geosynchronous
earth orbit or a heavy payload into low earth orbit. Such a large booster would require a new
airplane to be purpose buik for its launch since no current airplane could carry such a heavy
space booster to a high altitude. The design for such an airplane has been undertaken. This
report details almost ten months of work on this project.
The University of Michigan Aerospace 490/590 Advanced Airplane Design class has designed
the Eclipse, an aircraft whose primary mission is to act as a launch platform for a space booster
weighing 500,000 pounds. Other mission requirements include a mission radius of 750 statute
miles, a launch altitude of at least 40,000 feet, the ability to use existing airport facilities with
minimal or no modification, and use of materials and processes which are already in existence or
are planned for introduction in the very near future. Low cost for the airplane is also a priority
since an increased airplane cost could make the launch system uncompetitive.
This report presents the design of the Eclipse. First, the mission for which the airplane was
designed is presented, followed by an overview of the design. Then, the work in each of the
technical areas is presented in depth. Next, the wind tunnel testing is discussed. Finally, the
conclusions of the design team and some recommendations are presented.
F_iNG PAGE BLACiK NOT FILMEb_:T,r.'.,, ' E.LANI_° PAGE I,,]TE__,,_,J, LL_

(Thispage leftintentionallyblank.)
2

2. MISSION DESCRIPTION
2.1 Design Criteria
There are six main criteria for which the Eclipse is designed. These criteria are:
• The ability to carry a 500,000 pound payload which can be dropped in flight
• The ability to drop the payload above 40,000 feet
• A 750 statute mile mission radius
• The ability to perform a 2.2g post launch maneuver
• The ability to use existing airport facilities with minimal modification to the airport
• The use of existing production methods and equipment
Each of these criteria imposes a point for which an engineering design compromise must be
made.
The design analysis is performed for an aborted mission which imposes the harshest conditions
on the airplane. In the case of a last second aborted hunch, the Eclipse would have to return to
the airfield with the Gryphon attached since dropping such an expensive piece of hardware
would be ill-advised. This means higher drag and therefore higher fuel burn, as weLl as a higher
weight, for the return portion of the flight.
Planned airplane use is six missions per year over a ten year lifetime. The plan for six missions
per year is based on a market study of current demand for launches of similar class boosters. The
ten year lifetime is based on an estimate of when the next generation of space boosters will be in
use. Only two airplanes will be built. The first will be fully functional while the second will be
a structural spare, lacking avionics and engines.
2.2 Mission Profile
Figure 2.2.1 shows the mission profile which the Eclipse will perform. This mission is made
up of nine segments:
1. Engine start, warm-up, taxi, and take off
2. Climb to best cruise altitude and accelerate to best cruise Math number
3. Outbound cruise of 750 miles at best cruise altitude and best cruise Mach number
4. One hour loiter to prepare for launch
5. Launch maneuver designed for maximum booster/airplane separation
6. Inbound cruise of 750 miles at best cruise altitude and Mach number
PRECEtD4NG PACE P,LANK NOT FILMEDPAGE - W%--INTEP!T!ONALLYDLANK'"

7. Descent to sea level
8. One hour loiter to account for
9. Landing, taxi, and engine stop
cl reserve and any time spent in the landing pattern
4Fig. 2.2.1 Mission Profile
Performance calculations are based on this mission profile. Again, assuming an aborted
launch. Two other missions are considered, the minimum fuel mission and the ferry mission.
The minimum fuel mission does not have any cruise which allows for a higher launch altitude.
The ferry mission is a point to point cartage of the space booster.
4

3. CONFIGURATION DESCRIPTION
In order to meet the unusual mission specifications set out for the Eclipse, an unusual airplane
design has been developed. The Eclipse is a twin fuselage aircraft with the booster mounted
beneaththewing betweenthetwo fuselages.A conventionaltail-aftconfigurationisusedwitha
cruciformlayout.A high aspectratiowing isemployed to increasemaneuverabilityathigh
altitude.Six enginespower theEclipse.These enginesare a planned growth versionof the
GeneralElectricGE-90 ratedat100,000pounds of thrustattakeoff.Thischaptergivesa brief
overview of the Eclipse.
3.1 Design History
This design project began in the fall of 1992 at the suggestion of Mr. Bob Lovell from the
Orbital Sciences Corporation (OSC). OSC currently manufactures the Pegasus, a 42,000 pound
airlaunchedspaceboosterwitha payloadcapacityof900 pounds. Mr. Lovellsuggestedthatin
thefutureOSC might lookintoa boosterwhich isan orderof magnitudelarger.Such a large
boosterwould requirea purposebuiltaircraftsinceno currentproductionairplaneiscapableof
fulfillingthemissionrcquircrncnts.
The Aerospace 481 Airplane Design class began this project with each person in the 35
member class doing a basic layout and sizing for an aircraft capable of carrying a 250,000 pound
booster. This lower weight was chosen as it was not known if a realistic design was feasible
which could carry a 500,000 pound booster. The designs which were developed can be grouped
into three broad categories: the conventional designs, the twin fuselage designs, and the other
designs, which include flying wings and airplanes with elaborate schemes for conformaLly
mounting the payload. Based on each person's design, the class was split into two groups for a
continued design with a payload weight of 500,000 pounds. The increase to a higher weight was
warranted as the feasibility of the design goal was proven by the individual projects. One group,
consisting of people who looked at conventional designs, was tasked to design a conventional
airplane. The other group was asked to come up with a more unusual design and decided upon a
twin fuselage airplane. In the end, both designs had about the same characteristics: a weight of
about 1.4 million pounds and a wing span of about 300 feet. Along with that, each airplane had
its share of problems. For instance, the conventional design had a problem with landing gear
integration while the fuselages of the twin fuselage design could not carry the loads which would
be imposed on them. In addition, both airplanes had fuselage volume that was not put to any
good use.
5

In January of 1993, seven of the members of the Aerospace 481 class decided to continue the
design to scc ifa trulyfeasibledesigncould be formulated. The classwas formed under the title
Aerospace 490/590 Advanced Airplane Design. Since each existing design had itsshare of
problems, an analysiswas made as to which design should be continued. Also, a thirdairplane
design was reevaluatedatthispoint,the flyingwing. The flyingwing showed promise sinceit
does not have one of the big flaws in each of the other designs,wasted fuselage volume. The
classdecided topursue the flyingwing design and found thatstabilityand controlwas a problem
with thisdesign for thismission. Sent back to stepone, but much wiser about stabilityand
controlissues,the team decided to pursue a twin fuselagedesign sinceitshowed promise from a
landinggear and payload integrationstandpointand was alsomore aestheticallypleasing.
The twin fuselagedesign,named the Eclipse,was taken through a Class IIanalysis,plus some
specialanalysiswhen itwas deemed necessary. Afternearlytenmonths of work on the design,a
realisticde.signhas been formulated. This isthe designwhich ispresentedin thisreport.
The University of Michigan Aerospace System Design class designed the Gryphon, an air
launched space booster which can bc carried and launched by the Eclipse. There was a
significantamount of interchange between the classesin an attempt to optimize the system.
Details of the Gryphon can bc found in a summary paper (Appendix A) or in the Project
Gryphon finalreport.15
3.2 Configuration Overview
Table 3.'-.1 lists the major dimensions, weights, and performance numbers for the Eclipse.
Figures 3.2.1 and 3.2.2 present the top and front views of the airplane. Figure 3.2.3 shows two
longitudinalcrosssectionsof the leftfuselage.Figure 3.2.4isan isometricview of theEclipse.
3.3 Comparison with Existing Aircraft
Itisimportant to compare the Eclipse with existingaircraft.This servesboth to prove thatthe
resultsare reasonableand torcavow thatthe design criteriacannot be met by existingairplanes.
In Table 3.3.1,the Eclipse is compared with three other aircraft:the Boeing 747-400, the
Lockheed C-5A, and theAntonov An-225. Figure3.3.1presentsthiscomparison as a chart,witt,
each value norm_liTed to the Eclipse,which isassignedthe value I. Figure 3.3.2isa top view
which compares the sizeof the Eclipsewith a Boeing 747-400.
6

e
¢'q
tr.

.o
e,i
8

i
|
!o+w
.o
m
2e,i
++
9

Or_
°_
10

Table3.2.1 Major airplane parameters
WTO (lbf) 1,227,000 Length (ft)
Wp (lbf) 479,000* Height (ft)Wf 0bf) 241,000"* Sv (ft 2) each
OWE Obf) 541,000 Sh (ft 2)
S (ft 2) 11,750 TTO (lbf)b (ft) 368 T/W (-)A (-) 11.53 STO fit)
Ac/4 (°) 22.1 SL (ft)
W/S (lbf/ft 2) 104.4 hlaunch fit)
Vet (mph) 515
* University of Michigan Gryphon space booster
** includes 37,000 pounds of ramp fuel
188.6
62.4
950
3700
574,700
0.489
4,300
3,400
43,300
Table 3.3.1 Airplane comparison
Eclipse 747-400 C-5AWTO (Ibf) 1,227,000 870,000
Wp 0bf) 479,000 144,000
Wf (lbf) 241,000"* 387,000
OWE (lbf) 541,000 339,000
S (ft 2) 11,750 5,500b (ft) 368 211Length fit) 188.6 231.8Height fit) 62.4 63.4
W/S (Ibf/ft 2) 104.4 158.2
T/W (;). 0.489 0.28
An-225
837,000 1,323,000
261,000 344,000*332,500 N/A
243,500 N/A6,500 N/A
222.7 290247 275.6
65 59.3131 N/A
0.20 0.23
* this is the maximum payload that has been carried, published
Wp - 551,000 lbf
** this includes fuel burned prior to take off which is not included
in WTO, maximum Wf = 350,000 lbf
It is interesting to note that while the Eclipse would not be the heaviest airplane ever built, it
would have the largest wing span. The span surpasses even the Hughes H-4 Hercules, better
known as the "Spruce Goose", which has a wing span of 320 feet. It is also important to notice
that the An-225 could carry a payload of 500,000 pounds but, based on the performance with the
maximum payload carried to date, it would not be able to meet the altitude or range requirements
when doing so. The high thrust-to-weight ratio, necessitated by the altitude requirement,
translates directly into very good take off and climb performance. The low wing loading, also
necessitated by the altitude requirement, allows the post launch maneuver to be performed.
11

1.8"
1.6.
1.4.
1.2.
I.
0.8.
0.6.
0.4.
0.2.
i
Eclipse = 1 _ [] Boeing 747
_ .LockheedC-5A
Wto Wp Wf OWE S b W/S T/W
Fig. 3.3.1 Airplane comparison
3.4 Analysis Overview
As stated previously, the design was taken through a Class II analysis, plus some special
analysis where it was deemed necessary. The basic idea and major results of each area of
analysis is presented here.
3.4.1 Propulsion
The propulsion work centers on three items:
* engine selection
• sizing the nacelles and their placement on the wing
• determination of instafied thrust available
Engine selection for this airplane is simple since only one engine meets the criteria with only
six engines. The engine is a growth version of the General Elecu'ic GE-90 rated at 100,000
pounds of thrust at take off.
Engine nacelle sizing is based on the physical dimensions of the engine and the air flow needed
into the engine for p: ._per engine operation. The sizing is done using existing methods which
minimize losses and interference effects.
12

e-.0
E0
_S
ce_
Lm
13

Thrust losses due to installation effects are calculated using empirical formulas for mechanical,
electrical, and pneumatic extraction. The installed thrust curves are then available for
performance calculations. Table 3.4.1 lists some of the example thrust numbers.
Table 3.4. I Thrust values per engineUninstalied TTO (Ibf) (M = 0, h = 0 ft)
Installed TTO (Ibt3Uninstalled Tcr (Ibf) (M = 0.78, h = 39,000 ft)
Installed Tcr Obf)
100,000
95,80014,400
14,100
3.4.2 Aerodynamics
The aerodynamics calculations focus on four issues:
* airfoil selection
* drag calculations
- flap sizing
. performance analysis
The airfoil selectionis made to minimize drag while maximizing the liftfor the criticalparts of
the mission. The airfoilis a NASA 14.-percentthick supcrcriticalairfoil.The aerodynamic
characteristicsof the airfoilwith variationof angle of attackmust alsobe known. To thisend, a
computational fluid dynamics (CFD) code is employed to supplement the semi-empirical
methods. The CFD method employed is not successfulfor finding stall,but does supply a
transitionpointwhich isused on thewind tunnelmodel.
Drag polar determination is based on semi-empirical methods which focus on wetted area.
Them isalsoa need toaccount forthe interferencelossesassociatedwith the payload mounted so
closeto thewing. Table 3.4.2highlightsthedrag polars.
Flaps are sized to meet take off and landing speed criteria. Along with size, the most
appropriate type of flap must be chosen. A single slotted Fowler flap with an area of 670 ft2 is
employed for this application.
Performance analysis is done, in conjunction with the propulsion work, to fmd the location,
speed, and attitude of the airplane at any given moment during the flight. This allows for an
accurate calculation of the fuel needed to complete the mission. Table 3.4.3 lists some of the
important performance parameters.
14

Table 3.4.2Dra[_polars
CLot cr (M = 0.78)8.827
Cruise (M - 0.78, h = 40,000 ft w/Gryphon)
Cruise (M = 0.78, h = 40,000 ft clean)
Loiter (M = 0.78, h = 44,000 ft w/Gryphon)
Loiter (M = 0.45, h = 10,000 ft clean)
CD = 0.0170 - 0.0012CL + 0.0390CL 2
CD = 0.0150 - 0.0011CL + 0.0364CL 2
CD = 0.0146 - 0.0016CL + 0.0397CL 2
CD = 0.0144 - 0.0052CL + 0.0414CL 2
Table 3.4.3 Performance parameters
STO (ft) 4,300SL fit) 3,400hlaunch (ft) 43,300nlaunch turn 2.2grlaunch turn (ft) 9200tmis._ion 6 hr 55 min
3.4.3 Structures and weights
The structures and weights calculations look into four items:
• V-n diagram
• component weights
• longitudinal center of gravity
• structtnal considerations
The V-n diagram is needed to determine the loads acting on the airplane during flight. Two are
made, one is for forces acting during an airplane maneuver while the other is for gust induced
loads.
Component weight estimations are made using semi-empirical methods, analytical methods, or
manufacturer supplied data. These values are calibrated with actual production aircraft to
improve the accuracy of the prediction.
Longitudinal center of gravity calculation is made by assigning each airplane component a
center of gravity. These can then be used, in conjunction with the component weights, to find
the airplane center of gravity. The center of gravity is 53.43 feet behind the forward most point
of the wing. The fuel and payload centers of gravity arc coincident with the airplane center of
gravity to eliminate shifts during the course of the mission which may worsen performance.
15

Other structural considerations, such as sizing of wing spars and fuselage pieces, are also
considered. These include closing the fuselage section for greater structural strength and the
number of spars in the wing.
3.4.4 Stability and control
Stability and conlzol is concerned with two issues:
• longitudinal stability
• lateral and directional stability
Longitudinal stability involves sizing the horizontal tail to allow for take-off rotation, trim at
cruise, and static margin at cruise. Pertinent horizontal taft parameters are listed in table 3.4.4.
Table 3.4.4 Horizontal taft parameters
Sh (ft 2) 3700
_'cg h (.) 5.81"
_ac h (.) 5.68*
lh(ft) I17.0
SMcr (%) 5.2
SMTO (%) 14.4
* measured from 50 feet in front of the forward
most point of the wing
Lateral and directionalstabilitysizesthe verticaltailto limitairplanerollingmoment, side
force,and yawing moment. There isalsoa criticalsizingof the verticaltailstomaintain control
in a one engine-out flightconditionduring takeoff rotation.Table 3.4.5documents severalof
theimportant verticaltailand one engine-outparameters.
3.4...q Systems
Six main airplane systems are designed:
• payload integration
• landing gear
• hydraulic system
• e.ctrical system
• _..ight c ntrol system
• fuel system
16

In addition,severalissuesrelevantto the crew, such as visibilityand crew training,axe
discussed.
Table 3.4.5 Vertical tail parameters
Sv (ft 2) each 950
_cg v (.) 5.48*
ZaCv (-) 5.38*
lv (ft) 94.86
Cn13 (rad -1) 0.1556
Cl13(tad "1) -0.1297
One engine-out _ (0) 4.0
One engine-out 13(°) 5.0
One engine-out/SR (o) 25.4
One engine-out [iA (o) 7.4
Vmc (ft/sec) 231
* measured from 50 feet in front of the forward
most point of the wing
3.4.6 Cost Analysis
Finally, what can make or break a design, its cost, is analyzed. A cost to build only two
airplanes is formulated. This amounts to $1.715 billion for the one flying airplane and one
structural spare, or an airplane cost of $28.6 million per mission for a 60 mission lifetime.
Including the $22.1 million cost to buy a Gryphon, the launch cost comes to $50.7 million which
is very competitive with today's launch systems.
17

(This page left intentionally blank.)
18

4. PROPULSION
4.1 Introduction
The goal of propulsion integration is to ensure that the propulsion system is well designed
based on the mission goals and the requirements imposed by other aircraft components. In order
to accomplish this goal, three primary tasks need to be completed. The assumptions made in
propulsion integration to complete these tasks and the methods that are employed are detailed in
the following discussion. The three tasks arc:
• Engine selection
• Engine nacelle sizing
• Determination of instaUed thrust available
4.2 Discussion
The first step in the work is to decide what power plant should be used for the Eclipse. Due to
the extreme thrust requirements for this aircraft, six General Electric GE-90 engines are used
which, in a growth version, are expected to produce more than 100,000 pounds of thrust each.
Since the time of engine selection, General Electric has tested the 87,400 pound thrust variant of
the GE-90 at 105,400 pounds thrust which bodes well for an engine capable of meeting our
specifications being produced. The methods used are from references which supply the detailed
methods used in sizing the engine nacelles and determining the installed thrust available. 6,9
4.2.1 Engine nacelle sizing
The first step in sizing the engine nacelle is to determine the engine inlet area, Ac, using:
Ac =rna (4.2.1)p. U1
where:
a = engine air mass flow [slug/see]
p = air density [slug/ft 3]
U 1 = air velocity [ft/sec]
With engine data received from General Electric, th a is determined from the fan flow rate to
be 104.03 slug/see. With an assumed take off speed of 288 ft/sec at sea level standard
conditions, the inlet area is calculated to be 161.17 ft 2. This translates into an inlet diameter of
14.33 feet.
pREC.,EU4NG PAGE BLANK NOT FILMED
19

The other dimensions of the nacelle are determined based on the size of the GE-90 engine and
dimensional comparisons with the General Electric CF6-32C. The relationships of the nacelle to
the pylon and wing are based on nacelle location graphs with parameters chosen to minimize
interference drag.6, 9 These parameters are determined as fractions of the wing chord length.
The nacelle and pylon dimensions are shown in Figures 4.2.1 and 4.2.2, the side and front views.
t53"
IT149" 125"
1±36"
306" _
1rear spar
Wing NOT to scale
Fig.4.2.1Nacelle and pylon sideview
24 "
--4_
I II I
5y' t... 1
149"
_.J
Fig.4.2.2Nacelle and pylon frontview
2O
• :-, _5-

In order to minimize interference effects which would lower engine efficiency, the nacelles arc
placed with approximately one and a quarter nacelle diameters between them. One and a quarter
nacelle diameters are also left between the fuselages and the inboard nacelle for the same reason.
4.2.2 Determination of Installed Thrust Available
The first step in determining the installed thrust available is to calculate the power extracted
due to mechanical extraction, electrical extraction, and pneumatic extraction. This is done using
the following semi-empirical equations: 6
Pextracted = Pelectrical + Pmechanical + Ppneumatic (4.2.2)
Pelectrical = 0.00070WTO (4.2.3)
Pmechanical = 0.00060WTO (4.2.4)
P,nou==°\ m a j_ 550 J
riablee d = k. riaa
where:
Pextracted = extracted power [hp]
Pelectrieal = electrical power required by the airplane [hp]
Pmechanical = mechanical power required by the airplane [hp]
Ppneumatic = pneumatic power required by the airplane [hp]
WTO = take off weight [Ibf]
riablee d = bleed air mass flow [slug/sec]
Treqd = thrust required [lbf]
k = bleed air constant
(4.2.5)
(4.2.6)
In this case, the bleed air constant equals 0.015. This value is due to the fact that there are no
deicing requirements for this airplane and only a small cabin must be pressurized. The values for
power extracted are determined at the take off weight for various velocities. These values are
shown in Figures 4.2.3 and 4.2.4.
The second step in determining the installed thrust available is to find the uninstalled thrust
available. This data is acquired from a GE-90 cycle deck run which can be found in Appendix
D.16
21

2200.
o
sea lcvcl/std day
2000 ft/std day
4000 ft/std day
0E+0 0.1 0.2 0.3 0.4
Maeh Number
Fig. 4.2.3 Power exlxacw,,cl at take off for various field altitudes at standard conditions
/ r'_ "_) "i
2400.....
a, _...4 -.-42000.
o o d d
Math Number
m
-O--
--4---
-4--
--0--
sea level/sKi day
5000 ft/std day
1(30(O ft/std day
150(30 ft/std day
20000 ft std/day
25000 ft/std day
30000 ft/std day
35000 ft/std day
40000 ft/std day
45000 ft/std day
50000 ft/std day
55000 ft/std day
Fig. 4.2.4 Power cxtract_ at maximum climb ram for various altitudes at standard conditions
22

The final step is to determine the installed thrust available using the following equation: 6
where:
Tar = installed thrust available [lbf]
Ttst/av = uninstalled thrust available [lbfl
kT = constant
M 1 = flight Mach number
rlinl/inc = inlet efficiency
(4.2.7)
However, the thrust data received from General Electric accounted for the pressure drop across
the engine (71inl/inc = 1), so the equation is reduced to:
_ 550(P_xtracted _
Tav = Ttst/av _, U1 ) (4.2.8)
This calculation is performed at various velocities and altitudes, and the results are shown in
Figure 4.2.5. The curves are extrapolated to cover the entire Mach number range at each altitude
for use in performance calculations.
8O00O
6OO00
o')
_a)ooo
_qmm _ ;ib qm' _,mm a
m _ _ Qmlm,mm m qb m q_m _,_ '_!
I imb qmm_, im_ q_ Illh qmDv i_ _m me m
mmmmwmmmmmmmmm_
mmmmm|_
mmm_mto_mmmmmm_mmmimmmimwmmlm_
_. m m m
- - _- -
oe_m_
_m_mmi
_mlamm
_mlmmm
m 0 fts_l
• 5000 ft attd
• 10(_0 ft ial
• 15000 ft std
• 20000 ft s_
m 25000 ft sat
• 30000 ft s_l
s 35000 ft std
• 40CI00 ft std
4. 45000 R aad
• 50000 R aad
OJ 0.4 0.5 0.6 0.7 0 0.9
Mach Number
Fig. 4.2.5 Installed thrust available at maximum climb for various altitudes at standard conditions
23

(Thispageleft intentionally blank.)
24

5. AERODYNAMICS
Aerodynamics is concerned with the flow of air around the airplane. In addition,the
performance calculationsand sizingof theliftingsurfacesfallunder the auspicesof aerodynamics.
The aerodynamics calculationsfocus on fourissues:
• airfoilselection
• dragcalculations
• flapsizing
• performance analysis
5.1 Assumptions & Pertinent Data
5.1.1 Equivalent wing drawing
For calculations involving the lift curves and drag polars, an aerodynamically equivalent wing is
used. Table 5.1.1 lists the parameters of this equivalent wing.
Table 5.1.1 Equivalent wing parameters
S (ft 2) 11750A (-) 11.53b (ft) 368
_, (_) 0.19
Cr (ft) 53.64Ct (ft) 10.2
ALE (*) 25
Figure 5.1.1 shows a drawing of the equivalent wing along with the actual wing. Note that
although the trailing edges are very close, they are not at the same sweep angle. The equivalent
wing has a slightly smaller trailing edge sweep angle to account for the area lost by not having a
yehudi.
5.1.2 Important numbers
Some important parameters used in the aerodynamics calculations are found in Table 5.1.2. A
1.5 ° angle of incidence for the main wing was used, as this is the cruise angle of attack of the main
wing.
piittiCiil)iNG PAGE BLANK NOT FI__MED 23IPAGE , INTE_EIONALLYBLANK

_dp
v
m
olu
0
ca
_P
|
_Dem
26 _

Table 5.1.2Aerodynamic parametersMcr (-) 0.7 8
VTO (R/sec) 231
VL (ft/sec) 240.5
Vstall(ft/sec) 210
Vmc (f-t/sec) 231
5.1.3 Planform drawings of aerodynamic surfaces
Figures 5.1.2, 5.1.3, and 5.1.4 show the planform drawings of the main wing, horizontal tail,
and verticaltail, respectively.
5.2 Airfoil Selection & Data
The airfoil is a NASA supercritical 14-percent thick airfoil. 10 The reason for this choice is
largely due to critical Mach number (Mcr) considerations. Due to the immense wingspan of this
airplane, the sweep must be mild to tighten the structure. Since the Eclipse will cruise at M = 0.78,
a supercritical airfoil is necessary to minimize wave drag. A leading edge sweep angle of 25 ° is
chosen. For a normal force coefficient of 0.75, significant wave drag is not encountered until
about M = 0.73. At cruise, Meff = 0.78.cos(25") = 0.707, which is below Mcr.
As can be seen from the numbers just presented, a sweep of 25 ° is not needed. In fact, a sweep
of only 20.6 ° is necessary. The extra 4.4 ° of sweep is used for two reasons. First, since the cruise
altitude and speed were not f'Lxed at the outset, a buffer was desired. Second, since the shape of
the Eclipse's airfoil almost certainly will not be to the same tolerances as the test airfoil due to
inaccuracies in manufacturing such a large wing, it was desirable to add a factor of safety.
The shape of this airfoil is shown in Figure 5.2.1. The lift curve and drag polar for this airfoil at
M = 0.71 are given in Figures 5.2.2 and 5.2.3. From the lift curve shown in Figure 5.2.5, Clot -
10.007 and ctol = -2.955 °. This scales by a Prandtl-Glauert transformation to Clo_ = 7.047 and
ou)l = -2.955 ° at M = 0.
As can bc seen from Figure 5.2.2,thereisno availabledataforthisairfoilinthe nonlinearrange
of angle of attack.For thisreason,a computationalfluiddynamics (CFD) code isused toattempt
to simulate separation.19 More specifically,an Eulcr method isfirstused to solve the inviscid
flow solution. From these results,Thwaite's method is used to evaluate the boundary layer
behavior. Since thisversion of Thwaitc's method estimatesa laminar boundary layer,itwill
predictseparationbefore the actualseparationpoint. However, turbulentflow models thatare
27

|
_L_D
28

C_
c¢)
_ tJ
@@
('_Ch
m_L.
i
ioim
[..mmii
C
oi
L-0
[]
|
,!q
L--
Ii
6Tw
2g
r_
_ <_l_Y,x_>_
oLr_
m...
ataNN
m
[..
qwl
g
L_
earn
IT,
3O

_ c_ QL
1
o
s'salr_.-UL
m
o,
I
c_
"0k,,0
,4=
0
(.J_J
0i_.
<:!
,,,.N
:=
31

I I I I I
_I ,u OQ T_O '_"
!
t
c_
Lt_
Lf_
"7
Q
°_
.I"-
±
J_
f_
°_it
,-I!
c_
L_
32

l I I I
O,I
T°
I
o
o.
r_
B.4-
.<
.<z
_o
m
0
c_
!
o_
33
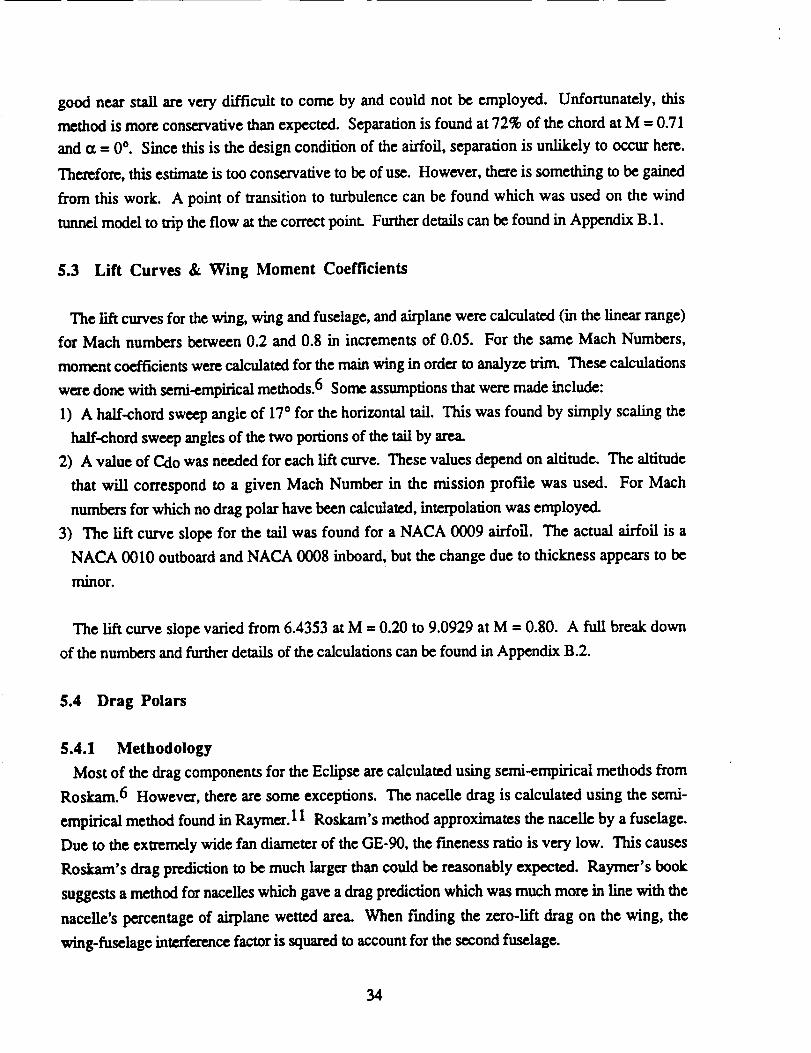
good near stallare very difficultto come by and could not be employed. Unfortunately, this
method ismore conservativethanexpected. Separationisfound at72% of the chord atM = 0.71
and (z= 0°. Since thisisthe design conditionof the airfoil,separationisunlikely to occur here.
Therefore,thisestimateistoo conservativeto bc ofuse. However, thereissomething tobe gained
from thiswork. A point of transitionto turbulcncecan bc found which was used on the wind
tunnelmodel totriptheflow atthecorrectpoint.Furtherdetailscan bc found in Appendix B.I.
5.3 Lift Curves & Wing Moment Coefficients
The liftcurvesforthewing, wing and fuselage,and airplanewere calculated(inthe lincarrange)
for Mach numbers between 0.2 and 0.8 in increments of 0.05. For the same Mach Numbers,
moment coefficientswere calculatedforthemain wing inordertoanalyzetrim. These calculations
were done with semi-empiricalmethods.6 Some assumptionsthatwere made include:
1) A half-chordsweep angle of 17°for the horizontaltail.This was found by simply scalingthe
half-chordsweep anglesof thetwo portionsof thetailby area.
2) A value of Cdo was needed foreach liftcurve. These valuesdepend on altitude.The altitude
thatwill correspond to a given Mach Number in the mission profilewas used. For Mach
numbers forwhich no dragpolarhave been calculated,interpolationwas employed.
3) The liftcurve slope for the tailwas found for a NACA 0009 airfoil.The actualairfoilisa
NACA 0010 outboard and NACA 0008 inboard,but the change due to thicknessappears to be
minor.
The liftcurve slopevariedfrom 6.4353 atM = 0.20 to9.0929 atM = 0.80. A fullbreak down
of thenumbers and furtherderailsofthecalculationscan bc found in Appendix B.2.
5.4 Drag Polars
5.4.1 Methodology
Most of the drag components forthe Eclipsearecalculatedusing semi-empiricalmethods from
Roskarn.6 However, thereare some exceptions.The nacelledrag iscalculatedusing the semi-
empiricalmethod found in Raymer.l I Roskam's method approximates thenacelleby a fuselage.
Due to the extremely wide fan diameter of theGE-90, the finenessratioisvery low. This causes
Roskarn's drag predictionto be much largerthan could bc reasonably expected. Raymer's book
suggestsa method fornacelleswhich gave a drag predictionwhich was much more inlinewith the
naccllc'spercentage of airplanewetted area. When findingthe zero-liftdrag on the wing, the
wing-fuselage interferencefactorissquared toaccountforthesecond fuselage.
34
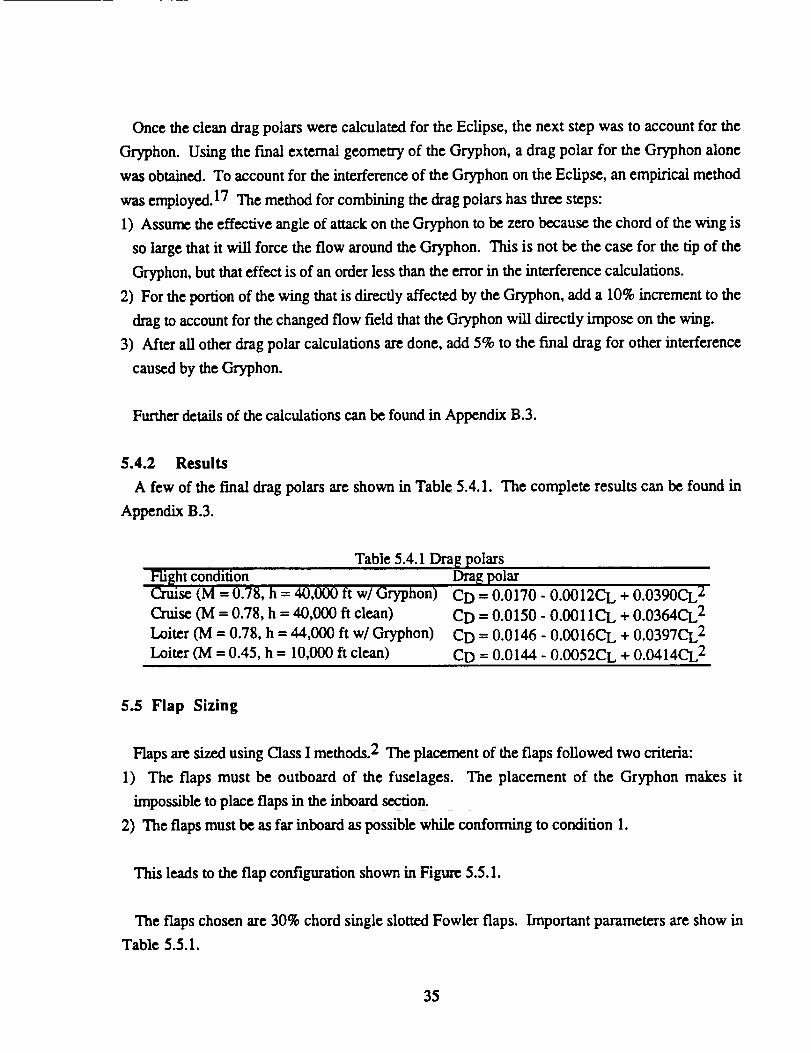
Once the clean drag polars were calculated for the Eclipse, the next step was to account for the
Gryphon. Using the final external geometry of the Gryphon, a drag polar for the Gryphon alone
was obtained. To account for the interference of the Gryphon on the Eclipse, an empirical method
was employed. 17 The method for combining the drag polars has three steps:
1) Assume the effective angle of attack on the Gryphon to be zero because the chord of the wing is
so large that it will force the flow around the Gryphon. This is not be the case for the tip of the
Gryphon, but that effect is of an order less than the error in the interference calculations.
2) For the portion of the wing that is directly affected by the Gryphon, add a 10% increment to the
drag to account for the changed flow field that the Gryphon will directly impose on the wing.
3) After all other drag polar calculations are done, add 5% to the final drag for other interference
caused by the Gryphon.
Further details of the calculations can be found in Appendix B.3.
5.4.2 Results
A few of the final drag polars are shown in Table 5.4.1. The complete results can be found in
Appendix B.3.
Table 5.4.1 Drag polars
Flight conditionCruise (M : 0.78, h = 40,000 ft w/Gryphon)
Cruise (M = 0.78, h = 40,000 ft clean)
Loiter (M = 0.78, h : 44,000 ft w/Gryphon)
Loiter 0Vl = 0.45, h = 10,000 ft clean)
Drag polar
CD = 0.0170 - 0.0012CL + 0.0390CL 2
CD = 0.0150 - 0.0011CL + 0.0364CL 2
CD = 0.0146 - 0.0016CL + 0.0397CL 2
CD = 0.0144 - 0.0052CL + 0.0414CL 2
5.5 Flap Sizing
Flaps are sized using Class I methods. 2 The placement of the flaps followed two criteria:
1) The flaps must be outboard of the fuselages. The placement of the Gryphon makes it
impossible to place flaps in the inboard section.
2) The flaps must be as far inboard as possible while conforming to condition 1.
This leads to the flap configuration shown in Figure 5.5.1.
The flaps chosen are 30% chord single slotted Fowler flaps. Important parameters are show in
Table 5.5.1.
35

t"q
36

Table 5.5.1 Important flap parameters
Sflaps 1346.4 ft2cf/c 0.3
5TO 200
VTO 286 ft/s
WTO 1265000 lbf
_L 45°
Vstall 185 ft/s
Vapp 240.5 ft/sWL 1265000 lbf
ACLmax 1.18
5.6 Thrust Required
To find the thrust required, the following formulas are employed:
W
C L = ½P.S.V 2
C D = Cdo + Cdi 1 •CL + Cdi 2 •CL 2
Tre q =D=½P-S.V 2.C D
[ w i wll.'. Treq = 22-p•S-V 2 Cdo + Cdil ½p. S-V 2 + Cdi2 p.S. V 2
(5.6.1)
From the drag polar, weight, wing area, altitude, and velocity, thrust required is obtained.
5.7 Spanwise Lift Distribution
To analyze the high angle of attack characteristics of the Eclipse, it is necessary to know the angle
of attack at which the wing will begin to stall. It is therefore assumed that the wing would begin to
stall when the effective angle of attack of any section of the wing reached the maximum angle of
attack for our airfoil. To find this effective angle of attack, Prandtl's lifting line theory was refined
to account for wing sweep. The result is shown in Figure 5.7.1 which shows:
a e..,= f(y) (5.'/.1)
where oto is the effective angle of attack and ota is the absolute angle of attack:
37

cta=a-tzol
where a isthegeon_Izicangle ofattackand aol isthez_q>liftangleof attack.
(5.7.2)
This data and the wing planform leads directly to Figure 5.7.2, the spanwise lift disu-ibution
across the wing.
5.8 Performance Analysis
The purpose of this analysis is to predict the airplane position, weight and flight attitude, i.e. lift-
to-drag ratio and angle of attack at any given moment of the mission from the beginning to the end
of the flight. Calculations are based on structural weight, propulsion, and aerodynamic analysis
results. Ig The complete method for performance calculations is found in Appendix C.
The most unfavorable scenario, an aborted launch mission with both loiters, is assumed.
With engine data from the manufacturer, it is possible to obtain the fuel flow, and hence the
specific fuel consumption, for any power setting, at any altitude. The weight of fuel burned can
then be determined, for a given interval of time or distance traveled.
To ensure refiable results, instead of using Class H methods, a more precise approach is applied:
analyzing individual distance or time breakdown, depending on the mission portion being
analyzed. By upgrading the airplane weight, drag polar values and flight altitude after each
breakdown, it is possible to calculate the new thrust and lift necessary, and hence the new flight
condition. The advantage of this method is that many of the values that had to be otherwise
assumed in a Class H analysis (such as average specific fuel consumption, thrust required, time to
accomplish each mission portion, required angle of attack, lift-to-drag ratio, altitude) can now be
determined.
With a three-coordinate system (0x as the horizontal distance and Oz as the altitude), it is not only
possible to compute the flight path velocity, but also the rate of climb and/or descent, during any
mission portion.
Two other mission scenarios are studied as well. In the ferry mission, the space booster is
unfueled and the extra payload capacity is used to carry fuel for the Eclipse. The maximum fuel
load of 3.50,000 pounds is carried. Instead of a gradually climbing cruise, the cruise is assumed to
be at a constant altitude of 35,000 feet. In the minimum fuel mission, there is no cruise segment.
38

I i l I I I i
c_ c_
I
0
0_
0_
39

•/I I t t 1
(_/Jql) _.r'l lWUO.t_aS
m
|
ig_
0
¢".4
¢.P3°_
0
r_
°_
u"..
°_
4O

Any range from the airfield comes from the distance covered during the climb. Since the Eclipse
has a lower weight, a higher launch altitude is possible.
5.8.1 Analysis results
Important results of the performance analysis are contained in Table 5.8.1. The results of the
minimum fuel and ferry mission performance analysis are found in Tables 5.8.2 and 5.8.3,
respectively.
Table 5.8.1 Performance results
Wramp (lbf) 1,264,000WTO 0bf) 1,227,000
Wfuel Obf) 241,000
STO (ft) 4,300
SL fit) 3,400
SLemer en (ft) 3,900g cyVtouch down (ft/sec) 221
Vet_._gencytouch down (ft/sex:) 241
hlaunch(ft) 43,300
nlaunch mm (g) 2.2
rlaunchturn(ft) 9,200
tmis_ion 6 hr 55 rain
Table 5.8.2 Minimum fuel mission performanceWto (lbf) 1,143,000
Wfuel Obf) 157,000
hlaunch (ft) 45,800
rlaunch turn (ft) 11,500
tmission 4 hr 11 rnin
Table 5.8.3 Ferry mission performance:Wto Obf) 1,135,000
h_ (lbf) 278,000(ft) 35,000
Range (mi) 4,300tmission 11 hr 14 rain
5.8.2 Comments
The take off field length is very short, in comparison to the average length (approximately 9,000
to 11,000 feet) for commercial and military carrier airplanes. This is because the Eclipse is
overpowered at take off, due to the fact that the design requirement is to lift a 500,000 pound
payload to above 40,000 feet. The total field length is based to clear a 35 foot high obstacle at the
end of the flare arc, for both a soft or hard maneuver. Accelerating force takes into account thrust
41
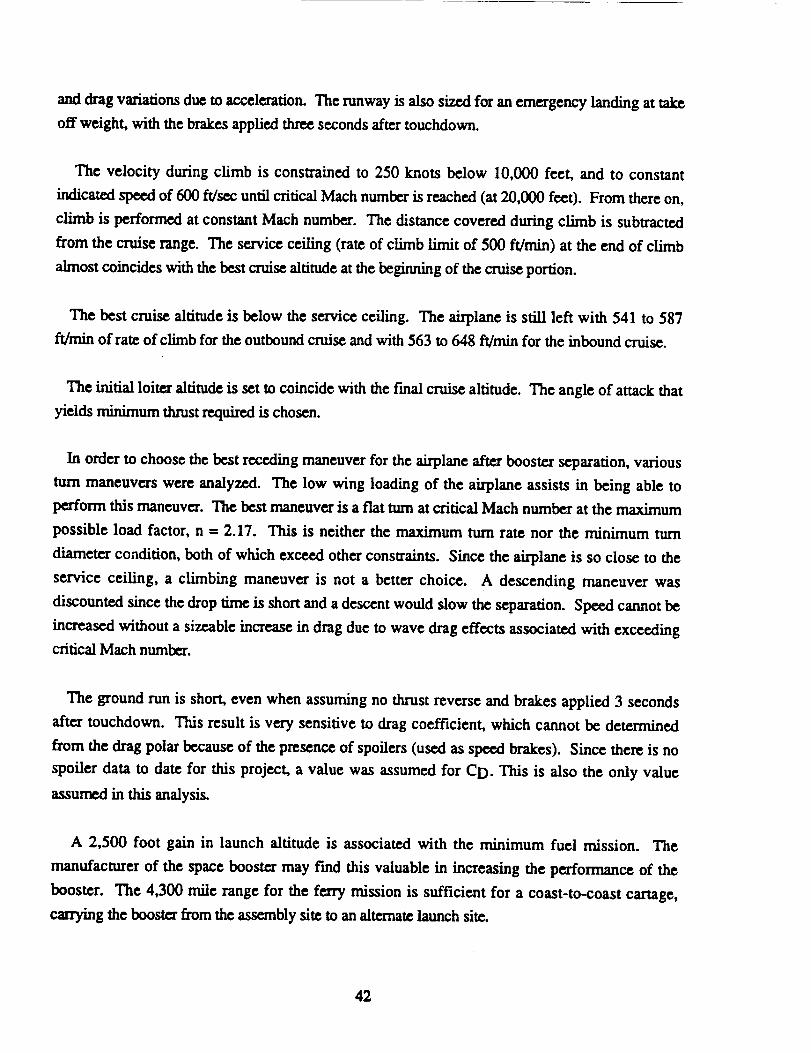
anddragvariationsdueto acceleration.The runway is also sized for an emergency landing at take
off weight, with the brakes applied three seconds after touchdown.
The velocity during climb is constrained to 250 knots below 10,000 feet, and to constant
indicated speed of 600 ft/sec until critical Mach number is reached (at 20,000 feet). From there on,
climb is performed at constant Mach number. The distance covered during climb is subtracted
from the cruise range. The service ceiling (rate of climb Limit of 500 ft/min) at the end of climb
almost coincides with the best cruise altitude at the beginning of the cruise portion.
The best cruise altitude is below the service ceiling. The airplane is still left with 541 to 587
ft/min of rate of climb for the outbound cruise and with 563 to 648 fffmin for the inbound cruise.
The initial loiter altitude is set to coincide with the final cruise altitude. The angle of attack that
yields minimum thrust required is chosen.
In order to choose the best receding maneuver for the airplane after booster separation, various
turn maneuvers were analyzed. The low wing loading of the airplane assists in being able to
perform this maneuver. The best maneuver is a flat turn at critical Mach number at the maximum
possible load factor, n = 2.17. This is neither the maximum turn rate nor the minimum turn
diameter condition, both of which exceed other constraints. Since the airplane is so close to the
service ceiling, a climbing maneuver is not a better choice. A descending maneuver was
discounted since the drop time is short and a descent would slow the separation. Speed cannot be
increased without a sizeable increase in drag due to wave drag effects associated with exceeding
critical Mach number.
The ground run is short, even when assuming no thrust reverse and brakes applied 3 seconds
after touchdown. This result is very sensitive to drag coefficient, which cannot be determined
from the drag polar because of the presence of spoilers (used as speed brakes). Since there is no
spoiler data to date for this project, a value was assumed for CD. This is also the only value
assumed in this analysis.
A 2,500 foot gain in launch altitude is associated with the minimum fuel mission. The
manufacturer of the space booster may find this valuable in increasing the performance of the
booster. The 4,300 mile range for the ferry mission is sufficient for a coast-to-coast cartage,
carrying the booster from the assembly site to an alternate launch site.
42
6. STRUCTURES & WEIGHTS
Structures and weights work focuses on designing adequate structure to take the loads imposed
on the aircraft and subsequently estimating the weight of the structure. In addition, center of
gravity calculations are done. The structures and weights work is focused on four main issues:
• V-n diagram
• Component weights
• Longitudinal center of gravity
• Structural considerations
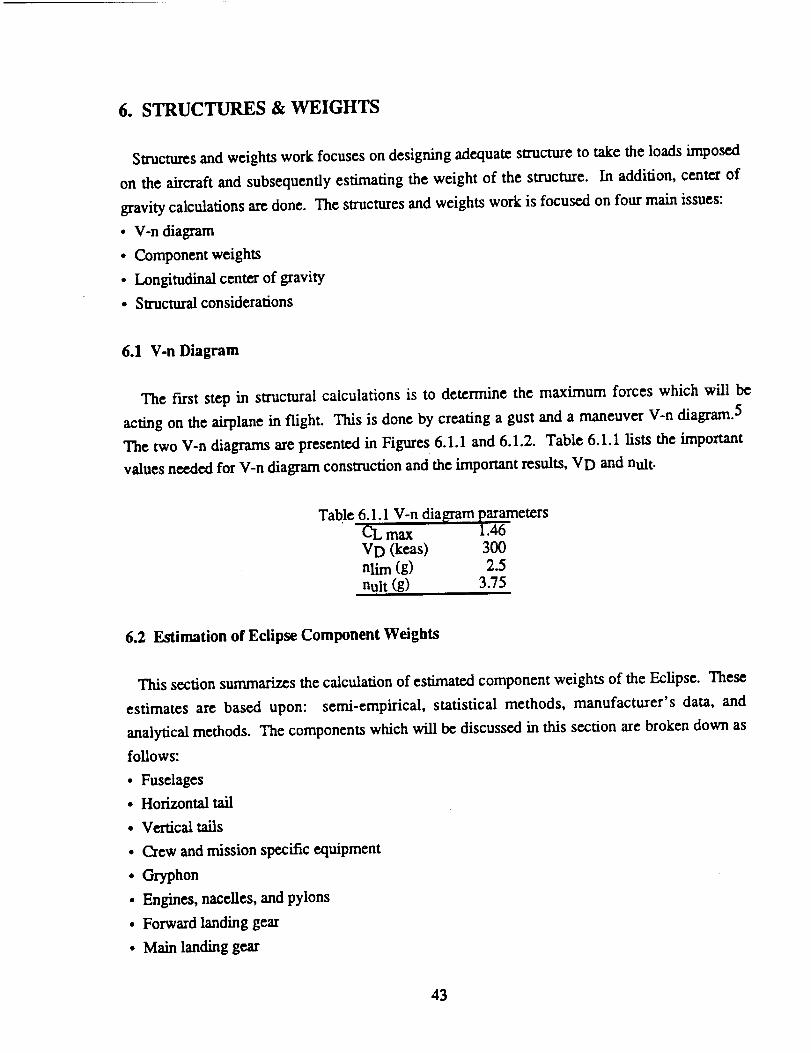
6.1 V-n Diagram
The first step in structural calculations is to determine the maximum forces which will be
acting on the airplane in flight. This is done by creating a gust and a maneuver V-n diagram. 5
The two V-n diagrams are presented in Figures 6.1.1 and 6.1.2. Table 6.1.1 lists the important
values needed for V-n diagram construction and the important results, VD and nult.
Table 6.1.1 V-n diagram parameters
CL max 1.46
VD (keas) 300
nlim (g) 2.5
nult (g) 3.75
6.2 Estimation of Eclipse Component Weights
This section summarizes the calculation of estimated component weights of the Eclipse. These
estimates are based upon: semi-empirical, statistical methods, manufacturer's data, and
analytical methods. The components which will be discussed in this section are broken down as
follows:
• Fuselages
• Horizontal tail
• Vertical tails
• Crew and mission specific equipment
• Gryphon
• Engines, nacelles, and pylons
• Forward landing gear
• Main landing gear
43

AIII
J
3
2.5
2
1.5
1
0.5
0
-0.5
-1
-1.5
0
_VD gust line+ t
50 100 150 200 250 300
V (kea$)
350
Fig. 6.1. ] V-n gust diagram
A
V
m
3
2.5
2
1.5
1
0.5
0
-0.5
-1
-1.5
0 50 100 150 200 250 300
V (keas)
Fig. 6.1.2 V-n maneuver diagram "
350
44

• Fixed equipment
• Mission fuel
• Main wing
The fuselage weight is calculated using semi-empirical methods consisting of Raymer's
method for cargo/transport weights, 11 and Torenbeek's method for transport airplanes. 5 The
results for each of these methods is calibrated for an MD-80 fuselage, which is slightly smaller in
diameter, but the same overall length. This analysis yields an average weight for two fuselages
of 85,200 pounds.
The horizontal and vertical tail weights are each evaluated using three different semi-empirical
methods. The results of these three methods are averaged and then calibrated using the
empennage weight of a C-5 Galaxy. The six equations used are:
• General Dynamics (GD) method for commercial transport airplanes (horizontal tail) 5
• Torenbeek method for transport airplanes (horizontal tail) 5
• Raymer method for cargo/transport weights (horizontal tail) 11
• GD method for commercial transport airplanes (vertical tail) 5
• Torenbeek method for transport airplanes (vertical tail) 5
• Raymer method for cargo/transport weights (vertical tail) 11
The weights for the horizontal tail are averaged, as are those for the two vertical tails. The
combined average empennage weight is then calibrated using a correction factor of 0.85, derived
from the empennage weight of the Lockheed C-5A. This analysis yields a horizontal tail weight
of 28,100 pounds and a weight for two vertical tails of 14,800 pounds.
A 2,000 pound allowance is made for the three crew members and any Gryphon specific
equipment which must be placed in the cockpit of the Eclipse.
The weight of the Gryphon is set at the final design weight of 479,000 pounds. 15
The combined weight of engines and nacelles is provided by General Electric Aircraft Engines
and set at 22,000 pounds each. 16 An additional 1,000 pounds is allowed for the weight of each
engine pylon. This yields a total weight for six engines, nacelles, and pylons of 138,000 pounds.
A conservative estimate for landing gear weight is made using Torenbeek's method for
Commercial Transport Airplanes. 5 This estimate is based on a gross take off weight of
45

1,460,000pounds and was not iterated as take off weight decreased. The result is calibrated
using the landing gear weight of the Lockheed C-5A. This method yields a weight for the nose
gear of 7,100 pounds and a weight for the main gear of 64,200 pounds.
As with landing gear, fLXed equipment weights are based upon a gross take off weight of
1,460,000 pounds and were not updated. The results are slightly conservative and are estimated
in the following manner. A set of fixed equipment weights for other large aircraft is averaged
with the results predicted by GD and Torenbeek methods. 5 Results are listed in Table 6.2.1.
Component
Fright controlsHydraulics and pneumaticsElectrical systemsAvionics, electronics, and instrumentationAuxiliary powerOxygenAir conditioning, pressurization
miscellaneous
Table 6.2.1 F'Lxed equipment weights (all wei[_hts in pounds)Similar aircraft GD Torenbeek
Average
13,629 15,982 8,028 12,5008,150 11,240 11,240 10,0006,534 5,403 N/A 6,000
10,679 17,563 6,956 11,0002,038 5,620 5,620 4,000
562 19 50 100
7,236 216 1,391 1,500N/A N/A N/A 5,000
50
The mission fuel requirement was developed using analytical methods based upon the
following parameters:
• Mission profile
• Aerodynamic characteristics of the Eclipse and Gryphon
• Weight of the Eclipse and Gryphon
• Engine performance data provided by General Electric Aircraft Engines
This analysis yields a total mission fuel weight (excluding ramp fuel) of 207,000 pounds and a
total fuel weight of 241,000 pounds.
Semi-empirical methods for wing weight estimation yield a weight of 252,000 pounds. 5,11
This is twenty percent of the take off weight of the airplane. No other airplane has a wing group
weight percentage which is so large. Since the semi-empirical method seems to be high in
comparison with existing aircraft, an analytical method is employed. The configuration of the
airplane with its high aspect ratio wing, twin fuselages, and many distributed and point loads
providing bending relief for the wing is weft suited to an analytical solution. The method used is
an analytic method for wing group weight determination for twin fuselage aircraft. 12 The
method predicts the structural weight necessary to resist shear and bending moments along the
wing based upon all distributed and point loads placed on the wing. Semi-empirical methods
46

were then used to estimate the weight of non-structural components of the wing, i.e. leading
edge, flaps, ailerons, and spoilers. A separate analysis was made using this model for a single
fuselage and center mounted payload. This value is then used to calibrate the wing group weight
percentage with that of existing aircraft. The analysis yielded a wing group weight of 151,900
pounds which is twelve percent of the airplane take off weight. This is a much more reasonable
solution. A by-product of this is an extra savings of 5000 pounds, or 0.4 percent of airplane take
off weight, due to the extra bending relief provided by the two fuselages. The calculations are
detailed in Appendix E.
6.3 Determination of the Longitudinal Center of Gravity of the Eclipse
The longitudinalcenterof gravityiscomputed as follows.
Xcg = _ (6.3.1)
2Lwi
where the wi are theindividualcomponent weights determined inthe preceding sectionsand the
Xcgi arc the individualcomponent centersof gravityrelativeto a common referencedatum. All
Xcgi are measured relativeto a referencedatum 50 feetforward of the forward most paRtof the
wing.
The fuselage center of gravity is estimated at 40% of the length of the fuselage. This places its
center of gravity at 107.33 feet aft of the reference datum.
The center of gravity of the horizontal tail is assumed at 42% of chord at 38% of semi-span.
This places the horizontal tail center of gravity at 214.03 feet aft of the datum.
The center of gravity of the vertical tails is assumed at 42% of chord at 38% of span. This
places the vertical tail center of gravity at 202.05 feet aft of the datum.
Crew and equipment are housed within the aircraft cockpit. Their center of gravity is therefore
45 feet aft of the reference datum.
The Gryphon is located at the center of gravity of the aircraft so as to minimize adverse
changes in aircraft handling qualifies due to sudden center of gravity changes at launch. This is
fixed after the airplane is balanced at 103.43 feet aft of the reference datum.
47

The engines are located placed on the wing so as to minimize interference with the wing and
each other.This involvedplacingenginesat64, 92,and 120 feetof semi-span.Based upon
pylondesign,thisyieldsa centerofgravityforeachenginepairat72.84,83.90,and 94.96feet
aftofthereferencedatum.
The nose gear center of gravity is placed 45 feet aft of the reference datum. This is the correct
position for the gear in the clown position. However, after studying the change in center of
gravity due to landing gear retraction, it was found that the landing gear retracting causes a
center of gravity shift of slightly over 1/2 inch. This is considered negligible.
The center of gravity of the main gear is placed seven feet aft of the aircraft center of gravity.
This location is at 110.43 feet aft of the reference datum. Due to the retraction kinematics of the
main gear, there is no center of gravity shift due to main gear retraction.
Based on preliminary systems plans, and the goal of placing most of the systems within the
wing, the fixed equipment center of gravity is placed 80 feet aft of the reference datum.
The center of gravity of the mission fuel is placed at the aircraft center of gravity so as to
eliminate changes in aircraft handling qualities over the course of the mission. As with the
payload, this is located at 103.43 feet aft of the reference datum.
The center of gravity of the main wing is estimated to be at 40% of chord at 40% of semi-span
from centerline. This yields a center of gravity at 97.17 feet aft of the reference datum.
6.4 Summary of Weight and Balance Calculations
Table 6.4.1 is a summary of the component weights and their centers of gravity. It also
includes the total airplane weight and center of gravity. Figure 6.4.1 shows the center of gravity
locations used in the longitudinal center of gravity analysis.
6.5 Structural Considerations
Several structural issues were considered on a qualitative level in the design. The fuselage has
an oblong shape so that the landing gear can be fully retracted within the fuselage and still aUow
for a large closed section. This large closed section significantly stiffens the structure. There is a
pressurized compartment in the left fuselage for the crew. This pressurized section is a cylinder
48

Reference datum
.o
"O
O
Or..,)re2
E
Z
L
41l
oOt.__.
OL-
u
_0e-,
LI.
49

which fits inside the exterior contour of the airplane. A cylinder was chosen to minimize the
possibility of fatigue due to pressure cycling. The wing has four main spars located at 17, 38
(maximum airfoil thickness), 54, and 70 percent of the chord. In addition, between the fuselages
a fifth spar runs parallel to and 12.5 feet in front of the trailing edge of the wing. This spar aids
in the distribution of the loads from the space booster. Two reinforced ribs are used for the
mounting system for the booster. These ribs start at the first spar and extend out the back of the
wing to provide attachment points for the payload. The twin fuselage design with a horizontal
taft spanning the two fuselages has an added advantage of creating a large shear cell. This should
significantly lower the structure needed to carry the loads. This would be seen in a weight
savings over a comparable single fuselage design. The two forward horizontal taft spars intersect
the two rear vertical taft spars. This minimizes the extra structure needed to carry the tail loads.
Table 6.4.1 Wei[ht and balance summary
No. Component Weight (lb 01 Fuselages gS,_.002 Horizontal tail 28,1003 V_'ficai tails 14,800
4 Crew and mission specific equipment 2,0005 Gryphon 479,000
Engines, nacelles, and pylons6 #3 &#.4 46,OO0
7 #2  46,0008 #I  46,000
9 Forward landing gear 7,10010 Main landing gear 64,20011 Fixed equipment 50,100
12 Mission fuel(excludingramp fuel) 207,000
13 Main win_ 151,900
14 Take offweight 1,227,400
Center ofgravity(ft)107.33214.03202.05
45.00103.43
72.8483.90
94.96
45.00
II0.43
80.00
I03.43
97.17
I03.43
5O

7. STABILITY & CONTROL
The central question of aircraft stability is whether an equilibrium of moment and forces can be
maintained at a given flight configuration. This requirement of flight equilibrium implies that there
must exist a configuration orientation corresponding to each allowable flight condition, such that a
disturbance would result in a tendency to return to steady state, followed by the eventual recovery
of the steady state. Examples of internally generated disturbances include changes in control
surface deflection, changes in center of gravity location, and changes in airplane configuration.
Some examples of extemaUy generated disturbances are turbulence and changes in altitude and
temperature. Both the lateral and longitudinal stability and control are evaluated.
For internally and externaLly generated disturbances, the airplane must be able to operate such
that a pilot can fly a mission and maneuver the airplane without undue effort on his part, with or
without assistance from an automatic control system. Again the airplane must be designed so that
it has a build-in tendency to diminish the motions resulting from internal of external deviations.
Civilian and militar/operators translate this into detailed specifications for ride quality and upset
recovery quality.
7.1 Horizontal Tail Sizing and Longitudinal Stability
The final result is a tail of 3700 ft 2, with planform as shown in Figure 5.3.3. Discussion of the
elevators shown in Figure 5.3.3 can be found in section 7.2.
The horizontal tail sizing is done on the basis of three criteria:
• Take off rotation
• Trim at cruise
• Static margin at cruise
7.1.1 Horizontal tail sizing due to take off rotation
Based on the seven forces and two moments acting on the airplane at take off and shown in
Figure 7.1.1, the take off rotation is analyzed.
To fred the needed elevator deflection/size and tail size, the moments about the median point
between whe_'e the main gear struts meet the runway are analyzed. At the present time, the change
in moment due to elevators is not accounted for. This moment should be small, and since the
51

o=
0
\
52

elevators are deflected upward, this estimate is overly conservative. While this requirement does
size the elevators, it does not size the tails.
M-0= L(xre f - Xac w)+ Mw + LF(Xref - XF)+ MF
where:
M = total airplane moment [ft.lbf]
Me = moment due to elevator deflection [ft-lbf]
MF = fuselage moment [ft,lbf]
Mh = moment due to horizontal tail [ft*lbf]
Mw = wing moment [ft.lbf]
D = airplane drag (acting at center of gravity) 0bf]
L = liftdue tothewing 0bf]
LF = fuselagelift[Ibf]
Lh = horizontaltaillift[Ibf]
T = airplanethrust[Ibf]
W = airplane weight 0bfl
Xach = longitudinal horizontal tail center of gravity [ft]
Xacw = longitudinal wing aerodynamic center [ft]
Xcg = longitudinal airplane center of gravity [ft]
xF = longitudinal location of equivalent fuselage lift [ft]
Xref = longitudinal landing gear rotation point [ft]
Zcg = center of gravity height [ft]
zref = landing gear rotation height [ft]
zT = thrust height [ft]
g = gravitationalacceleration[ft/scc2]
_' = instantaneous acceleration[ft/sec21
(7.1.1)
7.1.2 Horizontal tail sizing due to trim at cruise
This is done in the same manner as take off rotation except that the moments are summed about
the center of gravity. It is not the driving factor.
M =0 = L(xcg - Xae w )+ Mw + T(zcg - ZT)+ Lh (Xcg - Xach )+ Mh + Me (7.1.2)
53

7.1.3 Tail sizing due to static margin at cruise
This is the criteria that has sized the horizontal tail. Use of a cruciform tail has significantly
decreasezi the downwash. The tail's moment arm is very low. so this savings in downwash is
crucial. The liftcurves and downwash values are obtained as explained in section 5.2. The
aerodynamic centeristhenfound by scmi-empiricaimethods:6
SH de _
C, x=n + C,, qH "_'-I1 - I_'_IH _-.• ,=, =
why'e:
X-acA = locationof airplaneacrodynamic center
_ac h = locationof horizontaltailaerodynamic center
_acWB = locationofwing/txxiyacrodynamic center
CI.<zA = airplaneliftcurve slope[tad-I]
CL_ h = horizontaltailliftcurve slope [rad-I]
CL_ WB = wing/body liftcurve slope [tad-l]
71hffihorizontaltailefficiency
S ffi wing reference area [ft 2]
Sh = horizontal tail reference arca[fl 2]
[d_l = horizontaltaildownwashh
(7.1.3)
To properly size the horizontal tail, an X-plot was employed. The X-plot shows the variation of
center of gravity and aerodynamic center location as a result of varying tail area. From this plot,
the tailarea needed for a certainstaticmargin can easily be deduced. The aerodynamic center
variesas in equation 7.1.3.The centerof gravityshiftstowhcrcvcr 42% of chord ison a given
geometry. The X-Plot isshown inFigure 7.1.2. A staticmargin of 5% was chosen for the fmai
horizontaltailsizing.A value lower than the traditional10% was chosen because the tailwas
unreasonably large to meet the 10% requirement. A 5% static margin will require a stability
augmentation system to ensure safe operations.
7.2 Flight Control Surface Sizing
The elevators are 30% chord, 60% span, plain flaps with an area of 670 ft 2 that deflect -2.35 ° on
take off and 1.7 ° during cruise. These elevators can be seen in Figure 5.3.3. The central elevator
54
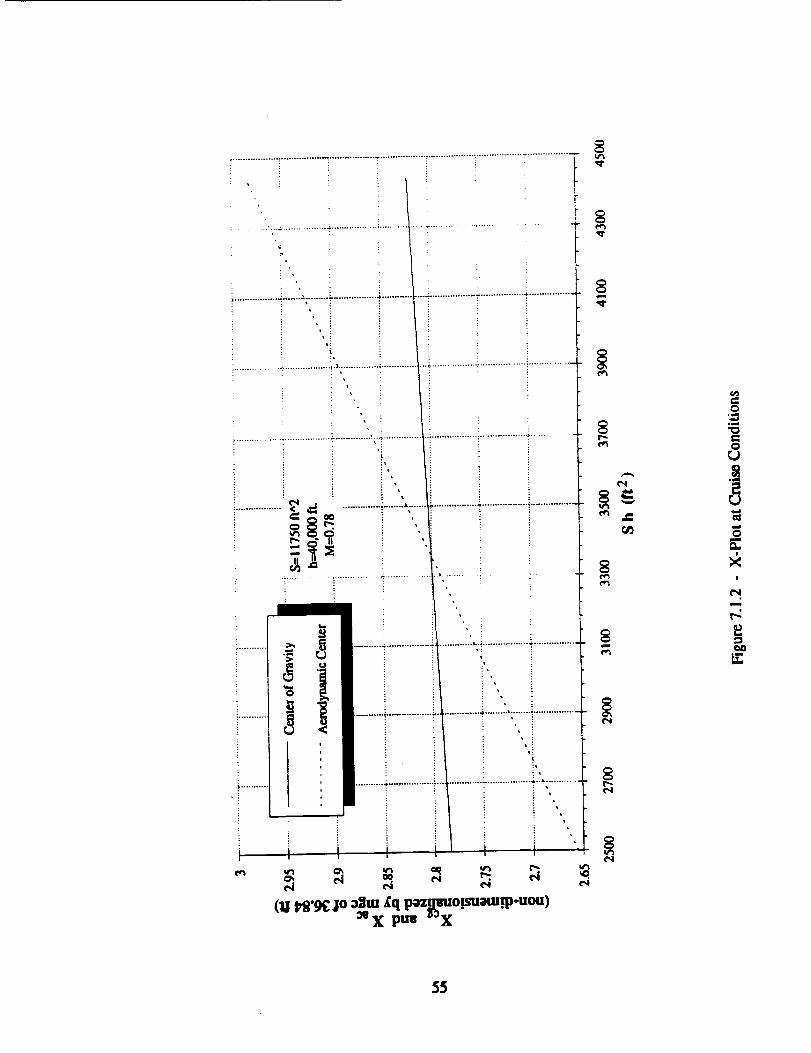
(U t,_'gc jo :_m ,Cq p_o.tsuam.tp-uou)"°X ptm "'X
,i
e-.o
e_
!
¢kO
55

piece is also used for the stability augmentation system. The sizing factor for the elevators is take
off rotation, as explained in section 7.1.1.
The sizing of the ailerons is closely related to the overall directional and lateral control of the
airplane. With various airplane dimension and performance parameter, the ailerons are sized from
the steady flight equations of motion and the directional and lateral equations of motion for the
outboard engine-out flight condition. These equations are listed in the stability and control section
of this report. 6,7
The two coefficients due to aileron deflection which contribute to the overall stability are the
rolling moment coefficient, CI_, and the yawing moment coefficient, Cn.,... The size force
coefficient, Cy_., and several other partial contributions of control derivatives are neglected
because their values become insignificant when normalized with respect to the reference wing area.
Furthermore, the perturbed forces and moments induced during flight are also ignored as they have
a relatively smaU effect on the overall flight characteristics due to the size of the Eclipse. Table
7.2.1 lists the final attributes of the ailerons.
Table 7.2.1 Aileron characteristics
Total area 500 ft 2
Inboard ailerons
Semi--span ratio (in/ou0Outboard ailerons
Semi-span ratio (irt/ou 0
.34/.39
.75/.95
7.3 Lateral and Directional Stability Analysis
7.3.1 Methodology
The lateral and dkectional stability analysis is carried out for the worst case scenario. In this
case, the one engine-out condition with an outboard engine inoperable at take off rotation is the
worst. This is the worst because it imposes the largest moment on the aircraft. It should be noted
here that a two engine-out during take off condition was also analyzed. The vertical tail size,
which is dependent on wing area, is very sensitive to the bank angle allowed. Since the bank angle
during take off is restricted to 5 ° as specified by FAR 25, for a two engine-out take off condition
the Eclipse would require at least 3700 ft2 of vertical tail area or a much higher rotation speed. An
engineering decision is made to forego meeting the two engine-out criteria to save the weight
associated with larger tails. This should not be a problem since the airplane will be used
infxequenfly and well maintained, lowering the odds of a two engine-out situation.
56

During the outboard engine-out take off flight condition, the unbalanced forces induce a sideslip
angle, _, which gives rise to a rolling moment, LT, a side force, Fy, and a yawing moment, NT.
The steady state roiling moment, side force, and yawing moment depend on:
•Mach number and Reynold's number
• Angle ofattack
• Angle of sideslip
• Dynamic pressure
• Control deflections of aileron, spoiler, rudder or other lateral-directional control surfaces
The effect of Mach number and angle of attack are accounted for in an indirect way, by
evaluatingthederivativeattherequiredvelocityduringtake offrotation(Vmc = 231 fdsec)and the
angle of attackattake off(9°).The Reynold's number effectsareusuallysmall and aretherefore
neglected in thisanalysis.The dynamic pressure isalso accounted for in an indirectway, by
multiplyinga non-dimensional coefficientby the dynamic pressureand the appropriategeometric
paimTlcters.
Typically, the minimum control speed (Vmc) is calculated as a percentage above the stall speed.
For this airplane, this resulted in a high rotation speed and a resultant large vertical taft area.
Therefore, Vmc is assumed at a value above the stall speed where the tails are a reasonable size.
The error in these calculations makes this a reasonable assumption.
The next three sections summarizes the results of the total airplane roLling moment, side-force,
and yawing moment analysis.
7.3.2 Total airplane rolling moment
Airplane rolling moment is nondimensionalized as:
LT = Cl.q.S*b (7.3.1)
where C1 is the total airplane roiling moment coefficient, q is the dynamic pressure, S is the wing
reference area, and b is the wing span. The relationship between the total rolling moment
coefficient and the functional dependence among the side slip angle and the control deflections is
usually expressed as:
C, = C,,fl+ C,,C}A+ C,.6R (7.3.2)
where:
Ct_ = change in rolling moment coefficient due to a unit side slip angle
57

Cr, _ = change in rolling moment coefficient due to a unit change in lateral control (aileron)
deflection
Cr, = change in rolling moment coefficient due to a unit change in directional control (rudder)
deflection
The derivativearc evaluatedatconstantMach number and constantangle of attack.Table 7.3.1
sunmmrizes the results of the rolling momcnt coefficients analysis.
Table 7.3.1 Results of the rolling moment coefficient calculation
C_ -0.1297 rad -1
Ct, ' 0.1431 rad "1
C1_' 0.0073 rad -1
7.3.3 Total airplane side-force
Airplane side force is nondin_nsionalizcd as:
Fy = Cy.q.S
whca'c Cy is the total airplane side-force cocfficient.
(7.3.3)
The functionaldependence of the side-forcecoefficientCy on the sideslipangle, ]],rudder
deflectionangle,8R, and ailerondeflectionangle,Ct4,isusuallyexpressed as:
Cr = Cr,,8 + Oz. &R + Cr,, &A (7.3.4)
where"
Cr, = change side-forcecocfficiemdue toa unitsideslipangle
Ca,,,= change inside-forcecoefficientdue toaunitchange inlateralcontrol(aileron)deflection
Cr. = change in side-forcecoefficientdue to a unitchange in dixccdonal control (rudder)
deflection
Again, the derivatives are evaluated at constant Mach number and constant angle of attack. Table
7.3.2summarizes theresultsofthe side-forcecoefficientsanalysis.
Table 7.3.2Resultsof the side-forcecoefficientcalculation
Cr, -0.7794 rad"I
Cr. 0 rad-1
Ca,. 0.1839 lad"l
58

7.3.4 Total airplane yawing moment
Airplane Yawing moment is nondimensionalized as:
NT = CN.q'Sob (7.3.5)
where CN is the total airplane yawing moment coefficient. The relationship between the total
yawing moment coefficient and the functional dependence among the side slip angle and the control
deflections is usually expressed as:
C, = C,,fl + C,,_A + C,, 7)R (7.3.6)
where:
C,_ = change inyawing moment coefficientdue toa unitsideslipangle
C,..
Cn I
= change in yawing moment coefficient due to a unit change in lateral control (aileron)
deflection
= change in yawing moment coefficient due to a unit change in directional control (rudder)
deflection
The derivative are evaluated at constant Mach number and constant angle of attack. Table 7.3.3
summarizes the results of the yawing moment coefficients analysis.
Table 7.3.3 Results of the yawin_ moment coefficient calculation
C,B 0.1556 rad "1
-0.0275 rad" 1C.,,C, ,, -0.0474 rad- 1
7.3.5 Configuration analysis
With the force and control derivative coefficients determined from the previous three sections, the
stable airplane configuration for the outboard engine out during take off can be determined from the
followingstabilitymatrix:
Fy} ICy_qS CY_SA qSL T = Cll3qSb CI_iAqSb
NT LCnpqSb Cn[iAqSb CnsRqSbJ[[iRJ
W.sin¢
q.S
(7.3.7)
With the vertical tail parameters listed in table 7.3.4, the stability matrix (equation 7.3.7) is
solved with the following results.
fl (Sideslip an#e) = 5.0 °
5A (Ailerondeflection) = 7.4 °
_R (Rudder deflection) = 25.4 °
59
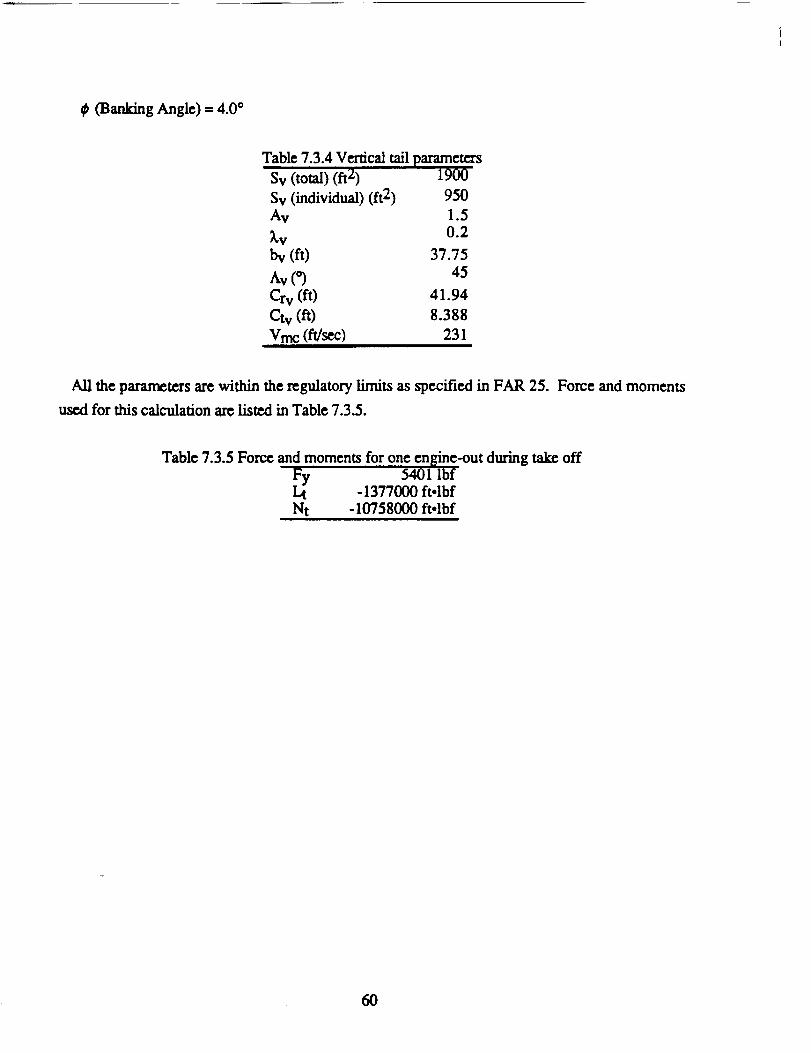
¢ (BankingAngle)= 4.0°
Table 7.3.4Verticaltailparameters
Sv (total) (ft2) 1900
Sv (individual) (ft 2) 950
Av 1.5
_,v 0.2
by (ft) 37.75
Av (*) 45
Cry fit) 41.94
Ctv(ft) 8.388Vine (ft/sec) 231
All the parameters are within the regulatory limits as specified in FAR 25. Force and moments
used for this calculation are listed in Table 7.3.5.
Table 7.3.5 Force and moments for one engine-out during take off
Fy 5401 IbfLt -1377000 ft*lbfNt - 10758000 ft.lbf
60

8. SYSTEMS
Six of themain systems on the Eclipsewere designed. Also, some issuesrelatedtocrew safety
and comfort were considered.The sixsystems arc:
• Payload integration
• Landing gear
• Hydraulic system
• Electricalsystem
• Flightcontrolsystem
• Fuel system
8.1 Payload Integration
This sectiondetailsthe airplane/spacebooster interfacefor one payload which can be carried
by the Eclipse,the Gryphon which was designed by the University of Michigan Aerospace
System Design class.15 In the same manner thatboosterstagesmust be interconnectedin order
for the system to function,the Gryphon must be physicallyand functionallyattached to the
Eclipsein order totake advantage of the air-launchedsystem. There are severalareawhich are
importanttothe interfacefrom the airplanestandpoint,including:
• Physicalattachrncntfrom theEclipsetotheGryphon/drop mechanism
• Power connectionstotheEclipseinthepre-drop phase
• Placement of supportsystems on the Eclipse
Detailsof the mating processcan be found in the Gryphon report.A generalmission scenario
begins the moment any of the base components leave theirmanufacturing centerand become the
property of the launch company. Each component isreceived and constructedintoa complete
launch booster,and then mated with the payload. Then, as the launch window approaches the
Gryphon isrolledout tothe Echpse and connected and fueled.The Eclipseeitheruses itsprime
facilityas itsbase of operations(forGcosynchronous orbits),or fliesto the secondary launch
facility(forPolar orbits).When the launch criteriahave been met, a technicianon the Eclipse
handles the release/launchphase.
8.1.1 Aircraft/boosterinterface
Since the Gryphon is an airlaunched space booster,the interfaceattachments between the
launch aircraftand booster arcof vitalimportance. The Eclipsewas designed solelyforlaunch
61

of the Gryphon space booster. In fact, the Eclipse could be considered the Gryphon's first stage.
There were two designs considered for the Eclipse/Gryphon interface:
• Space Shuttle/Boeing 74%100 attachment
• Orbital Sciences Corporation's Pegasus/Lockheed L-1011 interface
These designs were analyzed and compared to see which would best fit the requirements for
the Gryphon/Eclipse attachment. Some of the design parameters considered were:
• Pin layout
• Release mechanism geometry
• Materials
• Drop transient
• G-force loads
Both designs were considered based off of these criteria. It was determined that a design
similar to OSC's Pegasus/Lockheed L-1011 interface would be used. This design was chosen
because it was similar to this project, proven to work, and easier to analyze. However, the
Shuttle attachment design was considered throughout the analysis stage. The following sections
give overviews of the specifications of the Gryphon/Eclipse interface attachments. A final
section will review the specifics of the overall design, show the layout of the components and
costs.
8.1.1.1 Pin layout
In order to fully analyze the different possibilities, a finite element model was constructed on
the CAD program I-DEAS. It was determined to run different configurations using finite
element models in order to fred the best pin layout on the Gryphon. The parameters determining
the best pin configuration were:
• Diswibution of forces on pins
• Stability of configuration
• Structural dynamics
Having approximately the same force on each pin would mean only one type of hook and pin
combination had to be designed. This would greatly reduce design work and manufacturing
costs. H:, ing the same forces on each hookJpin combination would also make the system easier
to manufacture. A symmetric system would also help in design and analysis.
62
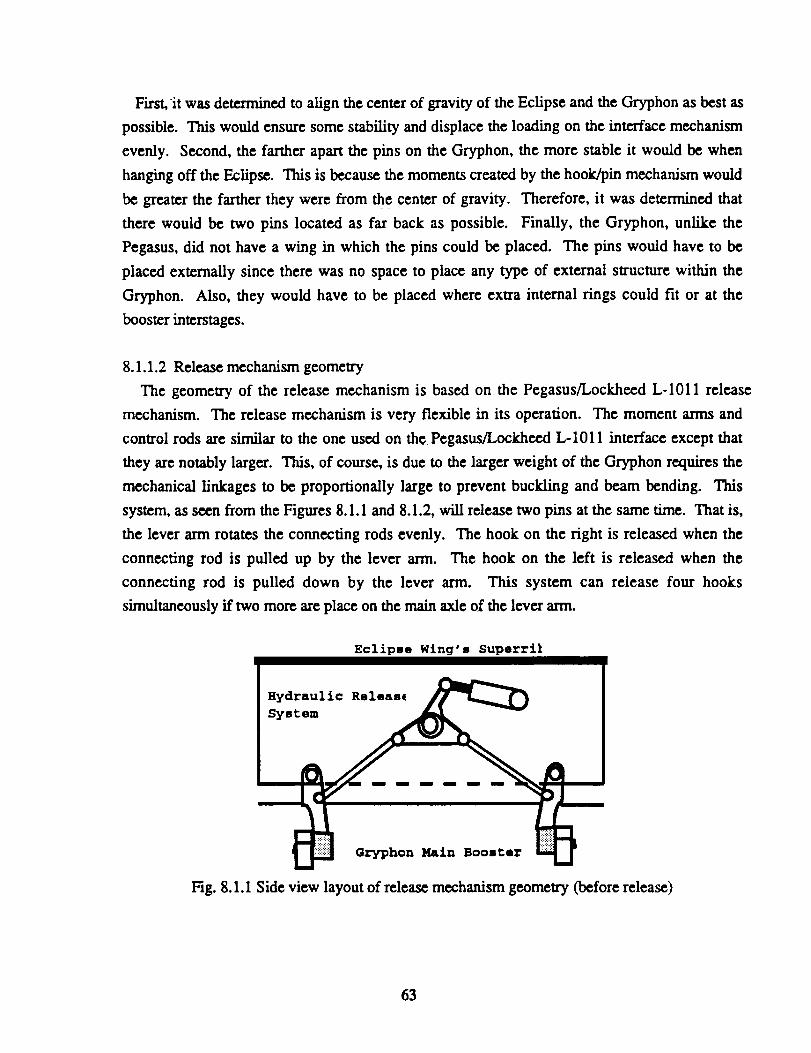
First, it was determined to align the center of gravity of the Eclipse and the Gryphon as best as
possible. This would ensure some stability and displace the loading on the interface mechanism
evenly. Second, the farther apart the pins on the Gryphon, the more stable it would be when
hanging off the Eclipse. This is because the moments created by the hook/pin mechanism would
be greater the farther they were from the center of gravity. Therefore, it was determined that
there would be two pins located as far back as possible. Finally, the Gryphon, unlike the
Pegasus, did not have a wing in which the pins could be placed. The pins would have to be
placed externally since there was no space to place any type of external structure within the
Gryphon. Also, they would have to be placed where extra internal rings could fit or at the
booster interstages.
8.1.1.2 Release mechanism geometry
The geometry of the release mechanism is based on the Pegasus/Lockheed L-1011 release
mechanism. The release mechanism is very flexible in its operation. The moment arms and
control rods are similar to the one used on the Pegasus/Lockheed L-1011 interface except that
they are notably larger. This, of course, is due to the larger weight of the Gryphon requires the
mechanical linkages to be proportionally large to prevent buckling and beam bending. This
system, as seen from the Figures 8.1.1 and 8.1.2, will release two pins at the same time. That is,
the lever arm rotates the connecting rods evenly. The hook on the right is released when the
connecting rod is pulled up by the lever arm. The hook on the left is released when the
connecting rod is pulled down by the lever arm. This system can release four hooks
simultaneously if two more are place on the main axle of the lever arm.
Eclipse Wing's Superri_
Hydraulic Releas_
System
Gryphon Main Booster
Fig. 8.1.1 Side view layout of release mechanism geometry (before release)
63

Eclipse Wing's Superril
Hydraulic
System
Gryphon Main Booster
Fig. 8.1.2 Side view layout of release mechanism geometry (after rdea._)
8.1.1.3 Materials
The material used for the structural members throughout the interface system is a heat treated,
quenched and tempered, steelalloyASTM-A242. The specificsof thismaterialare summarized
in Table 8.1.1.This alloywas chosen duc tothe factthatitisthe strongestconstructionmaterial
in yield shear strength.
Table 8.1.i SteelalloyASTM-A242 properties
Specificweight (psi) 0.284Ultimate tensile strength 0csi) 120Yield tensile strength 0csi) 100Yield shear strength 0csi) 55
Modulus of elasticity(106 psi) 29
Modulus ofrigidity(106 psi) 11.5
Coefficient of thermal exp. (10-6/'F) 6.5
Ductilitypercent elon[_ation (2 in.) 18
8.1.1.4Drop transient
Another important considerationinvolved in airlaunched vehiclesisa smooth drop transient.
This involves simultaneous releaseof allthe attachments between the launch and launching
vehicle. This was found to bc an important consideration from studying OSC's Pegasus
launches. The fifthattachment hook was added to keep the Pegasus "straight"on the L-1011 to
reduce drooping and deflection.By doing this,OSC cut down on the vibrationsthatmight have
damaged the payload resonating at the natural frequency. In the design of the Gryphon/Eclipse
interface, the drop transient was to be as "straight" as possible so it could be dropped withot.
cau,_i,,-o.damage to thepayload or any of the internalcomponents.
64
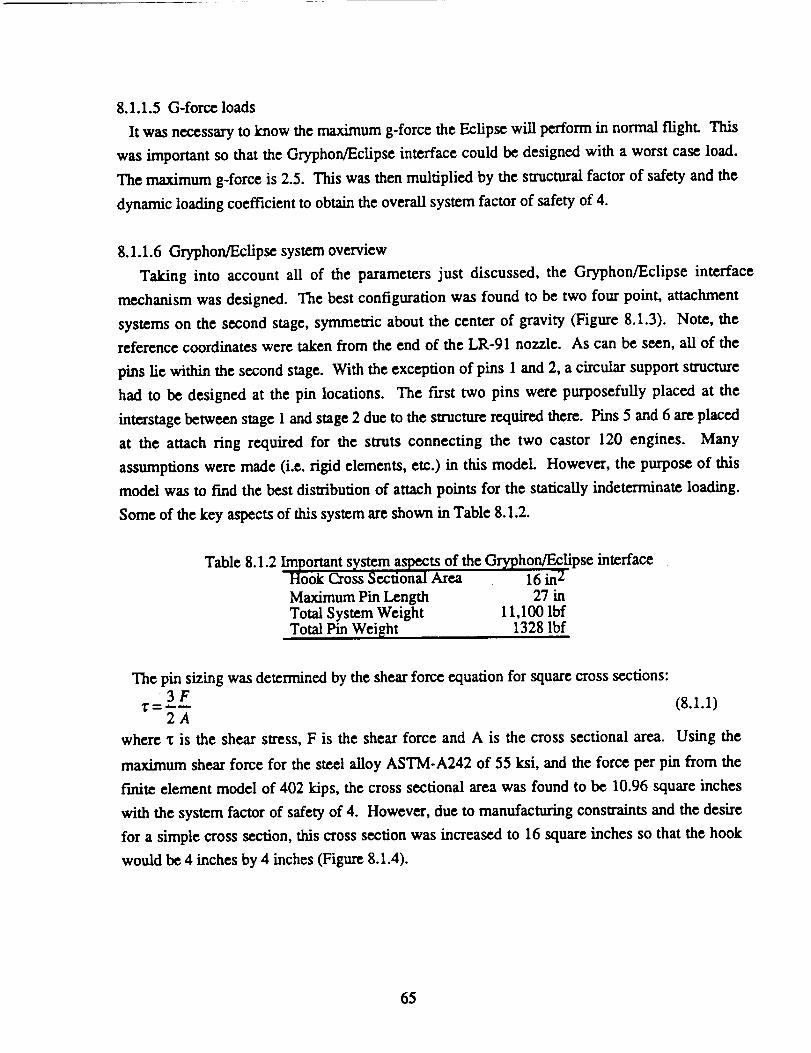
8.1.1.5 G-force loads
It was necessary to know the maximum g-force the Eclipse will perform in normal flight. This
was important so that the Gryphon/Eclipse interface could be designed with a worst case load.
The maximum g-force is 2.5. This was then multiplied by the structural factor of safety and the
dynamic loading coefficient to obtain the overall system factor of safety of 4.
8.1.1.6 Gryphon/Eclipse system overview
Taking into account all of the parameters just discussed, the Gryphon/Eclipse interface
mechanism was designed. The best configuration was found to be two four point, attachment
systems on the second stage, symmetric about the center of gravity (Figure 8.1.3). Note, the
reference coordinates were taken from the end of the LR-91 nozzle. As can be seen, aU of the
pins lie within the second stage. With the exception of pins 1 and 2, a circular support structure
had to be designed at the pin locations. The first two pins were purposefully placed at the
interstage between stage 1 and stage 2 due to the structure required there. Pins 5 and 6 arc placed
at the attach ring required for the struts connecting the two castor 120 engines. Many
assumptions were made (i.e. rigid elements, etc.) in this model. However, the purpose of this
model was to find the best distribution of attach points for the statically indeterminate loading.
Some of the key aspects of this system are shown in Table 8.1.2.
Table 8.1.2 Important system aspects of the Gryphon/Eclipse interfaceHook Cross Sectional Area 16 in2
Maximum Pin Length 27 inTotal System Weight 11,100 lbfTotal Pin Weight 1328 lbf
The pin sizing was determined by the shear force equation for square cross sections:3F
= -_ (8.1.1)2A
where _ is the shear stress, F is the shear force and A is the cross sectional area. Using the
maximum shear force for the steel alloy ASTM-A242 of 55 ksi, and the force per pin from the
fmite element model of 402 kips, the cross sectional area was found to be 10.96 square inches
with the system factor of safety of 4. However, due to manufacturing constraints and the desire
for a simple cross section, this cross section was increased to 16 square inches so that the hook
would be 4 inches by 4 inches (Figure 8.1.4).
65

,,]
I
071 sU
05 I _Q
Side View o:
Piz
,..- Y
Fig. 8.1.3 Top down location of attach pins on Gryphon
::i ::: •:.:, ,: :::. :-:5::::::::::: _"
-_:i:i:!!i!i:il]!i:!!---":: i:'!:[: :;
:::: :: ::::::::::: ::::
8"
4 m
4 m
i
N ...: ..:
H::.+,.:: H
::::::::::::::::::::::::
.,. ,....,
l
::::x::::::::: :
".x<<,x..:.-..-:
]
10.42"
I
Fig. 8.1.4 Hook dimensions showing side and front views
The hydraulic force to operat_ the system was calculated using a worst case load. The
hydraulic force was calculated by using the forces on the pin/hook combination, the friction
coefficient between the pin and hook and the geometry and the lengths of the lever arm and
66
connecting rods. The hydraulic pressure provided by the plane is 5000 psi. It was noted that
pumps could be added for emergency pressure loss and additional hydraulic force if needed.
Using the hydraulic pressure, the pistons were sized by calculating the worst case load force
required. The sizing of the hydraulic actuators was determined from the sum of the forces on the
lever arm in the equations:
= laf (Fpinl + Fpin2) (dlever) - Fhydraulic (darm)- 0 (8.1.2)
Phr_ = Fhrd_u_A (8.1.3)
where:
_Vl = sum of the moments about the lever arm [ft.lbf]
I.tf = smile coefficient of friction for steel on steel
Fpin = forces of a pin [Ibf]
dlever = distance of the connectors on the lever arm [ft]
Fhydraulic = hydraulic force [psi]
darrn = length of the hydraulic arm [ft]
Phydraulic = hydraulic pressure from the plane [psi]
A = cross sectional area of the hydraulic piston [in2]
After inserting the values for these equations, it was found that the hydraulic needed to have a
cross sectional area of 10.54 inches for the worst case loading.
8.1.2 Power connection
Since systems on the Gryphon need an external power supply for the pre-drop phase of the
mission, an umbilical power cord is needed to connect the Eclipse and the Gryphon. The
umbilical cord will be extending from the underside of the Eclipse next to the right forward most
attachment point and will be securely "attached to the Gryphon. At the point on the umbilical
cord closest to the Gryphon there will be placed a cartridge-actuated wire cutter, the most reliable
form of wire disconnect available.
8.1.3 Placement of support system on the Eclipse
One crew member is required on the Eclipse for Gryphon related work.
duties are to:
• relay Gryphon related information to Eclipse crew
• monitor Gryphon status
• switch Gryphon between external and internal power
• update Gryphon inertial measurement unit prior to release
The crew member's
67

• prepare and enable Gryphon for release
• activate release mechanism
• download and verify mission data
• capture, record, and display data from the Gryphon and its payload
• The launch panel operator consists of the following equipment: two computers, an inertial
measuring unit, a mass data storage system, the release panel, and three monitors. Two of the
monitors will be television screens filming the forward and aft ends of the Gryphon. The third
monitor will be a liquid crystal display used to visually monitor the computers, inertial
measurement unit, and data storage system. Through a keyboard the crew member will be able
to manually switch between these displays.
The launch panel operator's equipment will be assembled into a desk unit as seen in Figure
8.1.5. The top shelving unit will consist of three shelves that are 19 inches high. The overall
dimensions of the unit are 6' x 5' x 2'. As seen in the figure, all hardware except for the monitors
and the keyboard will be placed in the shelving unit. The front of the shelving unit will be
covered to prevent equipment from falling out during the mission. The desk unit is
approximately 6' x 3' x 6' and will include a swivel chair bolted to the floor. The monitors will
be placed at a 45 degree angle and in a semi-circle on the desk to ensure easy viewing. The
keyboard will be located in the middle of the semi-circle. The entire unit (shelving and desk)
will be placed on the right wall of the fuselage, behind the raised platform for the pilot and
copilot.
The final piece of equipment that needs to be placed on the Eclipse is a power rectifier. The
rectifier will convert the 28 volt, 400 Hz AC power supply from the Eclipse engines to a 28 volt
DC supply that can be used by the Gryphon systems. The rectifier unit will be approximately
eight inches square and weigh ten pounds. It will be placed in a convenient location between the
forward most attach points in order to have easy access to the avionics bay on the Gryphon.
8.2 Landing Gear Integration
The Eclipse landing gear will be of a quadracycle configuration. Each fuselage contains two
main gear struts just aft of the airplane center of gravity and one nose gear sWat just below the
cockpit. The main gear sWats are 17.8 and 18 feet long and the nose gear sWats are 14.5 feet
long. These strut lengths allow the aircraft to meet all tip-over, stability, and tail-strike criterion.
Additionally, each eight-wheel main gear sWat and each three-wheel steerable, nose gear strut is
68
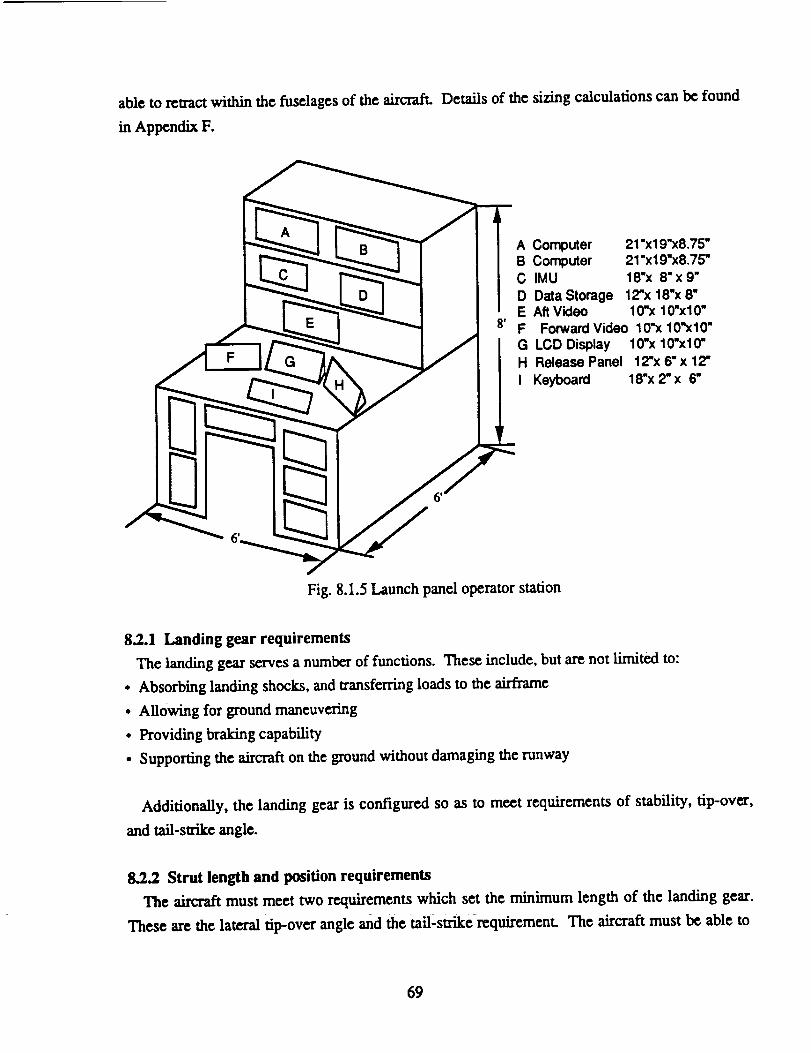
able to retract within the fuselages of the aircraft. Details of the sizing calculations can be found
in Appendix F.
A Computer 21"x19"x8.75"B Computer 21"x19"x8.75"C IMU 18"x 8"x9"
D Data Storage 12"x 18"x 8"E Aft Video 10"x 10"xl0"F Forward Video 10"x 10"x10"G LCD Display 10"x 10"x10"H Release Panel 12"x 6" x 12"
I Keyboard 18"x 2" x 6"
Fig. 8.1.5 Launch panel operator station
8.2.1 Landing gear requirements
The landing gear serves a number of functions. These include, but axe not limited to:
• Absorbing landing shocks, and transferring loads to the airframe
• Allowing for ground maneuvering
• Providing braking capability
• Supporting the aircraft on the ground without damaging the runway
Additionally, the landing gear is configured so as to meet requirements of stability, tip-over,
and taft-strike angle.
8.2.2 Strut length and position requirements
The aircraft must meet two requirements which set the minimum length of the landing gear.
These are the lateral tip-over angle and the tail'strike requirement. The aircraft must be able to
69

land with 5 ° of roll without striking wingtips or engine nacelles on the ground. Also, on take off
rotation the aircraft must be capable of rotating without striking the tail of the aircraft on the
runway. The wing has a 1.5 ° angle of incidence. Since the wing stalls at approximately 11 °
angle of attack, it is only necessary to be able to rotate l0 °. A 10.5 ° rotation angle is designed,
leaving a small margin for safety. This yields main landing gear struts 17.8 and 18 feet long, and
nose gear struts 14.5 feet long. This leaves a ground-clearance below the fuselages, at the main
gear, of 12 feet and 6 feet below the Gryphon. The 1.5 ° nose-down angle of the fuselage,
combined with the 1.5 ° angle of incidence of the main wing allows for perfectly horizontal
mounting of the Gryphon payload, as well as minimal induced drag during the take off run.
8.2.3 Main gear position criteria
The position of the main landing gear are dictated by several considerations. The main gear
must be far enough behind the center of gravity so that when the aircraft is at its maximum
rotation angle) the center of gravity is still forward of the main gear. This prevents the aircraft
from ever settling on its tail. However) if the center of gravity is too far forward of the main
gear, rotation of the aircraft becomes difficult and the horizontal taft grows in size.
8.2.4 Nose gear position criteria
The position of the nose gear is dictated by the need for a minimum of 8% of the aircraft
weight resting on the nose for effective steering. This also reduces any unintended bouncing of
the nose gear off the runway. However, within this requirement, the nose gear moment arm
should be as long as possible.
8.2.5 Final length and location of landing gear
The above requirements dictate that the aft main su'uts be 18 feet long, the forward main struts
be 17.8 feet long, and the nose gear struts be 14.5 feet long. The lowered nose gear is positioned
immediately below the cockpit, approximately 58 feet in front of the aircraft center of gravity.
The lowered position for the forward main gear is approximately 2 feet aft of the center of
gravity, and the aft main gear is positioned approximately 12 feet aft of the center of gravity.
8.2.6 Wheel configuration
Each of the four main gear struts possess and eight-wheel landing gear truck in a dual-twin-
tandem configuration. This configuration was first used on the Convair B-58, which also had to
place a large number of wheels within a relatively small fuselage. This configuration allows us
to place the necessary number of wheels within the available fuselage volume. The fuselage, 13
feet wide at its widest point has enough internal volume to easily fit the landing gear in this
7O

configuration. The maximum design static load for each main tire is approximately 37,200
pounds. An isometric view of the main gear bogey is shown in Figure 8.2.1. Figure 8.2.2 shows
the main gear fit within the fuselage.
Each of the two steerable nose-gear struts has a three-wheel truck in a triple configuration. The
static load on each nose gear wheel is only 25,000 pounds, and the dynamic loads which the nose
wheel encounters also correspond to a maximum design static load of approximately 25,000
pounds. By using fires which are rated for a significandy higher load, a lower fire pressure can
be used increasing the fire lifespan, reducing the chance of a tire blow-out on landing, and most
importantly, reducing the risk of causing significant runway damage when landing near
maximum gross weight. Figure 8.2.2 shows the nose gear fit within the fuselage.
8.2.7 Tire parameters
To deal with the large static loads associated with such a large aircraft, and to prevent runway
damage the aircraft is supported on 38 identical tires. Each is a commercially available B.F.
Goodrich tire 50 inches in diameter, and 21 inches wide. These tires operate at a pressure of
under 160 psi.
8.2.8 Potential runways
This configuration gives a runway load classification number of approximately 65 for normal
landings and approximately 100 for an aborted mission. This means that for a normal mission,
the aircraft can operate from any concrete runway of the proper length. In the event of an
aborted mission, the Eclipse can land on any weU maintained concrete runway currently used by
Boeing 747s and Lockheed L-101 Is.
8.2.9 Retraction kinematics
The nose gear of the aircraft retracts upwards and aft into the fuselage. In order to reduce
center of gravity travel due to retraction of the fairly heavy and relatively long main gear, the
forward main gear retracts upward and forward, while the aft main gear retracts upward and aft.
Figure 8.2.3 shows the a top and side view of the left fuselage, highlighting the retraction
kinematics.
The geardoors are broken intoseveralsectionslengthwise.The sectionsnear the hinge points
of the gearremain open as long as the gear isdown and locked. The remaining sectionsopen to
allow the gear to be raisedor lowered, and then closeagain to reduce drag during take offand
landing.
71

Fig. 8.2.1 Main gear bogey isomeu'ic
"/2

0
¢'qe,i
73

_J
0
qL)
c_
o
m_S
°_
0m
m
r_
L_
74
The drag strut on each gear is hinged. The upper portion of the drag strut is tied to a hydraulic
actuator which is used to raise or lower the gear. The down-lock on the hinged drag strut is
hydraulically actuated, but is spring loaded so that is may be locked without hydraulic pressure,
but cannot be unlocked without hydraulic pressure. All hydraulic actuators in the landing gear
are dual redundant, and at least one system is needed to raise the gear. However, in the event of
the total loss of hydraulics to the landing gear, they may be lowered and locked in the down
position by a free-fall method. In this unlikely event, the non-functioning actuators are
disconnected from the gear and gear doors. The landing gear is then aLlowed to drop under its
own weight. If necessary, this could by supplemented by a 2g turn, doubling the apparent weight
of the gear.
8.2.10 Braking systems
Braking is accomplished by carbon, anti-lock brakes. Differential braking to the left and right
main gears is used to supplement rudder conlrol at high speeds and nose wheel steering at lower
speeds. These brakes are also dual redundant.
8.3 Hydraulic System Layout
In this section some fundamental
discussed. The material includes:
• Design options and philosophy
• Overall system characteristics
• System components analysis
• Hydraulic power distribution
• Individual system layout
• Overall system layout
design layout for Eclipse's hydraulic system will be
8.3.1 Design options and philosophy
In designing the power system to drive the actuators, the three most common options were
considered. These options are:
1) electromechanical system
2) electrohydrostatic system
3) conventional hydraulic system
75

During the systemselectionprocess,numerous possibilities and considerations were reviewed
and argued. However, the driving criteria in designing the system is not much different from the
team's overall philosophy. That is, ease of assembly and simplicity m design.
A electromechanical system consists of individual actuators with self-contained electric motors
which drive the output shafts via gear boxes. Characteristics of the system depend on the
magnetic fieldstrengthcapabilityof itselectricmotors. In general,the electromechanicalsystem
suffersin the size,volume, and performance when compared to a conventionalhydraulicsystem.
Itsactuatorsarebulkier,heavier,and system response isslower. In addition,itconsistsof small
partsand therefore,isnot suitableforthe Eclipse.
The electrohydrostatic actuator is a recent development in hydraulic technology. This actuator
does not need an airplane hydraulic system because it has its own miniature hydraulic system,
including a pump driven by an electric motor. It is primarily designed for fly-by-wire or fly-by-
light flight control systems. The Eclipse is controlled via a mechanical signaling system.
Therefore, the electrohydrostatic system is not suitable in our design.
A conventional hydraulic system moves the actuator via fluid power in the form of flow and
pressure. The advantages of this system are its flexibility, ease of control, and proven feasibility.
The primary disadvantage in a conventional hydraulic system is its ne, d for system redundancy.
Despite its drawbacks, the conventional hydraulic system represents the most feasible choice
among the options considered and it is implemented in the Eclipse.
8.3.2 Overall system characteristics
While the functions of hydraulic system vary from one airplane to another, they are typically
separated into primary and secondary systems. A primary system requires higher levels of
redundancy because of the criticality to flight. It consists of the primary flight control surfaces
such as the aileron, elevator, and rudder. The secondary systems are considered to be in the same
class as any other structural member of the aircraft and require a lower number of system
redundancy. Examples of these are the landing gear system, landing flaps, and the ground
steering unit. Table 8.3.1 lists the primary and secondary systems for the Eclipse.
Most hydraulic systems today operat¢ at a pressure between 3,000-5,000 psi. The major
advantages of higher operating pressure are a reduction in weight and installed volume. With
advancement in hydraulic technologies, the 5,000 psi hydraulic system is becoming the industry
standard and it is the system implemented in Eclipse. Further reduction in weight and installed
76

volume is possible via implementation of an 8,000 psi system. In such system the problem of
sealing between relative moving surfaces such as a piston and cylinder becomes quite severe and
costly seals capable withstanding high pressure differential are used. After the preliminary
benefit analysis, the advantages of an 8,000 psi system does not jus_y extra cost incurred for
implementation in the Eclipse.
Table 8.3.1 Primary and secondary systems for the EclipsePrimary SecondaryRudders Braking systemElevators Trim unitsAilerons Ground steering system
Landing gear systemTrailing edge flapsThrust reversesPayload drop systemSpoilersFlap system
The system can use any standard aviation hydraulic fluid as its operating fluid. This mineral
hydrocarbon fluid provides chemical stability needed in high pressure operating environment.
Four independent hydraulic systems are used in Eclipse to ensure safe flight operations. These
systems are designated as the left, central, auxiliary, and right system for future references. In
addition, each system uses three independent pumps to further ensure flight criticality.
Preliminary design approximates the system flow rate at 300 liters per minute (75 gal/min), but
the final number depends on specific system characteristics such as the rate of control system
operation. Table 8.3.2 summarizes the overatl characteristics of Eclipse's hydraulic system.
Table 8.3.2 Main characteristics of hydraulic desi[nOperating pressure 5,000 psiNumber of systems fourPumps per system threeFlow rate 300 liter / rainReservoir four independent
Operatin[ Huid standard aviation hydrauLic fluid
8.3.3 System component analysis
The hydraulic system consists of the following components:
77

8.3.3.1 Hydraulic fluid reservoir
The size of reservoir depends on the system flow rate, system volume, and other
characteristics. Reservoirs of the left and central systems are located in the left landing gear
housing while the other two rem'voirs are in the right landing gear housing. This arrangement
represents the best layout in terms of balancing system redundancy and accessibility.
8.3.3.2Hydraulicpump
The hydraulicpump istheheartofthesystemwhich transformsthemechanicalinputintofluid
power.The machine usedisa positivedisplacementpump which providesa flowproportionalto
theinputspeed.Table8.3.3listscharacteristicsofsome hydraulicpumps.
Table8.3.3Characteristicsofhydraulicpumps
Type PressureRange (psi) Maximum Flow Rate OverallEfficiency(%)(liter/min)
Gear 290 -3000 .....l- 700 60 -70Vane 290 -3500 2- 1200 70 - 80Piston (axial) 290 - 5500 2 - 2000 90 - 95Piston (in-line axial) 5000 - 10000 1500 - 5000 90 +
As withtheothercomponentsinthesystem,increasingpressures,flow rates,and reducingthe
weightof thepump resultsina higherpdcc fortheunits.Itisimportanttonote,however,the
criticalfactorin aircraftsystemsismainlyweight and criticalityto flightwhereas in industrial
systemsisusuallycost.From Table 8.3.3,axial--pistonpump providesthebestefficiencyand
flexibilityforEclipse'soperatingpressurerange.Indeedthisisnow thestandardtypeofpump
used inaircraftapplications.
Table 8.3.4 lists pump distribution among different systems and their power sources. Note that
there are two different types of primary hydraulic pumps: engine driven and electric driven. An
auxiliary power unit (APU) driven pump is included to further insure redundancy. On top of
these there is a ram air turbine (RAT) driven pump, ff all else fails. Each system operates with
two pumps with an alternate pump for emergency operation as listed below.
System_7_umpsAlternatePump,
Table8.3.4Hydraulicpump distributionLeft(LT) Center(CT) Auxiliary(AU)Engines 'i', 2 Engines 3, 4 2 ElectricElectric APU RAT
I
Right(RT)Engines 5, 6Electric
78

8.3.3.3 Servo actuator
Control units used in Eclipse comprise a servo-valve and actuator coupled together in the
manner indicated in Figure 8.3. I which shows a valve with mechanical input and a feedback
lever between valve and jack output to achieve proportionality.
echanical r--- Pressure --_
put I _ /
,,- I Servo-valve
II
1-! LActuato r ['1
Fig. 8.3.1 Servo-actuator
8.3.3.4 Accumulators
These units are the 'capacitor' in hydraulic system and can be used to store energy or even
absorb energy to eliminate sudden surge in pressure. The action of the accumulator is dependent
on the compression and subsequent expansion of a specific mass of gas, held in a cylinder behind
a piston. There is one accumulator for each hydraulic system located in the main landing gear
bays near the system reservoir.
8.3.3.5 Filter
Filters are extremely important in a high pressure system. Because valves contain elements
with such small clearances between relative moving parts, it is necessary to filter out particles
down to four microns for typical servo-actuator. The falter is design according to the maximum
operating pressure.
8.3.3.6 Lines and valves
Lines and valves are used for fluid distribution to all operating points and pilot controls.
79

8.3.4Hydraulic Power Distribution
Figure8.3.2shows thedistributionof hydraulicpower toflightcontrols.Note thatthereare
fourlevelsofredundancyforprimaryflightcontrolsurfaces,witheach individualcontrolsurface
powered by three separate systems. If three hydraulic systems failed during flight operation, the
remaining system could still provide hydraulic power to all primary flight controls.
Secondary flight controls are considered as any other structural member on the aircraft and
only two levels of redundancy are used.
Figure 8.3.3 indicates the hydraulic power distribution to secondary service systems. Again,
only two levels of redundancy are used. Table 8.3.5 lists these system under normal and under
emergency operation.
AU: Auxiliary System
RT: Right System
I Oadx_rdCT, AU, LT
UpperRtTLTTAU
I][ Low L[LT)CT)AU
-_ Spoilers
OutboardA [[ Flaps &
RT, CT, AU ]__ Ailerons
central ] I OutboardLT, RT,CT CT) RT) AU
RT,LT.CT RT. CT.AU
__ Elevators
Rudders
Fig. 8.3.2 Distribution of hydraulic power to flight controls
Power systemLanding gearSteeringBrakes - inboard
Brakes - outboard
Lat:aching system
Table 8.3.5 Emer[_ency operation of secondary systemsNormal hydraulic s_,stem Emerffency operationLeftand rightCenterand rightLeft
Auxiliary
Centerand auxiliary
Manual and "free fall"Differential brakingOutboard braking available,
accur,_ulator pressureInboardDrakes available,
accumulator pressureElectrohydrostatic actuator..,,
8O

CT: Cengal System
LT: Left System
I Left ThrustReverser LT
Steering Unit
CT, RT AU: Auxiliary System
RT: Right System
Landing GearLT, RT
I Right Thrust
Reverser, RT
InboardBreaking
LT
Outboard
Breaking
AU
Lauching System
CT, AU
Trim
Units
CT, AU
Fig. 8.3.3 Distribution of hydraulic power to secondary systems
8.3.5 Individual System Layout
Table 8.3.6 lists functions of individual systems.
Figures 8.3.4 and 8.3.5 exhibit schematic views of each system with system components,
pressure lines and return lines. Note that each system is truly independent with its own pumps,
regulator, accumulator, and reservoir. Servo-actuators of primary flight control surfaces
represent the only system links and are connected as shown.
8.3.6 Overall systems layout
Figure 8.3.6 shows the hydraulic routing on the Eclipse. Note the followings:
1) Four systems are positioned at four comers of the fuselage for maximum spacing between
systems to prevent complete hydraulic failure.
81

R_t sy_:
I
['=-==- 1 Czm_
AU'-Aus_ $yr._
Pump
Secondaryflight control
Actuator
mq_0
Reservoir @
Secondary
systems
Shut offvalve
PFCssurc
regulator
Checkvalve
[_ Accumu-lator
ReRlrnm
line
Fig. 8.3.4 Schematic hydraulic diagram: left and right systems
82

Iml
)lmJ
I(
v
Iaboad
Pump
Secondaryflight conu, ol
Actuator
Reservoir _ Shut offvalve
Filter L_ Pressureregulator
Secondary Pressuresystems line
Checkvalve
IH I!̂ _u_ulator
Returnm
line
Fig. 8.3.5 Schematic hydraulic diagram: center and auxiliary systems
83

E_DGO
(J)
X
|
|
|
|
|
|
E¢1)
m
C
I
I
E
co
CO
..d
EQ3c/)
GO
/Z
o_
iI
i #
I
I
I
I
I
I
I
I
I
I
I
I
/
I
/-I
I
mmmom_lelml o_
.oU
0d
b_
84
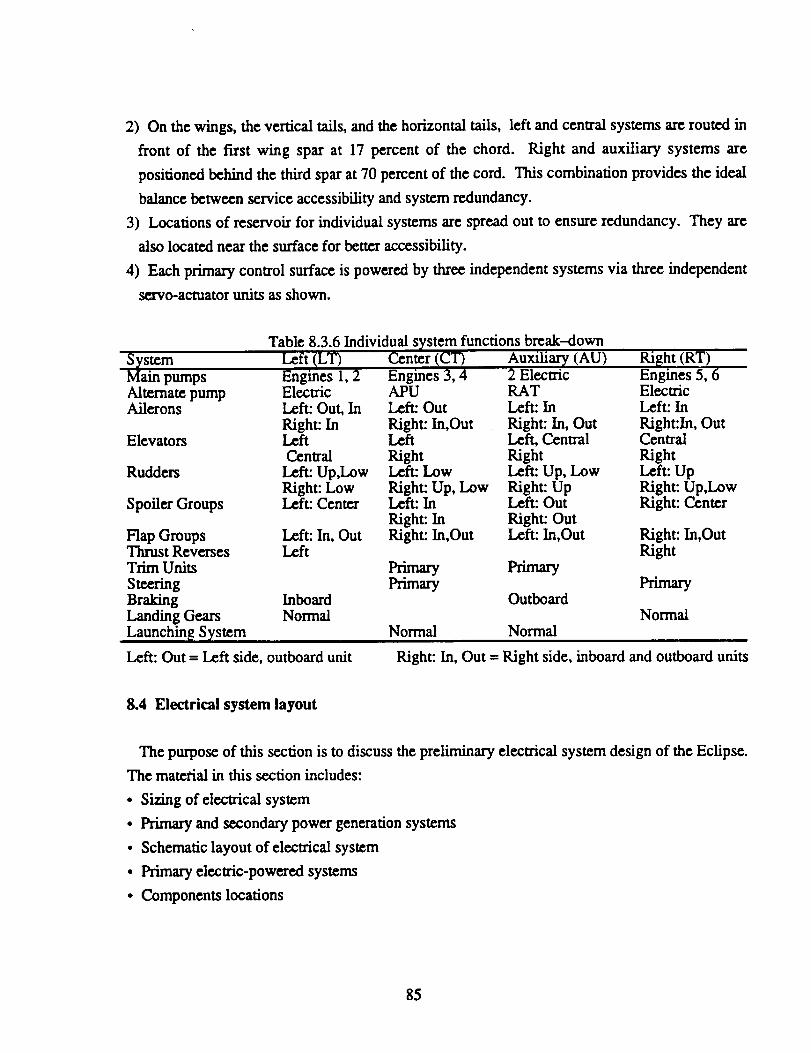
2) On the wings, theverticaltails,and the horizontaltails,leftand centralsystems are routedin
front of the firstwing spar at 17 percent of the chord. Right and auxiliarysystems are
positionedbehind the thirdsparat70 percentof the cord. This combination provides the ideal
balancebetween serviceacccssibRityand system redundancy.
3) Locations of reservoirforindividualsystems are spread out to ensure redundancy. They are
alsolocatednear the surfaceforbetteraccessibility.
4) Each primary controlsurfaceispowered by threeindcpcndcnt systems via threeindcpcndcnt
servo-actuatorunitsas shown.
Table 8.3.6 Individual system functions break-down
S_,stem Left (LT) Center (CT) Auxiliary (AU) Ri[[ht (RT)Main pumps Engines 1, 2 Engines 3, 4 2 Electric Engines 5, 6Alternate pump Electric APU RAT ElectricAilerons Left: Out, In Left: Out Left: In Left: In
Right: In Right: In,Out Right: In, Out Right:in, OutElevators Left Left Left,Central Central
Central Right Right Right
Rudders Left:Up,Low Left:Low Left:Up, Low Left:Up
Right:Low Right:Up, Low Right:Up Right:Up,Low
Spoiler Groups Left: Center Left: In Left: Out Right: CenterRight: In Right: Out
Flap Groups Left: In, Out Right: In,Out Left:In,Out Right: In,OutThrust Reverses Left RightTrim Units
Steering
Braking Inboard
Landing Gears Normal
Launchin[ System
Primary PrimaryPrimary Primary
Outboard
Normal Normal
Normal
Left: Out = Left side, outboard unit Right: In, Out = Right side, inboard and outboard units
8.4 Electrical system layout
The purpose of this section is to discuss the preliminary electrical system design of the Eclipse.
The materialin thissectionincludes:
• Sizing of electricalsystem
• Primary and secondary power generationsystems
• Schematic layoutof clectricalsystem
• Primary elecn'ic-powercdsystems
• Components locations
85

8.4.1 Sizing of electrical system
Preliminary design is based on two types of electrical load requirements, essential load and
normal operating load. Essential load requirements are determined by the minimum electrical
power necessary for safe flight operation. Normal operating load requirements are determined by
the maximum sum of all electrical power during certain phase of the mission. At this stage of the
design, electrical power requirements of individual components are unknown, overall electrical
power required, therefore, is approximated form a similar sized aircraft, the Boeing 747.
Although the Boeing 747 is significantly smaller in size than the Eclipse, the Boeing 747 also
requires more electrical loads throughout its fuselage to accommodate commercial passengers.
The Eclipse on the other hand, lacks such requirement, and thus the electrical power
requirements should be similar on both aircraft. Table 8.4.1 approximates the electrical power
requirements of the Boeing 747.
Table 8.4.1Electricalload summary
O_in'g_ Phase Norrnal Load (KVA)60 Essential Load (KVA)20
Start & Taxi 135 38Takeoff & Climb 145 42Cruise 140 35Descent & Land 160 65
Ground Operation 45 35
It should be noted_ however, the mission specification of the Boeing 747 differs significantly
from design criteria of the Eclipse, hence the electrical requirements could greatly vary from one
operating phase to another. The purpose of this chapter is to provide a preliminary electrical
system design for the Eclipse, further requirement analysis is needed for feasible implementation.
8.4.2 Primary and secondary power generation
From Table 8.4.1, approximately 160 KVA is needed for maximum normal operating load and
65 KVA for essential load requirements. When industry standard 90 KVA AC generators are
used, the system requires three generators for overall system operation. The design also uses a
back-up generator to ensure system safety.
Batteries are also used as a secondary option in the system design. The principal functions of
the battery system are:
1) To maintain DC system voltage under transient conditions (The starting of large DC motor-
driven accessories, such as pumps, requires high input current which would lower the bus
voltage momentarily unless the batteries are available to assume a share of the load)
86

2) to supplypower forshortterm heavy loads,when generatororground power isnot available
3)to supplylimitedamounts ofpower under emergency conditions
Batteriesare mounted on an acid-proof,non-absorbent traysecured on the aircraftstructure.
They are installedinindividualcomparuncnts designed toprovide adequate heat dissipationand
gas ventilation.
Although batlcricsarc capableof providingtemporary power, theircapacityisrcsu'ictedtothe
supply of power under emergency conditions and does not permit wide range of use on the
ground. Itisnecessary,therefore,toincorporatea separatecircuitthrough which power from an
externalground power unitmay bc connected to the Echpse's electricalsystem. The ground
power unitssuppliestheelectricalpower necessaryforstartingof engines,mounting of Gryphon,
servicelighting,and routinesystem checks.
An additionalmeasure of safetyisobtained by using a free-fallRAT to provide prolonged
electricaland hydraulicpower when allengines failed.The RAT isplaced in the nose of the
rightfuselagebased on thefollowingconsiderations:
1)avoid interferenceflows induced by the Gryphon
2) provideclearancefrom the fucltank
3) provide clearanceincase ofengine disperse
4) avoid positionconflictswith landinggears and otheroperatingstructures
5) ensurefrccstreamairavailability
Figure 8.4.Ishows thepositioningof RAT and engine powered generatorson the Eclipse.
8.4.3 Schematic layout of the electricalsystem
Figure 8.4.2shows a schematicview of Echpse's electricalsystem. Note thefollowing:
I) Three AC engine-driven generatorsand APU powered generator are used for normal and
essentialloading. In addition,one RAT driven generator supplies electricalpower for
emergency operation. External AC ground power supply and DC battery systems provide
additionalsecondarypower support.
2) Various AC and DC operatingsystems connectingto outputbuses.
3) DC power derivedfrom AC generatorsvia transformer/rectifiersystems. AC power derived
from the battery system via inverts. Figure 8.4.1 shows the position of these electrical
components.
87

|
C_J!
I!
C_J
CDI
0
m
cr_
r_
"Su
od
88

Engine generators
RAT generator
APU generator
AC buses AC buses External
AC power
Transformer/rectifier
DIEbuses DC buses
_-. BatterySystem
Staticinverter
Fig. 8.4.2 Schematic electrical diagram
8.4.4 Electrical power utilization
Electric power is provided to the following systems:
1) Six engine starter motor systems
2) External Lighting
(i) The marking of an aircraft's position by means of navigation lights
(ii) Position marking via flashing lights
(iii) Forward illumination for landing and taxiing
(iv) Illumination for wings and engines to check for icing
(v) Illumination for evacuation after an emergency landing
3) Internal lighting
(i) Illumination of cockpit instruments and control panels
(ii) Illumination for cabin and cockpit operations
(iii) Indication and warning system of operating conditions
4) Fire detection and extinguishing systems
5) De-icing and anti-icing systems
6) Landing gear position indication system
7) Anti-skid control system
89

8) Other general services
8.5 Flight Control System
The purpose of this section is to describe the components of the flight control system as well as
their location and description. Also described are some of the major factors behind the design.
As with other systems, much of the Eclipse's flight controls were designed following the
examples of existing aircraft. For the Eclipse's flight controls, the main aircraft under scrutiny
are the Boeing 767 and the Lockheed C-5A Galaxy.
8.5.1 Design considerations
Due to the size of the Eclipse, it is an immediate requirement that all primary flight control
systems be irreversible. Otherwise, the pilot will not be able to create a sufficient force to
counteract the tremendous amount of aerodynamic forces generated by the large control surfaces.
The next option that must be considered is how the control surfaces will be signaled. This is a
difficult design problem to consider. On one hand, mechanical systems offer ease in
certification, greater redundancy, and they are much cheaper to develop and maintain than fly-
by-wire or fly-by-fight systems. However, there is a tremendous operational cost advantage to
be gained by having the lighter weight provided by fly-by-wire or fly--by-tight systems. The
high initial cost involved in developing the hardware and especially the software for the fly-by-
wire systems is not justified in our design. Therefore, the Eclipse's flight con¢ols would be
mechanically signaled and hydraulically powered.
The operation of the Eclipse's flight controls can be simplified as follows: input is supplied by
the pilot through the control yoke. The control yoke applies/releases tension in a stranded cable
which, through a designated series of pulleys, pulls/releases a piston inside a control valve. This
control valve regulates the amount of hydraulic pressure required to move the hydraulic actuator
(and thus the control surface) in the desired direction.
Since the actuator operations are covered in the hydraulic section, the reminder of this section
will only cover the mechanical aspects of the flight controls.
8.$.2 Layout of primary flight controls
The primary controls are separated as follows:
Lateral Control: Ailerons
90

Longitudinal Control: Elevators
Directional Control: Rudders
The layouts of the lateral, longitudinal, and directional controls are shown in Figures 8.5.1,
8.5.2, and 8.5.3, respectively. The cable runs are shown in Figure 8.5.4. In designing these
layouts, the following items must be considered: physical clearances, redundancy, forces
required, stability, auto flight controls, and a number of other issues. The two redundant
mechanical systems are both placed behind the last spar of the wing and tail surfaces and
following the side of the fuselage. Similar to hydraulics, the flight control systems have built in
redundancy from the presence of the control yokes and pedals. In other word, if the cable in one
of the system breaks, the other system would still have control authority of the primary flight
surfaces.
Also included in the design are auto pilotcontrolswhich must be taken intoaccount. These
controlinputsactin much the same way as a hydraulicpowered controlyoke or pedal. The auto
plot, feel,and trimcontrolsenterthe system as shown inFigures8.5.1,8.5.2,and 8.5.3.
8.5.3 Layout of secondary flight controls.
The secondary flight controls are as follows:
Flaps,Spoilers
Lateral,longitudinal,and directionaltrim
Engine fuelcontrols
The layout of the auto pilot and trim controls is included in Figures 8.5.1, 8.5.2, and 8.5.3.
Throttle controls are shown in Figure 8.5.5. Other than the large number of engines, there is
really no difference between engine controls of the Eclipse and that of any other modem aircraft.
The engine controlsof theEclipseare modeled afterthoseof theBoeing 767.
8.6 Fuel System
Once the fuel weight is calculated the fuel volume needed is calculated by dividing the fuel
weight by 50.4 ft3/lbf, the inverse density of jet fuel. For the purpose of other possible mission
for the aircraft, and for increased fairing range, an additional 90,000 pounds of fuel was allocated
for as auxiliary fuel supply. In addition to the 260,000 pounds already required, this brought the
total fuel tank capacity of the Eclipse to 6950 ft3. Tanks were then placed in the wing, outside of
the turbine burst area, to allow for this fuel volume.
91

0
0
i
r_
92

93

w
0
m
e-0
0
oi
LE
94

95

THROTTLETHROTTLE LEVER LEVER ANGLE r I
TRANSDUCER [ E_ONIC
0 ..... t _aeas[ CONTROL
STRUT
M FLIGHTPo CONDITION
DATA
ENGINE FEEDBACK(GE-90 I00,000 LB
THRUST VERSION)
SIGNAL
(_ DRUM THR_
PACK "
HYDRO-MECHENGINECONTROL
IFUELFLOW
SYSTEMS TYPICAL FOR SIX ENGINES
C
Fig. 8.5.5 Throttle control layout
96
Once the tanks were placed, the fuel lines and pumps had to be sized and placed. FAA
regulations state that all fuel lines must be able to handle one and a haLf times the maximum fuel
flow to the engines. The maximum fuel flow in our case occurs at take off with a thrust of
I00,000 pounds per engine and a specific fuel consumption of 0.284 Ibm/hr. So 28,400 Ibm/hr
or 9.4 ft3/min, must be pumped. The pumps must therefore be able to pump 14.1 ft3/min
through 2 inch diameter fuel lines. Consult Figure 8.6. I for tank and line placements.
Fuel lines were located between the first and third spars. In order to keep the center of gravity
of the fuel at the center of gravity of the Eclipse at all time, normal one way flow baffles were
not used, instead each tank is separated into several fuel cell inter connected by flow valves and
pumps. A computer will keep the center of gravity of the fuel constant. Standard water drainage
pumps and fuel venting lines are used much like those on the Boeing 747.
Surge tanks are located outboard of the main tanks to allow a volume for fuel to expand into.
The auxiliary tanks are located inboard of the main tanks. Fueling is done through a single point
located on the right wing. Cross feed lines run behind the first and third spars for fueling and to
maintain airplane balance. The auxiliary power unit fuel is bled from the cross feed line behind
the third spar.
8.7 Crew Issues
Since the current plans only call for use of the Eclipse once every other month, a training
system is necessary to keep pilot proficiency. The most appropriate low cost method is a six
degree of freedom ground based simulator. This simulator could be used on a regular basis to
maintain pilot, copilot, and launch officer proficiency.
The simulator would give the pilot and copilot the flight experience which is vital to safe
operations. No airplane of this size with a twin fuselage configuration exists. The pilot seat in
the left fuselage will require rewaining the pilot and copilot both for take off and landing as the
motion cues will be quite different.
If deemed necessary, a flying simulator could easily be made at a future date. This simulator
would employ the software designed for the ground based simulator to alter the flight
characteristics of a business jet or small commercial jet to mimic the characteristics of the
Eclipse. This used in conjunction with the ground based simulator would provide more than
97

98
f-
l-t-
C_
E
cs_
LI.m
LL

sufficient training for the flight crew. The drawback to the flying simulator is the cost associated
with maintenance of the simulator when not in use.
The cockpit is located in the left fuselage. The pilots sit on a raised platform in the cockpit for
enhanced visibility over the nose. The launch panel operator sits on the right hand side of the
fuselage, behind the raised platform. A galley and lavatory are provided in the cabin for crew
comfort during the mission.
99

(Thispage leftintentionallyblank.)
I00
9. COST ANALYSIS
There may be no greater challenge that this airplane must surmount than its budget. This
section gives the background on the methods used to calculate the life cycle cost and per mission
cost of the Eclipse. It is followed by the discussion on the financial viability of this project and
the number of missions required to be flown in order to meet the initial cost goal of $10 million
per mission for the airplane. Finally, a mission cost, including the Gryphon, is presented.
9.1. Cost Analysis Method: Overview
All cost analysis methods used for this section is based on statistical methods. 8 These methods
are derived from empirical data collected from all types of existing airplanes. The take off
weight of the Eclipse, at 1,227,000 pounds, is greater than the heaviest weight from the empirical
data which could have effected the accuracy of applying this method to this particular cost
analysis.
Since only two airplanes will be built, this program can be typified as a prototype production.
Prototype production costs per airplane are higher than comparable manufacturing costs for a full
production run. The Eclipse will cost significantly more than a comparably sized commercial or
military airplane for this reason. However, there is no other airplane which can accomplish this
mission. The question then becomes should the mission be modified to lower airplane cost or is
this purchase price justified.
9.1.1. Airplane program
The overall stages of design, manufacturing, operation, and disposal make up the airplane
program. The airplane program can be divided into six phases:
Phase 1 - Planning and Conceptual Design
The planning phase includes mission requirement research and deriving mission specification.
The early conceptual design and cost analysis done by the Eclipse design team are in this phase.
Although the cost of design by the design team is very inexpensive, the cost of further initial
design requixed for the real production can be significant.
Phase 2 - Preliminary Design and System Integration
In this phase, serious design trade studies are conducted to find out what combination of
technology and cost which might result in a viable airplane.
PNiCEDING PAGE BLANK NOT FILMED101

Phase 3 - Detail Design and Development
For most airplane program, during this phase the airplane and system integration design is
finalized for certification flight testing and for production. However, this program requires
minimal certification and will not be mass produced. Therefore, the cost for this phase will be
significantly lower than the usual programs. The acquisition cost for the Eclipse is included in
this cost as the procurement of test articles.
Phase 4 - Manufacturing and Acquisition
During this phase, the airplane is manufactured and delivered to the customer. No airplanes are
delivered during this phase for this program and consequently, there is no cost associated with it.
Phase 5 - Operation and Support
The plane is acquired and operated.
in this stage.
Support activities required for the operation are included
Phase 6 - Disposal
The airplane is no longer operable. Disposal activities include destruction of the airplane and
disposal of the remaining materials. In this case, there is no disposal cost as the airplanes will be
donated to a museum.
Table 9.1.1 lists the specifications used for the cost analysis of the airplane.
Table 9.1.1 Airplane cost analysis specificationsTake off weight 1,260,000 lbfMaximum sea level velocity 300 keasNo. of airplane to be produced 2 airplanesNo. of missions total 60 missions
ii i
The life cycle cost of is def'med as the total cost for the six phases:
LCC = CRDTE + CACQ + COPS + CDISP
where:
LCC = life cycle cost [$]
CRDTE = research, development, testing, and evaluation cost (Phase 1-3) [$]
CACQ - acquisition cost (Phase 4) [$]
COPS - operations cost (Phase 5) [$]
CDISP = disposal cost (Phase 6) [$]
(9.1.1)
102 ....

The acquisition cost is omitted from this analysis because due to the very low production
number, all of the airplanes required for the mission are built during the research and
development phase. Also the most of the flight testing cost was eliminated because the Eclipse is
an experimental airplane and does not need extensive flight testing for certification.
9.1.2 Prototyping cost
The mission specification only requires one fully operational Eclipse and one additional
Eclipse for spare parts and emergency purposes. Due to the low production number, the Eclipse
airplane program can is a prototype program. A statistical relation, based only on a reduced
empty weight, for estimating the cost of developing, manufacturing, and flight testing of a
prototype program is used for this estimation: 8
Cptor = (1115.4)(103)(W...p,)°'x_ (Np,x)o.99 CEF,_r (9.1.2)CEF19_3
where:
CPROT = total cost for prototype program [$]
Wampr = empty structural weight [Ibf]
Nprot = number of prototypes to be built
CEFthen year = cost escalation factor for 1993
CEF1973 = cost escalation factor for 1973
The cost estimation of the entire program derived from this method for the Eclipse using this
method is $450 million. This figure is attractive, but appears low when compared to
approximately $400 million to purchase two Boeing 747s, and was used only as a ball park
estimations and as a guide for the later, more extensive, cost analysis.
9.1.3 Research, development, test, and evaluation cost
The research, development, test and evaluation (RDTE) cost is accumulated during phases 1
through 3. The RDTE cost is defined as following:
Cwr n = C_, + C_., + C_., + C_,, + C_, + Cp.o. + C_, (9.1.3)
where:
C.d, = airframe engineering and design cost [$]
C_., = development support and testing cost [$]
C_,, = flight test airplane cost [$]
C_,, = flighttestoperationscost[$]
C,a, = testand simulationfacilitiescost[$]
103

C_, = RDTE profit [$]
Cr=, - P.D'rE Fmance cost [$]
Most important factors in calculating the airframe engineering and design cost are the empty
structure weight and the maximum sea level velocity. It is assumed that the design incorporates
only those technologies and materials which are readily available. It is also assumed that
computer aided design is extensively used in the design process.
Due totheexperimentaland low productionvolume natureoftheEclipseairplaneprogram,the
costofproducingalloftherequiredairplanes(oneoperationaland one spare)isincludedin the
flight test airplane cost.
The flighttestoperationscostwillonlyincludethecostofestablishingtheairworthinessofthe
Eclipse.
The test and simulation facilities cost is the cost of building a new dedicated test facilities.
Although the program will require the use of existing test facilities whenever possible, due to the
size of the Eclipse a special test facilities may be required.
The manufacturing company involved in this project will require a significant amount of profit.
Usually the profit margin is set at 10% of the entire cost. However, due to the weak industry
demands, the profit levels are currently very low for most companies. For the Eclipse airplane
program the profit margin is set at 7%.
In most cases, due to the large amount of capital required, the manufacturer will borrow money
to finance the RDTE phases. The finance cost is defined as the interest payment accumulated
due to the borrowed capital. The current level is set a conservative 12%. It is of interest to note
that it might be possible for this project to be considered for low interest governmental loans.
9.1.4 Operating cost
For the purpose of calculating the operating cost of the Eclipse airplane program, the military
operating cost estimate methods are used. The military operating cost was chosen over the
civilian operating cost because of the Eclipse airplane is an experimental airplane. The overall
operation and missions will be similar to a military nature.
The program operatingcostcan be brokendown asfollows:
104

COPS = CPOL ÷ CPERSDIR ÷ CPERSIND ÷ CCONSMAT
+ CSPARES + CDEPOT + CMISC
where:
CPOL "- fuel, oil, and lubricant cost [$]
CPERSDIR = direct personnel cost [$]
CPERSIND = indirect personnel cost [$]
CCONSMAT = consumable material cost [$]
CSPARES = spares cost [$]
CDEPOT = cost associated with depots [$]
CMISC = miscellaneous cost [$]
(9.1.4)
The cost of fuel, oil, and lubricant used depends on the type of airplane, mission of the
airplane, annual utilization, and number of airplanes in active service. Compared to other costs
in this program, this cost is almost nothing.
The direct personnel cost includes the salaries of the air crews and all maintenance crew. The
personnel cost greatly depends on the personnel's skills and experience.
The indirect personnel would include those people in administration level and other support
CrCWS.
The consumable materials cost include degradable parts which must be restocked after each
missions.
The spares cost is the cost of replacing all parts which are worn out and must be replace due to
the operations.
The depot cost is the cost of overhaul, maintenance, and storage facilities.
The following miscellaneous cost elements contribute to the operating cost of the Eclipse:
1. Requirements for technical data to support maintenance functions
2. Requirements for training, training data and training equipment
3. Requirements for support equipment
105

9.1.5 Disposal cost
Although it is common standard practice to estimate the cost of the disposal when the airplane
is no longer operable, due to the uniqueness of the Eclipse, it is reasonable to assume that the
airplane can be donated to a museum. Thus, the cost of disposal for this airplane is neglected.
9.1.6 Life cycle cost
The actual life cycle cost of the Eclipse airplane, based on six missions each year for ten
operational years, is found in Table 9.1.2.
Table 9.1.2 Eclipse life cycle cost (in millions of 1993 dollars)Research, Development, Test and Evaluation Cost $1.697 billion
Airframe Engineering and Design CostDevelopment Support and Testing CostAirplane ManufacturingCostFlight Test Operations CostTest and simulation CostRDTE ProfitCost of Finance
OperationCostFuel,Oil,and LubricantsCostDirectPersonnelCostIndirectPersonnelCostConsumable MaterialsCost
Cost of SparesDepot CostMiscellaneous
II
Total Life Cycle CostCost per Mission
$327$37.0$999
$0.838$16.6$116$199
$i8 million$3.45$5.05$2.88
$0.144$2.34$3.6O$0.540
II
$1.715biLLion$28.6million
9.2 Project Viability
The accuracy of the methods described earlier are questionable since the weight of the Eclipse
is probably out of the accurate range for these methods. But as it currently stands the viability of
the Eclipse airplane program is seriously threaten by the cost per mission. Based on the
prototyping cost mentioned earlier in the chapter, the cost per mission of under $10 million was
deemed possible. However, the more intensive method of cost estimation has resulted in the c0st
per mission of $28.6 million, almost three times over the recommended cost.
The biggest factor contributing to the high cost per mission is the conservative number of
missions planned per year. The six missions per year for 10 years is not enough of missions to
adequately defend this project. The relationship between the number of mission and the cost per
mission is clearly presented in the Figure 9.2.1. By increasing the number of missions from 60
106

to 100, the cost per mission can be reduced from $28.7 million to $17.2 million. The target goal
of $10 million per mission can be achieved by increasing the total to 175 missions.
The total number of missions can be increased in three ways. First, it can be increased by
increasing the number of missions per year. However, market studies show that finding more
than twelve customers per year (for six missions) will be very difficult to achieve. Another way
to increase the total number of missions is to increase the operational life span. Most airplanes
have operational life of more than 25 years. To use the Eclipse airplane for ten years when it is
only flying six missions a year would be a great waste. The third way involves finding another
mission for the Eclipse. While this would increase the number of missions, it would also
increase the possibility of losing the airplane.
90
80
70
60
50
4O
30
20
10
0¢Jl
"_ I I I I
0 '- 50 100 150 2008.
Number of Missions
Fig. 9.2.1 Cost per mission versus number of missions
9.3 Total Mission Cost
Based on the single vehicle cost of the Gryphon, a total mission cost for a flight with a typical
space booster can be calculated. The Gryphon is expected to cost $22.1 million per vehicle. 15
Adding this to the $28.6 million per mission for the airplane, a total cost of $50.7 million is
anticipated for a vehicle launch. This is a very competitive cost for today's markets, even
thought the original cost estimates were not met.
107

9.4 Future Recommendations
It: Jrder to secure the economic viability of the Eclipse airplane, a more detailed approach to
the cost analysis must be found. More research is required to find an accurate method for
estimating the manufacturing cost of the airplane of this magnitude. There may be ways to
decrease the overall project cost to about $1.5 billion. This high cost could still represent a
stumbling block to the program, however, as it is difficult to raise this much venture capital.
There are also many methods of reducing the overall cost which should be considered. One
way to reduce the cost is possible leasing of the engines. Since the engines will be used only six
times a year, it might be possible to lease the engines from General Electric rather than
purchasing them. Another option would be to redesign with a high degree of commonality with
an existing aircraft which would reduce part costs.
108

10. WIND TUNNEL TESTING
One of the original goals of the design project was to carry out wind tunnel testing on a model
of the Eclipse to check the validity of the analytical methods. Fortunately, there was an
opportunity to do testing in the beginning of June so a model was constructed and subsequently
tested.
10.1 Model Fabrication
Due to the size of the Eclipse, the scale of the model had to be very small. A scale of 1:120
offered easy conversion and a wing size close to the maximum which could be manufactured on
the mill. In order to accurately model the wing airfoil section, the wing was milled from a single
piece of aluminum. The fuselages were made from wood which was cut to shape. The tails have
an aluminum core with balsa wood added for the proper thickness and shape. They were then
fiberglassed for durability. Flow on the wing was tripped with a strip of tape which was attached
at the transition point predicted by the computational fluid dynamics work.
The first step in making the wing was to create a model of the wing in SDRC I-DEAS. This
model was then used to generate computer numerical control (CNC) mill cutter paths. After post
processing, the CNC mill cutter paths were checked for errors. Finally, the paths were run on a
Bridgeport three axis numerical control mill. Finally, the wing was polished. Unfortunately, the
wing was too thin at the trailing edge and was easily damaged. To avoid this, the rear 1/16" of
the wing was removed. The manufacturing of the wing was supported by a National Science
Foundation contract, #USE-91513228.
10.2 Test Results
Testing was conducted in the University of Michigan 5'x7' subsonic wind tunnel at speeds of
100 and 150 mph. The test data was then scaled to the 10,000 foot low speed loiter condition
which corresponds to Re = 39.4x10⁶. Figures 10.2.1 and 10.2.2 are the lift curve and drag polar
comparisons, respectively.
As can be seen from the lift curves, the slope is almost exactly as predicted. However, the zero
lift angle of attack is not correct. This is most likely due to the lift effects of the tail and an
improper mounting angle for the wing on the model. Also, there is a difference in the slope
between the clean and with payload conditions. The assumption was made that flow would be
109

@
c_
oo
c_
_qt
Ce_
II
0
I I I , • • I I , _ , I
,wl
C_
._=_
'ID
111

it"q
0o-a
o_
(J
0..
ogm
E0¢.J
u
°_m
e..
d
,o
o_
110
forced parallel to the wing and therefore not be altered by the payload. The change in slope is
most likely due to the scale of the model, where the Reynold's number is not high enough to
allow for the aforementioned assumption.
The clean drag polars show good agreement. The configuration with payload attached has a
large discrepancy in Cdo, however. This could be from a faulty prediction of the zero lift drag
for the payload. Another explanation is that the scale of the model, with low Reynold's number,
made for a large amount of choked flow between the fuselages. On the real model, the boundary
layer would not be as large and therefore less choking would occur, lowering the drag.
112

11. CONCLUSIONS & RECOMMENDATIONS
The design presented for the Eclipse within this report meets or exceeds all of the mission
specifications set out for the airplane. Namely:
• Payload capacity is 500,000 pounds and the payload can be dropped in flight
• Launch altitude is 43,500 feet, which is above the 40,000 foot specification
• The mission radius is 750 statute miles
• The airplane is capable of operating from existing runways
• Able to perform a 2.2g post launch maneuver
• Utilizes existing production methods arid equipment
The Eclipse has some unusual design configurations to meet these specifications. Most
noticeable are the twin fuselage design and the high aspect ratio wing. The twin fuselages allowed
for better payload and landing gear integration while the high aspect ratio wing was necessary for
maneuverability at high altitude. The Eclipse is powered by six GE-90 turbofan engines rated at
100,000 pound of thrust each. These are necessary for flight to altitude. There is a large number
of wheels to distribute the loads on the runway. The other systems are modeled after similar
systems on existing airplanes.
The design team has used some extra methods to get a better idea of some numbers which were
questionable in Class II methods. An attempt to obtain better high angle of attack data using
computational fluid dynamics was made. An analytical wing weight model was used to better
model a significant portion of the airplane empty weight. Also, an in-depth performance analysis
was made to better estimate airplane position and speed as well as fuel consumption. Wind tunnel
testing was done to verify some of the assumptions which were made in the aerodynamics
calculations.
It is technologically feasible to design an airplane capable of fulfilling the mission requirements.
While the large up-front cost for the airplane may be prohibitive, if the airplane can be funded,
financial feasibility for the program can be obtained in one of three ways: more Gryphon launches
per year, a longer lifetime, or alternate missions for the Eclipse
The next logical step is to incorporate the knowledge gained in the wind tunnel testing into the
calculations. Also, while most calculations were iterated to closure, there are some areas where
more calculations could be done. Further discussions with the Gryphon design team could also
help to optimize the design.
113

(This page left intentionally blank.)
114

12. REFERENCES
1 Roskam, J., Airplane Design Part I: Preliminary Sizing of Airplanes, Roskam Aviation and
Engineering Corp., Ottawa, Kansas, 1989.
2 Roskam, J., Airplane Design Part II: Preliminary Corrfiguration Design andlntegration of the
Propulsion System, Roskam Aviation and Engineering Corp., Ottawa, Kansas, 1989.
3 Roskam, J., Airplane Design Part III: Layout Design of Cockpit, Fuselage, Wing and
Empennage, Roskam Aviation and Engineering Corp., Ottawa, Kansas, 1989.
4 Roskam, J., Airplane Design Part IV: Layout Design of Landing Gear and Systems, Roskam
Aviation and Engineering Corp., Ottawa, Kansas, 1989.
5 Roskam, J., Airplane Design Part V: Component Weight Estimation, Roskam Aviation and
Engineering Corp., Ottawa, Kansas, 1989.
6 Roskam, J., Airplane Design Part VI: Preliminary Calculation of Aerodynamic, Thrust, and
Power Characteristics, Roskam Aviation and Engineering Corp., Ottawa, Kansas, 1989.
7 Roskarn, J., Airplane Design Part VII: Determination of Stability, Control and Performance
Characteristics: FAR and Military Requirements, Roskam Aviation and Engineering Corp.,
Ottawa, Kansas, 1989.
8 Roskam, J., Airplane Design Part VIII: Airplane Cost Estimation: Design, Development,
Manufacturing, and Operating, Roskam Aviation and Engineering Corp., Ottawa, Kansas, 1989.
9 Berry, D.L, Civil Aircraft Propulsion Integration: Current and Future, Boeing Commercial
Airplane Company, Seattle, Wash., Unpublished, Nov. 12, 1992.
10 Harris, C.D., "Aerodynamic Characteristics of a 14-Percent-Thick NASA Supercritical
Airfoil Designed for a Normal-Force Coefficient of 0.7," NASA-Langley Research Center,
Hampton, Virginia, NASA TM X-72712, July 1975.
11 Raymer. D.P., Aircraft Design: A Conceptual Approach, AIAA Educational Series,
Washington, D.C., 1992.
12 Udin, S.V., and Anderson, WJ., "Wing Mass Formula for Twin Fuselage Aircraft," Journal
of Aircraft, Vol. 29, Sept.-Oct. 1992, pp. 907-914.
13 Poth, S.M., Jr., et al., Design of the Pegasus III Carrier Vehicle, University of Michigan,
Ann Arbor, Mich., Dec. 1992.
14 Choi, R., et al., Aerospace 481 Maize Team Report, University of Michigan, Ann Arbor,
Mich., Dec. 1992.
15 Fisher, M.A., et ai., Project Gryphon: Air Launched Space Booster, University of Michigan,
Ann Arbor, Mich., June 1993.
16 Lewis, R.J., St., Big Engine Data, General Electric Aircraft Engines, Evendale, Ohio,
Unpublished, Nov. 16, 1992.
115PI_IDfIDING PAGE BLMIK NOT FILME{:)

17 Bcngclink,R.,Bocing Commercial AirplancCo.,Scat'tlc,Wash., PcrsonalConversation,
Feb. 1993.
18 Vinh, N.X., Aerospace 440 Vchiclc Systcms Performance Unpublished LectureNotes,
UniversityofMichigan,Ann Arbor,Mich.,Jam-May 1993.
19 D¢ Zccuw, D.,QuadtrccCFD Code,UniversityofMichigan,Ann Arbor,Mich.,Fcb.1993.

A. GRYPHON SUMMARY PAPER
PROJECT GRYPHON : AIR LAUNCHED SPACE BOOSTER
University of MichiganAerospace Department - Space System Design
Ann Arbor, Michigan
Professor Joe Eisley
James Akers, Teaching .AssistantMike Fisher, Asst Project Manager
Krista Campbell, Adam Nagaj, Elizabeth Hilbert, Alan Ristow, Ron Shimshock
Abstract
The Gryphon Design Team has developed a nextgeneration S00.Ot_ Ib air launched space booster. TheGryphon is launched from a t.2 million Ib aircraft, theEclipse, at 4.4.000 ft. The primary purpose is the deliveryof 7.900 Ib to Geosynchronous Transfer Orbit (GTO) and17.000 Ib to Low Earth Orbit (LEO). With these payload
capabdities, the Gryphon is able to beat out competitorlaunch vehicles cost per pound by 50% which allows
investors a t5% return on their investment. The designhas also allowed for the ability to supply Space StationFreedom, based on the Space Shuttles capabilities. Since
the Gryphon was designed to compete with existingvehicles, cost has been minimized in all areas. Therefore,
only 'off the shelf technology has used in the design
process.
Introduction
The goal of the Gryphon Design Team was to develop a500,000 Ib air bunched space booseerwith the capability of
delivering 7,900 to GTO and 17,000 Ib to LEO. These
payload goaLs were determined in order to beat thecompetition's cost by 50% to insure investor's of a 15%
ret_'O.
The task of designing the Gryphon was daunting. No
project of its size and nature had been previouslyundertaken. OSC has begun an initial study of a similarsized launch vehicle called Pegasus m, but they have yet todecide whether they will continue. An additional challengestemmed from the 'real world' application of the Gryphon,since there is current commercial interest. This restriction
has not alJowed forthedesignof components and systems
tobe developed inthe 'future', or without cost constraint.With the added dimension of a 14 week semester,the
Gryphon has been designed as efficiently as possible.above and beyond all of the limitations imposed.
initial weight recommendation and stipulation of a 15%return, the entire project's development was left co :he
design team.Unlike the Pegasus. which is camed underneath a L lOl I.
the Gcy.phon's weight caused an entu'ely new aurcraft to hedeveloped in order to carry it into the upper atmosphere.The Eclipse Design Team, which designed the earnerairplane, specified a drop at approximately 40DO0 ft at aspeed of 500 mph. With this knowledge, the technicalgroups proceededintheirresearch and design. At the start.
the Pegasus was used as a baseline and many aspects weredesigned as larger upgraded versions of those found on thePegasus. However, it was quickly realized thatextrapolating components from a 40,000 Ib vehicle to a500,000 Ib vehicle was not always possibk. Even though
many aspects from the Pegasus could not be used, theGryphon still resembles current launch vehicles. All the
systems and components ate currently available. Its trmalconfiguration results from a combination of cost,simplicity, and available technology. F'tgures l and 2 showa _ansparent view of the Gryphon and how theE-'lipseand
Gryphon look while alt_bed.
Reason for the Conflgm'atlon
Robert Loveii of Orbital Sciences Corporation presented
the idea of a large air launched space booster based on his
department's belief in a market opportunity between theSpace Station Freedom resupply needs and the commercialcommunications industry. The 500,000 lb weight
suggestion was based on his intuitive knowledge of
available engines and their capabilities. Other than his
117
FTqlI T_t View of Gryphon
O_GINAL PAGE IS01: POOR OUALITY

cost Aaa_
Fig 2 Gryphon and Eclipse attached
The most important aspect of this project is to giveinvestors a 15% return on their investments. To achieve
this, the cost (per pound of payload) of the Gryphon wasdetermined in order to beat the launch prices (also per
pound of payload) of chief competitors by at least 50%.This leaves the other 50% for financing, insurance, and
profits while still having a competitive price.Gryphon's main competitors in the satellite launch
market are the Ariane 4, Atlas Centaur, and Titan3. The
price data for these and other launchers are listed below inTable I. Note chat Anane prices are in 1990 dollars, Atlasand Titan prices are in i991 dollars, and numeric figures
are averages.
Launch Prices of the Competition
Payload Launch i Price per
Size (,Ib) Price ! Pmmd4.190 $ 65 million j $15.513
5,730 S 67 million [ $ i 1.6926,610 $ 70 million S 10.590
7_50 $ 90 million [ $12,766
8_160 $95milUon [ S 11,642
9260 s ItS minionI s 12.,)195_1441 $60 million [ $ l 1.655
I0)978 $ !In million[ $ 10D20
Table 1
LaunchV, biele
Anane 40
Anane 42P
Anane _tP
Arinn_ 421.
Arian.e _LP
CeW._||r
Titan 3
Using the market average price per pound of thecompetition derived from Table l and an inflation factor of4.5% per year. a project goal cost per pound of $ 6.200 wasdetenmned. This cost per pound wamlates into a payload of
7.900 lb to GTO and a per mission cost of $49 million.The final cost analysis is given below in Table 2. The
costs given are high estimates and include a fifty milliondollar development cost (which is what OSC used for their
Pegasus program).
I Airplane CostProieczCostsVeh_icle Cost
Airplane Operating Costs
Table 2 Cost Am,b/sis
i $ 1,000 million
$106 million
$ 28 million
$ 2 million
The total mission cost was calculated by dividing the
one-time costs (the airplane and project costs) by sixtylaunches and adding the per launch cram for the vehicle
and plane operation. Sixty launches was chosen as arealistic estimate for the number of launches that would be
performed over ten years. This estimate is based on therecent satellite market. Table 3 shows the fmti mission
cost of the Gryphon. It should be noted that this costestimate meets the project goal of $49 million per launch.
Table 3 Cost of Gryphon
[TotalMissionCost 460 launches)[ $ 4_3 million[
Per Lmmch Cost
The per launch cost of the Gryphon is 527.9 million.while the per launch cost of the Eclipse is 52 million. A $1billion fixed cost of the Eclipse must be evenly sps_ad overeach launch. For a projected durationof60 launches, thiscalculates to a total average cost per launch of $46.6million. The minimum price that can he charged perlaunch and stillturn a profit in the last year is $65.2million. This includes an additional 18% for insurance.Disregarding the amount per launch towards insurance
premiums, the Gryphon grosses $55.2 million per launch.
The net profit is the amount grossed per launch minus thetotalexpenses per launchresulting m a netprofitmargin of
58.6 million per launch.
118
......... "w

Vdstd,Comnpnttom
The Gryphon consistsof threestagesforthe GTO
coefigunmou.FortheLEO coe_igumuou,thethirdstageenginemd prupetlmtumks areremovedandrep4acedwith
puttpayload.Bothconfigurationsusesolidand storableliquidfuels.FortheGTO versmu,a cryogemcthirdstageisemployed.Allel"themajorcomponentsootheGryphonKe listedin
Table4 and theoverallparametersinTable5. A picturedetailing all of the maj_ systems within the Gryphon mshown m Figme 3.
Table 4 MaJ¢Stale 1
2 Cx, tor Solid Rocket M_m,s
LR9I l_quid Rocket Motor_-Eclipse Rinm_s__1 & 2
_._ne Mount_Jm__Altteh l_ing_1
Vmical Tail
[ntersmlze [_in zAft Noz_e Cover
Fai_tug Attach Pints
•ComponentsSt_e 2
2LR91 Liqmd RocketMotors
Gryphon-EclipseRings3- 8Plane Attach Rings 2 & 3
External Siau
Strut Supuort RingEngine Mountlntmsmge Ring
SUle31 RLIOA-4 _ Liquid "
FundRocket Motor
Pa_oad Intaf_External Skin
smePowa/Aviom_ Rinl
Cabiiml
H),drazine/Ox/dizer & TanksCoauel ]'anaten
Venunt SystemThermal Coamd
Banen_
Radar Tramvoeder
Telemea 7 TnmmitlenGPS
InaUli Gmdan_ (IMU)
Table S OverallParame_'
stage.t_,3 .,,d ANC
C_poueum ou Ef.lip_ToudTouaLea
Total LL-n,7_hwithout ANC
479,056 lb
t0,435 lb489,491 Ib17Aft 3in106ft 31n32ft2in30frOm
LEO
476.368 lb10,435 Ib
486.803 Ib10,t ft 5ia86 ft 5in32ft2in
3Oft 0m
O_G'iNAL P,_,CE _S
OF POOR QUALITY
119
Fil 3 Immmal Compoumts
Mlmtom, mly
Tml tory
Analysis of the Cn_/phon's ascent umj_tory wascompleu_d using nomoipmp_ and • series of equmious.lniul vehicle pm_mmm_ were read from d_ nnmograp_.and the results were substituted into tl_ appropriateequmiom. A MATLAB mtuine w_ _ritum to solve thesystem of equtioaa that yielded tim u_cond smileun nm /.
Initially. the C_/l_OU is dropped from the belly of
causes it to pitch up appmximmely 20 delg"emdm_q; the
easuiall I0 second drop. At this peiat, the fumt smg_mllinm ilPui_ m_i _ Gtypbnm hegira iu m into spKg.The _ litChmupwardatahue_ 6.25degn_ per
secauduntilitteachesa pitchangleof I0 degreesfromvmiml.Pitchemmel isachievedby gimb_mg theeeginenozzl_ The Cayphem pitchesbackdm,u beforesecond
su_ ipilioa, to m mille of 70 dellmm fremveniod. Pitch
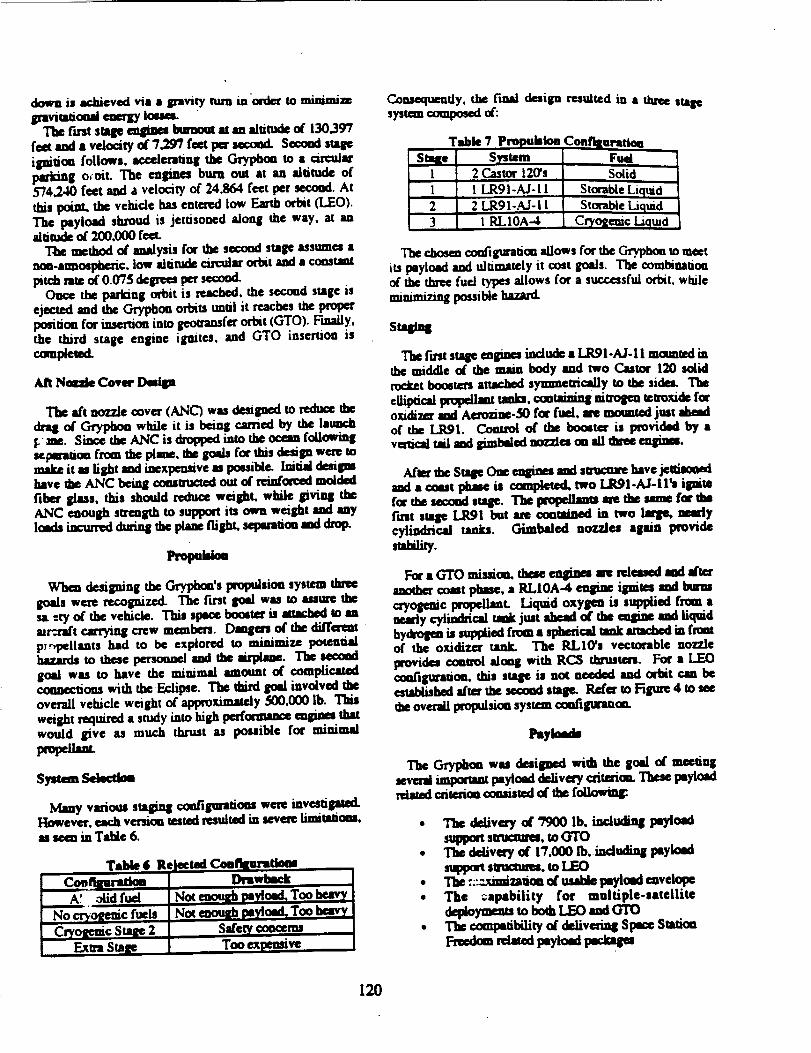
downis achieved vii • gravity turn m "caxlerto mimmiz¢
gravitational ¢umly Io_=.The fumt stage eagiam lamamt at an altitude _ 130397
feet and • velocity _ 7,297 feet per second. Social stage
ignition follows, accelmting the Gryphon to • circularparking oroit. The _gines burn out at an altitude of574,240 feet and a velocity of 24.864 feet per second. Atthis point, the vehicle has entc:cd low Earth orbit (LEO).The payload shroud is jettisoned along he way, at analtitude of 200,000 feet.
The tmthod of analysis tot tl_ second stage assume_ •non-aunmpberic, low aldtude circular orbit and • cmuumtlatch hug of 0.(Y75degrcm per seco_
On¢¢ tl_ parl_ng orbit is reached, the second stage isejected md the Ca'ypbon orbits unui it reaci_s the properposition for insertion into geouansfcr orbit (GTO). Finally,the third stage engine igaitu, and GTO insemon iscompleu_L
Aft Noa_ Covet"
The aft nozzle cover (ANQ was designed to redaa: tl_drag _ Gcyphon while it is being carried by the launchl_ me. Since the ANC is dropped into tlae ocean followingsepmaon from the plane, the goals for this design were mmalr_ it amlight and inexpcmive as pomibi¢, lmfal desigmhave the ANC being cousmtct_ out of reiul'ccccd moldmlfiber glass, this should reduce weight, while giving tl_ANC enough su'mgth to support its own weight and anytmds iucun_d cumngd_ pta= flight,sct:_mmu md dm_
Pmpul,_
Whm designing the Oryphon's propulsion system thr_goals w_n_ recognized. The fuat goal was to assure tlwsa ;ty o[ tl_ vehic_. This spa_ bomtm"is amch_ m mmr-'.ml'tcm'ryiug crew mcmlx'_. Dam_p_mof tl_ dilTm_tp;r_p¢llants had to be expior_ to minimize potentialhazards to tlmse persona¢l and dm airPlmm. "I'hes_x:ondgoal was m have the mimmal amount of complicauxlconnections with ti_ Eclipse. TI_ thint goal involved tlwoverall vehicle weight of apwoxima_y 500,000 lb. TI_weight required • study mm high pmrfmmma_ mginm thatwould give as much thrust as pouible for minimalpmpcllam.
S3n_tem_
Many various staging conliguratiom wine iavestipml.However, each version u_uai resulted in severe limi_iom,as s¢on m Table 6.
_ogmc f_!s [ Not _ mylmd, Too heart I
I Cryot_c su_ 2 ! s_'_ omm_ II Extra Sta_¢ I Too ex,,p_nsiw J
Con,_equeudy. the final dmigu r_ulted in • three stagesysuna compmol of:
Table 7 Propuisioa ConflguratioaStaLe System Fuel
1 2 Castor 12(Ys Solid
1 ! LR9 I-AJ- 11 Storable Liquid2 2 LR91-._d - i I Storable Liquad3 I RLIOA_ Cryo_emc Liqwd
chosen configurmiou allows for the Gryphon to meetiu payload and ultimately it cost goals. The combinaUOUof _ thi_ fuel types allows got • successful orbit, whileminimizing possible hazard.
sms_q
The furst stage engim_ include a LR.91-AJ-I 1 mcunuaf inthe middle of the main body and two Castor 120 solidrocket boottets anached symmetrically to tiz sides. The
cLli_csl pmpellmu tanks, cmminiag niurog_ teuroxideforoxidi_m'and Amuaiae-50fotfurl.aremmmt_ justaheadoftheLRgl. Comml of tl_bomtm, ispmvid_ by •
vmicaltellandgimbaledmzzlm on all_ engimm.
Aim tl_ Sta_ Om eagiam and sma:mm have jeai_u_and • coast pha_ is complea_ two Lggl-A_-II'_ itlmtegot tl_ so:_ad suq_. Tim wopegmm m_ tim muae got timCuret8tagz I.Rgl but are contsined in two lsrse, marlycylindrical tanks. Gimbaled nozzles again providembih'ty.
For • GTO mission,throem_giam arere.lms_andaftra"
anmhin" corot pimp, • RLIOA-4 engine ignim and bunmcryogenic propellant. Liquid oxylpm is supplied from •uem'lycylindrical trek just alnamdof tim _ and liquidhydrogenissupped from• spl0mmadumk anadwd infrontof the oxidizertank. The RLIO'_ vectotablenozzle
providmcontrolalongwithRCS thrusten.For • LEOcom_gurauon,this stage is not needed and odxt can beestab4ished al'tm' the second stage. Rgt'_ to Figure 4 m _t_ overall propulsion system coatiguma,'_
The Gryphon was d_ip_ with the goal o( m_ingsevml importma payload delivm_/crimio_ _ payloadneiamd criunrionomsist_i _ tl_ f_
• "l_ d_iv_7 _" 7900 lb, immludi_ payiomdsupport su'u_xum, to GTO
• The delivery _ 17,000 lb, including payloadsupport smamu_, to LEO
• TI_ ::-..:ximizmiou of usa_ p_cad mve.lo_• The :apability for multiple-satellite
dep_oymam to bo_ LEO and OTO• TI_ ompmibility of delivmiag Space Suaion
Fm_au r_a_d pay|oad pe_gm
120

3rdStage FuelTrek RL10A-4EncJfle
LR91-AJ-11Engines
ZndStageFuetTank
LR91
Fill 4 Overall propublou System
These goals acid as the driving force behind the design ofthe Crryplma. The delivery weights of 7900 and 17.000 lbfor GTO and LEO missions were decided upon altercamrulc_msideratieu of the likely madr_ demmd endthecostanalysis.Tbe 1_3syuchrooomdelivc_ limit will allowthe booster to carry a large majority of the currentlyexisting commercial communication satellites to theirumssfer orbiu, utilizing either single or multiple payload
cmfit_stioas. The low ea_ capability will allow for thedelivery of a large vinery of scientific satellites, either insingle or multiple coufigurmiom. This 17,000 lb limit and15 ft diameter will also allow for the delivery of payloadpackages to the Space Stmion Freedom.
Paykmd Bay Dimemioas
The volume of the Gryphon payloadenvelopewasmaximizedinorder to easesatellitedesignand payload
co_guntiou comtramts. Tbe _ of the paylmdenvelope provides several at•active feeuncs for potentialbooster customers, first, • large payload volume allowscustomersto retieve lmmchcosi_ by pmieimting inmultiple cus_erls_e deployments. Secoad, a iarjepayload bey eases tin design eemaaints which commaualand scientific salellite producers must adhere to. Third, •large psyiosd volume, in the case of the Gryphon allowsfor compatibility with proposed Space Station Freedomrelatedpayloadpackages.These packageshave• largedismeun' of 15 ft and lengths between 10 - 15 ft sadtherdme me able to be delivered by few launch systems.
Satellites mz usually cylindrical in shapewhen in theImmch configura6oe. Tbey cover alargerangeinsize,but
average %10 ft in diumcter and 8-12 ft in length. Thzvolume of the payload bey. approximately 19,675 cubicfeet, is large enough to accommodate both of thesepayloads in various ¢onfiguratiom (single. double, and
possibletriple stacked). The final design of the Gn/#mupayload envelope is shown in Figure 5.
Dimenmonsanfeet
_-=-I 5.83---m,
l_, $ Payk_l Bay I)Immslam
_ lO.OO
zS.oo
Slmee Ststiea Frmdam Optlem
The Spaee Station Freedms has been deeigned to be builtand resupplied by the Space Shuttle. AI_ the shunlemay be the most efficient vehicle to boost the acatai spa_suttioa compattents into SlXtCe,it is not dm most eft'relentlaunch vehicle for some of tbe _tui_Y mimniom."rlzrdom, the Gryphou has been dmil_md m be capd_e ofbombing some of the space strain• rempply peylosdsmorecost effectively.
All msupply of d_ spaoe smtien has been mmpncted intofour main elanents each designed to be beld in the space
shuttle payload bay. The major consideration indetermining which elements the Ca'yphon would be side toboost was size and weight. Tbe_om, listed below (Table8) are all of the elements with tbeLrn_peetive sizes and
weights (with cargo).
T-_._h_._S $Medule
MB.M
PM
St-ttom Module Paranwtt_
Wo_,.t 0b)34,75O
18,050
18,69511,040
Din - 14.6 ftLen_- 23 ftDin - 14.6 ft
tz56.8 x 43 x 12.5 tt14.7 x 7.3 x 13.8 ft
Although all of the above modules m about the rightsize 0o fit imo the Grypboa, tbe PLM is much too henry tobe cmsides_ Tbe pM is well below dn _ weighto( 17,0001b toLEO. The MPLMmndULC mejwt alltdeabove thz maximum weight. However, 41.6% of tbe_s weight and 18.4% of the UL_s weight is in thecareer aloee. If the• packagi_ weigh• could be reducedby as little as 10%, tlz Gryphm would be able to handlethroe modules. _y, the Gryphoa shcold be able
to caery tbe MPL_ ULC, taxi PM.
121

Guidance, Navism ion- and Comx_ (GNC) is the most
important responsibility o( Mission Control. MissionContrc/mustbe ab/etoaccuratelykeeptrackofGryphon°s
posiUou,velocity,and accelerationinordertodeterminewhatamtudgcontrolsneedtobe implemented. The mainareasof coucerntoassurethereliabilityofGNC arethelocauonof Mission Control.telemetry,tracking,andcommand, inet_al measurement, the global posiuomngrecaver, and the on-b_d computer-
Mlmia C.ontrol.SincetheGryphon issimilartoOSCs
Pegasus and will be performing similar missions, there isno jusUficatioa for building a new system. If the Oryphonusestlgsame existinggroundsupport in/rasu'uct_e thePegasus utilizes,the missionswillhave alreadybeonmatchodtothesystembecauseofthismissionmmlarity._fissmummilmty willalso havetheadv_tageofreducing
conu'acmalnegouationsreqturedfortheGryphon.
Tek_, Trackin8 and Comnmnd. The Gryphonpcoject wilt employ all telemetry, tracking and commmsd(TTC) services from the Eastern and Western Space andMissile Centers. All captive carry takeoffs from Kennedy
Spa_ Cen_ will be suppomMby the easternrange,andthosefromVsncknberg AFB wiU be suppom_ by the
wes_'nranl_
Inertial Measurement Unit. Inertial reference issupplied
by the strapdown inertialmeasm_ment uait(IN,J).consistingofintegrationgyro,copa._ accdemmetm,and sensore|ectronic_. A single gym produces oue
of the total angulK im_ai n_fe_nce, which isknown in body deXmed comdinaua. Ew,h acc_emngm"provides one ¢ompcxlent of the linear inerual cemtant,where each component ccfrespot_ to oae body defugd
TIz Litton I._-81 system is the choice of this design. Itis currently under contract for use and is thus tv.adflyavailableand cost effective, while providingthefu_:ticmdesired orsthe _ system.
Global poeltioains System Receiver. Using both cmteffectiveness and reliability as primary crite_aforselectian, the TrireMe _,dre.x is theGPS geceivegforuseon _ TrireMealsoprovidedtlgsix-chsmglGPS Rgceiverthatwas umd ou Pegasus.butthe¢_ is
animprovedvcrsieninthatitincludesa multipleantenna.The multiple antenna provides bmh bern= visibility andammde datecminmion.
Launch Panel Operatm"
It was decided that oae additienM crew member, enbomd
the Eclipse • Launch Panel _3era_ (LPO). would bema:dodto momtor the _Tphon's system'ssystemsbefot_and immediately afteg launch. Their re.sponsibilides will
_.lude:
Momtorms Gry0e_ md pa_ond
Provide external power to GryphonSwitch between external and internalpower (prior to launch)Update Gryphon IMU prior torelease
Download tmssion data to the flightcomputer and verify mission dataPrepare and enable vehicle for drop_q_eue. _ and d_play datafrom the vehicle and payload
The LPO will be seated at a comole that consisting of a
mggedizcd PC, display devices, a mass dam storage device,and a preasion IMU.
Ou-Bonrd Computer
The on-bonrd computer system inteffsc_s with the sub-systems and determizgs flag course of action that theyshould u_. In short, it funcumu M tl_ Ixaim behi_ the
Grypho_ and plays a _idcal role in *he success of themissiou. Table 9 details the c_stica o( the chosen_wu_ for the _
Table 9 C_ _,-_-¢____..'___ of Grypboa Computm'...... 32 bit, _ _k_,-,,la
Weipt
Tempmmm_
Vib. ,.,_,6fi_,__ _
v_ Module _ Sm16bitlOlb
4" X 8" X 8"
-40"C m4S*C
0.98 at _ el" !O-¥e.,__-_ihard_ m I ]v_---_d__n_m fagsmofI
Commankatlam SystemOva'view
The Gryphon'scommunicationssystem provided the link_emeen the spacecraft and ground control tiler launchfrom the carrier ajrcrat'L The comm,-_catien system wiqtransmittelemetry and trwJmq data m the groundconu_station and mmsmit te_minmion _nmands, if necessary.frem the iggoundto tbe Grypbc_T_ datawillceenst e_ pomtim, velocity,attitude,
and accede_afioninformation received from the GPS andthe IMU. If ao:essa_, the t_minafim cemnumd wiU beseat via an enmded (for security _) signalfromthe
groundm be roved and deco_ by specific FTS (FlightTmaination System) hardwm on thg_ All of themissiou control components (i.e. the CPU, GI_, andInmial Guidance Systems) are bolted to the tap of the
avimics bay (See Figure 3).
Strugtm'w
In gagnd, each stage has the fallowing sma:mres:
122
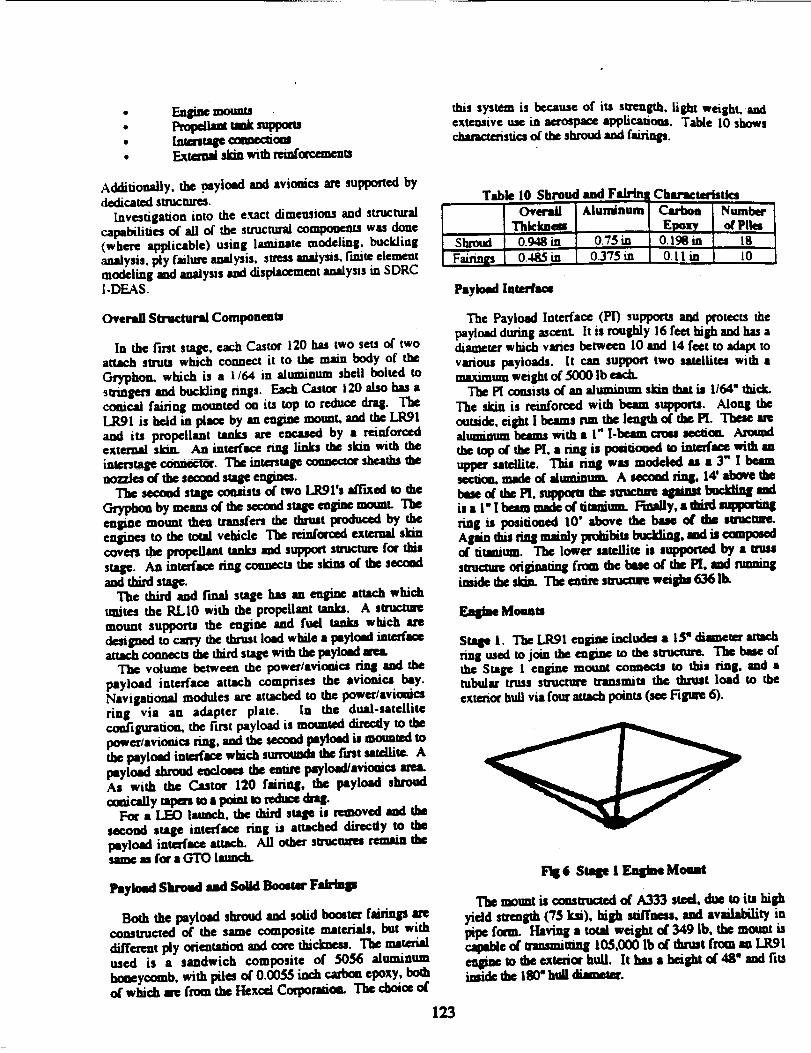
Engine mmmuPropettm W suppomIntmutage comectiomExtanai skin with reinfacentcms
this system is because of its strength, light weight, andextensive use in aerm_ appGcatiom. Table 10 showschamc_stics or"theshroudand fa_gs.
Additionally. the payload and avionics are supported bydedicated structures.
Investigation into the exact dimensions and structuralcapabilities of all of the structural components was done(where applicable) using laminate modeling, bucklinganalysis, ply failure analysis, stress analysis, Finite elementmodeling and analysis and displacement analysis in SDRCI-DEAS.
Table 10 Shroud aad Falrinl Charaetm-htics
Ovec'afi Aluminum _ Carbon NumberThkkness Epoxy of Plies
Sluoud 0.948 in 0.75 in 0.198 in 18Faffin_ O.-_K5in 0.3"75in 0.11 m 10
Payload Interface
Overall Structural Components
In the first stage, each Castor 120 has two sets o( twoattach struts which connect it to the main body of the
Gryphon. which is a 1/64 in aluminum shell bolted tostringers and buckling nngs. Each Castor i20 also has acorneal fairing mounted un iu top to reduce drag. TheLR91 is bead in place by an _ mount, and the LRgland its propellant tanks are encased by a reinforcedexternal skin An interface _ links the skin with theinwntngeconnector.The mtzntage coanecm¢ sheathsthenozzles of the second stage engines.
The second stage coamsts of two LRgI's sfl'txed m the_ by meansof the secondsuqle eel_e mourn. Teeengine mount thee transfers the _mt producedby theengines to the total vehicle The reinforced external skincovers the propellant tanks and support smtctm_ foe thisstage. An interface ring counects the skim of the secundand third stage.
The thin/and Final stage has an engine attach whichunites the RLI0 with the propellant tanks. A struc;m_mount supports the engioe and fuel tanks which aredesigned to carry the thnm load while • paylced interfaceattach connecu me third stagewith the _ylund
The volume between the poweflavicaics ring and the
payload interface attach comprises the avionics bay.Navigational modules are attached to the power/avioaicsring vi• an adapter plate, In the dual-satellitecoafiguration, the first payload is mortared directly to thepower/•viomcs ring. and the secood payloKi is mounted tothe payload interfacz which _ the fwst satellite, Apayload skmud euclmes the entige payioad/•viunics area.A# with the Castor 120 fairing, the payload shroudo0mically mpas to • point to na_cz droll.
For • LEO lamgh, the _ stage is removed and thesecond stage interface ring is attached direcdy to tlaepayload interface attach. All other surucumres remain thesame as for a GTO launch.
h?lund Slmmd lind SeUd Booter Ftlrbp
Both the payload shroud and solid booster fairings areconstructed of the same composite materials, but with
different ply orientatioe and rare thickness. The maumalused is • sandwich composite of 5056 aluminumhoneycomb, with piles of 0.0055 inch carbon epoxy, bothof which arz from the Hexad Coq_ratim. The choice of
The Payload Interface (Pl) supports and protects thepayload during ascenL It is roughly 16 feet high and has adiameter which varies between I0 and 14 feet to adapt tovarious payloads. It can suppm_ two satellites with amaximum weight of 5000 Ib each.
The _ consists of an aluminum skin that is 1164" thick.The skin is reinforced with beam supports. Aloug theoutside, eight I beams nm the length of the PL These arealmninumbeamswitha l" l-beamc:_J secheL Amu_the mp of the pI, a ring is pmitioued m inu_ace with anupper satellite. This ring was modeled as • 3" I beamsectiun, made o( almainum. A secoad _ 14' above thetree of the pl. suplmm the suucun qpmm buckttng andisa l'Ibeam made of tilanium. Fmally, athint_
ring is positioned I0' above the base of" the structm_.Again this t_g mainly prcifibiu buckling, madis compmedo( tiumium. The lower sateAlite it ,upportod by • matsmsctmg originating from the base of the PI. and nmmngimide the simL The an_ suuame weighs 636 llx
F.AqlhmMounts
Stqp I. Tbe LRgl engiae includm a 15" diameter anachring used to join the engine to the strucau_ The base ofthe Stage 1 engine mount connects to this ring. and •tubular truss sumc.tm_ transmits the thrust load to theexterior hull via four attach points (see Figtne 6).
1:i8 6 Staae 1 Eagine Mount
The mourn b coesu'uaed of A333 steel,due to its high
yield strength(75ksi),highstiffness,and availabilityinpipe form. Having • total weight of 349 Ib, the mount iscapable of transmiuing 105.000 lb o( thrust from an LR91engine to the exterior hull. It has a height of 48" and fitsimide the 180" hull dianw,u_.
123

Stslpl2. TheStage2 Eugi_ Mk_umthoide two LR91aqm_ side by side madcasmeca than to the extaut hull."lb-, mmmt amr,bN m the engines at its base. similarly mdse Stase I motmt, md to the hull at six _Uon pomuou tbe top. The Surge 2 mourn is shown in Figure 7.
FIg 7 Stale 2 Enltne Mount
The mmmt is coas_ of A333 steel, due to its bizhyield strmjds (75 ksi). bish ruff'hess, and availability inpipe form. With • total weight of 646 lb, the mount iscxpabi¢ of trmsmitsfl_ 210.000 Ib of thrust to the exteriorhull. It has • height o( 40" and fits inside the IS0" huffdimng_.
Stale 3. The Stage 3 support structu_ has two pmnm'yftmctiom. F'trst, it supparts stage 3 in the early stages ofthemiuica and second,it_ theRLIO enginetothe
suqre 3 spherical fud tanks. Figure 8 shews thz suppoasmJcmm sad engine mmmt togetha.
1:188 Stalpt 3 galiae Mmmt
Uturin8 stage 1 sad staze 2 bum. the structure scts as asupport, cszryiq the 17.400 lb stage 3 unda sc,celeratimsIoeds of up to 5 f_s. After st_jes 1 md'2bumout, tbceapnz stmch mmsmits 20,000 lb of duust from the RLI0cas_ to iosdcmT3_aS furl anks. Tbe support su'ucms_ isa tubu_ aluminum truss with • mud weisht of 234 lb.
Aluminum provides a high strength to weight ratio ted anacceptable stiffness for this appiicauou. The Stage 3sumcna_hasa heighto(90" in order to accommodate theI_10 nozzle inside it, and its sides slope from a diametero( 180" where it connects wtth stage 2, toa 72" diameter atthe fud tank interface ring.
Attitude Coutr_
To fulfill the requircments of attitude control andpayload deploymcnt, rig Reaction Control System (RCS)will use Thrust Vectoring from the main rocket cngmcs andan additional series of small hydra_nc thrusters
Free Fsll
Because of the danger of an explosion when the firststage main engines are ig_ted, the booste: must be at leastahalfmile (2640 ft) from the _ be(ore ignilioncanoccur.To ensme thehalf-mileseparationdistant,the
Gryphon must drop duoulgh • vertical distance o( t 188 ftfor the LEO configuratioa and 12S8 ft for the GTOconfigurmioa. The Mission Analysis C_mep detenameddata vmical uti wiU pmvick the n_lumxi yaw cena'd.
thz free fall paled, which lasts appmximsady 8.Sseconda,theboosterpitchesup 20 degreesto sdlom thzmain engia_ to propelthe boosterintotbz corr_u._caxy .f_ ism6m. A din/led saodyunc ansimsshowed that this pitch-up mmeuver can be satisfscaxilysccomplished by milizins the aenxiym,mic forces thatnaturally re, ult from the free fall. The maneuver ca/Is fogthe separatioa of the ANC from the boost_ as soon as
clem'mczexists betweat the bomt_ tnd tbe p4ane.Fog bmh co_gurmiom, this occurs appmximstely 2.25secoods afro"geleaas at an sbsotute distance of 261 ft fromthz phu_ The sepm_ion o( tbc AN¢ shilts the b°°sta_sc_tur o( presmm forward nemty I0 ft. greadythe saodyuamic pitch-up momcuts that result from thebooster's dowuwmd velocity.
After 8..5 secoods the booster is pitched at the correct 20
degn:e inclinatiou from horizonud. The vmicai dropdisumces meutioned above m'e grcater than those requiredfor the mimmum ludf-mile separation disumce. Theadditimud drop distance was required in order to comptetethe pitch-up mmeuveg.
The mudysis showed that the ealPnes ware cspeble ofrel_einll control of the boosu_s attitude sad pitch rate.md dtat furl recovery (0 m_luisr velocity) occurred st 14.25seconds. The final recovery ansle for the LEO
co_sunuioa (84 de_ from bodzmud) is higher thinthst for the GTO coufigutatioa (62 deffrees frombo¢izouud). Because the ceateg of mass for theboosteg is doNr to thz bmz of the rocket, the momeat armofthz medymunic fogces is _ fog this coafigtnti_The resulting increase in the serod3_tmic pitch-upmoman on the booster cause thz incs_tse in the rmsl
recover,/smsJ_Preliminx_ mudysis also showed that the hydrszinc
thrusm_s have sufl'ici_t thrust (100 lb) to provide cous_in tl_,emfl din_ien fog the thinJ Stalle.
124

Sydru_ Thrmm'*
The Hydraziae thmsten will servefow ,T_n functims.
Theseinclude:
• Spin/ Despin forpayloaddeploymentormaneuveringatSpaceStatienFreedom
• Aramde cacrectioesduringallcoastperiods• Roll_ enstage3
• Rmrienuuicabeforeemenn8 GTO
T_ MR-104 hydrazim: thrusters, manufacnm_ by theRocket Rcsem_ Company, will be located immediacyabove the avionics section and attach to the payloadinterface ring. The tanks for the fuel and oxidizer will belocated in the avioaics bay. Two thrusters will be placedon each of the thn_ axe*: yaw, pitch md roli.The tankswill be made from Smnlcss steel347. The
oxidizer and fuel weight will equal 4_3 lb. This wdlmmlxmaw for paylmd deployment, crest auimde cenurd.roll control, and any unforeseen emergencies • The
approximated u_ne of use wM based mta twenty-foe: hourmUmon.
Power Systems
Tin oa-bom,d power sysuma arecanpomi of twomajorsub-systems: the lmmpai system and the ignition syucm.The primlxd power sub-systan sup_ies powa" to the en-board systems (such as tin mmpu_ and communicmemcquil_at)while the iZnition power seb-sys_ sutgicspower to the eegincs for stmnp.
Pr4acipal Power Sub-System
The principalpower sub-systemwillconsistoflithiumthioaylchleridebaueries.Thistypeof primarybam_(non-recharge.able)is availableoff-the-shelfand ispackat_ inindividualc,.lls,eachofwhichopenm= ataspecificvoltage and coutai_a fr_tionof therequin_power. Itwas determined,by examiningthe powerrequirementsof all the _yphcn's on-board systems(SeeTable 11) thatI.,i/SOC12 cells with an energy densityof
642 W-l_lr4l and m open cucuit vdtallc of 3.63 volu wouldthe power sym_m lX_ennm_ while nnmmmug
the cmt and wcisht of tin ovendl system. This sub4ysu_will comist of fourmodulm, each ceatmmsg 8 cells and
pmvidiq_ powertoe- _ for24hem.
Table I! Power Recluirem_ts ofOn-bo,rd SystmmC_m_mmmm Power (W)
lut con_GPS R__,._,_:;ver
Te!_,_m____n'yTr_qiuer _x2)p-4_ Trmsponda
Commtmle_ooll
lnerul ReceiversIv6_
TOTAL
3.596
313232002OO25O
t3_ _
Ipitlm Power Sub-Systt, m
Each of the rocket engines and the two solid rocketmmars reqmre5 amps at28V DC. applied to it for up to 1secood to achieve igniuon. This system consists of threemodules of silver zinc primary cells. Each modulewtii becompletely indepencklt and respousible for the ipa6on ofalltherocketsineachstage of the propulsionsystem.Inrudertomeetthespecificationsof5 amps at28 V DC. forone secondeachmodule willneedtocontain20 highratzsilverzinccells. Each of theseceils conchs 1.5W-h of
energy and operates at 1.4 volts. Thismeans that eachmodule will supply 30 W-h of enagy at 28 V DC. which ismorethanis neededtoachvateeachstage.
Thermal Control Systems
It is the goal of thethmnal coeerolsystem to keep allcomlxmmu within d_r specified temperature envdopeswhile mimmizin8 cost and weight and maintainin8r_iiabUity. Tbe thermal coutrol system for the _ isconcemut with two major areas. These areas are theexternal structure and the avionics bay. The extmudstrucn_ will use ablative coatinp to provide themsaipreu_ctieaagaimtaemdynamichmtingdming theasu'qoftheboor_. The avionicsbay willusea multi.¢omponmt
systemwhichincludes• hr.limnpurge,a heatsinkradiator.enamd ccminlPt, and mul6layef insulation, This systemwill mainutin the temperatm_ of all the eleamaic
eqmpamlt locatedin Ihem,tm_ bay.
Tlm.nmi ConWei d the Eztw_ Smxtm_
Because of hypersonic speeds durin8 ascent,saedynmic beminll becomes an impartmufactor in tlzde.signof the Gryphon. At speeds of Mach 8.0.tempamwes of 4900"F cast be felt by the booster. Thecompositematerialused for the extenud smu:mre h.. •u.utblereahn of up to 350"F, there(ore, ablative coatingswiU be aEpiied to surfaces where high beat rau_ _ur t°pmvick thamd prececu_. The abi_ve cmtinp thatwillbe ttsed for the _ will comist of Fu'ex 8nd "g'nmnd-Lag, because they are relatively inexpensive and they canbeq_pliedemiiy.The major surfaces expmat to high heatrates have been identified as:
. the ncse cone of the paylosd shroud• tl_ no_ cm_ of the solid rock_ bomtet_• the ie_linll edge of the vmicai tul surfaces
A maximum thidmessof2.5 inches of ablative ccatin8will be applied to the statsumon surf_es of each of thememimed surfaca. Tin cmtm_ will thin uq_ m dn beatrims6mr.,se dons thebedyof dz _
Coamd _ tbe Avionks Bay
Spacecraftelecumics typic, tly have tem_ limitsfrom 0 to 80"I:. The Lithium Thiouyl Chloride batteriesmust opaa_ at tanpemtures below 100P. CmwaluenilY,• thenn_mmu/system mustbe providedintheavimics
125
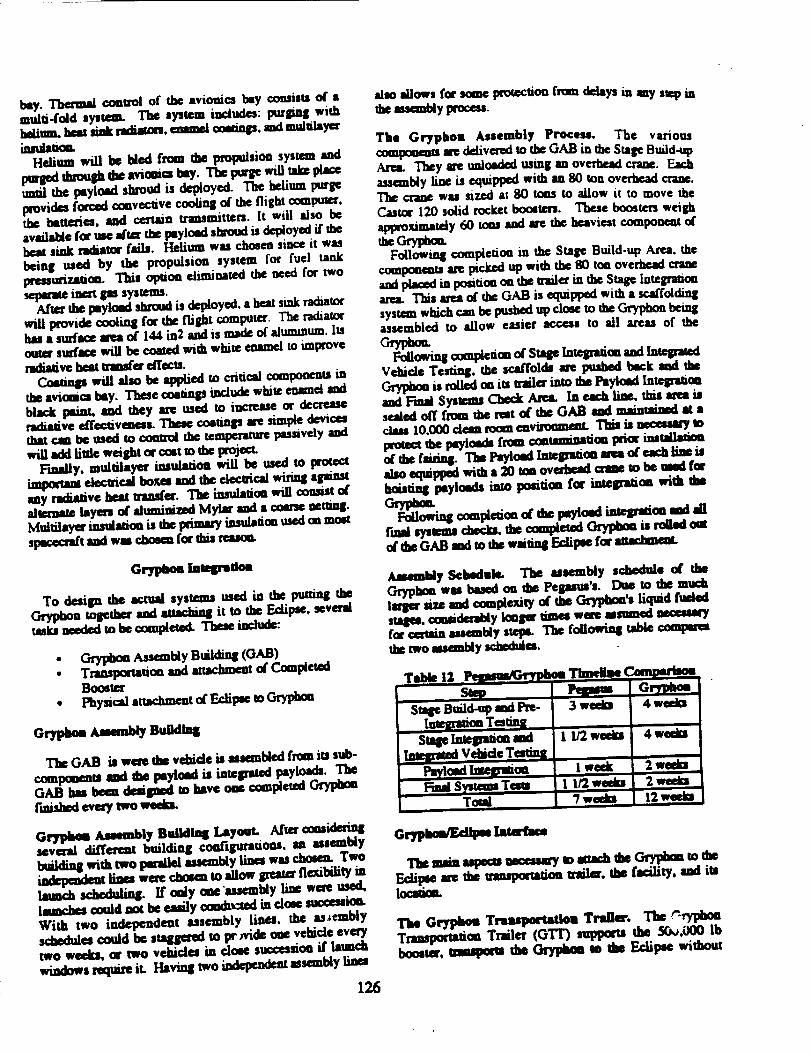
bay.Thin'realcomrol of tbeavionicsbay consistso( amulti-foldsystem. The systemincludes:purgingwithl_lium,hm,xsinkradimam,enameleomings,sodmullilayer
_n/aUcu.Helium willbe bl_lfrom thepropulsionsystemand
purg__ _ aviomabay.Thepur_ wtUu_ prateuntilthepayload shroudisdeployed- The heliumpurge
provides forc_ convecuve cooling.of I1_ flight computer,tl_ bammm, and cm',aun transm,tten. It will also beavailaldeforusea[mrd_ payloadshroudisdeployedifthe
sink radiator fails, l_lium was chosen since it wasbeing used by the propulsion system for fuel tankpres_umumon. This opuon ©limiuauxl the n_l tot two
inm't gas systems.A[Imrtbe payload sl_ud is d_-_loyed, a heat sink radiator
lX_vide cooling for the flight computer. The radiatorhasa surfacefen o( 144in2andismade ofaluminum,luonto" surface will be caged with white enamel to improveradiative hem urmuffereHecm.
will also be applied m critical componenu inds aviomcs bay. TI_ comingsindudc white eumnetandblack painL and they ate used to inm_ase or decreasemdidve effectiveness. These comings m_ simple devicesthat r,_ be used to _ d_ tempetam_ pasmvely andwill add little w_Sht orcoltm the project.
Finally, mul_yer iwulmion ,viii be used toixmcctimpotmm e.iec_calboxesand theelecu_calwiringagainstany radiative heat mmsfer. The insulalioa will consist o(-tin'haw layers o4"aluminized Mylar and a come _mng.Multflaycr insulation is she pdmary insulation us_ on mostsp_._cr_t and was _ for this n=sou.
Gr_son tm_raaon
To design d_ actual systems used in tl_ puning theGryphon u_th_r and auaching it to the Edip_, severaltasks nm_cledto be cemptemd- Throe ingude:
Ca_ As._mb_y Build_ (GAB) ..: Tnmspm'm_ion and axmchu_m _" Complemu
_lef• _ays_cal attachment_ Eclip_ toOry_
Grypb_ _ BuUdU_
TI_ GAB is wmu tl_ vebide is asmnbkd from iu sub-
GAB has been desiln_ to imve one c_mlxc_ ,-,,7_"'--fmsl_i eve_/mo wmkL
zvaul dil'fm,mt building com,gunuons, m nsau,_y_hu_ e,m,.ilel as_emhiy linm was_ Two
...... u. !:... w_rescheduling. If only one ws_mmy u_
With two independeut assembly lines, me as, cm •schedules could be staue_d to prL_Videooe vehicle evenrytwo weeks, or two vehicles in clme successioa if hunchwindows _ it. Having two _nd_ assembly lines
126
also sdiows for some pmu_ction friar delays in my step mtbe man_y _.
The Gryphon Assembly Process. The variouscompmmm are defivemt to the GAB in the Stage Build-upArm. They _e uulosded using an overbesd crane. Eachassembly line is equipped with an 80 tou overbead crane.The crane was sized at 80 toas to allow it to move theCastor I20 solid rocket boosters. These boostersweighapproximaudy 60 tom aad arc the beavicst compouem o(0z _yp,m_
Following comptedoa in the Stage Build-up Area. thecowpoa_u are picked up with _ 80 ton overbcad craneand _ in pminon on the u'ail_ in d_ Sta_ Inte_ionarea.Thisannao(_ GAB isequipp_ withascaffolding
system which cm be pushed up close to the Grypbou beingassembledto allow easieraccess to allareasof the
Followingcomple_iono(SmO In_egnuimandIntegrmedVehicleTesting,thescaffoldsm pushedbeck and the
isroiledonimu-ail_intothePa_4mdIn_,_mionand Fred SystemsCheck An,'a-Ineachline,thisarenissealedofffrom therusta/"theGAB and maintainedatachum lO,O00delmrocmen_ Thil ia tM_y Ioprougt tbe tw/tends from contemnation prior ius_4 th_ falm_ TI= Paylond Imq=ation ma _ each lin_ i_
hoisting payioeda into pomUom tot mtcMrmuua
_F_OrY_tlowmgcomptmion_ dz paytoed imngs_on andallI'mal_m _ d_ _owldmed_ _ rdled
d_ GAB aad to d_ wmting Eclipee far
A,mmnMy Sclmduk, The assembly scheduleo( the
Gryplmu was basedon tl_Pegasus's.Due tothemuch_ and oump_exity_ fl=Gt_phon'sliquidfu_ed
suq_. comidm'ably iongm"times wm_ resumedfog camin aucmt_y steps. The following table conqm_t_ two msanldy g3zddm.
•1_ main aspeamn®emmu'yto amr.h _h__ to _Edi1_e are the mmpem_on umilm', _1_ fa_lity, and its
_nm G_jphon TrmmpomUom TraUer, Th_ _'-_mT_on Trailer (GTT) supporm the _,000 lbboosm, _ dm Gqqd_mmm dm Eclip_ widmm

imlmmag undue shocks, madcammake precise orienumenadjmunenu for alillmne_.
The GTT wm pmmm_ mftm'thz trailer used by OSC tothe Pesamm f_ i@ assembly building to the B-
52 drop mxcrdt. The mil_ used to u'maporttbe Pegasm isequipped with 24 stmdml seem-trmler wheels on 6 axles.
292 wbecis. It was decided that the G'I'I"snowa uc mncums arailsystantosupporttheGryphen'slargeweightInartiertomstweproperalignmentoftheGryphonwith
the Eclipse during attachment,theGTI""must be able toshifttheG_ from sidgtosideandalsorotateseveraldegrees.To allowforthis,itwas decidedthattheGfyphenwail be supported in • cradle which rests on top of thetrailer. Large screw jacks will be mounted horizontally atthefront and rear and of the trailer.By operating the twoscrew jacks s_iY in either dWcctien the cradle canbe moved either left of dghs. Operating the screw jacksdifferenUally _ow8 the crack can be rotauxi afew degreesto make the _ adjmunenu.
"I'lz Grypbou willbe brought out from theGAB en itstrailer and rolled underneath tit, Eclipse from the rear.Once it isinpmitio=, it will be lifted by four hydraulic lira
then be used to move the Gryphoa either to the lelt or ngmor to tmate it to achieve proper alignment, ff the fore attd
aft pmiaioning is incorrect, the Eclipse cam be pushedforward or backwmd sfightly, or the Gryphon could belowered, pushed ferward or aft ou the rails, and lifted upagain. Once _ alignment has been achieved, theGryphon willbe raised the last few inchesand thehydraulic interface meclumi_'smrid_reed,th.tn s.e_," fl_
Gryphon to the Edipeg. The U t t can meu uc towc_uback onto its rails and removed.
Gryphom Fmdlity Loentiem
The locatimt of the facility was bas_ on the availabilityof rocket fuels ort site, proximity to the equatm for GEOlaunches, distance from large populatien _nters, and tbe
availability of a 10,000 ft runway.
Based upou theserequirements it wu decided that timKennedy space centerwas the best #ace to locate tbeGryphon Facility foe GEO launche#. However, a smallpercentage d the launches might be madz to veryhighincUnatioa (poimr)mbim. For tbc_ odits. Vmdenber8 AirForceBasewm choua m tbeImmch siteforthewestcorot.Forthe_ ummiom, aOryphms wouldbe femed unfurled
from Kennedy to Vandenberll by the Edipee and thenfueled and immcbed.
Intm'face Machanlsm
The best cxxtfiguration was found to be two four lmiat.attadunent syswms ea the secood stage, symmeuic aboutthe ceuta of gravity. AU of the pins fie within the secoodstage. With the excep¢ioa o( pins 1 and 2, • circular
The f'lt_t two pins were purposetutty pta_a at ual;
interstage betweea stage I and sm4e 2 due to the su.ucun
n_Imredtbere.Pins 5 md 6 are placed at the snach msgrequired for the su_tts connecting the two Castor 120engina.Some of tbe keyaspectsof this system arc showubdow (see Table 13).
Table 13 _t_3mractertstior ofGryphoa/EcUpR intedKe
M__-_mumPin LcnFh 2"/inTotal System Weight I 1.I04 |b
Tc_MPin Weight , t328 lb
Pin Layout. In order to fully analyzethedifferentpossibilities, • t'mite element model was comtructed in I-DEAS. It was determined to run different caufiguratiomusing finite clement molds in order to find the best p|nlayout on theGryphon. The parameters detegmining thebest pincmfigumion were:
Distribution of fon:es ou pimStability d meficur_oaSu.ucmni Dymm¢=
Having appmximaudythesame forceoa eachpisswoeidtaean ouly ooe type of hook md pin cembiamiem had t° bedmpmt. ThiJwoekt putey red=e m__ corn-Due to tht ovmil need to tedum o3ms and al_'tY t0 m_tdm _ enly ooe combinalioa wm chomm-
Required Hydntulk For_ The hydnmUc force toopa_ the system was calculated _ a w_wcme-loai.It was calculated by using tim fmca oa the pin/hookc_mbinatiou, the fri_dom coefficient betw_ the pin andbookmd tlz_ m_ dz hmgth#_ thzl_erm'm mxlcomectingrods,TI_ hydrmdicprcumz providzdbY d_
#mz was _vm st5000pai.Itwm notalthatpum_ couldbe added foremergency In_s#un_lossausdsdditienm
hydraufic force if needed. Using the hydraulic pressure,the ptsmm were sized by calculmin¢ the werst-cs_ toadforce required. After com#etin_ the dmilaf mudy=i=m I-DE,AS the pistons cross sectional area was found to be10-¢4 m2.
Materials. The matmal used for thesu'ucmrMmembersthrouglmmtheintedaeesysmn is•beattreated,qomchedand _per_. steel alloy ASTM-A24Z This Mloy waJchmm due to the fact that it is the strongest cousmtc6oa
material in yield shear strength.
G.Fm'_ Lmds, The maximum G-F.mcz was IliVm frumthe Eclipse Desisn Team to be 2.5. This wu thenmultildial by the structural factorof safetyand thedynamic loading coefficient to obudn the overall systemfactm of u(ety cf 4.
Project Gryphou is the beginning investigation of •500,000 lb air tmmdmd space bomter. This Pha_ I studydemomtratm the viability for a venture of this type.
127

Ultimately, the coot effee_veneu of the Gry_om willdmmmme its futme. As demomtrated in this suummm.y, tbeCaryptmmhim the _ty of providing mvesum_s • 15_return, which would provide • corporaon • pt0fitableendeavor. As with all pmjem, eee cmaexpea that chaa_will occur as the ptoeeu develops. However, the initial
results dd'mitely mm'it o_tinued study into large sized airlaunched space boosters. For • more detailed explanatieao( the process and analysis that went into the Gryphon.
cousult the Crryphon Air _ Spac_ Bom_.r Relx_
Aekmowkdilmemm
The author would like to acknowledge all thoseindividuals revolved in Project Gryphon. The 40 snxlents
of Aerospace 483 Space System Design at the Universityof Michigan deserve the credit for the work and
umuaiunem needed on a project of this nature. Althoughbe reatraned by • tight budget was quite difficult to workwith, it helped the group feel as if its eodeavot_ were
realistic and worthwhile. And everyone should becou_ .aded for sucking mgeth_ to meet the budget.
Special than_ also go m Pr_euor Joe Eisley for all ofhis support and for providing all the resources needed to
make for • technically soured project. Teaching AssistantJamu Akin must also be mentioned for all of hisoutstanding contributious. Without his guidimce and
support, we my have never got_n m far m was possible.Robert Lovell of OSC presented the idea behind all of
the work and must be thanked for his help. Also, LisaKuhout of NASA Lewis Research Center must be_tioued for providing support when needed.
128

B. AERODYNAMICS CALCULATIONS
B.1 CFD
For many design points of an aircraft, one important parameter is CLmax. Due to the choice of a
supercritical airfoil for the Eclipse, there is no available experimental high angle of attack data
available. Therefore, computational fluid dynamics was employed in an attempt to acquire some of
this needed data.
The first step in this process was to use a two dimensional Euler code to solve the inviscid case.
Then, to try to predict separation, a second program was used to evaluate the boundary layer
behavior using Thwaite's method. This program first searches for the stagnation point near the
front of the airfoil. From this point, the airfoil is traversed as shown in Figure B. 1.1. At each
point along the surface, the flow velocity is known from the Euler code. This data is then used to
create Figures such as B.1.2. This figure shows the flow velocity, U, tangential to the body
surface as a function of s, the distance from the stagnation point. Thwaite's method calculates a
parameter L, such that
_' = 0"45 U_oUSds (B.I.1)
when k is less than or equal to -0.15, Thwaite's method predicts separation.
With this data, a third and final program was written to transform these effects into three
dimensions. To do this, Prandtl's lifting line theory was modified to account for wing sweep.
This resulted in Figure B.1.3 and B.1.4. Figure B.1.3 shows the spanwise effective angles of
attack divided by the absolute angle of attack. From this, one could f'md the point along the wing
that would stall fu'st, and at what absolute angle of attack that stall would occur. Figure B. 1.4 is
the lift distribution during cruise.
Unfortunately, Thwaite's method estimates the effects of a laminar boundary layer. Results
show that the airfoil used on the Eclipse depends upon turbulent flow. To be more specific, in the
design condition of the airfoil (M=0.73, o,=0"), separation was predicted at about 80% chord. This
is obviously not a good model of the true performance of this airfoil.
129

130

g
g
131

1_ 01DI 10
132
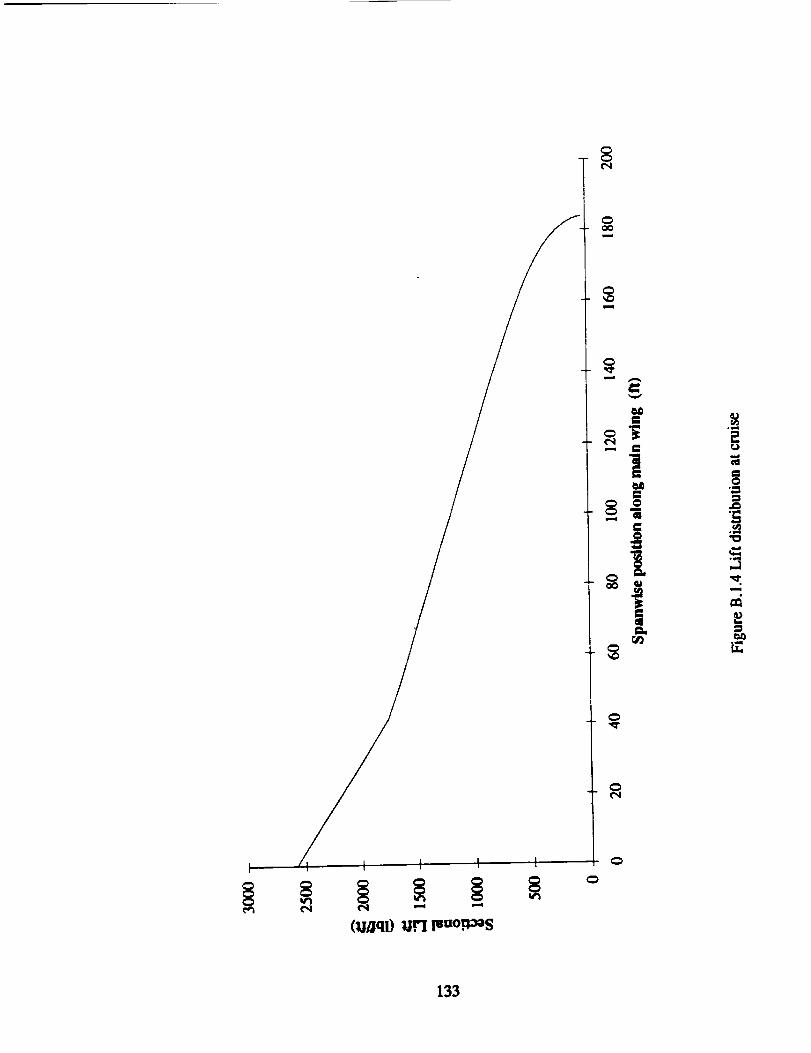
133

B.2 Lift
For each Mach Number:
2n'.A
c,...: _-+.,/,,=5(,+,a.=,',,_)+4where:
#2= 1- M2
2a
Then, with the fuselages:
C_. = C,..,. (1+ 0.025_- 0.25[-_12 f
(B.2.1)
(B.2.2)
(B.2.3)
(B.2.4)
The horizontal taft lift curve slope is then:
= 2 _" A H
C,... 2+._A. _#'i-"_-(I+ tan'A,,2,,)+ 4(B.2.5)
Now, to find the taft efficiency:
zu = xu" tan(y+ 1.62 aw •Ct_,, +0.2486)_-._ )
z, =-068v_/co,,(_+0.15)
,.;,-co, .o3Jwith all parameters defined in reference 6.
(B.2.6)
(B.2.7)
(B.2.8)
Next, find the downwash, _ •
444(K,K, .,,,:c...= • .IC.4_osA..) - , /Ta [ c,..,i,,,.o)
where:
KH'- 21 113(_)
(B.2.9)
(B.2.10)
(B.2.11)
(B.2.12)
134

Now, thetotalairplane lift curve slope is:
(B.2.13)
To then find CLoA:
ao_ --- (zo_.,_ (B.2.14)
C,., ,, -Uo_ , •CL,,, (B.2.15)
C_,,, =(iw-uo_ )Ct_., (B.2.16)
CL,, = Ct,,,,, +Ct..,, " rl. _i. (B.2.17)
And both CLoA and CLaA are calculated. This accounts for the linear portion of the lift curve,
which is all that is estimated. Therefore, the final result is:
Ct, " = Ct., +Ct_, "tea (B.2.18)
The results of these calculations are listed in Table B.2.1.
Table B.2.1 Lift curve and wing moment results
M CLaw Clo w CLa wf CI_ wf _ h drdda CLa A CLo A CmoW xacA dCm/dCL
0.20 5.637 0.292 5.643 0.440 4.435 0.317 6.4353 0.4399-0.10352.900 -0.14390.25 5.691 0.295 5.698 0.444 4.472 0.320 6.4924 0.4442-0.10352.898 -0.14130.30 5.761 0.299 5.768 0.450 4.518 0.324 6.5643 0.4496-0.10402.895 -0.13800.35 5.846 0.303 5.853 0.456 4.574 0.329 6.6529 0.4562-0.10502.891 -0.13390.40 5.950 0.308 5.957 0.464 4.642 0.335 6.7605 0.4643-0.10662.887 -0.1291
0.45 6.075 0.315 6.082 0.474 4.723 0.342 6.8899 0.4741 -0.1091 2.882 -0.12340.50 6.225 0.323 6.232 0.486 4.820 0.350 7.0448 0.4858-0.11172.876 -0.11650.55 6.406 0.332 6.413 0.500 4.936 0.360 7.2303 0.4999-0.11382.868 -0.10820.60 6.624 0.309 6.632 0.483 5.073 0.373 7.4562 0.4826-0.11692.860 -0.09930.65 6.892 0.286 6.900 0.466 5.238 0.388 7.7306 0.4664-0.12102.850 -0.08840.70 7.224 0.187 7.233 0.377 5.439 0.406 8.0747 0.3766-0.12362.840 -0.0771
0.75 7.647 0.000 7.656 0.200 5.687 0.430 8.5159 0.2004-0.12782.830 -0.06540.78 7.961 0.000 7.970 0.209 5.865 0.448 8.8270 0.2087-0.13142.817 -0.05150.80 8.203-0.425 8.213 -0.210 6.000 0.462 9.0929-0.2101-0.13292.816 -0.0507
B.3 Drag
Co__ = Ca.__ + Col__ (B.3.1)
B.3.1 Zero-lift drag
Using thecomponent breakdown method (virtuallyallofwhich isfrom reference6)
135

Ca._ =C_, +coo. +2Co~ +6Ca.. +6C_o, + 2Coo,+ Coo..._.
Each component's zero lift drag was then estimated as follows:
(B.3.2)
Vg'mg:
C_, = R_ 2"Rcs "cl,,(I+ }L' + 100[} r )Ss" (B.3.3)
where RWF is the wing/fuselage interference factor, RLS is the lifting surface factor, and L' is the
airfoil thickness location factor. All are as defined in reference 6.
note: RWF is squared because the Eclipse has two fuselages.
Horizontal Tail:
(B.3.4)
Vertical Tail:
c_ =R,.._,.(,+÷u+lOO[_r)_(B.3.5)
Nacelles:
Predictions of the nacelle drag as calculated from reference 6 gave unreasonably high results.
This is due to the fact nacelles are treated as fuselages. Since the fan diameter of the GE-90 is so
large, the fineness ratio is very poor.
C,,o,=R,,,,,._:."_'P-_7"-where:
Fp=l+o.3s_Dfan = fan diameter
1N = length of the nacelle
For this reason, a method found in reference 11 was used:
(B.3.6)
(B.3.7)
Pylons:
=(B.3.8)
Fuselages:
(_,/d,)'" d,) S (B.3.9)
136

where IF is the fuselage length and dF is the equivalent diameter as explained in reference 6.
Trim and Miscellaneous:
C_,._,.. :O.IO(C_o,,+C.o + 2C_, +6Coo, +6C_o, + 2CDo,) (B.3.10)
note: the fuselages and horizontal tail will later add to the zero-lift drag as explained in the lift-
induced drag section.
Table B.3.1 lists the wetted areas used in these calculations and the zero-lift drag results are
contained in Table B.3.2.
Table B.3.1 Wetted area breakdown
Wing 23000.0HorizontalTail 6560.0
VcmicalTail(each) 1435.0
Nacdles (each) 668.3
Pylons (each) 238.9
Fuselage (each) 6959.2
AltitudeTable B.3.2Zero-liftdrag components dm'in_climb/cruiseconditions(clean)
Wing H. Tail V. Tail Nacelles Pylons Fuselages Trim and
(each) (each) (each) (each) MisccUaneous0 0.00520 0.00300 0.00044 0.00014 0.00007 0.00100 0.00062
5000 0.00537 0.00305 0.00044 0.00014 0.00007 0.00101 0.00063
i0000 0.00552 0.00294 0.00045 0.00014 0.00007 0.00103 0.00063
15000 0.00566 0.00300 0.00046 0.00014 0.00007 0.00104 0.00065
20000 0.00588 0.00254 0.00047 0.00014 0.00007 0.00104 0.00064
25000 0.00604 0.00219 0.00049 0.00015 0.00007 0.00108 0.00063
30000 0.00614 0.00221 0.00050 0.00015 0.00008 0.00110 0.00064
35000 0.00632 0.00223 0.00051 0.00015 0.00008 0.00115 0.00066
36000 0.00635 0.00225 0.00052 0.00014 0.00007 0.00116 0.0006637000 0.00639 0.00226 0.00052 0.00014 0.00007 0.00118 0.00067
38000 0.00644 0.00228 0.00052 0.00015 0.00007 0.00120 0.00067
39000 0.00648 0.00229 0.00053 0.00015 0.00008 0.00122 0.00068
40000 0.00653 0.00231 0.00053 0.00015 0.00008 0.00124 0.00069
41000 0.00657 0.00232 0.00054 0.00015 0.00008 0.00126 0.00069
42000 0.00662 0.00234 0.00054 0.00015 0.00008 0.00128 0.00070
45000 0.00676 0.00239 0.00055 0.00015 0.00008 0.00138 0.00072
50000 0.00702 0.00248 0.00057 0.00016 0.00008 0.00161 0.00077i
Total
0.01297
0.01323
0.01331
0.01363
0.01339
0.013310.01352
0.0139O
0.01392
0.01403
0.01415
0.01427
0.014400.014530.01467
0.01512
0.01608
B.3.2 Lift-induced drag
c,,,_ = c,,,,,+co,,,+Co,,= Ac,,,,_ +c,,,,_ .c,., + c,,,,,....c,.,= (B.3.11)
137

Each oftheselift-induceddragcomponents was then es_mated as follows:
Vv-mg:
C_, =
where:
c_._ (Lo5c_)_lIB
a.A.e a.A.e
Ct_f
e = 1.1R._._.. A+(1-R)a
R ffileading edge suction parametm
(no twist) (B.3.12)
(B.3.13)
HorizontalTail:2
fz.A.e S
c,,.. c,...[o,_{,-_}+,,-_,o,.]:c,_.[,_-_,,o,.,]note:thereisno incidenceangleon thehorizontaltail,and thatitisa symmetric airfoil
(B.3.14)
(B.3.15)
addilionally:
a,, = C,.,-C,.,,,C,.., (B.3.16)
Therefore:
c,. -c_ _ c_ c,.,, ,CL. = ''/ C L #'M- L'/C I_ _J _'Ic I_ _"
c,./-(c,:-2c,, c,... ),-,..:
(B.3.17)
(B.3.18)
(cZ-2c,, c,..+c,2 0-_) _c,,,.= s.
x.A.e S (B.3.19)
Fuselages:
To avoid a term in CL 3, reference 6 suggests that a "standard" angle of attack for the fuselage at
each ,-._gpolar'sconditions.This isdone simply by balance of forces,and using the liftcurve.
138
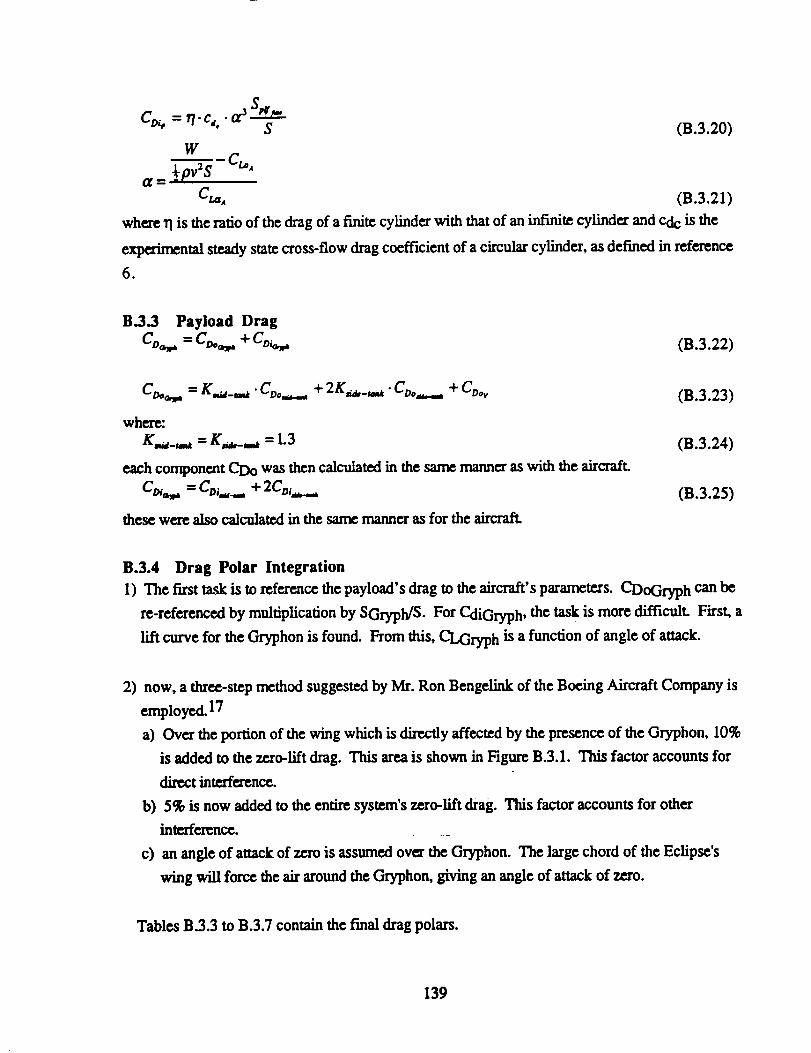
Co,,= rl.c_..a_ _-_--(B.3.20)
W
C,,., (B.3.21)
where 1] is the ratio of the drag of a finite cylinder wkh that of an infinite cylinder and Cdc is the
experin_ntal steadystatecross-flow drag coefficient of a circular cylinder, as defined in _fe_nce
6.
B.3.3 Payload Drag
co.., = co..,,.+ co,..,,,.
Cite,_ : K=__m, .Ct,o_ + 2K___,a .C_o,,...,+ C_o,,
where:
K=._., = K.,.._=,a = 1.3
each component CDo was then calculated in the same manner as with the aircraft.
= Cm. +
these were also calculated in the same manner as for the aircraft.
(B.3.22)
(B.3.23)
(B.3.24)
(B.3.25)
B.3.4 Drag Polar Integration
1) The first task is to reference the payload's drag to the aircraft's parameters. CDoGryph can be
re-referenced by multiplication by SGryph/S. For CdiGryph, the task is more difficult. First, a
lift curve for the Gryphon is found. From this, CLGryph is a function of angle of attack.
2) now, a three-step method suggested by Mr. Ron Bengelink of the Boeing Aircraft Company is
employed. 17
a) Over theportionofthewing whichisdirectlyaffcctedby thepresenceoftheGryphon, 10%
is added to the zero-lift drag. This area is shown in Figure B.3.1. This factor accounts for
directinterfeaence.
b) 5% is now added to the entire system's zero-lift drag. This factor accounts for other
interference.
c) an angleofattackofzeroisassumed ovcztheGryphon. The largechordoftheEclipsc's
wing willforcetheairaroundtheGryphon,givingan angleofattackofzero.
TablesB.3.3toB.3.7containthefinaldrag polars.
139

i
!
.i
]4O

Table B.3.3 Drag polar results (clean)AltinJde fit) Speed fit/s) Cdo Cdil Cdi2
0 560 0.01291 -0.00493 0.040905000 600 0.01317 -0.00487 0.0404410000 650 0.01326 -0.00452 0.0398915000 650 0.01357 -0.00458 0.0398820000 733 0.01336 -0.00309 0.0385125000 750 0.01330 -0.00150 0.0378530000 775 0.01351 -0.00141 0.0370635000 760 0.01390 -0.00113 0.0363736000 755 0.01392 -0.00112 0.0363837000 755 0.01403 -0.00113 0.0363838000 755 0.01414 -0.00113 0.03638
39000 755 0.01427 -0.00113 0.0363840000 755 0.01439 -0.00113 0.0363841000 755 0.01452 -0.00113 0.0363842000 755 0.01466 -0.00113 0.0363845000 755 0.01511 -0.00113 0.0363850000 755 0.01607 -0.00113 0.03638
l-,/Dmax24.3724.21
24.1023.8323.6623.0523.0622.8122.79
22.7022.6022.5022.4022.2922.1821.8421.17
Table B.3.4 Drag polar results (with Gr_hon)Altitude (ft) Speed (f-t/s) Cdo Cdil Cdi2"
0 560 0.01509 -0.00518 0.043585000 600 0.01539 -0.00511 0.0430910000 650 0.01550 -0.00474 0.0425115000 650 0.01586 -0.00481 0.0424920000 733 0.01565 -0.00325 0.0410525000 750 0.01564 -0.00157 0.0403530000 775 0.01589 -0.00148 0.0395135000 760 0.01534 -0.00119 0.0387936000 755 0.01538 -0.00118 0.0388037000 755 0.01651 -0.00118 0.0387938000 755 0.01665 -0.00118 0.0387939000 755 0.01680 -0.00118 0.0387940000 755 0.01695 -0.00118 0.0387941000 755 0.01711 -0.00118 0.0387942000 755 0.01728 -0.00118 0.0387945000 755 0.01783 -0.00118 0.03879
50000 755 0.01902 -0.00118 0.03879
I-/Dmax21.6821.5521.4621.2221.0820.5520.56
20.3420.3120.2320.1420.0519.9619.8619.7619.4418.81
141

Table B.3.5 First loiter dra[ polars (with Gr_hon at h = 44,000 ft)M V (ft/s) C.do Cdil Cdi2 L/Dmax
0.45 484.760.50 538.62
0.55 592.480.60 646.350.65 700.210.70 754.070.75 807.930.78 840.250.80 861.80
] ml II
0.01571 -0.00544 0.04409 21.18
0.01575 -0.00542 0.04367 21.250.01572 -0.00538 0.04318 21.390.01557 -0.00496 0.04262 21.480.01545 -0.00454 0.04196 21.550.01502 -0.00340 0.04119 21.570.01465 -0.00164 0.04028 21.300.01464 -0.00159 0.03996 21.450.01490 0.00150 0.03919 20.07
Table B.3.6 Second loiter dral_ polar/(with Gryphon at h = 10,000 ft)M V (ft/s) Cdo Cdil Cdi2 L/Dmax
0.20 215.450.25 269.310.30 323.170.35 377.040.40 430.900.45 484.76
0.03927 -0.00548 0.04540 12.660.02167 -0.00548 0.04523 17.500.01788 -0.00548 0.04502 19.500.01682 -0.00547 0.04476 20.240.01637 -0.00546 0.04445 20.610.01615 -0.00544 0.04409 20.86
Table B.3.7 Second loiter dra[ polars (clean at h.ffi 10,000 ft)M V (ft/s) Cdo Cdil Cdi2 I.dDmax0.20 215.450.25 269.310.30 323.170.35 377.040.40 430.900.45 484.76
0.03126 -0.00522 0.04262 14.75
0.01797 -0.00522 0.04246 19.990.01512 -0.00521 0.04226 22.050.01433 -0.00521 0.04201 22.800.01399 -0.00520 0.04172 23.190.01382 -0.00518 0.04138 23.45
142

C. PERFORMANCE CALCULATIONS
C.1 Engine Start and Warm Up:
Assume 45 minutes at idle thrust (less than 10 % of take off thrust) with Cj around 1.
fuelweight (Wfuel [lbfl) with:
Wfuel = T. Cj. At
where:
T = idle thrust for the 6 engines [lbf]
Cj = specific fucl consumption [lbm/hr/lbf]
At = time [hr]
Take offweight (Wto [Ibf])isdefinedby:
Wto = Wramp - W fuel
where:
Wramp = ramp weight (beforeengine start)['Ibf]
C.2 Take Off:
Calculate
(C.1.1)
(C.1.2)
C.2.1 Fuel fraction:
Assume 2 minutes at maximum sea level thrust.
engine dam (see Appendix D). 16 Specific fucl consumption is found from:
where:
Ff = fuel flow for one engine 0bm/hr]
t = uninstalled thrust for one engine [Ibf]
Find the fuel flow from the General Electric
(C.2.1)
Fuel weight is again found by:
Wfuel = T. Cj. At
where:
T = total take off thrust [lbf]
(C.2.2)
C.2.2 Field length and time to liftoff:
To obtainrunway length(from zerovelocitytoliftoff),calcdatevelocitytoliftoff(Viol')from:
143

2. WtoVstall - p. S- Clmax
where:
p = air density at airplane location [slug/ft 3]
S = wing reference area [ft2]
Clmax = maximum Cl at take off (with flaps down)
(C.2.3)
Typically, Vlof = l.lVstaU, however, for this case Vlof = Vmc = 231 ft/sec for adequate control
power.
For a fiat runway with no head wind, no thrust angle-of-attack (i.e. the engines are aligned with
the airplane centerline), and maximum take off thrust available at sea level, the thrust varies from
maximum take off thrust (T o at zero velocity) to thrust at lift off (Tlof at the end of the runway).
The thrust is influenced by the speed, according to the relationship:
Tlo f = To(I + c-Vlof 2) (C.2.4>
where:
Tlof as found in engine data at Vlof
To as found in engine data at zero velocity
c = engine thrust correction factor
Solving for the engine thrust correction factor:
1c= T9
Vlof 2 (C.2.5)
The acceleration force, F, varies fxom Fo (at zero velocity) to Flof (at lift off velocity):
F o = T O - _t. Wto
Flo f = F o + Vlof2[c •T O -½p" S(Cd- I_. C 1)]
where:
)_ = friction coefficient (0.02 for concrete or asphalt runway)
(C.2.6)
(C.2.7)
Define the following engine performance parameters:
Fo
144

whcn I]< I _ k2 =I
Iwhen I]> I _ k2 = _arctan _,_U'_-l
qTl-J "
(C.2.9)
(C.2.10a)
(C.2.10b)
Hence, therunway distance(Xg [ft])isgiven by:
Xg = W$°" Vl°f2 "kl2go •Fo
whcrc:
go = gravitationalacceleration[fl/s2]
(C.2.11)
Thc time to lift off (tg [scc]) is given by:
t = Wt°'Vl°f'k2
g go" Fo(C.2.12)
To calculatetotalfieldlength,considcrthreedistanccs:
xl = distancetoacceleratefrom VloftoV2 [ft]
x2= flare arc distance fit]
x3= obstacleclcaranccdistanccfit]
Calculate:
V 2 = 1.2Vstall
where:
V2 = flarearcvelocity[ft/scc]
(C.2.13)
i
Use an averagevelocity(V averagevelocity[ft/scc]) tofindxI:
V = Vl°f + V22
x 1 = V. At
where:
At = 2 sec (assumed)
(C.2.14)
(C.2.15)
Calculate flight condition to fred x2:
T2 = To(l+c.V2 2)(C.2.16)
145

whel'c:
T2 = thrustatflarearc ['Ibf]
C l = 2WtoO" S" V2 2
Obtain Cd from thedrag polar.
CdYc Wt ° CI
whe_:
Yc = flarearc [rad]
V22
go (n - I)
where:
R = flarearcradius [ft]
n = loadfactor [g]= 1.05for a softmaneuver or 1.15fora hard maneuver
x2 = R. sinTc
hr = R - R- cOSYc
where:
hr = heightaf_'rflarearc [ft]
If hr > hobs, there is no need to add x3.
specifications.Inthiscase:
hr = 35 = 2R. sin2 Yc
Use thisto obtainYc,and hence x2.
Total field length for take off:
Xto t = x I + x 2 + x 3
(C.2.17)
(C.2.18)
(C.2.19)
(C.2.20)
(C.2.21)
For thiscase, hobs = 35 ft from the FAR 25
(C.2.22)
(C.2.23)
146

C.3 Climb:
C.3.1 Exact solution:
From the equilibrium equations:
Treq = D + Wairplane" sin7
where"
Treq = required thrust [lbf]
D = drag Obfl
Wairplane = current airplane weight 0bfl
V-- flight path angle (in reference to horizontal plane)
L = Wairplane" cos7
where."
L = lift [lbfl
D=½P-S.V 2.C d
where:
V = airplane velocity [ft/scc]
L=½P.S.V 2.C I
For Cd and Cl assume a parabolic drag polar which varies with altitude:
C d = Cdo + K1- C 1 + K2. C12
where:
Cdo, KI, K2 = constantswhich vary with speed and altitude
Fred available thrust (Tavail [lbfl) from:
Tavai 1 = t. n - P
where:
P - Power extraction [lbf]
n = number of engines
Calculaterateof climb (ROC [ft/scc]):
(C.3.1)
(C.3.2)
(C.3.3)
(C.3.4)
(C.3.5)
(C.3.6)
147

ROC =Tavail - Treq)- V
Wairplane (C.3.7)
The maximum ROC is obtained at the condition where:
2. K2- Wairplane 2
Tavaii = _ p. S. Cdo. Vopt 2 p.S. Vopt 2
where:
Vopt = optimum speed for maximum ROC [f'rise.c]
(C.3.8)
Solving for Vopt2:
W
V°pt2 = 3- p- S. Cdo TV--_W'+ [ T_vafl 2 +12.K2.Cdo j_Wairplane 2 (C.3.9)
Vopt is constrainedand cannot exceed the critical Mach number (Mcrit). Hence:
Vop t ( 4. K2.Wairplan eROCma x = Wairplan e _P" S" Cdo- Vopt 2 Vopt 2p. S.
(C.3.10)
Note that the maximum ROC does not correspond to the condition of maximum climb angle (this
corresponds to the condition of maximum lift to drag ratio). Calculate the climb angle for
maximum ROC fi'om:ROC
siny :Vopt
sin _ = C12" T_vail
Wairplane •(CI 2 +Cd 2)
_/[ C] 2'Tavail C12- Tavall 2 - Cd 2 . Wairplane 2
Wairplane •(CI 2 +Cd 2)
(C.3.11)
(C.3.12)
There are two unknowns, Yand CI. To solve this use an interactive method:
1) Assume a CI value
2) Find y from equation (C.3.12)
3) Find Vopt
4) Find ROC
148

5) Check the assumed thrust with the one calculated at Vopt. Interact until values stabilize.
Another approach would be to plot power (Pa and Pr) versus velocity and graphically choose
velocity at maximum excess power. This automatically gives ROC and climb gradient (that is,
ROC).V
C.3.2 Approximate solution:
When the climb angle is small (7 < 15°), the following assumptions axe valid:
cosy= 1
L ffiWairplane
Trcq--D-½p-S.V 2
(C.3.13)
(C.3.14)
(C.3.15)
bROCThe maximum ROC occurs when -- = O. In this situation, obtain C1 from:
_}Cl
K2.C12 + (TavaiI+ KI)..C]_3.Cdo =0
Wairplane (C.3.16)
Obtain opfmum velocity(Vopt):
= .[2Wairp lane
V°pt _ p.C I.S(C.3.17)
Note that Vopt cannot exceed Merit.
drag:
D = Walrplane CdCI
CalculateCd from drag polar (equation C.3.5). Calculate
(C.3.18)
The flight path angle can be obtained through:
sin 7 = Tavail - D
Wairplane (C.3.19)
Finally,get ROC from:
ROC = V- siny (C.3.20)
The serviceceiling is attained when ROC = 500 ft/sec. The propulsiveceilingis attained when
ROC = 0 ft/sec and in this case:
149

1 .VO2 Wairplanc K_
where:
V ° = velocity at I./D max (for minimum Pr) [f-t/sec]
(C.3.21)
With rate of climb, calculate time to climb (Ecl [sec]):25OO
Ecl --_ROC
where:
2500 = altitudebreakdown fit]
(C.3.22)
Calculate horizontal velocity (Vh [ft/sec]):
V h = Vop t •cosy (C.3.23)
For each 2500 f'tofclimb,calculatetheaverage horizontalvelocity(Vh' [fffsec]):
V h'= Vhfinal - Vhinitia 12
where:
Vhfinal = velocity after climbing each 2500 ft
Vhinitial = velocity before climbing each 2500 ft
(C.3.24)
Calculate the horizontal distance covered for each 2500 ft of climb:
Dist = Ecl. V h' (C.3.25)
Sum allthesebreakdowns and obtaintotalhorizontaldistancecovered duringclimb. This distance
isto be subtractedfrom the outbound cruiserange. With each altitudebreakdown from rateof
climb,listthetemperature,velocityof sound and obtainMach number (M):
a = _/1.4.1716. temp (C.3.26)
where:
a = velocity of sound [ft/sec]
temp = air temperature (°R)
a (C.3.27)
150

List thrust and fuel flow from General Electric data.
climb:
Wfuel =Ecl. Cj. T
where."
T = total tminstalled thrust [Ibf]
Calculate Cj. Get Wfuel for each 2500 ft of
(C.3.28)
C.3.3 Velocity constraints:
Sometimes it is not possible or desired to achieve Vopt for climb right after lift off because of FAR
velocity constraints (250 knots below 10,000 ft of altitude). In this case, assume this velocity in
the calculation. Above 10,000 ft, climb is performed at a constant indicated speed. Calculate
actual speed (Vact):/
Vind 2Vac t = a]po"
P (C.3.29)
where:
Po = airdensityatsealevel [slug/ft3]
Vind = indicated speed [ft,/s_]
Perform the rest of the calculation as indicated above (item 3.2). When the critical roach number is
reached, set the velocity based on this mach number.
C.4 Outbound Cruise:
The best L/D represents the best condition for Cj. Take the derivative of the drag polar, equal it to
zero, and obtain the maximum value for tAD. This happens when:
Cl°=_ K_2 (C.4.1)
where:
CI*= C1 at maximum L/D
Cd*= 2Cdo + K1-V_ 2
where:
C.d °= Cd at maximum I./13
(C.4.2)
151

(¢.4.3)
C.4.1 Cruise at BCA and BCM :
The fuel consumption can be minimized by cruising at best cruise roach number 03CM), at the best
cruise altitude (BCA). By definition for this case:
BCM = Merit (C.4.4)
Calculate the weight ratio for each cruise distance breakdown:
W'fin_ - e BCM.a (C.4.5)
Winitial
where:
Wfmal = weight after cruise segment [lbf]
Winitial = weight before cruise segment 0bf]
As = distance covered in cruise segment [mi]
Note that, although BCM is constant (because the airplane reached the tropopause and the
temperature is constant), BCA increases because of Wfuel consumed (Wairplane is decreasing).
From the equilibrium equation for steady _JLse:
(C.4.6)
where:
W = airplane weight [lbf]
Solve for:.
2" Wairplane
P=BCM 2.a 2.S.C I° (C.4.7)
Using the airdensity,frednew cruisealtitudesBCA foreach cruisebreakdown. Upgrade Clmax,
Cdmin and Cj for each new BCA. Calculate the airplane velocity and time required to cover each
cruise distance breakdown:
V = BCM. a (C.4.8)
DistV---
Ecr (C.4.9)
152

where:
Ecr = time to cover each cruisedistancebreakdown
Now obtain Wfucl used for each breakdown:
Wfuel = Ecr" C j- T (C.4.10)
Sum allWfuel for each breakdown toobtaintotalfuelused. IfBCA isabove the serviceceiling,
use thefollowingmethod:
C.4.2 Service ceiling constraint:
If there is any ceiling constraint, fix the initial cruise altitude as a preset value (Ho). The specific
Find p at Ho.fuel consumption will be higher than the one during cruise at BCM and BCA.
Now, calculate new Mach number from the weight equation:
Wairplan e = Ip. M2 "a 2 "S. CI °
/ 2Wairplane
M=_p.a2.S.CI o
(C.4.11)
(C.4.12)
Consider this Mach number constant during the cruise portion. The required thrust will be:
1 2
T=_p.V .S.Cd ° (C.4.13)
With Cj from GE data, calculate Wfuel used for each cruise distance breakdown:
Wfuel = Ecr. Cj. T (C.4.14)
C.5 Loiter Before Launch:
From theequilibriumequations:
L = Wairplane - Tre q • sin ¢x
where:
a = angle ofattack[rad]
(C.5.1)
D = Trcq •cosa (C.5.2)
Wail'plane
(C.S.3)
153

For agivenWalrplane, to obtain minimum thrust, we need the maximum value for the denominator
i_ equation (C.5.3). Assuming a parabolic drag polar dependent of altitude, and from Clot:
C I- Cla •a + Clo
Cd - Cdo + KI- C 1+ K2. CI 2
C d = Cdo + KI- Cla. a + KI. Clo + K2(CIa 2- a 2 + 2CI a •a. Clo + Clo 2)
(c.5.4)
(c.5.5)
(c.5.6)
Find the derivative of Cd in relation to a. The function is maximum when this derivative equals
7_'O"
CI_ • cosa
B
(CI a "a+Clo)'COSa'(Kl'Cla+ 2. K2[CI a "a+Clo]" Cla)
B 2
-I Cla "a+Cl°)'sina ÷cosa"0
B (c.5.7)
where:
-Cdo÷ (Cl ÷Clo)÷ (c.5.8)
Alternate method:
Note that for each Math number, we have different values for Cla, C.do, Clo, thus different lift to
drag ratios and angles of attack. This leads to different thrusts. By comparing all these thrusts,
choose the minimum amongst them. Match the corresponding Mach number to the minimum
velocity required to sustain loiter and you consequently find the angle of attack:
V -- _l 2Train "cosa
"_ p-S.C d (C.5.9)
The initial loiter altitude is the same as the final cruise altitude. Consider this Mach constant during
loiter. The altitude increase due to weight reduction. Consider Cl and Cd independent of altitude,
though. Get Cj from GE data and calculate Wfuel used for each loiter time breakdown:
Wfuel = Elo i .Cj. T (C.5.10)
where:
Eloi = loiter time breakdown
As Wairplane decreases, findnew altitudes with:
154
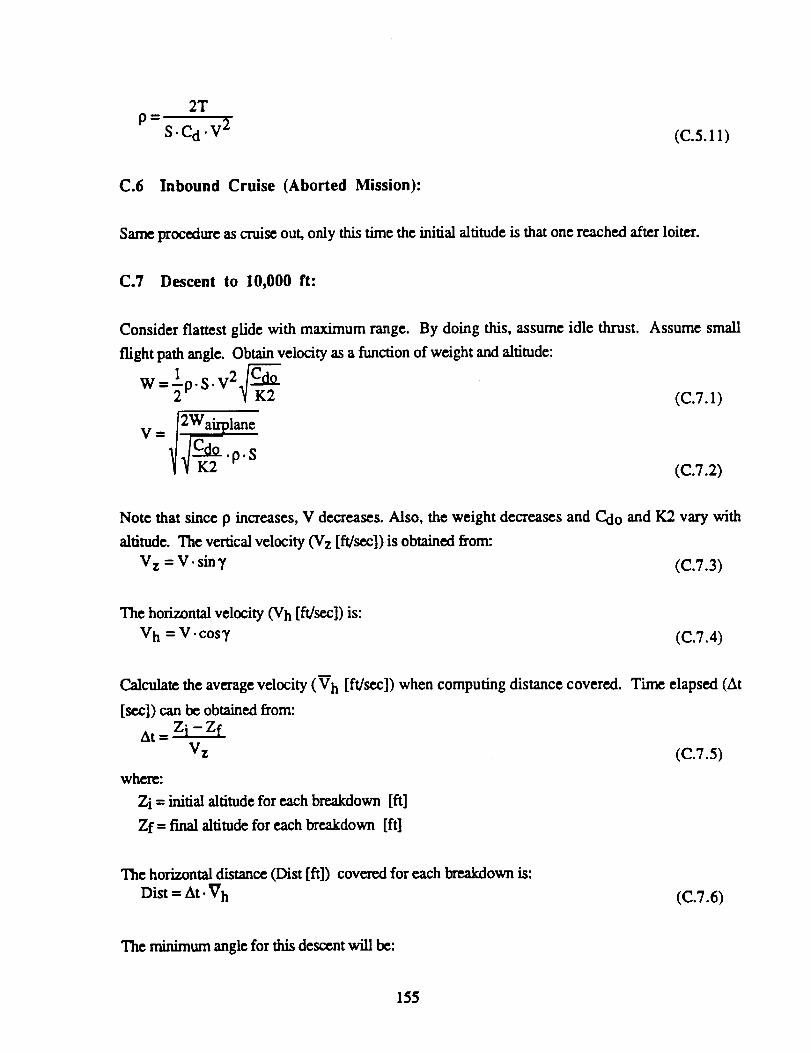
2Tp=
S.C d •V 2 (C.5.11)
C.6 Inbound Cruise (Aborted Mission):
Same procedure as cruise out, only this time the initial altitude is that one reached after loiter.
C.7 Descent to 10,000 ft:
Consider flattest glide with maximum range.
flight path angle. Obtain velocity as a function of weight and altitude:
W=_p.S.V 2
By doing this, assume idle thrust. Assume small
(C.7.1)
(C.7.2)
Note that since p increases, V decreases. Also, the weight decreases and Cdo and K2 vary with
altitude.The verticalvelocity(Vz [ft/sec])isobtainedfrom:
V z = V. siny (C.7.3)
The horizontal velocity (Vh [ft/sec]) is:
V h = V. cosy (c.7.4)
i
Calculate the average velocity (V h [ft/sec]) when computing distance covered. Time elapsed (At
[sex:])can bc obtainedfrom:
At = Zi - Zf
Vz (C.7.5)
where:
Zi = initial altitude for each breakdown [ft]
Zf = final altitude for each breakdown [ft]
The horizontal distance (Dist [ft]) covered for each breakdown is:
Dist = At- V h (C.7.6)
The minimum angle for this descent will be:
155

cdoITUB
where:
y = flight path angle [tad]
(cn.7)
Note: Cj is not zero, i.e. the engines are not mined off. Use conventional values for mission fuel
_-'action and use weight breakdown. The distance covered during descent is credited to the cruise
range.
c.g Loiter at Constant Altitude:
Same as previous loiter, only this time p is constant:
V = _I2Tavail "cosa
p-S-Cd (c.8.D
C_.onsidct velocity constant. Cd will decrease, and so will the angle of attack.
C.9 En Route Descent:
Use minimum rate of descent (Vz), to reduce the approaching velocity. Assume idle thrust.
2- K2. Cdo. Wairplane K2Vzmin = 4.p. s _ (c.9.1)
Calculate Vz for each altitude breakdown. Consider drag polar dependent of altitude. The flight
path angle is obtained from:
121 rain
(C.9.2)
The airplane speed is given by:
V z = -V- shay (C.9.3)
The total time of descent is:
4127CdQ /" S _ -'_/'_nitial
t=v K2 2W.irplane 2. ..Jg2-Cdo (C.9.4)
156

or, using the exponential atmosphere:
st=/ K2 _'2Wal_plane 2.[3-4K2-Cdo
where:
I/[]= 23,500 ft
(C.9.5)
C.10 Landing and Taxi In:
C.10.1 Fuel fraction:
Assume 5 minutes at 50% thrust for touch-down and 30 minutes at idle thrust (less than 10% of
total thrust) for taxi-in.
C.I0.2 Runway length and landing time:
After touch-down, allow 3 seconds before brakes are applied.
The touch-down velocity (Vtd) is:
Vtd = l'lVstaU (C.10.1)
The distance before braking (Xo) is:
Xo = 3Vtd (C.10.2)
where:
xo [fq
The decelerating force (F) is computed from:
F =-ET + lP" S'V2 "(Cd- It" CI) + (_t + e)' Wairplanel (C. 10.3)
where:
O = runway slope [rad]
= brake friction coefficient
For the most unfavorable scenario, assume a flat runway, no reverse thrust, and no head wind.
Just disc brakes are operational. Under these circumstances, the decelerating force varies from Ftd
(at touchdown) to Fo (at full stop):
F o = _t- Walxplane
Ftd = Fo + 12P.S.(Cd -_t.Cl).Vtd2
(C.10.4)
(C.10.5)
157

Again, calculate:
_F_ L11- Fo (C.10.6)
Calculate kl and k2 as described previously (during take off). The distance with brakes applied
(xgt0 wiUbe:
Wah.plan e •Vtd 2. kl
Xgb = 2"go'Fo (C.10.7)
Tune with brakes applied (tg) is:
tg = Wairplane" Vtd" k2go" Fo (C.10.8)
Total landing distance from touch-down to full stop (xg):
Xg = x o + Xg b (C.10.9)
C.11 Turning Performance:
C.11.1 Turning fuel fraction:
At any given moment of the mission, calculate the fuel fraction for a steady turn at constant altitude
as follows:
L = n- Walrplane (C. 11.1)
where:
n = load factor
L = Wairplane
COSI_
where:
- bank angle [rad]
(C.II.2)
The duration of the turn (At) is given by:
At= 2_t. R_; .N = 27t. R_ .N.V
V -go" _/n2 - 1
whert:
Rc - turn radius (ft)
N = number of tams
(C.11.3)
158

At = seconds (if V is given in fVsec)
V 2 V 2
Rc = = 4go" tan0 go n2-1 (C. 11.4)
Obtain the fuel flaction from:
Ci.,fo-n-Cd.At
Wfinal = e CI
Winitial
whe_:
o = static temlXa'ature ratio
(C. 11.5)
C.11.2 Post.launch maneuver:
With a turning maneuver, the airplane must recede as quick as possible from the booster. The
purpose of this analysis is to predict the optimum attainable turn condition. Important observation:
Turn is to be performed at critical Mach number. Since this is a high altitude maneuver, thrust
available may impose some restrictions:
- If Treq < Tavail, the airplane can perform a turn and climb maneuver, or a turn at maximum rate
at minimum radius.
- If Treq > Tavail, the thrust must be set as Tavail = Treq, and all available thrust is used for flat
turning.
After payload release, the drag polar parameters change: use C-do, K1 and K2 for the 'clean'
configuration.
The new airplane weight (W) is given by:
W = Walrplan¢ - Wpayload (C. 11.6)
where:
Wpayload = space booster weight
From the equilibrium equations during turn:
W = L. cosO (C.11.7)
1COS _ =
n (C.11.8)
L -- n. W (C. 11.9)
Wm-'_
go (C.11.10)
159

m.V 2_--- L.sin_
Rc
where:
Rc - turning radius [ft]
(C.11.11)
T nm_m
W E
where:
E - lift to drag ratio (C1/Cd)
(C.11.12)
Note that the thrust required for turning is greater than thrust required for loiter or cruise.
C.11.2.1 No conswaints:
Use: ns -- limit load factor.
-For minimum radius at maximum rate:
For the minimum mining radius (Rcmin) along with maximum turning rate (q)' max), use Clmax at
turning stall speed:
I 2n s-WVtstall -- p. S- Clmax
where:
Vtstall = stall speed for mining
ns = limit load factor = ultimate load factor / 1.5
2.n_ .WRcmin --
go" P" S. Clmax _/ns 2 - 1
p.S.Clmax • n_
_'max= g° 2.W
where:
¢p' [tad/see]
(C.11.13)
(C.I 1.14)
(C.11.15)
This maneuver requires turning at Vstall, which is not recomn'_nded (not even desired).
-Forturningwith climbing:
From the equilibrium equations for mm with climb:
Tmq = 2P.S.V 2 .C d +W.sin 7
L=n.W
160

cosyn"-_
co$(_ (C.11.18)
Obtain C1 fi'om:1
n-W =-_p.S-V 2 .C 1(C.11.19)
From the drag polar, obtain Cd.
Roe = (Tavail - Treq) "VW
The rate of climb is given by:
(C.11.20)
Obtain the flight path angle from:
ROC = V. siny (C.11.21)
Obtain bank angle from:
cos¢ -" cos'/ns (C. 11.22)
Calculate the mining radius:
V 2. cosy V 2. cos 2 yR c = =
go" tan0 go'4ns 2 -cos2 Y(C.11.23)
Obtain turning rate:
q}'= go" tan¢V-cosy (C. 11.24)
C. 11.2.2 Thrust and/or lift constzaints:
If the available thrust is not sufficient, the best mm can only be performed at: Tavail = Treq. Also,
the flight attitude cannot exceed Emax. Verify if turn is possible at Emax and Tavail, at limit load
factor. If not, turn can only be performed at a lower load factor (n'), since the velocity is set at
Mcrit.
-For maximum practicable load factor:.
By maximizing CI/Cd, calculate maximum practicable load factor (n_:
n'-
Wairplane (C.11.25)
161

Cl can bc obtained from the relationship:
1 V2 C1n'.W =_p.S. • (C.11.26)
Cd isobtainedfrom:
TavaiI - D = _p. S. V 2. C d(C.11.27)
The mining radius(Pc)isgiven by:
V 2 V 2R c -- _-
go •tan_b go_n,2_l (C.I1.28)
The turning ram (q)') is given by:
I ,.,(n'-l'_(C.I1.29)
-For maximum turningram:
Performed at:
cd=TT_,W_ K2 (C. 11.30)
Obtain CI from drag polar.The loadfactoris:
n = Cj Tavai1
Cd Wairplane
q)'max = _ p" S'''t+l°'T'Emaxw-I
Cl°= _K_ 2
I
Emax= _ ,.._.Cdo
(C.11.31)
(C. 11.32)
(C.11.33)
(C.I1.34)
-For minimum turning radius:
Performed
(C.11.35)
162

Rcmin -2.W
i
Clo/Emax 2.T 2p'S'go" -_ W2_l (C.II.36)
C.12 Other Mission Performance:
C.12.1 Minimum fuel mission
The minimum fuel mission performance is calculated as above, except the cruise segments are
omitted.
C.12.2 Ferry mission
The ferry mission has a fixed cruise altitude of 35,000 ft and a fuel capacity of 350,000 pounds.
performance is calculated so that all fuel is used, which determines the range.
163

(This page left intentionally blanL)
164

D. GENERAL ELECTRIC ENGINE DATA
SUBJECT: BIG ENGINE DATA
November 16, 1992
TO: David Levyo_ m_D_mmmu_w
Hello Dave, please find data plots to check for usefulness. This is a
100K class advanced ultra high bypass (AURB) engine. With, maybe, a
center rotating L.P. system, driving a .3 radius ratio fan with a fan
flow area of 76.6 square feet.
PRKGEDtNG PAGE BLANK NOT FILMEb
165

!iI
lliiJ
"I
iis
mq
2
166
•,,_-:,i_

, I
-_ _____
\\
n
ILlt_
---- .fl_
!
|
u. 3 a.
167

m i
llmlmmmm
\
P
_ _Li
i \\
! 1 1
iiJ
_b
|
168

2.
I.t0
i
v--_2
I-
i'i'ltIilIlIIilII"i''II
169

ZJ
JIJUIX;_L
iI:1L
v
i1i
L
!1
L
iI
t
I
n
170

U
I
L
i]]]]]]]]]]] _J
171

i
172

R
1.
173

(This page left intentionally blank.)
174
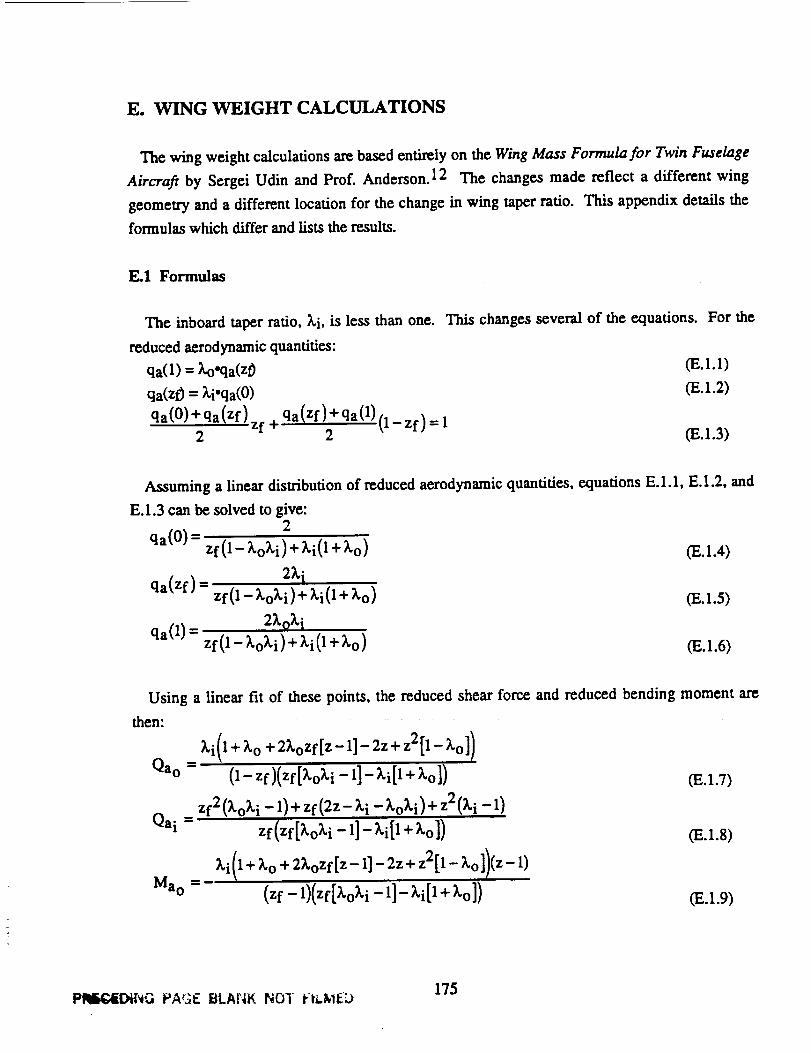
E. WING WEIGHT CALCULATIONS
The wing weight calculations are based entirely on the Wing Mass Formula for Twin Fuselage
Aircraft by Sergei Udin and Prof. Anderson. 12 The changes made reflect a different wing
geometry and a differentlocationfor the change in wing taperratio.This appendix detailsthe
formulas which differand liststhe results.
E.1 Formulas
The inboard taperratio,_.i,islessthan one.
reduced aerodynamic quantities:
qa(1) = ;_.o'qa(z_
qa(zf)= _,i'qa(O)
qa(0)+ qa(Zf) zf + qa(Zf)+qa(1)(1- zf)= 12 2
This changes severalof the equations. For the
(E.1.3)
Assuming a linear distribution of reduced aerodynamic quantities, equations E.I.1, E.1.2, and
E.1.3 can be solved to give:2
qa(0) = zf(1-_.o_.i)+ _.i(1 + _.o) (E. 1.4)
2_.iqa(Zf) = zf(1- _.o_.i) + _.i(1 + _.o) (E.1.5)
2_.¢_.iqa(1) = zf(1- _.o_.i) + _.i(1 + _'o) (E.1.6)
Using a linearfitof these points,the reduced shear force and reduced bending moment are
then:
_.i(1 + _'o + 2XoZf[Z-1]-2z+z2[1-Xol/"'Qa o =
f
Qai =
(1- zf)(zf [_,o_, i - 11- _.i[1 + _'o ])
zf2 (_.o_,i - 1)+ zf(2z- _'i - _'o_'i) + z2 (_'i - 1)
zf (zf [_.0_. i - 11- _.i[1 + _'o1)
+ +,:[1- ol) z-1)(zf -1)(zf[_.O_. i -1]- _.i[1 + go])
CE.1.7)
(E.1.8)
(E.1.9)
175PIIrlI_iDING PA_'31EBLAf, IK NO'I l-li.l_1£L)

Mai =zf3(1 + ki)+ zfZ,i(g.o[Z f - 1][z-l]-[z 2 +z-1]1-zf2(3z + ki)+ 3z2zf + z3(Xi - 1)
zf(zf[_,oX4-I]- Zi[I+ ko1) CE.I.IO)
From a linear approximation of wing mass spanwise distribution:
ms O _- (1- zf)(2 + 1.2Xi)(X o + 1)
msi zf(X i + 1)(2 + 1.2),o)
(2 + L2Xo)(2 + 1.2Xi)
qs i (zf)= qso(Zf) = 0.8zf (Xo + ki) + (X ° + 1)(2 + 1.2Xi)
0.SXi(2 + 1.2Xo)qs i (0)= 0.8zf(Xi + Xo) + (X ° + 1)(2 + 1.2Xi)
qs o (1)= 0"8X°(2 + l'2Xi)0.8zf (X i + Xo) + (X o + 1)(2 + 1.2Xi)
(E.I.I1)
(E.1.12)
(E.I.13)
(E.I.14)
Using a linear fit of these points, the reduced shear force and reduced bending moment arc
then:
o. (125+,5xil,+xol+zfXo[12 + 3o [xi+Xo]+_.o[3Z2-18z]-50z+:[25+9.0+15_.i])
% =- (zf-IX_fIxi+Xo]+[5+3xi[l+Xol) W_.1.15)
Qsi= zf(2zf[_.i+to 1+[5+3XiI1+ to]) ('E. 1.16)
O.I _25+l_ [l, lu], 3z_'},, [2_f +12_lszf[l+:2t+z_0133-21z-24zf}+/t0155-35z-40z,]+_451d+7511-z]÷z3125,1_,5_])
%= (N-l[2 flN+ l+ls+3 i[t+ D(E.I.17)
O.2(zf[RS-_z+15_iII+_]+ 15z2zf[_-_]+ [15zf3_oIf+_]+[10z- 25]mf2_o-[15+30zf_f_-15zf2_,i)
Msi : zf(2zf[_.i+_1+ [5+3_ ol)
O.2(-_zf2- Bzfz2 +25z+z3125+5_i+ 15X_]+_,i_[3z3- lSzf2+9z2zf - 12_f2 - 'SzmfD
(E.l.18)
In addition, the thickness distribution:
zf k Tr ) Tr (E.1.19)
176 .......

Hi= -1- zf T r - T r Tr
(E.I.20)
E.2 Solution
The equations were solved using Maple. A short FORTRAN program was then used to
calculate the final wing group weight percentage. Two cases were solved. First, the actual
configuration. Second, a configuration with the mass of both fuselages and the payload
concentrated at the centerline. This second case aUowed for comparison with existing aircraft.
This second value was scaled to modem commercial aircraft and the percent change was taken
from the first value as well. This resulted in a wing group weight of 12%. Also, there was a
0.4% savings due to the load distribution given by the fuselages and the payload. Figures E.2.1
and E.2.2 show the reduced shear force and bending moments. They clearly show the savings
associated with the distributed loads. The "peaks" on the shear force plot are associated with,
from the left, the payload mount, the fuselage, the three engines.
0.5
0.4
0.3m
i 0.20.'1
0
-0.1
q 0.2 0.4 0.6 0.8 I
Reduced half span
E.2.1 Wing reduced shear force
177

i 0.6
=o 0.5
0.4
g o.3
¢ 0.2
0.1
0
%%.
I I I I
0 0.2 0.4 0.6 0.8
Reduced half span
Fig. E.2.2 Wing reduced bending moment
178
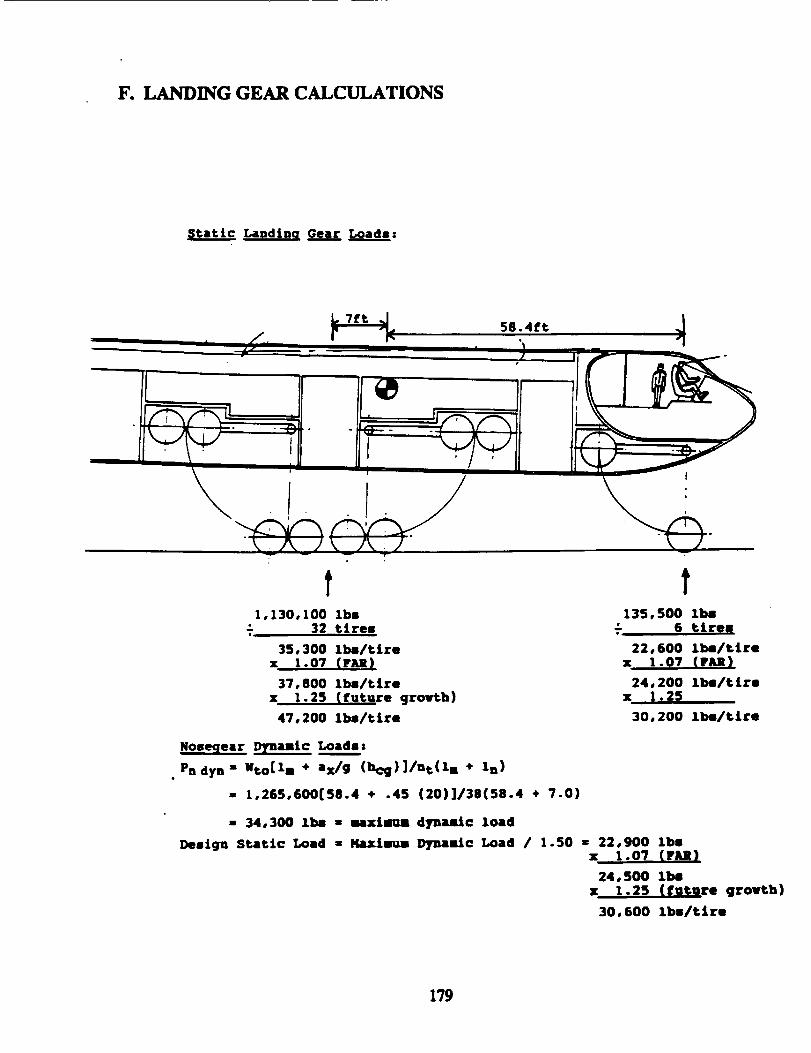
F. LANDING GEAR CALCULATIONS
LandinqGearLoad.._.__.q:
f1,130,100 lbs
32 tires
35,300 lbs/tire
• 1.o7 (rxe)37,800 lbs/tire
x 1.25 (future growth)
47,200 lbs/tire
t135,500 lbs
6 kites
22,600 lbs/tire
• 1.07 (rxe)24,200 lbs/tite
z t-2P30,200 1be/tire
Nosecjear D]mamtc T.oad_.___s,
Pn dyu " Mto[lm + ax/g (bcg)]/ut(lm + In)
- 1,265,600158.4 + .45 (20)]/38(58.4 + ?.0)
- 34,300 2bs - muzimmudyua_tc load
Design Static Loud - 14az.lmum Dynamic Y_ad / 1.50 - 22,900 2bsz ;.07 (rim)
24,500 lbSX 1.25 (future grovth)
30,600 lbs/tire
179

(Thispage leftintentionallyblank.)
180