design of a simplified hemodialysis simulation onesmo ... · toxins and the duration of dialysis....
TRANSCRIPT

1
Design of a Simplified Hemodialysis Simulation Onesmo Ogore, Kushal Sherpa, Caleb Baron,
Mansour Zenouzi, Ph.D., P.E., and Shankar Krishnan, Ph.D. Electronics and Mechanical Department
Wentworth Institute of Technology Boston, MA 02115
Session 6: Teaching project based courses and design courses, including senior design course
ABSTRACT
The objective of the present study is to create a representation of a hollow fiber dialyzer which is a critical component of any hemodialysis system. This is done to facilitate the understanding of the mass transport and fluid dynamics processes that occur within the dialyzer, which affect the dynamic homeostasis of end stage renal disease (ESRD) patients. The proposed solution utilizes a computer generated model via COMSOL to represent the dialyzer unit and these processes.
Index Terms – Hemodialysis, Dialyzer, COMSOL, Simulation
Co-current and counter-current flow inside the dialyzer are simulated. The simulated flow data is then used to determine the concentration gradients that occur within the fluids and the membrane. In conclusion, the design of the simplified interactive hemodialysis model shows promise to facilitate a simple and clear understanding of these processes by engineering students. Increasing awareness of hemodialysis function by the patients and the family members can have a positive impact on the overall care of the patient. This is an ongoing project for a Thermal Design course in the Electromechanical Engineering program at Wentworth Institute of Technology.
I. INTRODUCTION
Dialysis is a procedure that is performed routinely on patients who suffer from acute, chronic renal failure, or who have ESRD. The process involves removing waste substances and fluid from the blood that are normally eliminated by the kidneys. The main function of the kidneys is to remove waste products, generated from normal metabolic processes, and excess water from the blood. They play also a major role in regulating blood levels of various minerals such as calcium, sodium, and potassium. Other important functions are the production of hormones such as erythropoietin (EPO), which stimulates the production of red blood cells, renin, which controls blood volume and pressure, and the active form of vitamin D, involved in the intestinal absorption of calcium and phosphorus.

2
Many pathological events can cause the loss of renal function leading to kidney failure, which can be acute if it develops rapidly, or chronic if it occurs gradually, usually in months to years. ESRD is when the kidneys permanently fail to work. Over the past decades, technological improvements have lead to several treatment options that include peritoneal dialysis, hemodialysis, and continuous renal replacement therapies (CRRT). Furthermore, the progress in vascular catheters, semipermeable membranes and machinery has resulted in a variety of dialysis therapeutical options [1]. The choice of renal replacement therapy (RRT) often depends on several conditions that include clinical indication, and types of dialysis machinery. The subsequent paper focuses on a computer generated model via COMSOL to represent the dialyzer unit and the processes that occur within
. The primary goal is to facilitate a better understanding of the hemodialysis process and the biophysics involved in its design.
II. HEMODIALYSIS PROCESS
Hemodialysis units can be broken up into three basic subsystems: the blood delivery system (I & IV), dialyzer or exchanger (II & III), and the dialysate delivery & waste system (IV & V), (Figure 1). The blood delivery system is constituted by vascular access, catheres that carry the unfiltered blood to the dialyzer and filtered blood back to the body, heparin and blood pump.
The dialyzer consists of two chambers or paths (II & III) separated by a semi-permeable membrane (F & E) typically composed of cellulose, depending on the therapy employed [2]. The membrane is permeable to water and small molecules such as urea and impermeable to blood components like red blood cells, platelets and large proteins.
Within the chamber one path carries the unfiltered blood from the patient and the other is filled with the dialysate a special mixture that is carefully engineered to resemble the composition of the plasma and can be individualized based on the needs of the patient. The dialysate is usually delivered via a dialysate delivery system (V) composed of a proportioning unit, pumps, tubes, degasser and a temperature management unit (D). This system also monitors concentration levels and blood temperature and acts as a bypass if these values are off. Inside the exchanger most of the uremic toxins and excess fluids found are extracted from the blood path into the dialysate.
To increase the efficiency of this process the exchange within the membrane is done under countercurrent flow conditions. Once the unwanted toxins and fluids are extracted, the dialysate is delivered out (III) via the use of small plastic tubes (G) and disposed off appropriately (IV). Then the filtered blood within the dialyzer chamber is pumped out of the dialyzer (II) and delivered to the patient’s venous system via the use of tubes (VI & S) after being monitored for air bubbles,

3
it is also at this stage that venous pressure is monitored. During this process the blood has to be kept at body temperature using a thermo management system. This cycle usually takes 2 to 4 hours and is done about 3 times a week. The frequency depends upon the severity of CKD. [3]
Membrane[II] Blood
[III] Diaysate
F
E
Heparin Pump
Air Bubble Detector
BloodPump
Quality Control Temp. Conductivity
Blood Leak Detector
[V]Clean Dialysate
G
Q
ProportioningPump
DialysateConcentration
Water
[IV]Waste Dialysate
VenousBlood
ArterialBlood [I]
Unfiltered Blood to Dialyzer
[VI] Filtered Blood from Dialyzer
S
P
C Electrolyte
A
B
D
R
Figure 1: Simplified model of hemodialysis process
This analysis attempts to simulate the dialytic process using biophysical equations to demonstrate the effect of changing dialyzer parameters on the treatment process. For example how adjusting system flow rate affects the extraction of toxins and the duration of dialysis. (See Appendix A for diagram nomenclature) III. MODELING HEMODIALYSIS
Closer inspection of the dialyzer (II & III), its chambers and its semi-permeable membranes (F & E), reveals that it is imperative for dialyzer designers to understand the mechanisms that govern the bidirectional flow and restriction of the solvent and solutes found within the solution. Solvent being the excess fluid found in the blood and the fluid found in the dialysate. Solvents being the toxins, blood components, and particles found within the dialysate.
The physical processes that regulate the transport rate of the solutes and solvents across the dialyzer membrane are: diffusion (toxins and electrolytes), convection (larger molecules > 1,000 Daltons or g/mol), ultra-filtration (plasma water removal), and osmosis (body fluid shift). This excludes adsorption, which is controlled by electrostatic and Van der Waals forces between solute and membrane, absorption-based removal can be beneficial or harmful depending on the compound involved. [4]

4
Toxin Removal
Water Removal
Diffusion
Convection
Ultra-Filtration
Osmosis
Mechanisms of Membrane Transport:
Solute Concentration gradient
Hydrostatic Pressure
(Trans Membrane Pressure)
Osmotic Pressure Gradienr
Driven by:
Figure 2: Mechanisms of membrane transport used in hemodialysis
Removal of uremic toxins from the blood is mainly governed by two mechanisms: diffusion which eliminates mostly toxins and electrolytes, and convection which is responsible for removing larger molecules greater than 1000 daltons, excluding adsorption with removes the largest molecules such as beta-2-microglobulin. Water removal across the membrane is primarily controlled by ultrafiltration and osmosis (Figure 2). Renal replacement therapy (RRT) uses all these processes in combination, but diffusion and convection are the most relevant. In dialysis, diffusion is the prominent mechanism which clears small molecules more effectively. While ultrafiltration uses convection, and is very effective in the removal of very large amount of extracellular fluids and middle-size molecules. Therefore the choice of the methodology will be based on the needs of the patient.
IV. COMSOL DIALYSIS SIMULATION
This simulation mainly focuses on modeling the steady state diffusive flux of toxins across the dialyzers semi-permeable membrane due to the concentration gradients created across it. More specifically it will simulate the diffusion of small molecules across the hollow fibers in the dialyzer shell, in order to demonstrate how the diffusive process within a fiber of the dialyzer lowers the concentration of toxins in the blood stream into the dialysate.
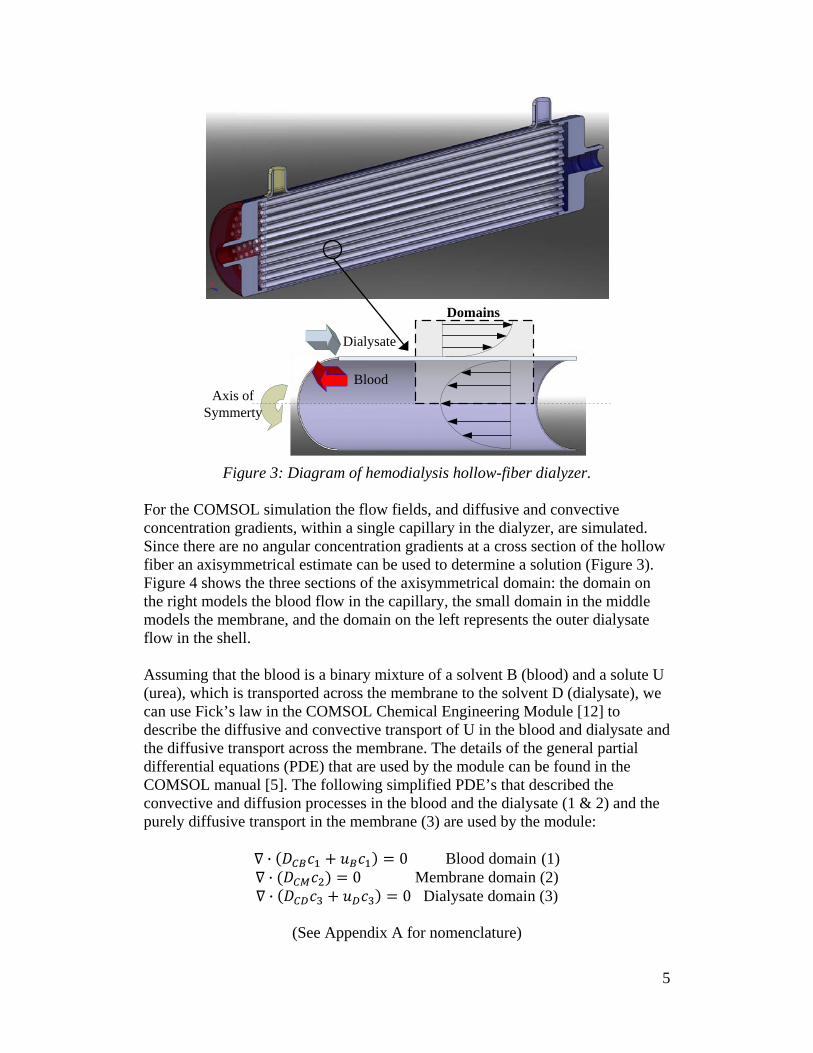
The configuration of a modern hollow fiber hemodialysis assembly can be seen in the (Figure 3). It is usually composed of an outer shell consisting of a bundle of many capillaries made out of semi-permeable membrane material, usually cellulose. The blood flows through these artificial capillary channels while the dialysate flows across the shell over the capillaries in a counter-current manner similar to a shell and tube heat exchanger. In this application the flow is laminar.
5
Dialysate
Blood
Domains
Axis of Symmerty
Figure 3: Diagram of hemodialysis hollow-fiber dialyzer.
For the COMSOL simulation the flow fields, and diffusive and convective concentration gradients, within a single capillary in the dialyzer, are simulated. Since there are no angular concentration gradients at a cross section of the hollow fiber an axisymmetrical estimate can be used to determine a solution (Figure 3). Figure 4 shows the three sections of the axisymmetrical domain: the domain on the right models the blood flow in the capillary, the small domain in the middle models the membrane, and the domain on the left represents the outer dialysate flow in the shell.
Assuming that the blood is a binary mixture of a solvent B (blood) and a solute U (urea), which is transported across the membrane to the solvent D (dialysate), we can use Fick’s law in the COMSOL Chemical Engineering Module [12] to describe the diffusive and convective transport of U in the blood and dialysate and the diffusive transport across the membrane. The details of the general partial differential equations (PDE) that are used by the module can be found in the COMSOL manual [5]. The following simplified PDE’s that described the convective and diffusion processes in the blood and the dialysate (1 & 2) and the purely diffusive transport in the membrane (3) are used by the module:
Blood domain (1) Membrane domain
(2)
Dialysate domain
(3)
(See Appendix A for nomenclature)

6
In the 5cm dialyzer shell diameter, they are typical 104
capillaries, which have an inner diameter of only 200-250µm and a length of 15cm. The radius of these fibers is therefore about 600 times smaller than the length. Using this exact geometry in COMSOL would cause it to generate a large number of mesh elements. We introduced a scaling factor to reduce the amount of mesh elements in the computational domains. As a result this increases simulation speed, decreases the amount of memory needed by the computer to obtain a solution, and makes the analysis of the solution less troublesome to observer.
For the simulation the scaling factor is used to model the entire length of a hollow fiber using geometry of a smaller length in the COMSOL interface. This scaling in length has a direct effect on the velocity fields and the diffusive and convective transportations along this scaled length. Such that the subdomains flow velocity and diffusivity used in the simulation are no long viewed as isotropic but as nonisotropic with respect to the fact that the actual radial dimension is kept the same while the length is scaled.
(See Appendix B for Dimensions & Properties )
For the convective component of the dialysate and the blood the Reynolds number for these flows were calculated to be 0.386 and 2.141 respectively. Therefore these flows can be considered fully developer laminar flow. Under these conditions the flow fields on both sides of the membrane could be simulated using COMSOL’s Chemical Engineering Module Incompressible Navier-Stokes application mode. First the fluid subdomain property’s of viscosity and density where defined by the values shown below.
The boundary layers where then defined as follows: Bwall and Dwall has slip condition since their where modeling the center of the laminar flow through the tube. Bout and Dout where model with pressured drop condition that were set to zero. Bin
(4)
was model having an inlet velocity condition in the y-direction described by the equation show below:

7
Din
(5)
was model have an inlet velocity condition in the y-direction described by the equation show below:
(a) (b) .
Figure 5: Co-current (a) and counter-current (b) velocity profiles.
Usually during hemodialysis the toxin in the blood stream has to dissolve into the membrane before it can be transported out by the dialysate. For this reason a dimensionless partition coefficient K is used to describe this interaction between the membrane and the fluids:
(6)
For this simulation this coefficient was assumed to be 1 by neglecting toxin flux delays cross the membrane due to toxin absorption in the membrane material.
BThe concentration simulation boundary layers where then defined as follows:
wall and Dwall had insulation symmetry condition. Bout and Dout where modeled as convection flux regions having a great contribution to conversion than diffusion. Bin was model as having a set inlet concentration c0. Din
was model as have a set inlet concentration of 0. The membrane boundary conditions and more details of the mathematical modeling can be found in the COMSOL manual [5].
8
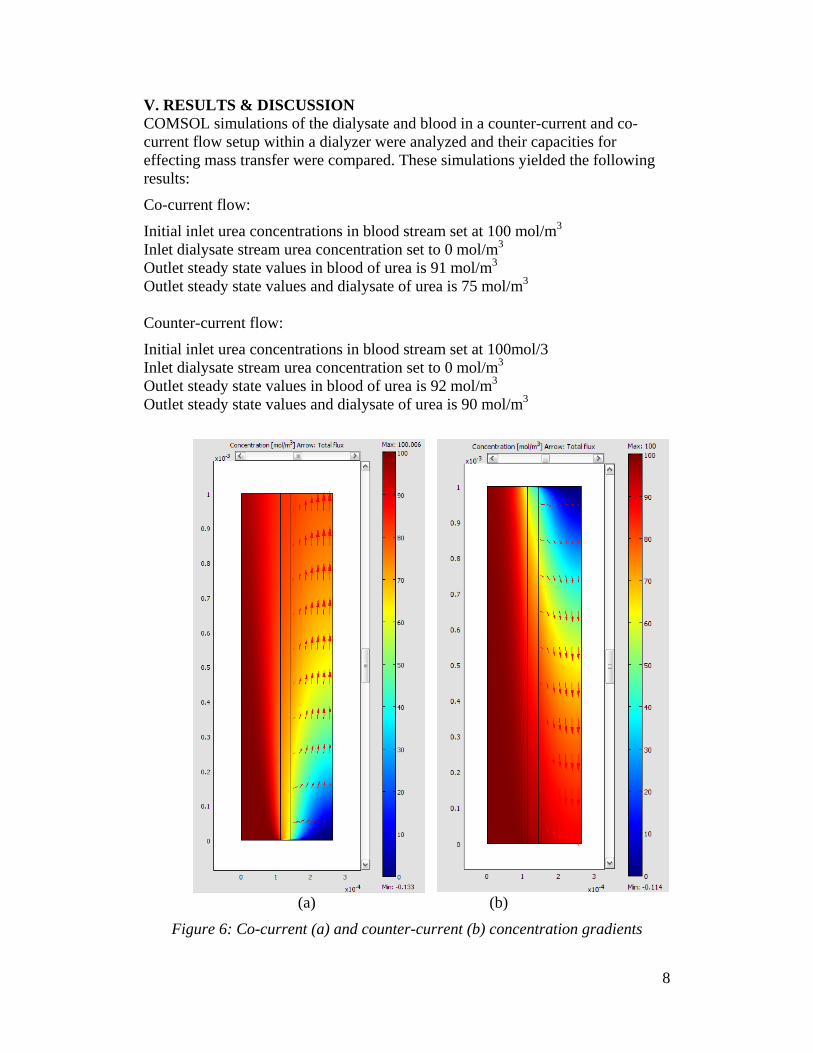
V. RESULTS & DISCUSSION COMSOL simulations of the dialysate and blood in a counter-current and co-current flow setup within a dialyzer were analyzed and their capacities for effecting mass transfer were compared. These simulations yielded the following results:
Co-current flow:
Initial inlet urea concentrations in blood stream set at 100 mol/m3 Inlet dialysate stream urea concentration set to 0 mol/m3 Outlet steady state values in blood of urea is 91 mol/m3 Outlet steady state values and dialysate of urea is 75 mol/m
3
Counter-current flow:
Initial inlet urea concentrations in blood stream set at 100mol/3 Inlet dialysate stream urea concentration set to 0 mol/m3 Outlet steady state values in blood of urea is 92 mol/m3 Outlet steady state values and dialysate of urea is 90 mol/m
3
(a) (b) .
Figure 6: Co-current (a) and counter-current (b) concentration gradients

9
Simulations were executed and analyzed with dialysate flowing in a co-current and a counter-current manner. These two characteristically different simulations resulted in fairly similar concentrations in both the blood outlet urea streams of 91 mol/m3 and 92 mol/m3 for co-current flow and counter current flow respectively. Discrepancies arose however in the dialysate outlet stream urea concentrations. As mentioned; the co-current simulations this outlet urea concentration was 15mol/m3
higher than in the counter-current flow simulation. This implies that changes in flow method have a direct affect on the urea concentration that is removed from the blood flow. The results of this simulation show that the change from a co-current to counter-current flow causes an increase in the diffusive flux across the membrane therefore increasing the concentration of urea in the dialysate fluid.
For our purposes, analysis of a complete hemodialysis system was unnecessary and proved too cumbersome. It was for this reason that we chose to focus on the dialyzer, the core component of the hemodialysis system. Furthermore, our findings indicate that manipulation of various subsystems have only negligible effects on the efficiency of the system as a whole, whereas manipulation of physical and functional aspects of the dialyzer itself have a significant effect on the outcome of the filtration process. Simulations were executed and analyzed with dialysate flowing in a co-current and a counter-current manner. These two characteristically different simulations resulted in fairly similar concentrations in both the blood outlet urea streams of 91
VI. CONCLUSIONS
mol/m3 and 92 mol/m3 for co-current flow and counter current flow respectively. Discrepancies arose however in the dialysate outlet stream urea concentrations. As mentioned; the co-current simulations this outlet urea concentration was 15mol/m3
higher than in the counter-current flow simulation. This implies that changes in flow method have a direct affect on the urea concentration that is removed from the blood flow. The results of this simulation show that the change from a co-current to counter-current flow causes an increase in the diffusive flux across the membrane therefore increasing the concentration of urea in the dialysate fluid.

10
APPENDIX A: A: Water supply
NOMENCLATURE
B: Dialysate concentration BIN BM
: Boundary inlet condition from blood
B: Boundary condition from blood to membrane
OUT B
: Boundary outlet condition from blood WALL
C: Electrolyte : Boundary condition for wall on blood side
: Concentration of urea in the blood entering the membrane (mol/m3
: Concentration of urea in the membrane entering the dialysate )
: Concentration of urea in the dialysate leaving the membrane CBM: C
Conc. in blood entering membrane BM:
CConc. absorbed from blood entering membrane
BM: C
Conc. in membrane entering dialysate BM:
D: Dialysate inlet tubing Conc. in dialysate taken form membrane
DIN DM : Boundary condition from dialysate to membrane
: Boundary inlet condition from dialysate
DOUT :D
Boundary outlet condition from dialysate WALL
: Diffusion coefficient of urea in blood (mol/(m: Boundary condition for wall on dialysate side
3
: Diffusion coefficient of urea in membrane ·s))
: Diffusion coefficient of urea in dialysate E & F: Transport across membrane G: Waste dialysate outlet tubing MB: Boundary condition from membrane to blood MD: Boundary condition from membrane to dialysate M1M
: Membrane inlet 2
n: Number of fibers : Membrane outlet
P: Arterial blood access Q: Blood entering dialyzer
: Blood flow rate : Dialysate flow rate
R: Filtered blood leaving dialyzer : Radial direction
: Fiber inner radius : Fiber outer radius
R3S: Venous blood access
: Radius from the center to where the outer flow is observed
: y direction : Blood flow velocity vector (m/s) : Dialysate flow velocity vector
I: Unfiltered Blood to Dialyzer II: Blood III: Dialysate IV: Waste Dialysate V: Clean Dialysate VI: Filtered Blood from Dialyzer
11
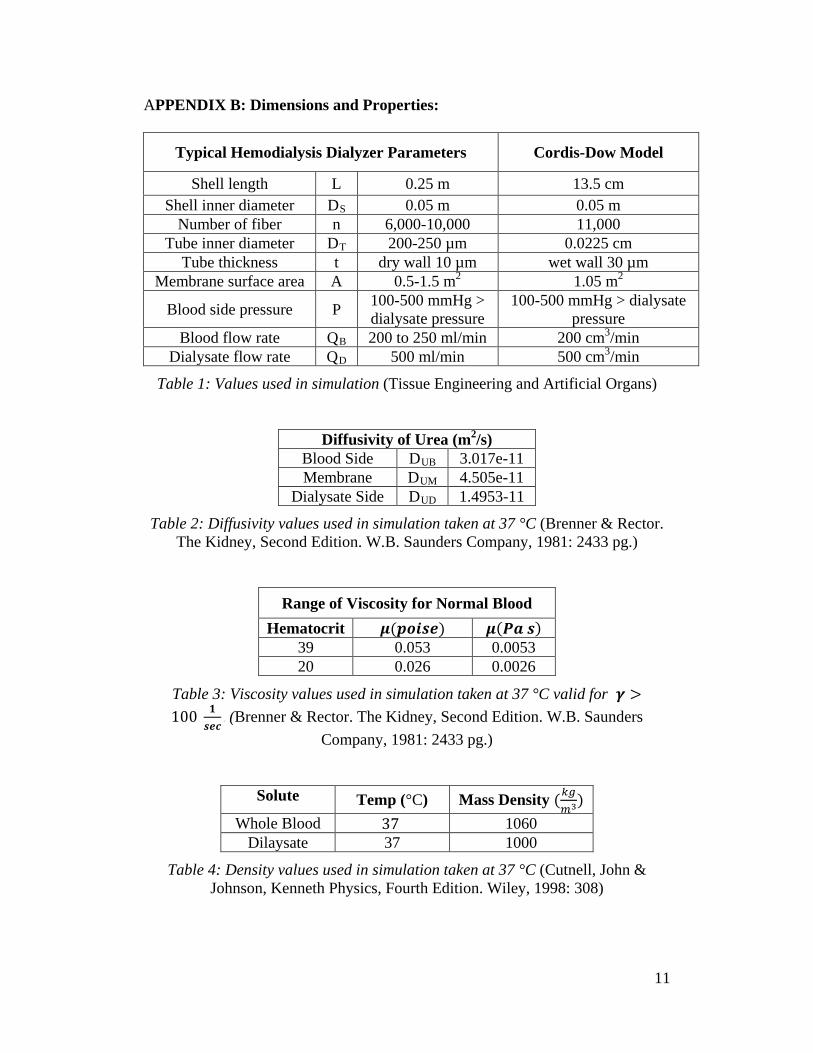
APPENDIX B: Dimensions and Properties:
Typical Hemodialysis Dialyzer Parameters Cordis-Dow Model
Shell length L 0.25 m 13.5 cm Shell inner diameter DS 0.05 m 0.05 m
Number of fiber n 6,000-10,000 11,000 Tube inner diameter DT 200-250 µm 0.0225 cm
Tube thickness t dry wall 10 µm wet wall 30 µm Membrane surface area A 0.5-1.5 m2 1.05 m2
Blood side pressure P 100-500 mmHg > dialysate pressure
100-500 mmHg > dialysate pressure
Blood flow rate QB 200 to 250 ml/min 200 cm3/min Dialysate flow rate QD 500 ml/min 500 cm3/min
Table 1: Values used in simulation (Tissue Engineering and Artificial Organs)
Diffusivity of Urea (m2/s)
Blood Side DUB 3.017e-11 Membrane DUM 4.505e-11
Dialysate Side DUD 1.4953-11
Table 2: Diffusivity values used in simulation taken at 37 °C (Brenner & Rector. The Kidney, Second Edition. W.B. Saunders Company, 1981: 2433 pg.)
Range of Viscosity for Normal Blood
Hematocrit 39 0.053 0.0053 20 0.026 0.0026
Table 3: Viscosity values used in simulation taken at 37 °C valid for (Brenner & Rector. The Kidney, Second Edition. W.B. Saunders
Company, 1981: 2433 pg.)
Solute Temp (°C) Mass Density
Whole Blood 1060 Dilaysate 37 1000
Table 4: Density values used in simulation taken at 37 °C (Cutnell, John & Johnson, Kenneth Physics, Fourth Edition. Wiley, 1998: 308)

12
BIBLIOGRAPHY
1. 2. Kutz, M. (2002). Standard Handbook of Biomedical Engineering and Design.
New York, Chicago, San Francisco, Lisbon, London, Madrid...: McGRAW-HILL.
Criner. G.J., D’Alonzo G.E. Critical Care Study Guide. 693-704, 2002
3. Fresenius 2008K Technicians Manual. Print. Part No 507082 Rev B. 4. Klinkmann, H and Vienken, J.,Membranes for dialysis Klinkmann and
Vienken Nephrol. Dial. Transplant.5. Chemical Engineering Module, FEMLAB 3.1 COMSOL AB, 2004.
1995; 10: 39-45
6. Mavroidis, C. (2006). Artificial Kidney. In J. D. Bronzino, Tissue Engineering and Artificial Organs, Vol. 3 (pp. 67-1 to 67-23). FL: CRC Press Taylor & Francis Group.