design of a real-time wireless sensing monitoring system
TRANSCRIPT

Research ArticleDesign of a Real-Time Wireless Sensing Monitoring System Basedon Acoustic Emission Power GIS Equipment
Dehua Zeng
Sichuan SCOM Intelligent Technology Corp. Ltd., Chengdu, Sichuan 610041, China
Correspondence should be addressed to Dehua Zeng; [email protected]
Received 17 August 2021; Accepted 30 August 2021; Published 20 September 2021
Academic Editor: Guolong Shi
Copyright © 2021 Dehua Zeng. This is an open access article distributed under the Creative Commons Attribution License, whichpermits unrestricted use, distribution, and reproduction in any medium, provided the original work is properly cited.
In this paper, real-time monitoring of acoustic emission power GIS equipment is studied and analyzed, and a real-time wirelesssensing monitoring system is designed. The overall design of the wireless sensing monitoring system for acoustic emission powerGIS equipment is as follows: the model of the system is constructed, the design of the system module function is proposed, theplatform of the system is built, the hardware and software solutions are configured, the operating system is optimized, thegraphics and data are input into the GIS distribution network system, the editing function is optimized, the fast positioningfunction of the equipment is improved, and the automatic generation of the system diagram is improved. By using ZigBeetechnology to establish a wireless sensor network and realize wireless transmission of monitoring signals, it can avoid manydisadvantages, such as cumbersome cable laying, troublesome changes, inconvenient expansion, and daily maintenance inwired transmission, and save various resources and reduce monitoring costs, which is well worth promoting in the system. Inthis paper, for the actual situation of GIS equipment, combined with the characteristics of the wireless sensor networkstructure and the design needs of the monitoring system (the overall design of the monitoring system, OFS maximum responseamplitude of 19.9mV, to be reached 40 dB), the signal will be uploaded to the high-speed collection system, and the efficiencyis increased by more than 10%. The feasibility test of the monitoring system, the test results, and the related data show that theUHF sensor can accurately collect the UHF signal, the wireless network formed by ZigBee can reliably transmit the signal, themonitoring interface is correctly displayed, and the whole monitoring system operates stably and meets the requirements ofthe initial design.
1. Introduction
With the development of society and economy, as well as theprogress of science and technology, the safety of electricpower systems is closely related to social stability, and thenormal operation of electric power equipment is necessaryto ensure the normal operation of the electric power systems.As important component equipment of substations, trans-formers and GIS will lead to the paralysis of power systemsonce the failure occurs, which will lead to serious loss; there-fore, it becomes especially important to ensure the normaloperation of transformers and GIS. Electrical equipmentmainly consists of conductors, magnetic conductive mate-rials, insulating materials, and operating mechanisms, andthe failure of electrical equipment can be divided into threecategories: mechanical failure, conductor failure, and insula-
tion failure [1]; insulation failure in the electrical equipmentfailure in the proportion of the larger, so the insulation sta-tus of electrical equipment monitoring and regular mainte-nance, can avoid part of the insulation failure, to avoidcausing greater losses. Therefore, monitoring the insulationstatus of electrical equipment and carrying out regular main-tenance can prevent some of the insulation failures fromoccurring and cause more losses [2]. Reliability overhaulfocuses on the overall operating status of the power system.The overhaul process is more complicated. Regular overhaulcan no longer guarantee the normal operation of powerequipment. Condition overhaul is currently the focus ofelectrical equipment overhaul. The maintenance of substa-tion electrical equipment can be divided into regular mainte-nance, condition maintenance, and reliability maintenance.Periodic maintenance is the maintenance of electrical
HindawiJournal of SensorsVolume 2021, Article ID 9726147, 11 pageshttps://doi.org/10.1155/2021/9726147

equipment according to a fixed interval of time, and themethod is suitable for the situation where the number ofelectrical equipment is small; state maintenance is a compre-hensive evaluation of the actual operating state of electricalequipment, according to its comprehensive evaluation todetermine its maintenance plan; reliability maintenance isfocused on the overall operating state of the power system,and its maintenance process is more complex [3]. Regularmaintenance can no longer guarantee the normal operationof electrical equipment; condition maintenance is the cur-rent focus of electrical equipment maintenance, online mon-itoring, and evaluation of the operating status of electricalequipment, according to its evaluation results to take corre-sponding measures that can greatly reduce the investment ofresources.
As partial discharge occurs inside the GIS cable terminal,the ordinary infrared temperature measurement and groundloop current test cannot be found to detect these partial dis-charge phenomena. Therefore, to ensure the safe and stableoperation of power equipment, the accurate detection ofpartial discharge phenomena is particularly important, notonly to be able to detect the presence or absence of partialdischarge phenomena but more importantly also to be ableto monitor the development of partial discharge; only thencan we take reasonable means of maintenance [4]. What ismore important is to be able to monitor the developmentof partial discharge. Only in this way can we take reasonablemaintenance measures. This can effectively improve thelarge-scale power outages of the power grid and make fulluse of electric energy. This will enable the grid to be effec-tively improved for large-scale power outages and make fulluse of the power. This paper establishes a wireless sensornetwork by using ZigBee 8 technology to realize wirelesstransmission of signals, which can avoid many disadvan-tages, such as cumbersome laying, troublesome changes,inconvenient expansion, and daily maintenance in wiredtransmission, and save various resources and reduce moni-toring costs, which is well worth implementing in the sys-tem. The overall design of the system is based on thestructural characteristics of the GIS equipment, the technicalcharacteristics of the wireless network and the monitoringrequirements of the power supply company, and the topol-ogy of the wireless sensor network of the monitoring systemis determined to be a star network. After processing by thePC, the local discharge is displayed in front of the operatorin the form of graphics and data to realize real-time moni-toring of GIS equipment in the substation.
The wireless sensor network holds the current interna-tional attention and is a multidisciplinary frontier hotresearch field; the ZigBee technology is applied to the localin-line monitoring of GIS equipment in the power system,improves the level of automation, intelligence, and digitali-zation of substations, and reduces personnel monitoringcosts and comprehensive wiring costs, in line with therequirements of strong smart grid construction. On thisbasis, run the basic applications of distribution network pro-duction and dispatching, unify business specifications,improve the modern management level and production effi-ciency of regional distribution networks, and solve the prac-
tical tasks of distribution network management, mainlyinvolving the spatial GIS information display and some spa-tial analysis functions, integration of production manage-ment data and distribution network verification. Carry outspatial visualization, spatial analysis, and spatiotemporalanalysis to provide a scientific basis for the development ofpower generation management, integrate multidimensionalinformation, such as power supply network informationand equipment usage information, integrate and developmodules for managing power equipment and operationmanagement, and provide modern production managementtools.
2. Current Status of Research
In terms of the current research status of partial dischargesignal detection, the methods for partial discharge detectioninside gas-insulated electrical appliances are divided intotwo categories: electrical and nonelectrical detectionmethods, among which nonelectrical detection methodsare divided into two categories: nonchemical detectionmethods and chemical detection methods [5]. The chemicaldetection method mainly uses the composition of SF6 gas tocomplete the detection of partial discharge, because the par-tial discharge phenomenon inside the gas-insulated appli-ance will be diluted by the large amount of SF6, and at thesame time, the overheating fault inside the device will alsodecompose part of the SF6 gas and produce decompositionproducts with similar composition, thus largely affectingthe partial discharge detection results [6]. The chemicaldetection method can only generally reflect the partial dis-charge situation inside the electrical equipment; if you wantto accurately understand the real discharge situation, youneed to use more complex and sophisticated instrumentsto carry out off-line detection and analysis [7]. At present,the commonly used detection methods are the pulse currentmethod, ultrasonic method, and ultra-high-frequencymethod; the detection frequency of the pulse current methodis usually within 10MHz, which can achieve accurate mea-surement of the local discharge signal. Therefore, this detec-tion method is not suitable for the detection of partialdischarge signals of substation equipment.
To solve the problem of real-time monitoring of high-voltage transmission lines, literature [8] designed a wirelesssensor network-based online monitoring system for high-voltage transmission lines, which realizes the collection,transmission, and processing of various environmentalparameters of transmission lines through ZigBee technology,to monitor the operation status of high-voltage transmissionlines in real time. In the literature [9], a transformer partialdischarge online monitoring system was designed for trans-former partial discharge to provide a guarantee for the safeoperation of power transformers. Literature [10] designed atransformer temperature monitoring system based on awireless sensing network, using platinum resistors to collectthe temperature data and ZigBee wireless communicationmodule for data transmission, which is important for real-time monitoring of transformer oil and winding tempera-ture. Literature [11] used a wireless sensing network for
2 Journal of Sensors
temperature monitoring of substation equipment, withdetailed design of monitoring nodes and gateway nodes,and literature [12] innovatively designed a UHF temperaturemonitoring subsystem and substation monitoring subsystemusing IoT technology, modern communication technology,and information processing technology to realize the designof the substation sensing monitoring system based on powerIoT. To effectively monitor the temperature condition ofpower equipment, literature [13] put infrared thermal imag-ing technology to monitor the temperature of power equip-ment, which circumvents the disadvantages of other types ofsensor monitoring.
The early fault monitoring signal of the equipment isvery weak, and there is strong electromagnetic interferenceat the equipment operation site, and the existence of prob-lems such as a low signal-to-noise ratio at the monitoringsite brings some difficulties to the condition monitoring.Some of the existing monitoring systems can only reflectthe development trend of equipment failure but cannot pro-vide the type of equipment failure and the severity of thefailure [14]. The software and hardware have differentdegrees of defects and instability, which can easily cause falsealarms and missed alarms. The current specification doesnot have corresponding technical requirements and indica-tors, making condition monitoring lack scientific standards.The current monitoring and diagnostic system have difficul-ties in continuous real-time monitoring and cannot predictsudden failures accurately and timely. Therefore, the originalsingle small-scale monitoring system can no longer meet therequirements of a smart grid for advanced asset manage-ment. Moreover, with the rapid growth of the scale of theelectricity information collection business, the stored moni-toring data also shows an exponential growth trend, andhow to better realize the online monitoring of power equip-ment status is a topic well worth studying.
3. Acoustic Emission Power GIS EquipmentReal-Time Wireless Sensing MonitoringSystem Design
3.1. Real-Time Monitoring Analysis of Acoustic EmissionPower GIS Equipment. As important equipment of powersystems, acoustic emission power GIS equipment undertakesthe tasks of voltage conversion, power distribution, andtransmission. Therefore, the prevention and avoidance ofpower transformer faults are of great importance to the sta-ble operation of the power system. However, transformerfault monitoring is a very complex issue; the capacity ofthe transformer, the voltage level, the performance of theinsulation, the working environment, and even differentmanufacturers all have an impact on the monitoring results[15]. Carry out spatial visualization, spatial analysis, andspatiotemporal analysis to provide a scientific basis for thedevelopment of power generation management, integratemultidimensional information, such as power supply net-work information and equipment usage information, inte-grate and develop management modules for powerequipment and operation management, and provide modern
production management tools. According to the process offault occurrence and development, transformer faults canbe divided into gradual faults and sudden faults, and accord-ing to statistical data, the largest proportion of transformerfaults is gradual faults. Gradual failure mainly refers to thetransformer in operation, due to insulation aging, qualitydefects, moisture, and other factors that make insulationperformance decline and eventually lead to transformerinsulation failure. This type of fault can be detected inadvance by online monitoring means to avoid more seriousaccidents.
In the power equipment insulation structure, the localfield strength is more concentrated; the appearance of localdefects will lead to partial discharge, partial discharge as anelectrical discharge in the insulation medium, although itdoes not affect the insulation properties of the medium butforeshadows the insulation aging of the equipment, whichalso makes the insulation aging eventually develop into themost important reason for insulation breakdown. The trans-former partial discharge process is accompanied by electricalimpulses, electromagnetic radiation, ultrasonic waves, andother phenomena; the amount of partial discharge andchanges in discharge patterns can reflect many faults; timelyand effective monitoring of partial discharge and accuratedetection of the type and location of partial discharge ofthe transformer and targeted maintenance measures aredone to avoid more serious sudden failure of the trans-former. Gradual failure mainly refers to the transformer inoperation. Due to factors such as insulation aging, qualitydefects, moisture, and other factors, the insulation perfor-mance of the transformer is reduced, which ultimately leadsto the insulation failure of the transformer. In general, thelow-voltage line loss is about 10%; if part of the station areais relatively high, the theoretical line loss is also high, indi-cating that the power supply line has problems; the existingline can be simulated and optimized, if the optimization planis feasible before the actual transformation; sometimes, it isnecessary to relocate the distribution substation; to find thebest solution, you can also simulate the displacement to cal-culate the theoretical line loss if the plan is feasible; then, theactual transformation can be carried out. The line loss calcu-lation formula and explanation are as follows:
ΔAxt =NI2pjK2Rdct: ð1Þ
Calculate before the low-voltage line from the end tothe first, the branch line to the mainline (that is, to takethe load incremental way (more convenient)), and divideinto several calculation line segments; the line segment isdivided into the following principles: the transmitted loadis the choice of a line number, and the length of the linesegment is the same for the same line segment, otherwiseanother calculation line segment. At this point, the Rdccalculation formula is
Rdc =∑n
i=1N1S2I
N ∑mi=1A1ð Þ3
: ð2Þ
3Journal of Sensors

In today’s information-based society, a wide variety ofsensors are used in different industries, are used to accu-rately obtain the required information, such as monitoringthe working state of equipment, monitoring the functionsof the human body, and observing the vast universe, andare applied to a variety of scientific research, coveringalmost every scientific and technological projects, such assensors in social development, economic development,and the importance of self-evidence; various countries arealso very focused on this aspect of research so that sensortechnology has advanced by leaps and bounds. Sensors canbe divided into many kinds according to their functions:gravity sensors, laser sensors, biosensors, photosensitivesensors, vision sensors, displacement sensors, and so on.In the monitoring system developed in the thesis, to col-lect the propagated UHF local discharge signal, the corre-sponding UHF sensor must be used [16]. UHF sensors usecoupled antennas to sense the pulsed electromagnetic wavesignal generated by the local discharge inside the GISequipment in the UHF frequency band. Sometimes, it isnecessary to migrate the distribution transformer. To findthe best solution, the theoretical line loss can also be cal-culated by simulating the displacement. If the solution isfeasible, the actual transformation can be carried out.The sensors are divided into two types, built-in and exter-nal, according to the different installation locations.
The built-in sensor, as the name suggests, is installedinside the GIS equipment. The built-in sensor has high sens-ing efficiency and strong anti-interference ability and canefficiently collect the UHF local amplification signal gener-ated by GIS, but it requires more sensors, and one must beinstalled at every distance, which is costly and adds moresealing points. The design and installation of the sensor are
synchronized with the GIS equipment body, which isinstalled at the factory and is not suitable for the alreadyoperating GIS equipment.
i tð Þ = I0e− t+t0ð Þ2×2σ2 : ð3Þ
It mainly refers to the defects of solid insulation mate-rials inside GIS equipment, such as residual air gaps. Break-down faults caused by defects in insulators account for 10%of total faults, and faults caused by cavity problems in earlyinsulators account for most faults, so defects in solid insula-tion inside GIS equipment often occur on the surface of solidinsulators or inside them. Internal defects are usually formedin the manufacturing process but not detected; they are oftensmall, such as some infiltrating metal particles and metaldebris and internal air gaps; due to the presence of errorsin the installation of the equipment, the movement of theconductor may also give a certain degree of impact, asshown in Figure 1.
The wavelet analysis method is a time-domain localizedanalysis method with fixed window size (i.e., window area),but its shape can be changed, and both the time and fre-quency windows can be changed, i.e., with higher frequencyresolution and lower time resolution in the low-frequencypart and with higher time resolution and lower frequencyresolution in the high-frequency part. Wavelet transform isa function of a basis wavelet that is shifted and then madethe inner product with the signal to be analyzed at differentscales.
WTx a, τð Þ = 1ffiffiffi
ap
ð+∞
−∞X wð Þφ∗ t + b
a
� �
dt: ð4Þ
Metal particles and metal debris infiltrated
Presence of errors in the installation of the
equipment
Cavity problems
Solid insulation material GIS equipment Residual air gaps Breakdown faults
Defects in insulators account
Insulators account for most faults
Defects in solid insulation inside Occur on the surface
Solid insulators or inside them
Internal defects are usually defecting
Manufacturing process
Total faults
Figure 1: Acoustic emission wireless sensing real-time monitoring architecture.
4 Journal of Sensors

The equivalent frequency domain is expressed as
WTx a, τð Þ = 1ffiffiffi
ap
ð+∞
−∞X wð Þφ∗ awð Þe−jwtdw: ð5Þ
Then, the signal can be recovered by wavelet transform,i.e.,
x tð Þ = 1ffiffi
cp
ð+∞
0a2ð+∞
−∞X wð Þφ∗ awð Þe−jwtdadb: ð6Þ
The wavelet transform differs from the time-domainwindow of the short-time Fourier transform because onlythe position of the window on the phase plane time axis isaffected, but it can affect not only the shape of the windowbut also the position of the window on the frequency axis.It is because the wavelet transform makes the sampling stepsadjustable in the time domain for different frequencies thatthe wavelet transform has better properties compared tothe Fourier transform [17].
The ZigBee protocol is divided into two modules, one isthe physical layer (PHY) and MAC layer specificationsdefined by IEEE 802.15.4, and the other is the network layer(NWK), security layer, and application layer (APL) specifi-cations proposed by the ZigBee Alliance. The ZigBee proto-col stack collects the protocols of each of these layers,functionally implements them, and provides some APIs forusers to call. The protocol stack adopts the idea of layering,each layer has different functions, and data is only transmit-ted between adjacent layers, which has many advantages; forexample, if a part of the network protocol changes, it isenough to modify several layers related to it, instead ofchanging all layers. The coordinator is indispensable in wire-less sensor networks; regardless of which topology the net-work uses, the coordinator is a must and must be unique.The coordinator is mainly responsible for establishing andmaintaining the wireless network and allocating the com-puting power and larger storage space for its point joint net-work, so the golden expert function that is a must is allrequired for the coordinator to be indispensable from thestructure and mesh topology. To join the network, the routeris indispensable in the tree topology and mesh topology.There is no need to forward data, so there are no require-ments for computing power and storage space, and full-function or semifunction equipment is used at will. Its mainmethod includes forwarding data, because the router has acertain address space, and also being a parent node to acceptchild nodes plus to achieve multihop transmission of data.Expand the coverage radius and communication distanceof the wireless sensor network. Since the router must for-ward data, it also must use full-featured equipment. The ter-minal node is mainly responsible for collecting and sendingdata and only passively accepts the parent node to join thenetwork, without itself as the parent node and without for-warding data, so it does not require computing power andstorage space and freely uses full-featured devices or semi-featured devices. The main purpose of building the networktopology is to expand the coverage radius and communica-
tion distance of wireless sensor networks, as shown inFigure 2.
When the partial discharge amount reaches or exceedsthis standard, the starting voltage value of partial dischargewill take the effective value of the applied voltage, and whenthe partial discharge amount is lower than this standard, theextinguishing voltage value of partial discharge will take thehighest value of the applied voltage.
Mλb λ, Tð Þ = C1λ5 exp C2
λT + 1
� �
: ð7Þ
After the signal is transmitted to the material surface, itis received by the acoustic emission sensor attached to thesurface and converted into an electrical signal; then, aftersignal amplification and other signal processing, the signalcan be recorded and displayed by the instrumentation; findthe characteristic parameters that can better characterizethe material damage, and use certain data processing.Finally, the material damage is evaluated and interpretedaccording to certain evaluation criteria.
3.2. Real-Time Wireless Sensing Monitoring System Design.Ultrasonic sensors can convert the ultrasonic signal gener-ated by the local discharge source into an electrical signal,which consists of a piezoelectric chip that can both transmitand receive ultrasonic waves. The spectrum of ultrasonicwaves generated by different discharge types varies, and theultrasonic signal inside the device is often small in ampli-tude, so the ultrasonic sensor is used for partial dischargedetection; its operating frequency and sensitivity are impor-tant indicators of whether the sensor is good or bad. Thepartial discharge-generated ultrasonic signal value is concen-trated in about 30 kHz, the ultrasonic sensor resonant fre-quency is also positioned at 30 kHz, and the bandwidthfrequency is 10-200 kHz, so the choice is the PACmanufacturing D9241A-type sensor (sensitivity of -65 dBmand configured with a coupling agent); before using the sen-sor for detection, the coupling agent will be applied to thesensor head, to increase the chip and the device shell fitand reduce signal attenuation and external interference[18]. A sensor is shown in Figure 3; the connection cableused is the BNC-N-type RF coaxial shielded cable; the typeof cable attenuation is small; high shielding performance,the applicable frequency band, stable performance, and theadvantages are obvious.
The signal reception and processing module containthree acquisition systems. First, the signal acquisition unitof the industrial frequency signal can be obtained from theordinary 220V power supply, and through signal condition-ing output, a certain amplitude of the periodic signal canprovide the detection system with the synchronous referencephase and synchronous industrial frequency voltage over-zero point to achieve accurate phase calibration of the localdischarge signal. Second, the ultra-high-speed synchronousacquisition system, according to the sampling bandwidthof the UHF sensor, uses an acquisition system with a maxi-mum sampling frequency of 2GS/s. The data storage formadopts the segmented acquisition method, that is, the UHF
5Journal of Sensors

pulse signal coupled to the sensor itself as a trigger sourceto store the signal in segments, and then read out theseUHF signals continuously through queuing technology.This approach reduces the storage space required by theacquisition system and enables continuous acquisition ofthe local discharge signals by using MS/s level samplingboards for reading data [19]. Third, the synchronouslow-speed acquisition system is mainly used for the acqui-sition of synchronous voltage signals and ultrasonic localdischarge signals at a maximum sampling rate of2.5MS/s. In addition, this system is also used as a syn-chronous system for the high-speed acquisition system torealize the synchronous acquisition of UHF signals andthe phase calibration.
The function of the charged detection system for GISpartial discharge is to detect the UHF and ultrasonic localdischarge signals inside the GIS equipment and display thesignal waveforms in the system interface to provide a basisfor analysis and diagnosis. Combined with the hardwaredesign in the previous section, the software for system con-trol and data acquisition and analysis is built on the Lab-VIEW virtual instrument platform, which mainly containsthe parts of data acquisition control and data archiving stor-age, and historical data retrieval, as shown in Figure 4. Themaximum sampling rate is 2.5MS/s. In addition, the systemis also used as a synchronization system for high-speedacquisition systems to realize the synchronous acquisitionof UHF signals and achieve phase calibration.
The wavelet transform differs
from the time domain window
The short-time fourier because only the position of the
window
The phase plane time axis is affected
A can affect not only the shape of the
window
The position of the window on the frequency axis
Network protocol changes
It is because the wavelet
Transform makes the sampling steps
Adjustable in the time domain
Different frequencies that the wavelet
Transform has better properties
Compared to the Fourier transform
ZigBee protocol
Divided into two modules
Applicationlayer
MAC layer
ZigBee Alliance
Network layer
Physical layer
Protocol stack
collects
Adopts
Idea of layering
These layers
Protocol stack
Different functions
Functionallyimplements
APIs
Adjacent layers
Figure 2: Protocol coincidence structure diagram.
CPLD
Interface Differential/single-ended HMIX
Rate
ADC
DDR3SDRAM
Anti-aliasing Filtering
Input protection
Single-ended/differential
A/D drive
Differential single-ended
Anti-alias
ADC Duc CFR DPD DAC DDC
HostUp
Host
HWIF
Figure 3: Test host schematic.
6 Journal of Sensors
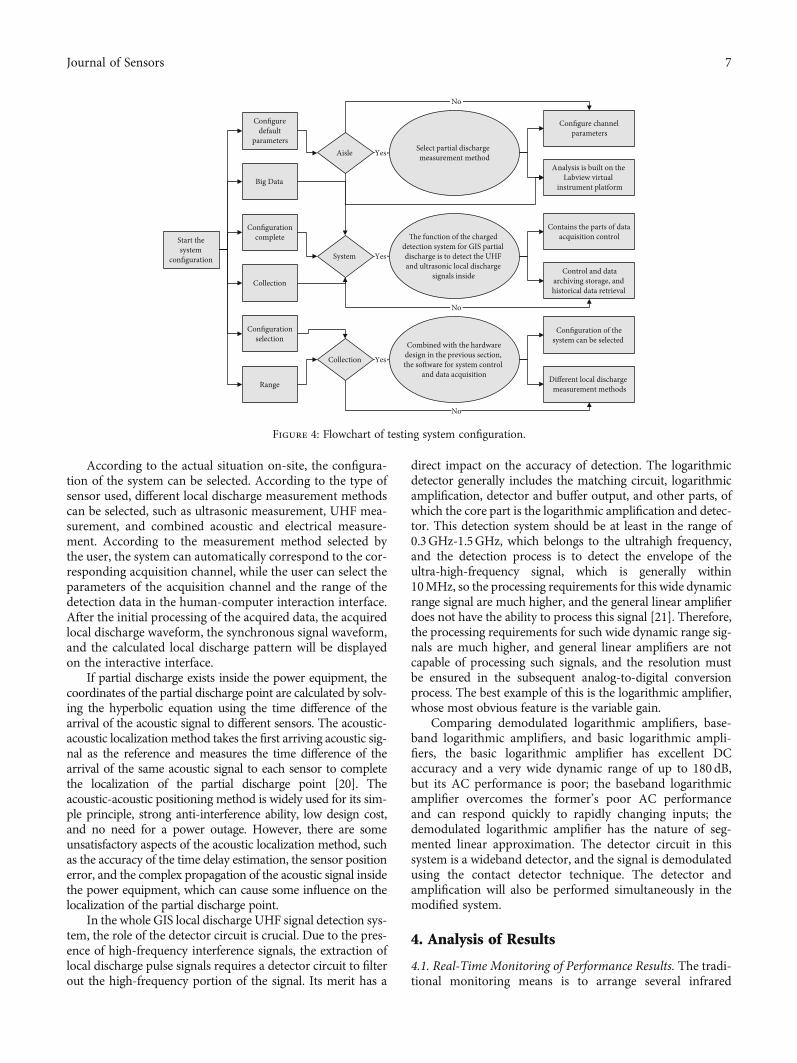
According to the actual situation on-site, the configura-tion of the system can be selected. According to the type ofsensor used, different local discharge measurement methodscan be selected, such as ultrasonic measurement, UHF mea-surement, and combined acoustic and electrical measure-ment. According to the measurement method selected bythe user, the system can automatically correspond to the cor-responding acquisition channel, while the user can select theparameters of the acquisition channel and the range of thedetection data in the human-computer interaction interface.After the initial processing of the acquired data, the acquiredlocal discharge waveform, the synchronous signal waveform,and the calculated local discharge pattern will be displayedon the interactive interface.
If partial discharge exists inside the power equipment, thecoordinates of the partial discharge point are calculated by solv-ing the hyperbolic equation using the time difference of thearrival of the acoustic signal to different sensors. The acoustic-acoustic localizationmethod takes the first arriving acoustic sig-nal as the reference and measures the time difference of thearrival of the same acoustic signal to each sensor to completethe localization of the partial discharge point [20]. Theacoustic-acoustic positioning method is widely used for its sim-ple principle, strong anti-interference ability, low design cost,and no need for a power outage. However, there are someunsatisfactory aspects of the acoustic localization method, suchas the accuracy of the time delay estimation, the sensor positionerror, and the complex propagation of the acoustic signal insidethe power equipment, which can cause some influence on thelocalization of the partial discharge point.
In the whole GIS local discharge UHF signal detection sys-tem, the role of the detector circuit is crucial. Due to the pres-ence of high-frequency interference signals, the extraction oflocal discharge pulse signals requires a detector circuit to filterout the high-frequency portion of the signal. Its merit has a
direct impact on the accuracy of detection. The logarithmicdetector generally includes the matching circuit, logarithmicamplification, detector and buffer output, and other parts, ofwhich the core part is the logarithmic amplification and detec-tor. This detection system should be at least in the range of0.3GHz-1.5GHz, which belongs to the ultrahigh frequency,and the detection process is to detect the envelope of theultra-high-frequency signal, which is generally within10MHz, so the processing requirements for this wide dynamicrange signal are much higher, and the general linear amplifierdoes not have the ability to process this signal [21]. Therefore,the processing requirements for such wide dynamic range sig-nals are much higher, and general linear amplifiers are notcapable of processing such signals, and the resolution mustbe ensured in the subsequent analog-to-digital conversionprocess. The best example of this is the logarithmic amplifier,whose most obvious feature is the variable gain.
Comparing demodulated logarithmic amplifiers, base-band logarithmic amplifiers, and basic logarithmic ampli-fiers, the basic logarithmic amplifier has excellent DCaccuracy and a very wide dynamic range of up to 180 dB,but its AC performance is poor; the baseband logarithmicamplifier overcomes the former’s poor AC performanceand can respond quickly to rapidly changing inputs; thedemodulated logarithmic amplifier has the nature of seg-mented linear approximation. The detector circuit in thissystem is a wideband detector, and the signal is demodulatedusing the contact detector technique. The detector andamplification will also be performed simultaneously in themodified system.
4. Analysis of Results
4.1. Real-Time Monitoring of Performance Results. The tradi-tional monitoring means is to arrange several infrared
Start the system
configuration
Configure default
parameters
Big Data
Configuration complete
Collection
Configuration selection
Range
Aisle
System
Collection
Select partial discharge measurement method
The function of the charged detection system for GIS partial discharge is to detect the UHF and ultrasonic local discharge
signals inside
Combined with the hardware design in the previous section, the software for system control
and data acquisition
Configure channel parameters
Analysis is built on the Labview virtual
instrument platform
Contains the parts of data acquisition control
Control and data archiving storage, and historical data retrieval
Configuration of the system can be selected
Different local discharge measurement methods
No
Yes
No
No
Yes
Yes
Figure 4: Flowchart of testing system configuration.
7Journal of Sensors

cameras in the location to be monitored, as well as wiring inthe substation to meet the data transmission requirements ofthe cameras, but because the wiring is cumbersome and thesubstation itself has a complex electromagnetic environ-ment, wired data transmission will be affected to a certainextent, so the wireless transmission method is chosen; theinfrared camera will be connected to a wireless router.Therefore, the wireless transmission method is chosen, andthe infrared thermal imaging camera is connected to a wire-less router to ensure that the back-end monitoring center isin the same LAN with it so that data transmission can becarried out conveniently, which greatly improves the secu-rity, remoteness, and real time of the infrared thermal imag-ing monitoring system for power equipment. The datacollected by the front-end thermal imaging acquisition sys-tem is transmitted wirelessly to the back-end data processingand display module, and the monitoring client installed withthe infrared thermal imaging online monitoring system soft-ware can realize the control function of the front-end ther-mal imaging acquisition system, and any computer in thesame LAN can observe the front-end thermal images anddata in real time and realize the alarm processing, recording,query, statistics, and detection data curve output of the mon-itored equipment data in each area through the online mon-itoring system software. The online monitoring systemsoftware can realize various functions such as alarm process-ing, recording, query, statistics, and output of testing datacurves for the monitored equipment data in each area.
Real-time monitoring of the appearance and workingstatus of transformers, the high-voltage circuit breakersand other important operating power equipment, and thesurrounding environment in substations to ensure their nor-mal operation always follows the principle of reliability insystem design and hardware selection to ensure that the sys-tem can reliably play its maximum role; the operation of theinfrared thermal imaging monitoring system is simple andeasy to grasp, and the background monitoring personnelcan be flexibly used and maintained, giving full play to allaspects of the function; flexible configuration of the condi-tion monitoring system according to the requirements ofthe monitoring environment facilitates future system expan-sion; innovative use of wireless transmission for the trans-mission of monitoring data greatly abandons thedisadvantages of wired transmission. The system can be flex-ibly configured according to the requirements of the moni-toring environment so that the system can be expanded inthe future; the innovative use of the wireless transmissionmethod for monitoring data transmission greatly abandonsthe drawbacks of wired transmission, and it is easier to meetthe actual requirements of the substation environment, asshown in Figure 5.
The radius of the mandrel has a small effect on the sen-sitivity of the fiber-optic ultrasonic sensor. This is because asthe radius of the mandrel increases, the equivalent stiffnessfactor of the sensor increases, but so does its overall mass.The simultaneous change of the two will offset the effecton the center frequency of the sensor. In addition, the largerthe mandrel radius, the better the modulation of the sensingfiber length by the mandrel deformation. However, the
increase in the sensor equivalent stiffness coefficient reducesthe radial deformation of the mandrel, and the combinedeffect on the sensing fiber length is smaller, so the effect ofthe mandrel radius on the sensor sensitivity is notsignificant.
In the design of GIS fiber-optic ultrasound sensors, it isadvisable to choose a mandrel with a large Poisson’s ratioand a small elastic modulus and density to obtain a highersensitivity in the high-frequency band, and the center fre-quency can be regulated by optimizing the height of themandrel. However, if the selected mandrel has a small mod-ulus of elasticity, although a high peak sensitivity can beobtained, its center frequency is often low, and the preparedfiber-optic ultrasonic sensor is not necessarily suitable forGIS partial discharge detection considering the size con-straint. To obtain high sensitivity in the frequency bandaround 40 kHz, the matching relationship between mandrelmaterial and size needs to be considered in the actual designof fiber-optic ultrasonic sensors.
This detection system requires at least the device band-width within the range of 0.3GHz-1.5GHz, which belongsto the ultrahigh frequency. In the detection process, theenvelope of the ultra-high-frequency signal is detected, gen-erally within 10MHz. When the voltage is increased to U= 49:8 kV, the responses of the GIS fiber-optic ultrasoundsensor and PZT sensor are shown in Figure 6, respectively.It can be seen that in five working frequency cycles, underthe same ultrasonic signal excitation, the maximumresponse amplitude of OFS is 19.9mV, which is five timesthe background noise (U = 0 kV). And the PZT responseamplitude is comparable to the background noise, whichcannot discriminate the local discharge signal.
The reasons for the above signal characteristics are asfollows. With the gradual increase of the applied I.F. voltage,the linear metal particles are subjected to small vibration bythe electric field force, and the former can detect the smallvibration signal of the linear metal particles due to the highersensitivity of the fiber-optic ultrasonic sensor than the PZT
0 5 10 15 20 25 30 35 40 450.0
0.1
0.2
0.3
0.4
0.5
0.6
0.7
0.8
0.9
1.0
Nor
mal
ized
sens
itivi
ty
Frequency
p=1000p=3000
p=5000p=7000
Figure 5: Effect of sensor sensitivity.
8 Journal of Sensors

sensor. When the frequency voltage increases further andreaches the starting voltage of the linear metal particles,the particles jump back and forth rapidly between theguide rod and the cavity wall and generate discharge whencolliding. Due to the large collision signal, the fiber-opticultrasonic sensor and PZT sensor can detect the largevalue signal at the same time, while the UHF sensor alsodetects the discharge signal. However, because the dis-charge current is very small, the partial discharge meterand high-frequency current sensor are unable to detectthe discharge signal.
4.2. Real-Time Monitoring System Performance Results. Toensure the smooth operation of the sensor, it is also neces-sary to reduce the adverse effects of external factors, andone of the most important methods is to change the detec-tion frequency. At the same time, to improve the sensitivityof the detection system, in addition to setting the frequencyof UFC in a range (0.3GHz~1GHz), it is necessary to makesure that the UHF sensor equipped in the system is a UHFmicrostrip sensor and make use of its portable and compactcharacteristics to continuously amplify the collected UHFsignal, and when it reaches 40 dB, the signal will be transmit-ted to the high-speed collection system. However, there aresafety hazards in this process, so to reduce the hazards andincrease the limiting function, the limiting circuit will becarefully investigated, especially the strong interference sig-nals such as switching signals that need to be paid specialattention to. The gain effect of the UHF amplifier involvedin this system is shown in Figure 7.
HFCT internal core material can have a large impact onthe frequency band of the module and even affect its fre-quency band range to some extent. The analysis of the com-mon materials around will lead to many experimentalconclusions and ideas to choose the most suitable materialfor the internal core. Ni-Zn ferrite is more stable and hasthe best response in response to the experimental analysisof the core frequency, and it has a high-frequency band. Inthis experiment, the NiZn ring with inner and outer diame-
ters and lengths of about 100mm was selected to do mea-surement practice using its characteristics, and it will befound from the experimental results to be highly sensitiveas HFCT. The current measurement range is from 0 to10A, and the frequency band measurement range is from1 to 40MHz, and the response is good.
The UHF wave frequency and range were combined inthe previous test, and the frequency band range was alsoconsidered in the AE sensor test. After debugging, it is pos-sible to systematically process the collected signals of multi-ple types, frequencies, and speeds and to use 8 or more pathsefficiently, quickly, and conveniently for signal upload at thesame time. The maximum value of the frequency is set to2.5M/s during the collection process to suit the performanceof the sensor. The system can be used to collect ultrasoundsignals and industrial frequency signals simultaneously in asegmented or continuous manner, as well as to determinethe location of the local discharge source and have a strongfunction for phase calculation.
To analyze the GIS localization signal by the combinedacoustic-electric method, the first step is to use UHF tech-nology to roughly locate the localization source andreceive both the high-frequency current and the AE sig-nals. By comparing and processing the obtained data, wecan effectively screen out the possible interference data inthe GIS site, to improve the accuracy of localization ofthe local discharge source and the accuracy of defect-type discrimination. Therefore, when the system startsthe analysis and processing operation, several UHF sensorsshould be equipped near the insulators of GIS equipment,and the appropriate number of AE sensors should beequipped on the outside of GIS equipment, and the HFCTmodule should be installed on the ground wire at the backof the cable. Finally, with the help of the local dischargeanalysis and processing equipment and high-speed oscillo-scope equipment, the local discharge signals around thesensors are collected and sorted out to ensure the smoothoperation of the local discharge source location and toaccurately identify the defect type and insulation degree,as shown in Figure 8.
0 2 4 6 8 10 12 14 16 18 20
–10
–5
0
5
10
Val
ues
Time
U=49.8kVU=0KV
Figure 6: Sensor response.
0 2 4 6 8 10 12 14 16 18 201520253035404550556065
Time
Val
ues
20
40
60
UFCUHC
Figure 7: UHF amplifier gain effect.
9Journal of Sensors

According to the UHF detection results, the signalamplitude of the UHF PRPS and PRPD patterns is very high,and the discharge phase is wide; both have typical character-istics of suspended potential discharge. From the ultrasonicdetection, the RMS and peak values of the continuous spec-trum grow very large compared with the background, andthe correlation between 50Hz and 100Hz is obvious, andthe 100Hz correlation is much larger than the 50Hz corre-lation, and the phase spectrum shows obvious two clusters,which has the typical characteristics of suspended potentialdischarge. According to the combined acoustic and electricalsignal mapping, the ultrasonic signal and the UHF signalhave a one-to-one correspondence in the working frequencycycle. The abnormal signal still exists during the live detec-tion and retesting of the phase gas chamber, and the soundand electricity are combined to locate, and the abnormal dis-charge position is inside the casing riser (transition tank).According to the above analysis, combined with the typicaldischarge characteristics of various types of defects and thestructure and installation characteristics of the HGIS, theinternal defects of the gas chamber are judged to have sus-pended potential discharge defects, accompanied by metalparticle discharge, according to the different characteristicsof the test data and the graphs, to determine the nature ofthe defects and establish the effectiveness of the jointacoustic-electric diagnosis. After collecting data and graphi-cal information on equipment anomalies, the purpose ofapplying the combined acoustic-electric detection means inpartial discharge charged inspection to practical operationis achieved through the analysis of detection means, andexperience is accumulated for future partial dischargecharged inspection work. Based on theoretical analysis of
the causes of equipment abnormalities, further accurate ver-ification is done in combination with the disintegration ofequipment, emphasizing the feasibility and sustainability ofcombined acoustic and electrical detection.
5. Conclusion
According to the requirements of online monitoring of GISequipment in acoustic emission stores, the overall design ofthe GIS local monitoring system based on ZigBee technologyis divided into three aspects, data acquisition, data transmis-sion, and data processing. And the hardware design andsoftware design in the three modules are introduced sepa-rately. The hardware design includes choosing CC2530 asthe ZigBee chip and GZ-GISSEN-01 digital UHF local areadischarge sensor as the sensor and designing their relatedcircuits, such as the power supply circuit, serial communica-tion circuit, and sensor circuit. The software design includesthe design of the terminal node and coordinator node. Andthe typical patterns are obtained by using the UHF methodand ultrasonic method for detection, and the characteristicsof each typical pattern are summarized. And various inter-ference signals were studied to obtain several interferencesignal profiles, and the type of interference signal was deter-mined by comparing the profile characteristics during thebackground noise test, and the corresponding shieldingmeasures were used to shield the interference source andimprove the accuracy of detection. Three examples of partialdischarge charged detection of field equipment wereselected, and the abovementioned GIS partial dischargecharged detection system was used for testing, and the test-ing process and processing scheme of partial discharge were
0.0 0.5 1.0 1.5 2.0 2.5 3.0 3.5 4.0 4.5 5.0 5.5 6.0–6–5–4–3–2–1
0123456
Val
ues
Posision
FitAct
(a)
0 1 2 3 4 5 6 7
–20
–10
0
10
20
Val
ues Posision
ActAct
ActFit
(b)
Figure 8: Phase detection results.
10 Journal of Sensors

analyzed, and the partial discharge source was identified andaccurately located, and the application in practical operationwas summarized to provide a reference basis for future elec-trical detection work.
Data Availability
The data used to support the findings of this study are avail-able from the corresponding author upon request.
Conflicts of Interest
The authors declare that they have no known competingfinancial interests or personal relationships that could haveappeared to influence the work reported in this paper.
References
[1] Y. Liu, X. Ma, L. Shu et al., “Internet of Things for noise map-ping in smart cities: state of the art and future directions,” IEEENetwork, vol. 34, no. 4, pp. 112–118, 2020.
[2] B. Sun, A. Zifarelli, H. Wu et al., “Mid-infrared quartz-enhanced photoacoustic sensor for ppb-level CO detection ina SF6 gas matrix exploiting a T-grooved quartz tuning fork,”Analytical Chemistry, vol. 92, no. 20, pp. 13922–13929, 2020.
[3] K. Saravanan, S. Aswini, and R. Kumar, “How to prevent mar-itime border collision for fisheries?-a design of real-time auto-matic identification system,” Earth Science Informatics, vol. 12,no. 2, pp. 241–252, 2019.
[4] Q. Khan, S. S. Refaat, H. Abu-Rub, and H. A. Toliyat, “Partialdischarge detection and diagnosis in gas insulated switchgear:state of the art,” IEEE Electrical Insulation Magazine, vol. 35,no. 4, pp. 16–33, 2019.
[5] H. Yang, S. Kumara, S. T. S. Bukkapatnam, and F. Tsung, “TheInternet of Things for smart manufacturing: a review,” IISETransactions, vol. 51, no. 11, pp. 1190–1216, 2019.
[6] F. Alías, R. M. Alsina-Pagès, F. Orga, and J. C. Socoró, “Detec-tion of anomalous noise events for real-time road-traffic noisemapping: the Dynamap’s project case study,” Noise Mapping,vol. 5, no. 1, pp. 71–85, 2018.
[7] S. Lu, H. Chai, A. Sahoo, and B. T. Phung, “Condition moni-toring based on partial discharge diagnostics using machinelearning methods: a comprehensive state-of-the-art review,”IEEE Transactions on Dielectrics and Electrical Insulation,vol. 27, no. 6, pp. 1861–1888, 2020.
[8] M. Mondal and G. B. Kumbhar, “Detection, measurement,and classification of partial discharge in a power transformer:methods, trends, and future research,” IETE Technical Review,vol. 35, no. 5, pp. 483–493, 2018.
[9] N. H. Talib, K. B. Hasnan, A. B. Nawawi, H. B. Abdullah, andA. M. Elewe, “Monitoring large-scale rail transit systems basedon an analytic hierarchy process/gradient-based cuckoo searchalgorithm (GBCS) scheme,” Urban Rail Transit, vol. 6, no. 2,pp. 132–144, 2020.
[10] B. Meyer, J. Y. Astic, P. Meyer et al., “Power transmission tech-nologies and solutions: the latest advances at RTE, the Frenchtransmission system operator,” IEEE Power and Energy Maga-zine, vol. 18, no. 2, pp. 43–52, 2020.
[11] X. Xiao-wei, “Study on the intelligent system of sports culturecenters by combining machine learning with big data,” Per-
sonal and Ubiquitous Computing, vol. 24, no. 1, pp. 151–163,2020.
[12] D. Liu, X. Leng, F. Wei, S. Zhang, and Y. Hong, “Visualizedlocalization and tracking of debris flow movement based oninfrasound monitoring,” Landslides, vol. 15, no. 5, pp. 879–893, 2018.
[13] A. Zrelli, “Simultaneous monitoring of temperature, pressure,and strain through Brillouin sensors and a hybrid BOT-DA/FBG for disasters detection systems,” IET Communica-tions, vol. 13, no. 18, pp. 3012–3019, 2019.
[14] M. V. Japitana, E. V. Palconit, A. T. Demetillo, M. E. C. Burce,E. B. Taboada, and M. L. S. Abundo, “Integrated technologiesfor low cost environmental monitoring in the water bodies ofthe Philippines: a review,” Nature Environment and PollutionTechnology, vol. 17, no. 4, pp. 1125–1137, 2018.
[15] W. C. Wu, J. Wang, and H. Y. Zhou, “Advanced electronic sci-ence and technology,” Recent Advances in Electrical & Elec-tronic Engineering (Formerly Recent Patents on Electrical &Electronic Engineering), vol. 11, no. 4, p. 378, 2018.
[16] Z. Pezeshki and S. A. S. Ivari, “Applications of BIM: a briefreview and future outline,” Archives of ComputationalMethods in Engineering, vol. 25, no. 2, pp. 273–312, 2018.
[17] N. R. Johnson, J. P. Lynch, and M. D. Collette, “Response andfatigue assessment of high speed aluminium hulls using short-term wireless hull monitoring,” Structure and InfrastructureEngineering, vol. 14, no. 5, pp. 634–651, 2018.
[18] S. Ahmad, M. Abdul Mujeebu, and M. A. Farooqi, “Energyharvesting from pavements and roadways: a comprehensivereview of technologies, materials, and challenges,” Interna-tional Journal of Energy Research, vol. 43, no. 6, pp. 1974–2015, 2019.
[19] Z. Wan and D. Zhu, “Smart decision-making systems for theprecise management of water environments,” Journal ofCoastal Research, vol. 104, no. sp1, pp. 82–87, 2020.
[20] L. Zhu, F. R. Yu, Y. Wang, B. Ning, and T. Tang, “Big data ana-lytics in intelligent transportation systems: a survey,” IEEETransactions on Intelligent Transportation Systems, vol. 20,no. 1, pp. 383–398, 2019.
[21] N. E. Ochoa Guevara, C. O. Díaz, M. Davila Sguerra et al.,“Towards the design and implementation of a smart city inBogotá, Colombia,” Revista Facultad de Ingeniería Universidadde Antioquia, vol. 93, no. 93, pp. 41–56, 2019.
11Journal of Sensors