design of a primary flight display (pfd) to avoid...
TRANSCRIPT

1
Design of a Primary Flight Display (PFD) to Avoid Controlled Flight into Stall
Abstract
Analysis of recent airliner accidents and incidents identified a class of events in which structurally,
mechanically, and electronically sound aircraft decelerated through the minimum safe operating speed for
the phase of flight to the stick-shaker stall speed. Each of these Controlled Flight into Stall occasions
involved a unique sequence of events that lead to an inappropriate automation response as the aircraft
decelerated through the minimum safe operating speed. Despite the differences in sequences of events, a
subset of the incidents and accidents had one thing in common – for different reasons, the automation was
no longer actively controlling to the airspeed target. The inappropriate automation responses were
“hidden” such that it was very difficult for the flight crew to intervene in a timely manner. This paper
describes the accident scenarios and the design of a modification to enhance the airspeed tape on the
Primary Flight Display to explicitly annunciate the absence of active speed control. An experiment to
evaluate the efficacy of the enhanced airspeed tape and the implications of these results for design and
certification of flight deck automation are discussed.
Introduction
In several recent accidents and incidents a structurally, mechanically, and electronically sound
commercial airliner decelerated through the minimum safe operating speed for the phase of flight all the
way to the stick-shaker stall speed [1]. The minimum safe operating speed is the low end of the speed
envelope that is set to 30% above the speed at which the onset of stall occurs.
Each of these “Controlled Flight into Stall (CFIS)” accidents and incidents followed a unique
sequence of events. However, the sequence of events exhibited a general pattern in which: (1) a triggering
event (e.g., sensor failure, and/or erroneous flight crew entry), resulted in (2) a mode change or change in
automation engagement status, that led to (3) an inappropriate automation command that in turn, (4)
resulted in a speed envelope violation.

2
Despite the differences in sequences of events, a subset of the incidents and accidents, shown in
Table 1, had one thing in common – for different reasons, the automation was no longer actively
controlling to the airspeed target. Either the automation was no longer engaged, or the automation was
engaged but the control mode was not actively controlling to the airspeed target.
In each of these cases, the timely intervention by the flight crew may have been hindered by: 1)
changes in the automation states that were not explicitly annunciated on the flight deck, and 2) the
deceleration resulting from the inappropriate automation commands was masked by an appropriate
deceleration for the current trajectory maneuver.
TABLE 1: CFIS accidents when the automation was no longer actively controlling airspeed
Accidents and Incidents Maneuver Effects of Triggering Events on
Automation
AAL 903
(May 12, 1997)
Decelerating entering a
holding pattern at FL160
Automation no longer engaged for speed
control
Automation no longer engaged for speed
control
Automation no longer engaged for speed
control
Automation no longer engaged for speed
control
Automation no longer engaged for speed
control
Automation no longer engaged for speed
control
ThomsonFly, Bournemouth
(Sept 23, 2007)
ThompsonFly, Belfast
ThomsonFly, not specified
Decelerating on approach
Midwest 490
(May 12, 2005)
Climb
JetStar 248
(Sept 7, 2014)
Decelerating on approach
Air France 447
(June 1, 2009)
Cruise (Coffin Corner)
AirAsia 8501
Dec 28, 2014)
Cruise (coffin Corner)
OZ 214 (dormant mode)
(July 6, 2013)
Decelerating on approach Automation engaged, but no active speed
control. A/T in “dormant” mode
TK 1951 (fixed thrust mode)
(feb 25, 2009)
Decelerating on approach Automation engaged, but speed not actively
controlled. A/T transitions to “fixed thrust”
mode.
Provincial Airlines
Climb Incompatible mode for energy management
3
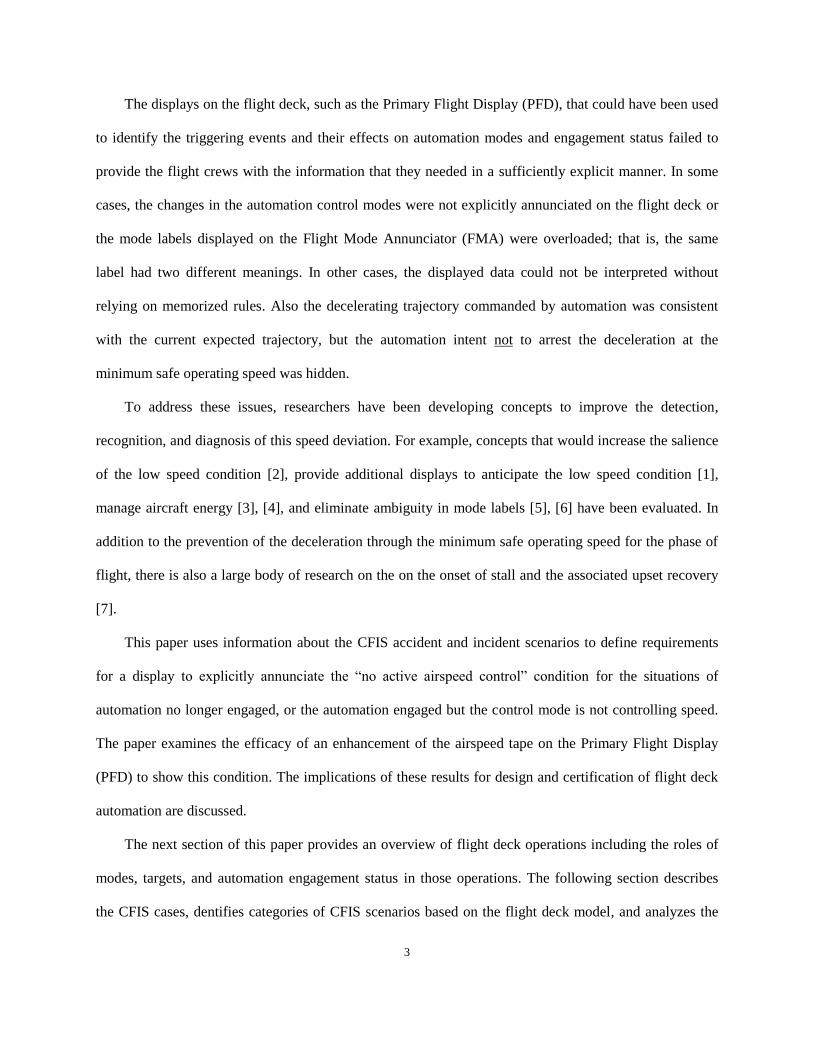
The displays on the flight deck, such as the Primary Flight Display (PFD), that could have been used
to identify the triggering events and their effects on automation modes and engagement status failed to
provide the flight crews with the information that they needed in a sufficiently explicit manner. In some
cases, the changes in the automation control modes were not explicitly annunciated on the flight deck or
the mode labels displayed on the Flight Mode Annunciator (FMA) were overloaded; that is, the same
label had two different meanings. In other cases, the displayed data could not be interpreted without
relying on memorized rules. Also the decelerating trajectory commanded by automation was consistent
with the current expected trajectory, but the automation intent not to arrest the deceleration at the
minimum safe operating speed was hidden.
To address these issues, researchers have been developing concepts to improve the detection,
recognition, and diagnosis of this speed deviation. For example, concepts that would increase the salience
of the low speed condition [2], provide additional displays to anticipate the low speed condition [1],
manage aircraft energy [3], [4], and eliminate ambiguity in mode labels [5], [6] have been evaluated. In
addition to the prevention of the deceleration through the minimum safe operating speed for the phase of
flight, there is also a large body of research on the on the onset of stall and the associated upset recovery
[7].
This paper uses information about the CFIS accident and incident scenarios to define requirements
for a display to explicitly annunciate the “no active airspeed control” condition for the situations of
automation no longer engaged, or the automation engaged but the control mode is not controlling speed.
The paper examines the efficacy of an enhancement of the airspeed tape on the Primary Flight Display
(PFD) to show this condition. The implications of these results for design and certification of flight deck
automation are discussed.
The next section of this paper provides an overview of flight deck operations including the roles of
modes, targets, and automation engagement status in those operations. The following section describes
the CFIS cases, dentifies categories of CFIS scenarios based on the flight deck model, and analyzes the
4
Human Computer Interaction (HCI) required to intervene in CFIS events. The next section describes
requirements for the explicit annunciation of information on the flight deck, a design of a proposed
integrated target display that meets those requirements, and an experiment to evaluate the design. Finally,
the implications for design and certification are discussed in the conclusion.
The concepts described in this paper are applicable to all “glass cockpit” aircraft configured with an
autothrottle, independent of manufacturer. The terminology used in this paper is intended to be generic
and be easy to map to the specific functions found in the automation from each of the manufacturers.
Overview of Flight Deck Operations
The “flight deck system,” composed of the flight crew and the flight deck automation and it’s input
devices, is responsible for the execution of the flight plan. The capabilities of flight deck automation have
grown organically throughout the history of aviation from: (i) stability augmentation for stick, rudder, and
throttle inputs, to (ii) direct trajectory control from flight crew selected targets and modes by an Autopilot
and Autothrottle, to (iii) optimum trajectory derivation and control from a flight plan entered into a Flight
Management Computer (FMC) through the Flight Management Vertical and Latera1 Navigation
functions.
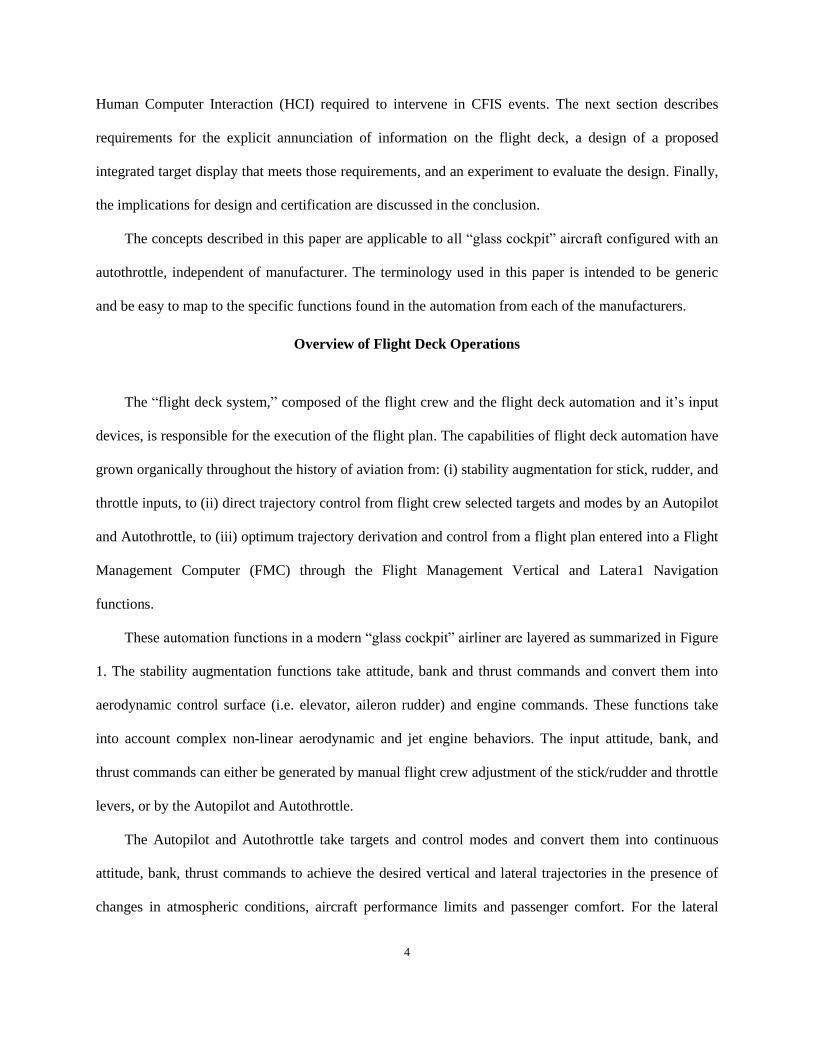
These automation functions in a modern “glass cockpit” airliner are layered as summarized in Figure
1. The stability augmentation functions take attitude, bank and thrust commands and convert them into
aerodynamic control surface (i.e. elevator, aileron rudder) and engine commands. These functions take
into account complex non-linear aerodynamic and jet engine behaviors. The input attitude, bank, and
thrust commands can either be generated by manual flight crew adjustment of the stick/rudder and throttle
levers, or by the Autopilot and Autothrottle.
The Autopilot and Autothrottle take targets and control modes and convert them into continuous
attitude, bank, thrust commands to achieve the desired vertical and lateral trajectories in the presence of
changes in atmospheric conditions, aircraft performance limits and passenger comfort. For the lateral
5
trajectory, the targets are the course/heading between waypoints. The control modes include
heading/course capture and hold. For the vertical trajectory, the targets are combinations of altitude, speed
and rate-of-climb/descent targets. The control modes determine the trade-off of kinetic and potential
energy to maintain within safe operating regime and for passenger comfort to achieve the targets. The
modes include altitude hold, altitude capture, airmass climb/descent, fixed rate climb/descent, path
descent, etc.
The vertical and lateral targets and control modes are either generated by flight crew manual
selection on the Mode Control panel (MCP), or by the automated selection by the Vertical Navigation
FIGURE 1: The flight deck can be configured for 12 combinations of engagement status of LNAV,
VNAV, A/P, and A/T.
FMS/VNAV (Mode Logic)
FMS/LNAV (Mode Logic)
VNAV Targets/Modes
Autothrottle(Mode Logic & Control
Laws)
MCP Targets/Modes VNAV Engaged
LNAV Engaged
LNAV Targets/ Modes
Autopilot (Mode Logic & Control
Laws)
100 200 010 23000 040A/TARM
COURSE IAS/MACH VNAV HEADING LNAV ALTITUDE VETY SPEEDA/P ENGAGE
CMD A CMD BCOURSE
N1 SPEED LVL CHG HDG SEL APP ALT HOLD V/S
VOR/LOC
----
CWS A CWS B
A/P OFF
A/TOFF
Elevator Commands
Throttle Commands
AutothrottleEngagedAutopilot
Engaged
Engine ControlsStab Aug
(Spd Prot)
Elevator Commands Thrust Commands
Aircraft Control Surfaces and Propulsion
Stability Augmentation
Manual Control
Stab Aug (No Spd
Prot)
EngineElevator
Engine Commands
Rudder/Ailerons
Aileron/Rudder Commands
Elevator, Aileron Commands
Autopilot/ AutothrottleControl
Flight Management Computer
180
160
140
120
140
155
150
145
143
140
135
4100137
THR IDLE DES NAV AP11FD2A/THR
12 13 14 15 16
155
-
-
-
-
-
-
-
-
-
-
-
-
Flightplan

6
function (labelled VNAV) and lateral Navigation function based on the flight plan entered in the Flight
Management Computer (FMC).
Automation Configuration and Engagement Status
The layered architecture of the flight deck automation requires the flight crew to configure the
automation to “couple” the correct automation function to the control surfaces and engine. The
automation is designed with four conceptual “switches” to configure the automation. These are shown as
two-pole switches in Figure 1. The Autopilot (A/P) and Autothrottle (A/T) switches determine whether
manual commands (from stick and throttles) are commanding the aircraft trajectory or whether the
commands are from the Autopilot and Autothrottle.
The Vertical Navigation (VNAV) and Lateral Navigation (LNAV) switches determine whether the
targets and control strategies are selected by the flight crew via the MCP, or are derived from the flight
plan programmed into the FMC.
This automation architecture enables combinations of engagement status. For example, LNAV can
be engaged to provide automated FMC control of the lateral flight plan, while VNAV is not engaged
allowing the flight crew to select altitude, airspeed, and rate of climb/descent targets and control modes.
All told, there are twelve (12) combinations of LNAV, VNAV, A/P and A/T engagement status that can
be selected by the flight crew when the automation is controlling at least one parameter. As a result, there
are circumstances when the engagement status may not result in active airspeed control.
Control Modes and Targets
Each maneuver required to complete the flight plan involves a change in the energy-state of the
aircraft. When the automation is engaged, control of the energy states is achieved by applying a
combination of control strategies, instantiated in automation “modes,” that are directed towards achieving
specified targets for airspeed, altitude, rate-of-climb/descent, and course/heading.
To maintain a safe energy state, the trajectory is restricted during each maneuver by the current
energy state of the aircraft, the aircraft’s performance limits, and passenger comfort limits. Unlike the
7
lateral trajectory that has a single parameter to control (roll), the vertical trajectory requires the
coordination of both pitch and thrust. There are several maneuvers in which airspeed is the indirect
outcome of control to a flight path using a fixed thrust setting. As a result, there are circumstances in
which the airspeed is not directly actively controlled by the automation even when the automation is
engaged.
Monitoring Engagement Status, Control Modes, and Targets
For the flight crew, the primary source of information on aircraft energy-state is the Primary Flight
Display (PFD). The modern “glass” PFD is an integrated version of the federated “steam gauge” displays
used in older aircraft that used one gauge for each parameter. Information about the automation function
engagement status, targets, and modes has been layered into the PFD. Many of the features of the PFD
were designed prior to the evolution of the automation and were not explicitly designed to support tasks
associated with monitoring complex automation for inappropriate commands.
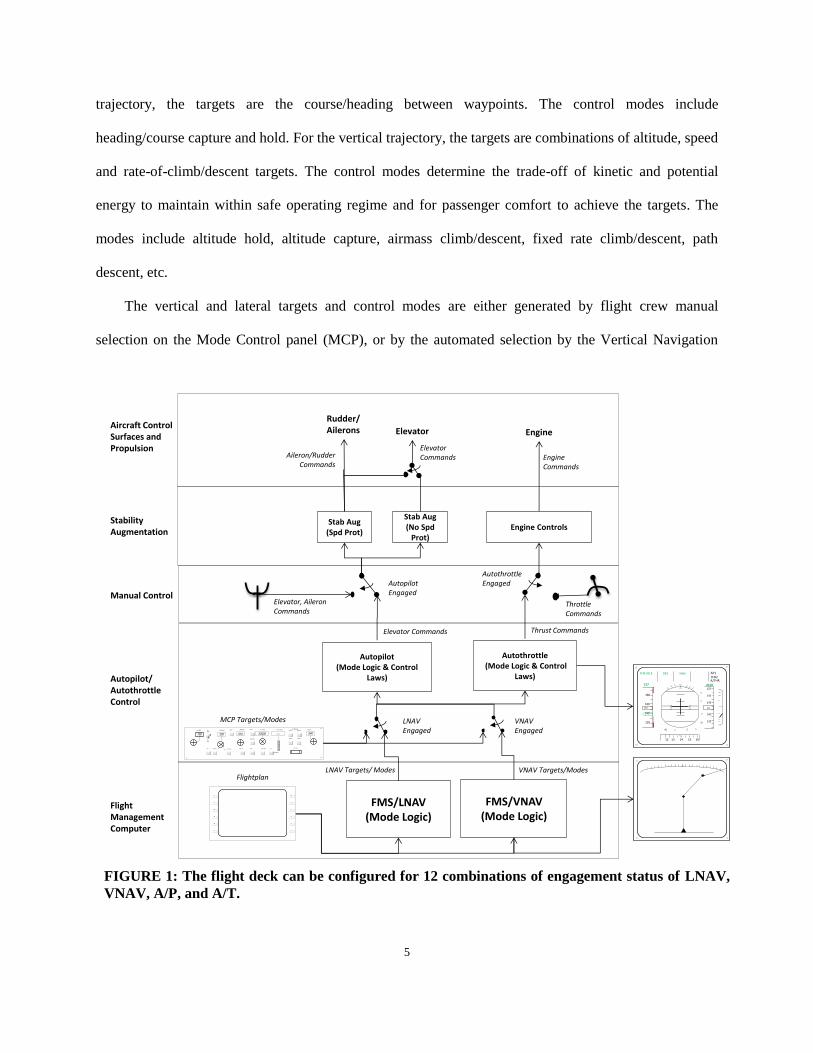
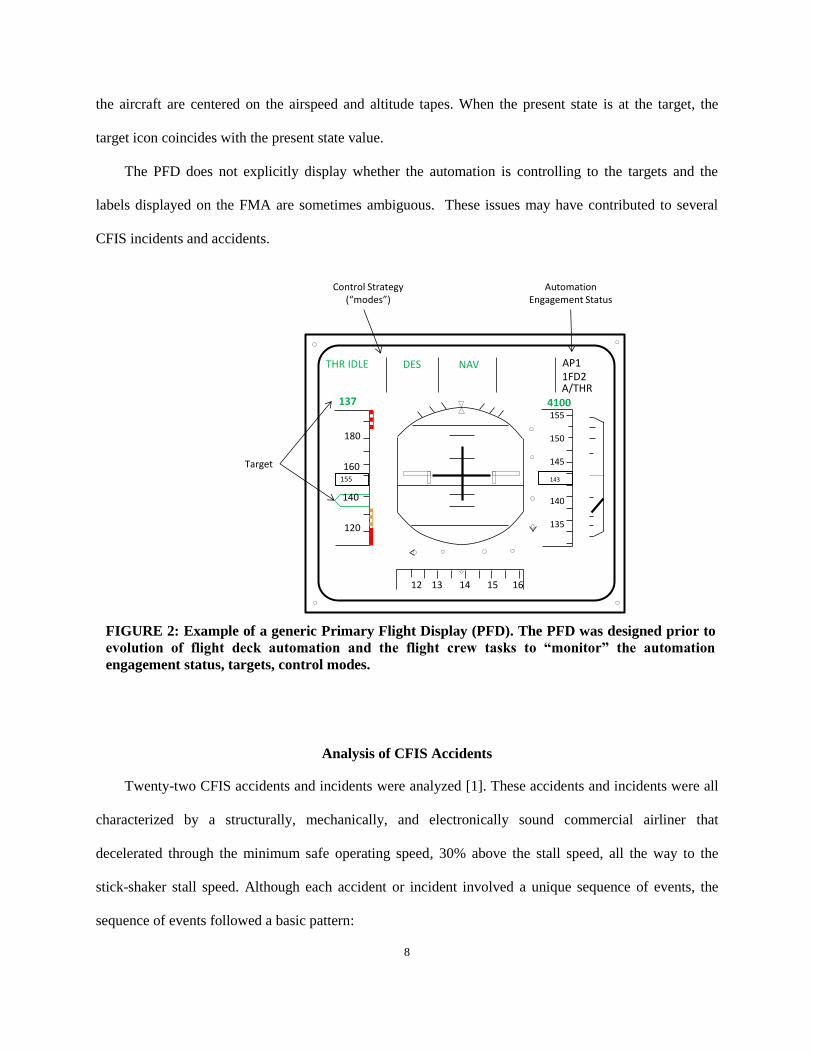
The PFD, see Figure 2, is organized as follows. The center section of the display is an attitude
indicator (AI). The top of the AI has a bank indicator. To the left of the AI is an airspeed tape. To the
right of the AI is the altitude tape and vertical speed indicator. Below the AI is a partial compass rose that
displays the aircraft heading. Above the AI is the Flight Mode Annunciator (FMA).
The actual airspeed, altitude, and vertical speed are displayed along with their associated targets on
the airspeed, altitude and vertical speed tapes. In addition, the airspeed tape displays information on the
speed envelope. “Barber poles” --striped bars -- indicate regions outside of the safe energy state for the
aircraft. For up-and-away operations the minimum safe operating speed is set at 30% above the stall
speed, creating a buffer zone between the lowest speed and the speed at which stall occurs. The 1.3VStall
zone is represented by a yellow barber pole. The unsafe VStall at which point stick sharer occurs is
represented by a red barber pole.
The numerical altitude and speed targets are shown above the tapes. When a target is within the
scaling of the tape, it is represented on the tape by a target icon. The values indicating the present state of
8
the aircraft are centered on the airspeed and altitude tapes. When the present state is at the target, the
target icon coincides with the present state value.
The PFD does not explicitly display whether the automation is controlling to the targets and the
labels displayed on the FMA are sometimes ambiguous. These issues may have contributed to several
CFIS incidents and accidents.
Analysis of CFIS Accidents
Twenty-two CFIS accidents and incidents were analyzed [1]. These accidents and incidents were all
characterized by a structurally, mechanically, and electronically sound commercial airliner that
decelerated through the minimum safe operating speed, 30% above the stall speed, all the way to the
stick-shaker stall speed. Although each accident or incident involved a unique sequence of events, the
sequence of events followed a basic pattern:
FIGURE 2: Example of a generic Primary Flight Display (PFD). The PFD was designed prior to
evolution of flight deck automation and the flight crew tasks to “monitor” the automation
engagement status, targets, control modes.
180
160
140
120
140
155
150
145
143
140
135
4100137
THR IDLE DES NAV AP11FD2A/THR
12 13 14 15 16
155
Automation Engagement Status
Control Strategy (“modes”)
Target

9
1. a triggering event (e.g., sensor discrepancy and/or flight crew entry), led to
2. a mode change or change in automation engagement status, that led to
3. an inappropriate command which resulted in
4. a speed envelope violation
In each of these cases, the flight crew was not able to intervene in a timely manner. In all of these
events, the aircraft trajectory associated with the inappropriate automation commands, such as an
inappropriate deceleration, was not detected or recognized by the flight crew because it was masked by an
appropriate trajectory. For example decelerating to a maximum endurance holding speed or decelerating
to the reference landing speed.
Furthermore, the cues identifying the triggering events and their effect on automation modes and
engagement status did not lead to detection, recognition, or diagnosis because they were not explicitly
annunciated. In some cases, interpreting the available data required inferences based on memorized rules.
In other cases, mode labels had multiple meanings.
A further detailed analysis of a subset of the CFIS accidents not related to changes in aerodynamic
properties of the aircraft (e.g. icing) or errors in computation of the aircraft airspeed envelope (e.g. angle
of attack discrepancy), revealed a set of accidents in which the automation was no longer actively
controlling to the airspeed target. Specifically, (1) the automation was no longer engaged for airspeed
control (i.e. the automation was no longer coupled to the control surface and/or engines), or (2) the
automation was engaged, but transitioned to a control mode that does not control to the airspeed target.
No Active Speed Control: Automation Not Engaged
In several cases, the automation autonomously disengaged, no longer coupling the automation
commands to the control surfaces and engines (Table 1). The American Airlines (AAL) 903 incident is an
example of this scenario. AAL 903 was instructed to hold at 16,000’ due to a weather cell on the arrival
procedure. The aircraft decelerated and leveled-off as it made the turn into the holding pattern. During
this period, with the A/T commanding idle thrust, the A/T disengaged. Without the A/T coupled to the

10
engines, and the thrust at idle, the aircraft decelerated well below the minimum safe operating speed and
reached the onset of stall.
No Active Speed Control: Automation Engaged, but Control Mode does not Actively Control Speed
(Inappropriate Mode)
In several cases, the effect on the automation of the triggering events was to cause a transition to a
control mode that did not directly control airspeed (Table 1).
The Turkish Airlines (TK) 1951 accident is an example of this situation. The aircraft was vectored
for an instrument approach that resulted in a late localizer capture and subsequent clearance to descend.
This left the aircraft fast and above the glideslope. After receiving a clearance to land, the flight crew
instructed the automation to descend to recapture the glideslope from above and to decelerate to the
landing speed. When the aircraft reached 2000’ above the ground, a malfunctioning radio altimeter
indicated to the flight deck automation that the aircraft had landed. This caused the Autothrottle to
transition to the RETARD mode. In this mode, the throttles are locked at the idle position and do not
control airspeed. In this way the aircraft decelerated through the minimum safe operating speed (1.3
VStall) all the way to the stick shaker stall speed. The incorrect radio altimeter value was shown on the
Captain’s display. However, the First Officer was flying the approach and his radio altimeter was
functioning properly and displaying the correct altitude, which agreed with the barometric altimeter.
Another example is the Asiana Air 214 (OZ 214) accident. This flight was vectored for a visual
approach at 14 nm to the runway at an altitude that left the aircraft above the desired three-degree
glideslope. At 5nm to the runway, the aircraft remained well above the desired glide path. In an attempt to
increase the airplane's descent rate and capture the desired glide path, the flight crew selected the flight
level change [FLCH SPD] autopilot mode. Instead of a descent, the mode selection resulted in the
autoflight system initiating a climb because the airplane was below the previously selected Go Around
altitude. The flight crew disconnected the A/P and moved the thrust levers to idle. This action signaled the
A/T to transition to a “dormant mode” in which the A/T does not directly control airspeed, but allows the
11
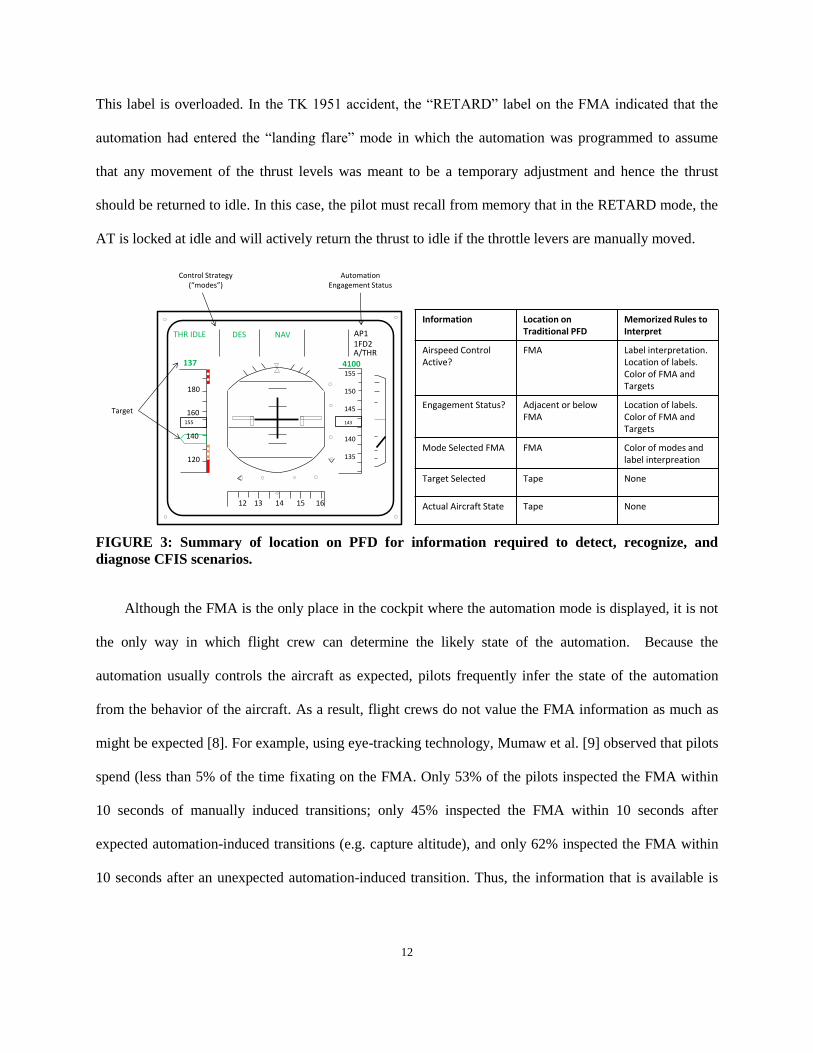
flight crew to manually adjust the flight trajectory by setting the thrust. In this configuration, the aircraft
decelerated well through the minimum safe operating speed almost reaching the onset of stall.
To intervene in these scenarios, the flight crew must detect, recognize and diagnose the CFIS
situation by obtaining data from a variety of sources, integrating the data into a coherent whole, and
relying on memorized rules to extract meaning from the result. The information required to detect,
recognize and diagnose the two scenarios described above is distributed across the PFD.
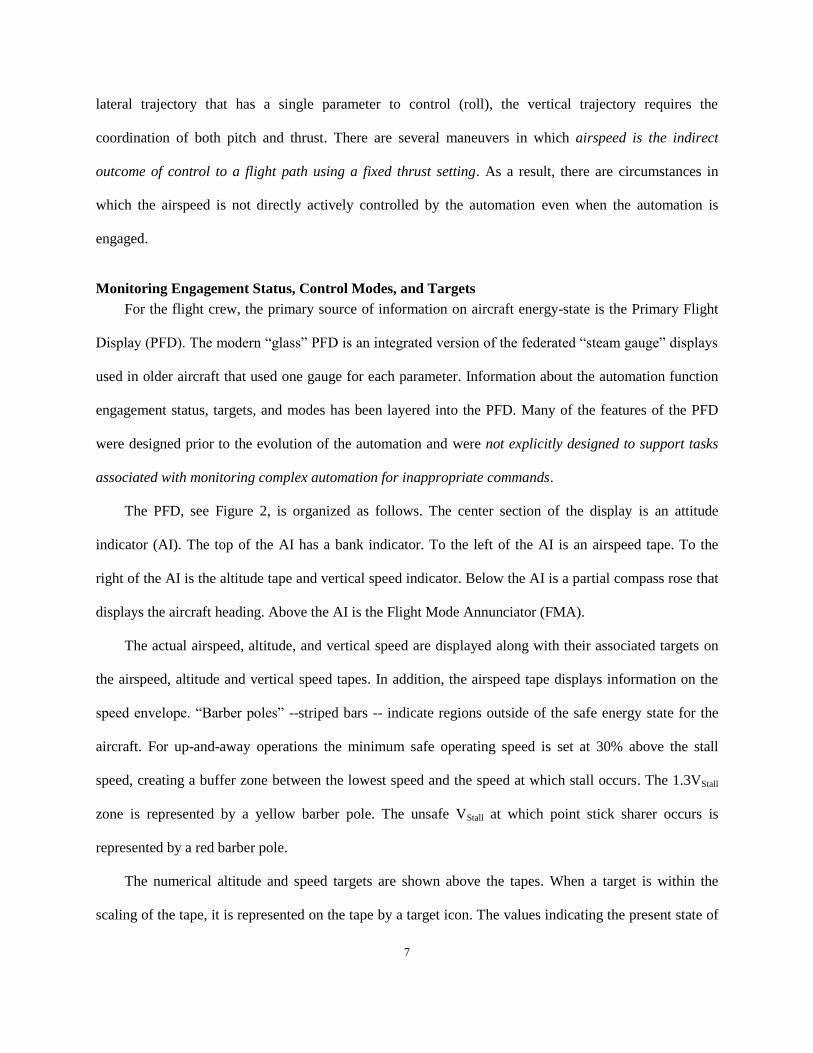
Human Computer Interaction Required for CFIS Intervention
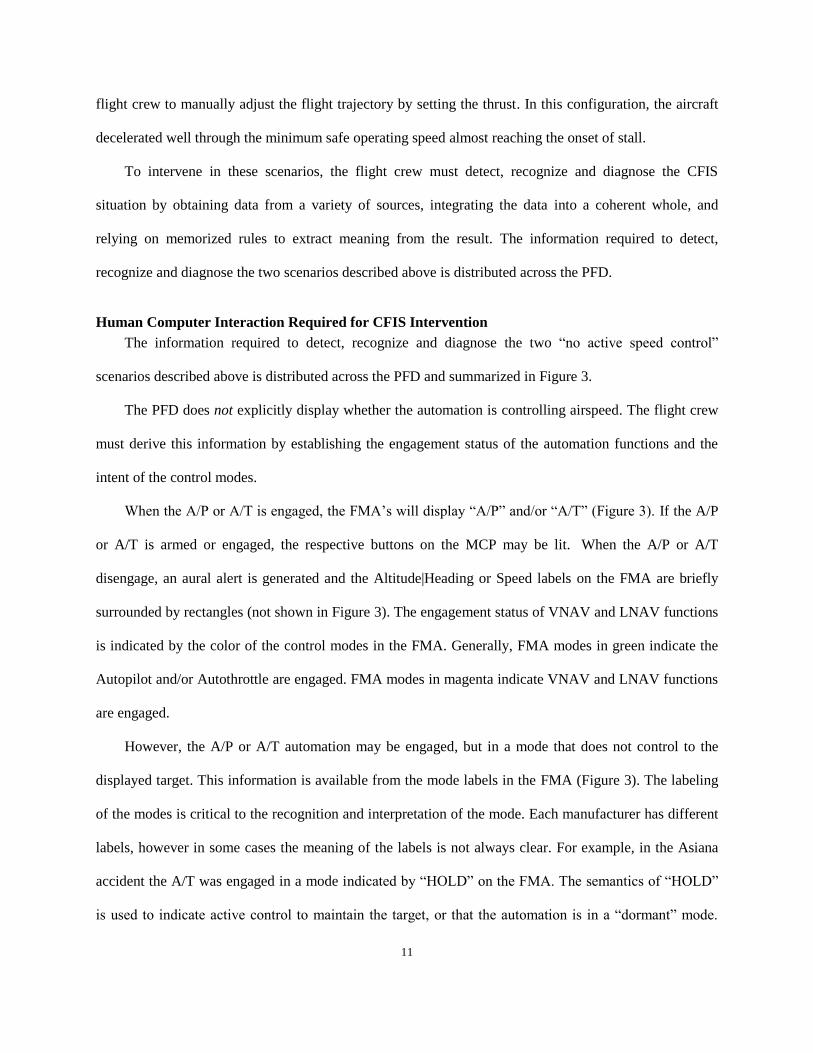
The information required to detect, recognize and diagnose the two “no active speed control”
scenarios described above is distributed across the PFD and summarized in Figure 3.
The PFD does not explicitly display whether the automation is controlling airspeed. The flight crew
must derive this information by establishing the engagement status of the automation functions and the
intent of the control modes.
When the A/P or A/T is engaged, the FMA’s will display “A/P” and/or “A/T” (Figure 3). If the A/P
or A/T is armed or engaged, the respective buttons on the MCP may be lit. When the A/P or A/T
disengage, an aural alert is generated and the Altitude|Heading or Speed labels on the FMA are briefly
surrounded by rectangles (not shown in Figure 3). The engagement status of VNAV and LNAV functions
is indicated by the color of the control modes in the FMA. Generally, FMA modes in green indicate the
Autopilot and/or Autothrottle are engaged. FMA modes in magenta indicate VNAV and LNAV functions
are engaged.
However, the A/P or A/T automation may be engaged, but in a mode that does not control to the
displayed target. This information is available from the mode labels in the FMA (Figure 3). The labeling
of the modes is critical to the recognition and interpretation of the mode. Each manufacturer has different
labels, however in some cases the meaning of the labels is not always clear. For example, in the Asiana
accident the A/T was engaged in a mode indicated by “HOLD” on the FMA. The semantics of “HOLD”
is used to indicate active control to maintain the target, or that the automation is in a “dormant” mode.
12
This label is overloaded. In the TK 1951 accident, the “RETARD” label on the FMA indicated that the
automation had entered the “landing flare” mode in which the automation was programmed to assume
that any movement of the thrust levels was meant to be a temporary adjustment and hence the thrust
should be returned to idle. In this case, the pilot must recall from memory that in the RETARD mode, the
AT is locked at idle and will actively return the thrust to idle if the throttle levers are manually moved.
FIGURE 3: Summary of location on PFD for information required to detect, recognize, and
diagnose CFIS scenarios.
Although the FMA is the only place in the cockpit where the automation mode is displayed, it is not
the only way in which flight crew can determine the likely state of the automation. Because the
automation usually controls the aircraft as expected, pilots frequently infer the state of the automation
from the behavior of the aircraft. As a result, flight crews do not value the FMA information as much as
might be expected [8]. For example, using eye-tracking technology, Mumaw et al. [9] observed that pilots
spend (less than 5% of the time fixating on the FMA. Only 53% of the pilots inspected the FMA within
10 seconds of manually induced transitions; only 45% inspected the FMA within 10 seconds after
expected automation-induced transitions (e.g. capture altitude), and only 62% inspected the FMA within
10 seconds after an unexpected automation-induced transition. Thus, the information that is available is
180
160
140
120
140
155
150
145
143
140
135
4100137
THR IDLE DES NAV AP11FD2A/THR
12 13 14 15 16
155
Automation Engagement Status
Control Strategy (“modes”)
Target
Information Location on Traditional PFD
Memorized Rules to Interpret
Airspeed Control Active?
FMA Label interpretation.Location of labels.Color of FMA and Targets
Engagement Status? Adjacent or below FMA
Location of labels.Color of FMA and Targets
Mode Selected FMA FMA Color of modes and label interpreation
Target Selected Tape None
Actual Aircraft State Tape None

13
frequently not perceived. By increasing the salience of critical information on the PFD, the likelihood
that it will be noticed and used can be greatly increased.
Design and Testing of an Enhanced PFD Airspeed Tape
By increasing the salience of critical automation information, the ability of the flight crew to detect,
recognize, and diagnose the CFIS scenario prior to a speed deviation may be enhanced. The display
should explicitly indicate in a salient and unambiguous manner, without the need for memorized rules,
whether; (1) airspeed is being controlled and (2) if so, to what target.
The standard integrated airspeed tape display has three graphic icons whose shapes and colors are
manipulated: (1) the numerical airspeed target, (2) the target pointer, known as the “bug”, and (3) the
current airspeed display. An enhanced airspeed tape display is proposed to provide this information in one
TABLE 2: Design of a PFD Airspeed Tape to Identify CFIS Scenarios
Automation Configuration and Control Mode
Scenario:
Normal Ops
Scenario:
A/P or A/T disconnect
Scenario:
Control Mode does not
Control Airspeed
Airspeed Target
Source
MCP VNAV MCP VNAV MCP VNAV
A/P and/or A/T
Engaged
Engaged Engaged No Longer
Engaged
No Longer
Engaged
Engaged Engaged
Control Mode
controls speed
Control Mode selected does
control Airspeed
Airspeed not controlled. Control Mode selected
does not control airspeed
PFD Speed Tape
Numerical
Airspeed Target
Green Magenta Green with
White X
Magenta
with White
X
Green with
Green X
Magenta
with
Magenta X
Target Pointer Green Magenta Green with
White X
Magenta
with White
X
Green with
Green X
Magenta
with
Magenta X

14
location without requiring the use of memorized rules. The following description provides one example of
a display that would meet these requirements. Of course, alternate symbology, color schemes, etc. could
be used. The design for the enhanced PFD airspeed tape is summarized in Table 2 and illustrated in
Figure 4. In normal operation, with the targets generated from the MCP, with the Autopilot and/or
Autothrottle engaged, and the selected control mode actively controlling airspeed, the numerical target
and bug are green. With the same situation with targets generated from VNAV, the numerical targets and
bug are magenta.
When airspeed is not actively being controlled, the numeric target and the bug are displayed with
FIGURE 4: Enhanced PFD Airspeed tape with explicit indication of the absence of airspeed due to
engagement status or control model
Speed Control is active
GS 132
200
220132
180
160
120
140
100
GS 132
200
220
180
160
120
140
100
GS 132
200
220132
180
160
120
140
100
132
GS 132
200
220132
180
160
120
140
100
Speed Control is not active
159 159 159 160159
GS 132
200
220132
180
160
120
140
100
160159
GS 132
200
220132
180
160
120
140
100
160159XX
XX
XX
XX
Speed Control Active Speed Control not Active
A/P and A/T Engaged A/P or A/T notEngaged
A/P or A/T Engaged A/P or A/T notEngaged
A/P or A/TEngaged
VNAV not Engaged VNAV Engaged VNAV not Engaged VNAV Engaged
Mode controlling to Airspeed - Mode not controlling to Airspeed
- Mode not controlling to Airspeed

15
attention grabbing crosses indicating the target is not being controlled. The reason for the absence of
airspeed control is explained by the color of the crosses. White crosses indicate that the Autopilot and/or
the Autothrottle are no longer engaged. When the Autopilot and/or the Autothrottle are engaged, but the
selected control mode is not actively controlling airspeed (e.g. “dormant” mode, “land” mode), the
crosses are green for MCP targets and magenta for VNAV targets. These colors are consistent with the
colors used in all displays on the flight deck.
With this proposed design, the flight crew can answer the three CFIS questions with a single glance
at the airspeed tape.
Method
Mauro & Trippe [10] designed and ran a human-in-the-loop experiment to evaluate this design.
Airline pilots currently flying Boeing aircraft were recruited to participate in an online study comparing a
traditional PFD design (used in the Boeing 777) and an enhanced PFD designed to alert the pilot when
airspeed or altitude was not being controlled by the autoflight system.
Participating pilots were seated at a laptop computer and shown a series of flight scenarios composed
of a set of still frame “slides” on their computer screens. For each flight scenario, they were first shown a
brief written description of the scenario along with ATC-like instructions in italics that described what
would happen in the upcoming slides. For example, “Inbound to KJFK RWY 31R; maintain 1900 feet;
heading 285 to intercept the localizer; cleared ILS RWY 31R.” If the scenario placed the pilot’s aircraft
on an approach, the participants were also shown an approach plate with the approximate vertical and
lateral position of the aircraft indicated.
After the description slide, there were 3 or 4 slides depicting the aircraft’s PFD at advancing time
points in the flight. As soon as the final PFD slide in the scenario appeared the pilots were instructed to
indicate whether or not there was a deviation from the intended airspeed and/or flight path by pressing the
"y" key for “yes, there is a problem” or the "n" key for “no, there is no problem” as fast as possible
16
without making mistakes. The pilot’s reaction time from the time that the last slide was presented until a
key was pressed was recorded.
Twelve scenarios depicted a normal operation and 12 scenarios depicted a problem. Reaction time
was used to determine whether the enhancements to the PFD would have any effects because reaction
times are more sensitive measures of performance than error rates. Half of the scenarios depicted a
traditional Boeing PFD and half depicted an enhanced Boeing PFD. The scenarios that were presented on
each type of PFD were counterbalanced across the participants. The order of presentation, traditional PFD
first or enhanced PFD first, was also counterbalanced.
Two sets of 12 situations were produced, set “A” and set “B.” For each situation, two versions were
constructed. One depicted the situation progressing normally. The other depicted a deviation from the
intended airspeed or flight path. Each pilot viewed all 24 situations with 6 situations from each set
depicting a normal flight and 6 depicting a deviation. For half of the pilots, set A scenarios were depicted
on a traditional PFD and set B scenarios were depicted on an enhanced PFD. For the other half of the
pilots, the relation between sets and PFD type were reversed. The order of presentation, traditional PFD
first or enhanced PFD first, was counterbalanced. Prior to being shown the enhanced PFD scenarios, the
enhancements were described to the pilots and they were shown 4 practice scenarios.
Results
Thirty-one pilots participated in the experiment. Twelve were active Boeing 777 pilots; 12 were
active Boeing 737 pilots; seven were Boeing 747, 757, or 767 pilots. The pilots reported having
between 4,000 and 25,000 hours of flight time (Mean: 11,733; SD: 4,740).
As might be expected given the design and the experience level of the pilots, the pilots made very
few errors. here were no differences in the proportion of correct responses due to the type of PFD.
Traditional PFD: 10.8%, Enhanced PFD: 8.9%; X2(1)=0.703, n.s.
For 17 experiment scenarios out of 24, there were no differences in the speed of responses due to the
type of PFD. One scenario was incorrectly presented. To stabilize the distributions for analysis, reaction
17
times were converted into Ln(Speed)=Ln((1/Reaction Time)*10000). For 6 scenarios there was a
statistically significant difference. In all of these cases, pilots were faster to respond when the
scenario was presented using the enhanced PFD with Mean React Time difference: 10.013 s; Mean
Standard Deviation difference: 6.044 s. In all of these cases, pilots were faster to respond when the
scenario was presented using the enhanced PFD.
Discussion
To determine whether the modifications to the PFD would have any effects, reaction time, a measure
that is much more sensitive than error rates was used. On most scenarios the participants were equally fast
at responding to the scenarios on either type of PFD. However, whenever there was a statistically reliable
difference in speed of response, pilots were faster to respond correctly when they were using the
enhanced PFD whether or not there was a problem. This pattern of results indicates that the modifications
caused no problems and caused a measurable increase in performance.
The PFD modifications used in this study were designed to rely solely on relatively minor software
changes to existing PFD designs. Although, it may be possible to achieve increased performance from
other more elaborate modifications, our aim was to devise simple modifications that could be retrofitted
to existing equipment at relatively minor development, certification, and implementation costs.
In this study, there was no attempt to load the pilots or to distract them with mechanical failures or
operational issues of the sorts that populate accident reports. All that the pilots were required to do was to
view the PFD and determine whether the display indicated that there was a deviation from the expected
altitude or airspeed target. As would be expected, the participants, all of whom were experienced pilots,
made very few errors reading their PFDs. Had many errors been observed, the fidelity of the study would
have to be questioned. Experienced pilots do not make many errors on such routine tasks.
To be confident in the effectiveness of the modifications that we developed, the enhanced PFD used
here should be compared to traditional PFDs in a flight simulator using pilots flying scenarios that tax the
pilots’ abilities as they are frequently taxed in actual operations and abnormal situations. If the enhanced

18
PFD continues to demonstrate superior performance compared to traditional PFDs under these conditions,
we would have greater confidence in the wisdom of making the investments required to develop, certify,
and modify the PFD in existing airliners.
Conclusion
This paper describes the results of an analysis of CFIS events and the associated Human-Computer
Interaction for the flight crew task of intervention in the CFIS scenarios. The analysis determined that in
many CFIS events the automation failed to actively control to the airspeed target. There were two causes:
(1) the automation was not coupled, and (2) the control mode for speed control did not directly control
airspeed.
The analysis of the flight deck cues needed for the flight crew to detect, recognize and diagnose
these scenarios revealed that the data needed to determine if airspeed control to the target is active is not
explicitly annunciated. Further, the information required to diagnose the causes is located in different
locations on the PFD, and memorized rules are required to interpret these data. In this way, the PFD is not
designed to explicitly support the flight crew in performing this task.
Requirements for a flight deck display to support the CFIS intervention task without memorized
rules were derived. An example of a new enhanced airspeed tape to explicitly identify whether airspeed
control is active, the control strategy (mode), and the automation configuration is described. An
experiment to evaluate the efficacy of the enhanced PFD demonstrated that the enhanced display was
superior to the traditional display in ever situation in which a difference was observed.
Problem of Evolving Functionality without Evolving Displays
The modern “glass” PFD is an integrated version of the federated “steam gauge” displays. Data
on the gauges for airspeed, horizontal situation, bank, altitude, rate-of-climb/descent, and heading were
consolidated onto a single digital display. This was supplemented by adding flight mode annunciation,
localizer and glideslope deviation displays, tuned navaids, and radio altimeter information. In this way the

19
“glass” PFD is designed to support the flight crew tasks that were performed by the steam gauges and
other federated displays.
The features of the PFD were, however, designed prior to the evolution of the automation and
may not adequately support new tasks required by the automation including monitoring of automation for
rare unexpected events.
Designing a “Safety Barrier” to Controlled Flight into Stall
The unique sequence of events that lead to CFIS accidents and incidents indicate that it may not be
feasible to apriori design automation in which speed control is always active. A catch-all approach is to
assess the changed role of the flight crew monitoring the automation and performing intervention tasks.
During the design, the safety analyses, methods such as Fault Tree Analyses (FTA) and Failure
Mode Effects Analysis (FMEA), should explicitly address conditions related to situations when airspeed
is intentionally not actively controlled. These situations are not always failure conditions. In the case of
CFIS accidents and incidents for example, a structurally, mechanically, and electronically sound aircraft
decelerated through the minimum safe operating speed (1.3 VStall) to the stick-shaker stall speed.
Certification checklists for new functions could be supplemented with the following checks of
intended function and displays. In particular to ensure that the not active control state does not occur, and
if does occur, that is unambiguously annunciated.
Intended Function
(1) Does the new function include modes that control aircraft trajectory?
(2) If yes, do any of these modes (or mode combinations) result in a situation where energy-state,
lateral trajectory, or vertical trajectory is not actively controlled?
(3) If yes, can it be shown that for the finite set of combinations of conditions that may occur, that the
automation does not result in a situation where energy-state, lateral trajectory, or vertical
trajectory is not actively controlled?

20
Displays
(1) Do the displays explicitly annunciate an automation mode selection that does not actively control
aircraft trajectory resulting in any of the following hazards: loss of safe energy-state, collision
with terrain or obstacles, or collision with traffic?
(2) Do the displays explicitly annunciate the causes of not actively control aircraft trajectory
(coupling, mode, target, command) resulting in any of the following hazards: loss of safe energy-
state, collision with terrain or obstacles, or collision with traffic?
References
[1] Sherry, L. R. Mauro (2014) Controlled Flight into Stall (CFIS): Functional Complexity Failures
and Automation Surprises. 2014 Integrated Communications Navigation and Surveillance (ICNS)
Conference, April 8-10, 2014
[2] ARAC Recommendation (2013) ASHWG Draft Report – Low Airspeed Alerting Phase 2 Task
(Retrofit Applications) – Revision A. Avionics System Harmonization Working Group (ASHWG).
Tasking Notice 77 FR 11844 (March 3, 2011)
[3] Williams, D.H. R. M. Oseguera-Lohr, and E. T. Lewis (2011) Energy Navigation: Simulation
Evaluation and Benefit Analysis. Langley Research Center, Hampton, Virginia. NASA/TP-2011-217167
[4] Kaneshige, J.T., S. Shivanjli L. Martin, S. Lozito, V. Dulchinos, (2014) Flight-Deck
Strategies and Outcomes When Flying Schedule-Matching Descents. AIAA Guidance, Navigation,
and Control Conference; 19-22 Aug. 2013; Boston, MA; United States
[5] Feary, M., D. McCrobie, M. Alkin, L. Sherry, P. Polson, E. Palmer, N. McQuinn (1998) Aiding
Vertical Guidance Understanding. NASA/TMm1998-112217
[6] Adam, G., J. Condette (2013) Study on Aeroplane State Awareness during Go-Around. Bureau
d’Enquetes et d’ Analyses pour a securite de l’aviation civile. Zone Sud – 2000 Rue d’paris, Aeroport du
Bourget, 93352 L Bourget, Cedex, France
[7] IATA (2015) Guidance Material and Best Practices for the Implementation of Upset Prevention
and Recovery Training. International Air Transport Association. Montreal—Geneva.
[8] Huettig, G., Anders G., and Tautz, A. (1999): Mode Awareness in a modern glass cockpit
attention allocation to mode information. In Jensen R. (Eds): Proceedings of the 1999 Ohio State
University Aviation Psychology Conference. Dayton, OH: Ohio State University.
[9] Mumaw, R.J., Sarter, N.B., and Wickens, C.D. (2001): Analysis of Pilots´ Monitoring and
Performance on an Automated Flight Deck. 11th International Symposium in Aviation Psychology.
Columbus: Ohio State University.
[10] Mauro, R., J. Trippe (2016) Functional Complexity Failures and Automation Surprises. In
Proceedings of the 2016 International Symposium of Aviation Psychology. Dayton, Ohio, 2016.

21
Acknowledgements