design memorar>.'dum a publication prepared lulder … · alabama river design...
TRANSCRIPT

WILLIAM "BILL" DANNELLY RESERVOIR
ALABAMA RIVER
DESIGN MEMORAr>.'DUM
THE MASTER PLAN
APPENDIX D - FISH MANAGEMENT PLAN
A publication prepared lUlder terms of a contract researchproject between the Corps of Engineers, Mobile District and theAgTicultural Experiment Station of Auburn University, Auburn,Alabama. The departments of Agricultural Economics and RuralSociology and Fisheries and Allied Aquacultures were responsiblefor the research and development of this report.
Auburn University staff members with major responsibilitiesfor the research and development of this report were David R.Bayne, Carolyn Carr, Wm. Dumas Ill, J. D. Grogan, John M.Lawrence, David Rouse, Karen Snowden, Glenn Stanford, DavidThrasher, Charles J. Turner, and J. Homer Blackstone asproject leader.
U. S. ARMY ENGINEER DISTRICT, MOBILECORPS OF ENGINEERS
MOBILE, ALABAMA
July 1974

TABLE OF CONTENTS
Text
Subject Page1. Introduction.....•.••..•.......•....•................••...•... 1
A. Pill"P0Se 1
B. Master plan o •••••••••••••••••••••••••••• 1
C. Fish management.. . . . . . . . . . . . •. . . . . . . . . . . . . . . . . . . . . . . . . .. 1
D. Classification of the fishery o. • • • • • •• 1
2. Physical Characteristics of the Aquatic Habitat that Influence FishProduction and Harvest 2
A. Genel"al " " " " " "" 2
B. Drainage area ." " "................................... 2
1. Topography ..... 0 • 0 • • • • • • • • • • • • • • • • • • • • • • • • • • • • • • • • •• 2
2. Area................................................ 3
3. Land usage .......••................................• 3
4. Rainfall patterns ..................................•.. 4
5. RlIDOff rates "................................. 6
6. Stream regulation 0 •••••••••••••••••••••• 0 • • • • • • • • • • •• 6
C. Impoundment •........................................... 11
1. Morphometry •...•.•..•.............................• 11
2. Altitude o ••••••••••••••••••••••••••• 12
3. Area 0 •• 12
4. Mean depth .....•...................•..............•. 12
i

5. Maximum depth ..................................•• 12
6. Productive-depth zone 12
7. Volume of the euphotic strata ......................•. 13
8. Length of shoreline ............•........•..•..•.. 0 • • 13
9. Eulittoral zone 14
10. I:nflo\v ..............•.............................. 14
11, Outflow ..............................•...•.. 0 0 • • • • • 14
12. Retention time ......•............................•• 14
13. Internal flow currents .........................•..... 15
14. Penstock depth .....••............................•• 15
3.
15. Water-level fluctuation
16. Uncleared flooded areas
17. Meterological influence
Water Quality in Relation to Fish Production •.........•.•.....
16
16
17
20
A. General 0 20
B. Water quality constituents .......................•....•.. 20
1, Temperature ......•.............•..........•......• 20
a. stratification in lake ................•............ 21
b. Condition in tailwaters 21
2. Dissolved oxygen .•............•...............•...• 22
a. stratification in lake •.....•...................... 24
b. Condition in tailwaters .•.....•................... 25
ii

3. pH. . . .. . .. .. . . . . . .. . . . . . . . . . .. . .. .. . .. . .. .. 25
4. Carbon dioxide and alkalinity. .. . .. . .. . . . . . . .. . . . .. 26
5. Chemical type. .. . .. . . . .. . .. . .. .. . .. .. .. . . .. .. . . . . . 28
6. Plant nntrients 29
a. Nutrient enrichment in impoundments 29
b. Macro-nutrients (C, H, 0, N, P, S, K, Mg, Ca, Na) . . 31
c. Micro-nutrients (Fe, Mn, Cu, Zn, Mo, V, B, Cl, Co). 34
d. Nutrient sources 34
7. Toxic substances 36
a. Pesticides. .. .. . .. . . . .. . .. .. . .. . . . .. . .. . .. .. 37
b. Heavy metals " .. 40
c. Industrial toxicants . . . . . . . . . . . . . . . . . . . . . . . . . . . . . . . . 40
Pollution sourcesC.
8. Sediment load 44
45
4. Aquatic Plants in the Impoundment 55
A. Definition of aquatic plants 55
B.
C.
Factors affecting aquatic plant growth
Aquatic plant groups and their habitat
55
56
1. Bacteria. . . . . . . . . . . . . . . . . . . . . . . . . . . . . . . . . . . . . . . . . . . . . . 56
2. Fungi................................................. 57
3. Algae................................................. 57
4. Flowering plants.. . . . .. . .. . .. ... .. .. .. . . .. . . .. . .. . . 59
D. Plant popnlations in the lake and methods for control 64
iii

5. Description of the Fishery 72
A.
B.
C.
D.
Warm-water species
Cold-water species
Species downstream from the lake
Rare and endangered species
72
81
81
81
E. Fish-food organisms ......................•................ 81
F. History of parasite and disease outbreaks 84
G. History of fish kills ..•.••...........••...•................. 85
H. Flooding schedule and establishment of the fishery ..... " . •. ... 95
I. History of species composition, relative abnndance, and condition within each species including methods used to obtain fish
samples .................................•................ 96
1. Methods of sampling fish populations 97
a. Rotenone sampling 97
b. Electrofishing " " .. . 99
2. Fish popnlation sPJdies (Rotenone) 101
3. Fish population studies (Electrofishing) 106
4. Comparisons of relative conditions (Knl .. . . . . .. .. . . .. .. . .. 112
J.
K.
Fishing pressure
Creel census data
113
114
6. MANAGEMENT OF THE FISHERY ............................... 115
A. Reservoir fishery biology 115
1. Factors affecting fish reproduction .... . . . . . . . . . . . . . . • . . .. 116
iv

a. Adequacy of spawning area 117
b. Water fluctuation 117
c. Water temperature 117
d. Silt-laden waters 117
e.
f.
g.
h.
Repressive factor
Size of brood fish .
Food availability during period of egg-formation
Crowding
118
118
118
120
i. Egg-eating habit 120
j. Reproductive success of prey upon which predatorsfeed after reaching fingerling stage 120
k. Strength of predation upon young predator species. . . . . 120
2. Predator-prey relationships 121
B.
C.
Risume of factors affecting fish production in reservoirs
Information vs. action
127
130
1.
2.
Public relations
Fishing access .......................................
131
132
3. Fishing intensity 134
4. Creel limits 134
5.
6.
Evaluation of fishery management changes
Fishing tournaments and rodeos
135
135
D. Creel census evaluations
v
137

7. Coordination with Other Agencies .........•................... 138
A. Personnel and funding 138
B.
C.
Cost-benefit projections
Equipment for biologist
139
140
D. Job description - Fisheries Management Biologist ..•....... 141
E. Budget
8. Research Needs for River and Impoundment Management
143
144
9. Synopsis ••.........•....................................... 148
vi

TABLES
Table
1. Normal monthly and annual precipitation in inches, Alabama RiverBasin above Millers Ferry Dam.
2. Areas of standing timber on Dannelly Reservoir, located by rivermile (using the September, 1972, edition of Alabama River Navigation Charts).
3. Average concentrations of macro-nutrients (elements) in filteredwater, suspended matter, bottom soils, rooted plants, and fishfrom Dannelly Reservoir.
4. Average concentrations of micro-nutrients (elements) in filteredwater, suspended matter, bottom soils, rooted plants, and fishfrom Dannelly Reservoir.
5. Average concentrations of pesticide residues in fish collectedfrom Dannelly Reservoir, 1971.
6. Average concentrations (ppm, wet weight) of pesticide residues invarious species of fish collected form the Alabama River comparedwith the overall average from species collected in all rivers inAlabama, 1971.
7. Average concentrations of pesticide residues in fish collected fromthe Cahaba River at u. S. Highway 80, 1972.
8. Average concentrations (ppm, wet weight) of pesticide residues invarious species of fish collected from public fishing lake locatedin the Dannelly Reservoir drainage area, compared with averagesin species from all 23 public fishing lakes in Alabama, 1971.
9. A Vel' age concentrations of heavy metal elements in filteredwater, suspended matter, bottom soils, rooted plants, and fishfrom Dannelly Reservoir.
10. Coosa River waste sources.
11. Tallapoosa River waste sources.
12. Cahaba River waste sources.
vii
5
18
33
35
38
39
41
42
43
46
49
51

TABLES (cont'd.)
Table
13. Waste sources on the Alabama River above MillersFerry Lock and Dam.
14. List of phytoplankton genera collected from DannellyReservoir in 1973.
15. List of flowering aquatic weeds in the Alabama River,Summer, 1973.
53
60
63
16. Areas on Dannelly Reservoir infested with rooted aquatic weedslocated by river miles indicated in the September, 1972,edition of Alabama River Navigation Charts. 67
17. A check list of warm-water species believed to be present inthe Alabama River, separated into game, commercial,and miscellaneous groupings. 73
18. Macroinvertebrates collected from Dannelly Reservoir,Summer, 1972.
19. Fish parasites in the Alabama River.
20. Viral, bacterial, and fungal diseases of reservoir fish.
21. Fish population data collected by rotenone sampling of theAlabama River in the vicinity of Holley Ferry (August,1954).
22. Length (in inches) used to classify fish of different speciesas young, intermediate, or harvestable, and as forage,carnivorous, or other.
23. Total sights, in given time period, of various groups offish in the electrofishing field at selected sites onWilliam "Bill" Dannelly Reservoir in 1972.
83
86
93
102
105
107
24. Averaged sights-per-minute of various groups of fish ohtainedby electrofishing at selected sites on Dannelly Reservoir, '72-73. 110
25. Reproductive characteristics of variolls species of fresh-waterfish. 119
26. Maximum sizes of forage fishes largemouth bass of a given
inch-group can swallow~
viii123

FIGURES
Figure
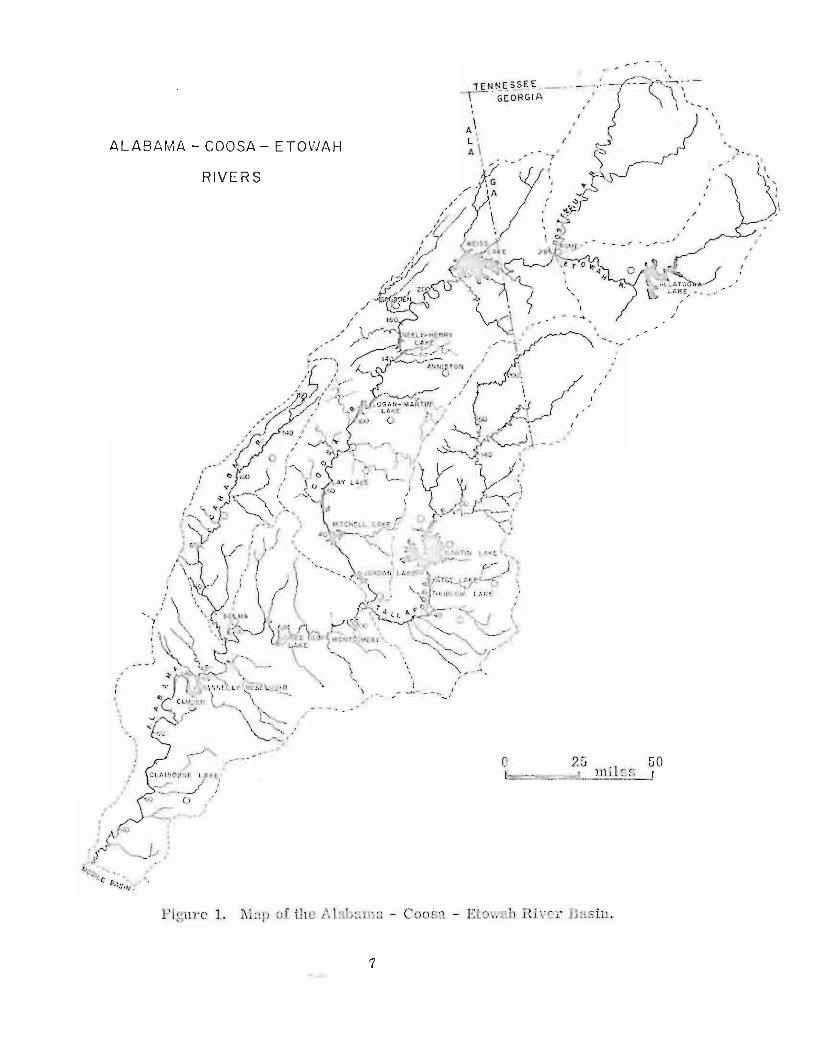
1. Map of the Alabama-Coosa-Etowah River Basin.
2. Profile of tbe Alabama-Coosa-Etowah Rivers.
3. Oxygen content of water and its relation to fish.
4. Relationship of pH of reservoir waters to theirsuitability for fish production.
5. Relationship and determination of CO?, HC03 •C0
3--. and OH- in natural waters. -
6. Distribution of 1;1 factor for various sizes of fivegroups of fish collected from Dannelly Reservoir.
ix
Page
7
8
23
26 a
27
111

Fish Management Planfor
William "Bill" Dannelly Reservoir
1. Introduction.
I-A. Purpose. This report on the fishery management of Dannelly Reservoir
presents a plan to preserve all species of fish within the impoundment, to increase
the production of harvestable-size fish through the improvement of the aquatic
habitat, and to provide the most favorable lake conditions for public fishing.
I-B. Master plan. The fish management plan will be a part of the approved
Master Plan for the continued development and management of Dannelly Reservoir.
I-C. Fish management. Fish management (Appendix D) will be in accordance
with ER 1130-2-400, APP.A (May, 1971); ER 1120-2-400; ER 1120-2-401; AR-
420-74; Fish and Wildlife Coordination Act of 1958 (PL 85-624) as amended; and
Federal Water Projects Recreation Act of 1965 (PL 89- 72).
I-D. Classification of the fishery. The fishes in Dannelly Reservoir have been
classified as warm-water sport, commercial, and miscellaneous species. They are
to be managed to provide the public with the maximum sustained yield of harvestable
sizes of sport and commercial species and to insure the continued existence of the
miscellaneous species.

2. Physical Characteristics of the Aquatic Habitat that Influence Fish Productionand Harvest.
2-A. General. Aquatic habitats are as numerous as the waters themselves.
Rising in mountains, hills, or plains, small streams meander through the country-
side uniting with one another to form larger streams and eventually a river. Each
change in size and shape forms a new habitat with a new set of environmental
conditions and a different assemblage of aquatic organisms. These new habitats,
however, are never independent of upstream influence. The same is true of man-
made impoundments on rivers. Morphometric features of the impoundment will, to
a great eA1:ent, determine the types of aquatic habitats, but environmental conditions
in the lake will largely depend on the quality and quantity of collecti ve waters from
the drainage area. The physical features of Dannelly Reservoir and its associated
drainage area are presented in this section of the report.
2-B. Drainage area.
2-B-l. Topography. The headwaters of the Alabama Ri vel' rise on the
southwestern slope of the Blue Ridge Mountains of Northwest Georgia. These
mountains have elevations approaching 4,000 feet msl with well-defined narrow
valleys. As the tributaries flow out of the mountainous areas and combine they
form the Etowab and the Oostanaula Rivers. These rivers flow mostly through the
Valley and Ridge Soil Province. These ridges have elevations approaching 2,000
feet IDsl and the valleys are relati vely 'vide and fertile. This region is characterized
by closely intermixed limestone, dolomite, sandstone, and shale soils. 111e Etowah
and Oostanmlla Rivers unite at Rome, Georgia, to form the Coosa River, which
2

then flows through the Valley and Ridge Province to near Childersburg, Alabama.
Between Childersburg and its mouth, the Coosa River flows through the southern
tip of the Piedmont Soil Province.
The Tallapoosa Ri vel' tributary to the Alabama River rises in the Piedmont
Soil Province in Northwest Georgia and flows southwesterly through this formation
to its mouth just south of Wetumpka. This is a region of hills and valleys.
The Alabama River is formed by the union of the Coosa and Tallapoosa Rivers
some 6 miles southwest of Wetumpka, Alabama. For the entire reach of Jones
Bluff Lake the Alabama River flows through the Loam Hills Region of the Coastal
Plain Province. These rolling plains have hills which may reach elevations of 400
feet msl.
From Jones Bluff Dam to Millers Ferry Dam, a distance of 105 river miles,
the Alabama River flows through the Black Belt soil region. In this area heavy
colloidal clay surface soils are underlain mostly by Selma Chalk. The topography
is rolling with a maximum elevation of 200 feet msl.
2-B-2. Area. The total drainage area above the Millers Ferry Lock and
Dam is 20,700 square miles.
2-B-3. Land Usage. Prior to World War II the Alabama-Coosa-Tallapoosa
River drainage had a relatively large rural population that engaged in extensive
row-crop farming. Some of this farming occurred on marginal hilly lands. This
caused extensi ve gully erosion in the Piedmont Province, which resulted in annual
sediment loads as gTeat as 200 tons per square mile. Lands in both the Valley and
3
Ridge and Coastal Plain Provinces were generally less subject to gully erosion and
the annual sediment load was only some 10 to 20 percent of that for the Piedmont.
During and following World War II the decline in rural population allowed the
land to revert to forest or be converted into pastures. By 1970 the cover on this
drainage area was approximately 55 percent forest and 35 percent pasture and crop
lands. The remaining 10 percent was occupied by residential, business, industrial,
transportation, and hydroelectric facilities. This river development and change
in land use has drastically reduced the sediment load on most upstream portions of
the river system. Gravel dredging in the Coosa River below Wetumpka, Alabama,
and erosion in Bouldin Dam canal during periods of heavy generation are two notable
exceptions to the low sediment loading in the upper reach of the Alabama River.
Land usage immediately adjacent to Dannelly Reservoir consists mainly of forest
and pasture farming operations plus municipal, industrial, and transportation
developments.
2-B-4. Rainfall Patterns. The Alabama River drainage area is in a
region of fairly heavy rainfall. There is seasonal variation, with about 41 percent
of the precipitation occurring during the wet period (January through April) and only
about 17 percent occurring during the dry period (September through November).
The highest annual rainfall recorded in the basin was 104.03 inches at flat Top,
Georgia, in 1949 and the lowest was 22.0 inches at Primrose Farm, Alabama, in
1954. The normal monthly and annual precipitation throughout the basin above
Millers Ferry Lock and Dam is shown in Table 1.
4

Table 1. Normal monthly and annual precipitation in inches, Alabama River Basinabove Millers Ferry Dam. *
Alabama River Entire Basinabove above
Millers Ferry Dam Millers Ferry Dam
January 4.6 5.2
February 5.0 5.4
March 6.2 6.2
April 5.1 4.9
May 3.7 3.8
June 4.0 4.1
July 5.4 5.2
August 4.5 4.3
September 3.4 3.4
October 2.4 2.6
November 3.3 3.7
December 5.1 5.1
Annual 52.7 53.9
*Based on 1967 normals published by the Weather Bureau.
5

Flood-producing storms may occur over the Alabama-Coosa-Tallapoosa basin
at any time during the year, but they are more frequent in winter and early spring.
Major winter storms are usually of the frontal type and summer storms are of the
convectional type.
2-B-5o Runoff Rates. Due to abundant rainfall throughout the drainage
area and to narrowness of the basin (110 miles maximum width), the Alabama
River has been subject to extensive flooding. For example, a flood stage of 62.7
feet with a discharge of 322,000 cfs was recorded at Montgomery on April 1, 1886.
Since the construction of dams on the Etowah, Coosa, and Tallapoosa Rivers the
maximum flood of record at Montgomery was 60.65 feet on February 27, 1961,
with a discharge of 283,000 cfs. The minimum discharge at this point was 2,180
cfs on November 24, 1941. The average discharge of the Alabama River at Mont
gomery is 23, 290 cfs and the annual runoff for this drainage area is approximately
21 inches. The average discharge for Millers Ferry Dam is 30,275 cfs.
2-B-6. stream Regulation. The Alabama River drainage area and stream
profile are shown in Figures 1 and 2. The northernmost headwaters of tllis system
are the Etowah and Oostanaula Rivers and their tributaries which rise in the Blue
Ridge Mountains of Northwest Georgia. Near Cartersville, Georgia, the Etowah
River is impounded by Allatoona Dam, forming Allatoona Lake with a surface area
of 11, 860 acres and a maximum depth approaching 150 feet. This impoundment
is designed to prOVide flood control for 1,110 square nliles of the Etowah River
drainage area. Unfortunately, due to the depth of the lake and the location of the
6
I,
,,,
.,
,
,I
/
,,-"'"' - - -,,
-,.'
50mile~
,,
,,,/
25:::ztL.
-, '-..
"ENNESM~ --,~-
~. GEORGIA "
" '
--,...-~-,, :
)" ,.--CL~~?
'60 0,,-,
_r~-_'~---~
y,,,,,,
RIVERS
":,,,,,:
,,
,,,,•,
ALABAMA - COOSA - ETOWAH
.,,,,
Figure L Map of the Alabama - Coosa - Etowah River Basin.
7

I«;;0f--w
w I-' « en"- en cr0 0 Wcr 0 >"- U cr
I«::;:«en«-'«
8 0~ ~
gN. ~ •- ."E.•
II~
X·"j"-,-J+---t---t---+--H3S~i .j!~J ~itjJ--+-r----t--j----+---J ~
11"('[ij?i,;cif·----1I---t----t--+-+---1~ ~
YI
Figure 2. Profile of the Alabama - Coosa - Etowah Rivers.
8

penstock openings, the water released during the late swnmer and fall season
generally has too little oxygen for fish production.
The Oostanaula River is formed by the union of the Conasauga and Coosawattee
Rivers near Calhoun, Georgia. The Conasauga is a free-flowing stream draining
some 682 square miles in Georgia and TeJmessee, while the Coosawattee is to be
impounded by Carter Dam near Carters, Georgia. The dam will provide flood
control for about 530 square miles of the Coosawattee drainage area.
The Etowah and Oostanaula Rivers flow together at Rome, Georgia, to form
the Coosa Rivero The combined drainage area at the confluence is approximately
3,930 square miles. The average flow of the Coosa River at Rome is 6,408 cfs.
At Coosa River mile 226 near Leesburg, Alabama, is the site of Alabama
Power Company's Weiss Dam. Weiss Lake, which has a surface area of 30,200
acres at elevation 564 feet msl, was flooded in 1961. The drainage area above
the dam contains 5,273 square miles. This project is used for both flood control
and hydropower.
Alabama Power Company's Neely-Henry Dam is located at Coosa River mile
147.6 near Ragland, Alabama. The lake, which has a sill'face area of 11,200 acres
at elevation 508 feet msl, was flooded in 1966. The drainage area above this dam
is 6,610 square mileso
The site of Alabama Power Company's Logan-Martin Dam is downstream at
river mile 98.2 near Vincent. The lake, formed in 1964, has a surface area of
18,219 acres at elevation 465 feet ms!. The drainage area above this dam is
approximately 7, 700 square miles.
9

Lay Dam is located further downstream at river mile 51.3 near Clanton. Lay
Lake, which was raised in 1968, has a surface area of 12, 000 acres at elevation
396 feet ms1. The drainage area above this dam is approximately 9,087 square
miles.
The next structure downstream is Mitchell Dam at Coosa River mile 37.5
near Verbena. Lake Mitchell has a surface area of 5, 850 acres at elevation 312
feet ms1. The drainage area above the dam contains 9,827 square miles.
Jordan Dam, another Alabama Power Company project, is located at Coosa
River mile 18.4 near Wetumpka. The lake has a surface area of 5,500 acres at
elevation 252 feet msl. The drainage area above Jordan Dam contains 10,165
sqnare miles.
The Coosa and the Tallapoosa Rivers flow together some 18 miles below Jordan
Dam to form the Alabama River. The Tallapoosa River drainage lies immediately
to the southeast of the Coosa River basin. While the headwaters of the Tallapoosa
drain mountainous terrain, the hills are not as high nor as steep as those of the
Blue Ridge Mountains. Despite this fact, the runoff rate from this drainage area
is still high.
Alabama Power Company's Martin Dam is at Tallapoosa River mile 62 near
Dadeville. Lake Martin, which was flooded in 1926, has an area of 40, 000 acres
at elevation 490 feet ms1. The drainage area above the dam contains 3,000 square
miles.
10

Yates Dam is some 9 miles downstream at river mile 53. This impoundment,
which is a pondage area, has a surface area of 2, 000 acres at elevation 344 feet
msl. The drainage area above the dam is 3,250 square miles.
Thnrlow Dam is located at Tallapoosa River mile 50. This is the second
pondage imponndment below Martin Dam and has a surface area of 574 acres at
elevation 288.8 feet msl. The drainage area above this dam is 3,300 square miles.
At Alabama River mile 245.4 is Jones Bluff Lock and Dam. This uppermost
Corps of Engineers' impoundment on the Alabama River has a surface area of
12,300 acres at elevation 125 feet msl. The drainage area above Jones Bluff Dam
is 16,300 square miles.
2-C. Impoundment. The physical characteristics of an inundated basin have
a considerable influence on the production of fish in the subsequent impoundmeut.
The physical features of Dannelly Reservoir which influence the production and
harvest of fish are described below.
2-C-1. Morphometry. Dannelly Reservoir is primarily a rlIn-of-the
river impoundment that overflowed the first and second flood plains for a few miles
above the dam. Throughout this reach of the river the banks are 40 to 60 feet high.
The river wonld be considered moderately meandering throughout the entire length
of the lake.
In the 105 miles between Jones Bluff Lock and Dam and Millers Ferry Lock
and Dam there are numerous flooded tributaries, some of which are listed on the
next page.
11

Mulberry CreekCahaba RiverBig Swamp Creek (Dallas COlUlty)Gees CreekBogue Chitto CreekChilahatchee CreekFoster CreekMill Creek
Big Swamp Creek (Lowndes COlUlty)Soapstone CreekSixmile CreekBig Cedar CreekWhiteoak CreekRlUll CreekPine Barren Creek
2-C-2. Altitude. The elevation of Dannelly Reservoir at maximllll1 power
pool is 80 feet msl. The elevation of the plains surrounding the lake varies from
arolUld 100 to 300 feet msl.
2-C-3. Area. The maximum power pool (80 feet msl) surface area of
Dannelly Reservoir is 17,200 acres. At the drawdown elevation of 79 feet msl the
surface area is 16,300 acres. The reservoir at maximum power pool includes 7,200
acres in the old river channel, 950 acres in creek channels, and about 9,000 acres
in first and second river flood plains.
2-C-4. Mean depth. The mean depth of Dannelly Reservoir at maximum
power pool elevation is 19.3 feet.
2-C-5. Maximulll depth. At the deepest point above Millers Ferry Lock
and Dam the water is approximately 60 feet deep.
2-C-6. Productive-depth zone. Within any body of water a certain area
supports most of the aquatic life that is present. Several limiting factors determine
the lower depth of this productive zone in a lake. One factor is the point in depth
at which the total quantity of surface light is reduced by 99 percent. Another factor
12
is that point in depth at which the dissolved o>tygen concentration in the water
is less than 1 ppm. Since these limits vary as a resnlt of other lake conditions,
the 15-foot depth will be considered the approximate bottom of the prodnctive zone.
In a riverine environment, the producti ve zone is generally quite variable
depending upon the rate of flow and the sediment loading. In fact, current evidence
on Dannelly Reservoir would indicate that the basic fish food item wonld be phyto-
plankton in the mainstream (upper three fourths of impoundment) area, while
macroinvertebrates would only be a major food source in the inundated flood
plain areas in the lower fourth of the impoundment.
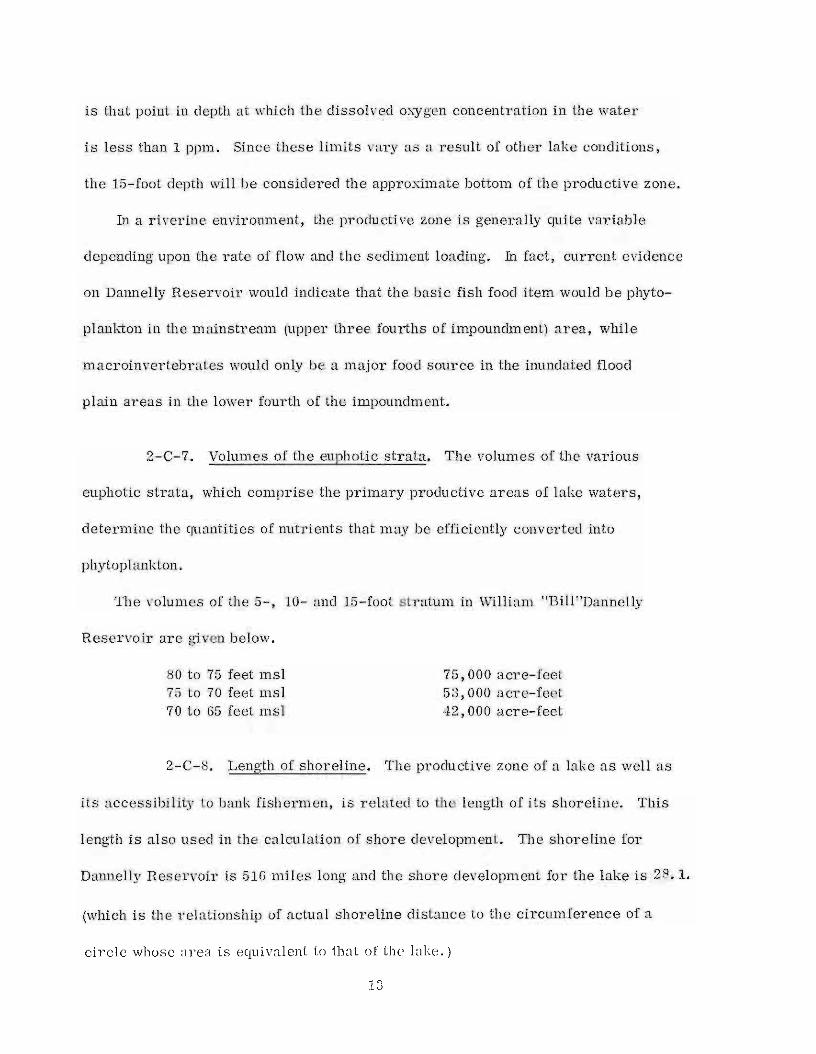
2-C-7. Volumes of the euphotic strata. The volumes of the various
euphotic strata, which comprise the primary productive areas of lake waters,
determine the quantities of nutrients that may be efficiently converted into
phytoplankton.
The volumes of the 5-, 10- and 15-foot stratum in William "Bill"Dannelly
Reservoir are given below.
80 to 75 feet msl75 to 70 feet msl70 to 65 feet msl
75,000 acre-feet53,000 acre-feet42,000 acre-feet
2-C-8. Length of shoreline. The prodnctive zone of a lake as well as
its accessibility to bank fishermen, is related to the length of its shoreline. This
length is also used in the calculation of shore development. The shoreline for
Dannelly Reservoir is 516 miles long and the shore development for the lake is 28.1.
(which is the relationship of actual shoreline distance to the circumference of a
circle whose area is equivalent to that of the lake.)
13
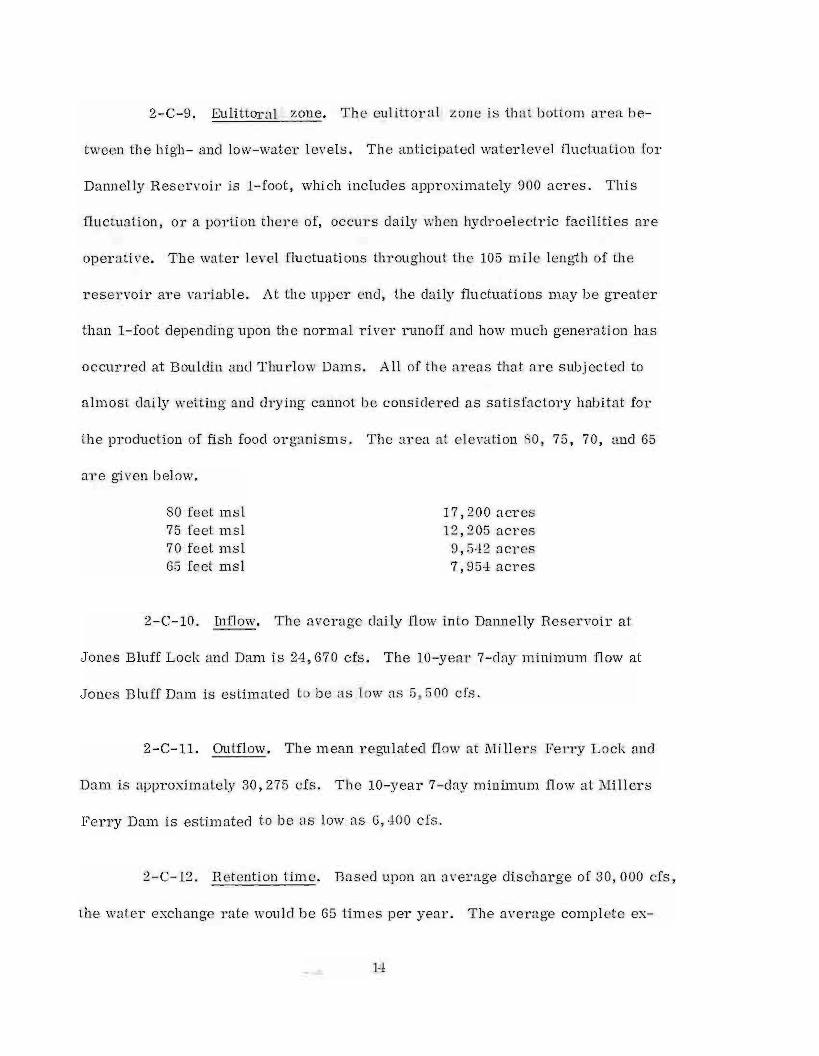
2-C-9. Eulittoral zone. The eulittor.al zone is that bottom area be-
tween the high- and low-water levels. The anticipated waterlevel fluctuation for
Dannelly Reservoir is I-foot, which includes approximately 900 acres. This
fluctuation, or a portion there of, occurs daily when hydroelectric facilities are
operative. The water level fluctuations throughout the 105 mile length of the
reservoir are variable. At the upper end, the daily fluctuations may be greater
than I-foot depending upon the normal river runoff and how much generation has
occurred at Bouldin and Thurlow Dams. All of the areas that are subjected to
almost daily wetting and drying cannot be considered as satisfactory habitat for
the production of fish food organisms. The area at elevation 80, 75, 70, and 65
are given below.
80 feet msl75 feet msl70 feet msl65 feet msl
17,200 acres12,205 acres
9,542 acres7,954 acres
2-C-lO. Inflow. The average daily flow into Dannelly Reservoir at
Jones Bluff Lock and Dam is 24,670 cfs. The 10-year 7-day minimum flow at
Jones Bluff Dam is estimated to be as low as 5,500 cfs.
2-C-ll. Ontflow. The mean regulated flow at Millers Ferry Lock and
Dam is approximately 30,275 cfs. The 10-year 7-day minimum flow at Mi11ers
Ferry Dam is estimated to be as low as 6,400 cfs.
2-C-12. Retention time. Based upon an average discharge of 30, 000 cfs,
the water exchange rate would be 65 times per year. The average complete ex-
14

change time is approximately 5.6 days. At minimum low flow the estimated
complete exchange time would be 26 days.
2-C-13. Internal flow currents. Impoundments on large streams are
subject to various types of internal currents. During' the cold months the im
pounded waters are usually fairly homogeneous as to temperature, dissolved
oxygen, and amounts of suspended matter. This homogeneity is due to the com
plete circulation of the waters. During warm months the waters may stratify
thermally and density currents may exist in the lower depths. Normally, there
are no density currents in surface waters; instead these waters are subject to
wind and convection currents.
Based upon limited information no true density currents exist for any extended
period in Dannelly Reservoir. Dissolved o}'ygen depletion in deeper waters in
Dannelly Reservoir would be for short durations except under extended adverse
weather conditions.
2-C-14. Penstock depth. The depth at which the penstock openings are
located determines the quality of tailwaters released during power generation.
During stratification of lake waters, if these openings are below the level in which
dissolved ohygen is present, then the tailwaters will be deficient in dissolved
oh)'gen and high in C02, H2S, and BOD (biological oxygen demand).
The powerhouse on Millers Ferry Dam is not located 011 the mainstream, but
on the east side of the river some 0.4 mile below the dam. The powerhouse
15
diversion canal is only about 15 feet deep, thus the water entering the penstocks
is surface waters and should be of fairly good quality regardless of the depth of
penstock openings. The penstock openings on the Millers Ferry powerhouse
extend from elevation 16-feet to 54-feet ms!.
Even with the particular surface water intake system described above, it
was claimed that during the first summer this Reservoir existed that its tailwaters
were low in dissolved oxygen concentration. The probability that such a condition
should exist very frequently seems highly improbable.
2-C-15. Water-level fluctuations. The water level in Dannelly Reservoir
is maintained near SO-feet msl throughout the year. During a period of genera
tion the water level in the extreme lower end of the Reservoir may recede to near
elevation 79 feet ms 1. However, when generation ceases the water level rapidly
returns to SO feet ms!. During flooding the waters may overflow the dam elimi
nating any blockage of free fish migration in the stream. Sufficient flooding to
allow free migration of fish might be expected about every 10 years. On October
4, 1973,the drawdown on this lake approached 2 feet which exposed approximately
2,000 acres. This drawdown was the result of excessive generation by Millers
Ferry powerhouse and a low upstream inflow.
2-C-16. Uncleared flooded areas. An effort was made to clear all standing
timber within the waterline throughout most of the Reservoir. However, a few
stands of timber were left uncut and consequently after flooding died. These
16

uncleared areas are mainly confined to upper ends or shallow areas within the
flood plains of the river as well as in some tributary streams.
The location of these stands of uncleared trees, which are presently serving
as fish attractants, are gi ven in Table 2. It might be pointed out that these trees
had largely pruned themselves by summer of 1973.
2-C-17. Meteorological influence. Weather conditions have a major
influence on the water quality as well as water exchange rate in Dannelly Reservoir.
Due to the rapid exchange rate of this reservoir there is little likelihood that the
waters in this reservoir would stratify except under extreme minimum flow condi
tions when the total exchange time might be as great as 30 days.
I-leavy, extended rainfall upon any portion of the drainage area of Dannelly
Reservoir will produce excessive flow and some degree of increased turbidity.
Localized flooding upon the Cahaba River will definitely increase the turbidity in
Alabama River waters below the mouth of Cahaba River. The flow rate within the
Reservoir determines how far and how intense this side stream turbidity may be.
If excessive turbidity occurs in the early spring it could be detrimental to the
successful spawning of some game fishes.
17

Table 2. Areas of standing timber on Dannelly Reservoir, located by river !I1ile(using the September, 1972, edition of Alabama River Navigation Charts).
River Side of Embayment Area, acresmile River
134-135 East X 12-15
135-136 East 35
136-137 West X 80East 75
137-138 East X 50West X 3
138-139 West X 1
139-140 East 5
140-141 East 50
151-152 East X 1
152-153 East X 45
153-154 East X 45
154-155 East X 80
156-157 East 500
158-159 East 2
141-142 East X 80
142-143 East X 5West 30
143-144 East X 35West 25
18

Table 2Cont 'd .
River Side of Embayment Area, acresmile River
144-145 West X 25
149-150 West 40
175 East X 5
169-171 East & West X 30
178.6 West X 6
180.3 West X 5
180.7 East X 1
184 East X 2West X 3
186.9 East X 70
187.3 West X 3
194.2 West X 5
19

3. Water Quality in Relation to Fish Production
3-A. General. The quality of impounded river waters largely determines
the quality and quantity of aquatic life in the lake. The water quality of a river
is, in turn, the product of its watershed. The river receives leached, washed
off, and c1nmped contributions from agricultural, industrial, and urban use of
the drainage area.
3-B. Water quality constituents. Since water is the medium in which aquatic
plants and animals spend most or all of their existence, water conditions must be
optimum for survival, growth, and reproduction of aquatic life. Those water
quality parameters that are most important to aquatic life include temperature,
dissolved oxygen, pH, carbon dioxide and alkalinity, chemical type (hardness and
so forth), plant nutrients, toxic substances, and sediment load. Each of these
water quality parameters is discussed below.
3-B-l. Temperature. The water temperature in a lake determines the
type of aquatic life that it can support. In the Southeast, water temperatures
range from about 45 0 to 90+ 0 F six inches below the surface. Generally, weather
conditions control surface water temperatures, but the activities of man can some
times alter the temperature of water. Some obvious examples of the latter case
are the construction of deep-water impoundments, the winter storage of cold waters,
and the release of heated water from industrial cooling systems.
20
3-B-l-a. Temperature stratification in a lake. In all bodies of water
there is a tendency for the entire volume to be homogeneous in temperature during
the winter period. However, as the air temperature rises in the spring the surface
water temperature of a lake also increases. Then as summer approaches, there
is an increasing temperature differential between the surface and the bottom waters
of a lake. The magnitude of this difference depends upon altitude of the lake, the
depth of water, and the quantity and quality of inflowing and outflowing waters.
In lakes of sufficient depth the summer thermal pattern starts at the surface
layer or epilimnon, where surface temperatures approach or may exceed mid-day
air temperatures. Descending in depth, the water temperature decreases until it
approaches stratification and may form a thermocline. This is a region in which
the water temperature decreases 10 C for every meter of increasing depth.
In William"Bill" Dannelly Reservoir the epilimnon begins to warm-up in
March and by June may have attained its maximum temperature for the summer.
The water temperature may slightly decrease with depth, but the thermal strati
fication never approaches a thermocline. Any unstable thermal situation in this
lake can be disrupted by a heavy summer thunderstorm, by excessive discharges
from upstream impoundments, and by prolonged high winds.
3-B-1-b. Temperature conditions in tailwaters. As mentioned previously,
the powerhouse on Millers Ferry Dam is situated on the East bank of the river some
0.4 mile below the dam. An earthen embankment or mound eJdends from the power
house upstream along the East bank of the river to a point approximately 0.2 mile
above the dam. This wing-wall structure serves as a diverter of the sh'eam flow into
21

a large, shallow (water depth less than 15 feet) embayment along the East side
of the river channel which is the source of water for the turbines. Thus, a major
portion of the water passing through the powerhouse is drawn from the epilimnon
region of the reservoir. In winter months the tailwater temperature is equal to the
reservoir average while in summer months the tailwater temperature may be one to
five degrees less than reservoir surface water temperatures.
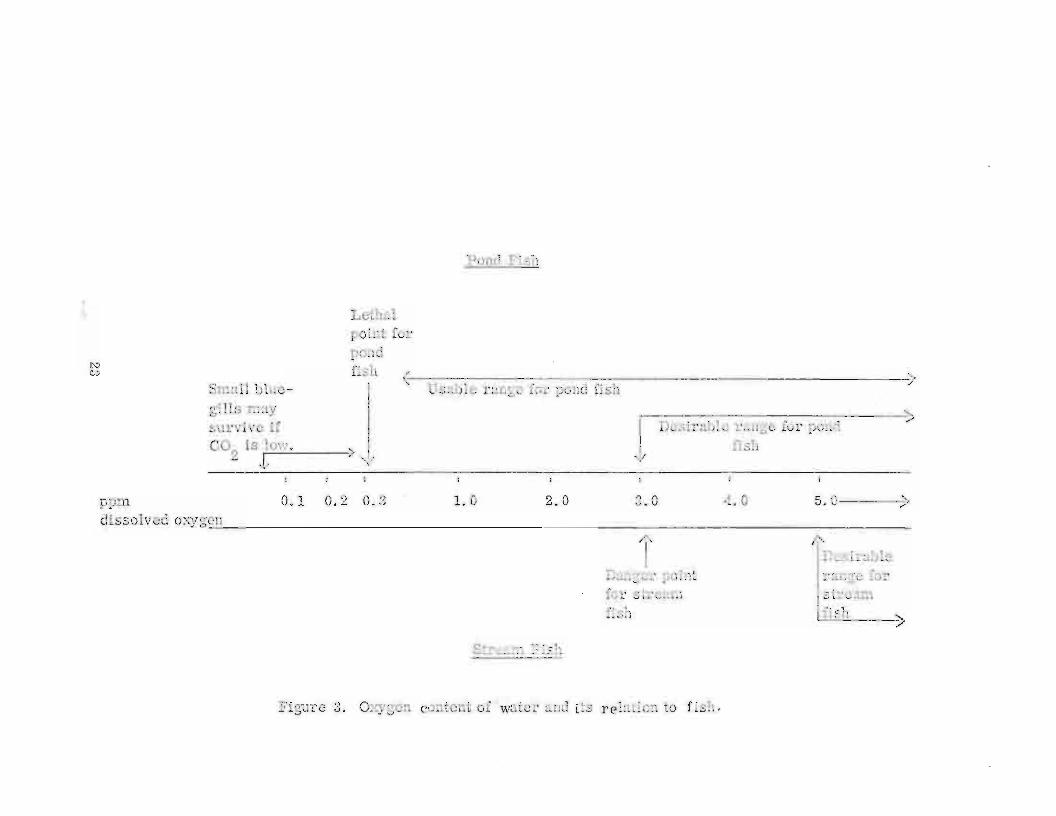
3-B-2. Dissolved oxygen. Surface waters must contain an adequate
supply of dissolved o>;ygen in order to support aquatic life. Ranges of dissolved
oxygen concentrations in relation to freshwater fish production are shown in
Figure 3.
Factors which affect the quantity of dissolved oxygen in water include temp
erature, presence of oxidizable materials, respiration requirements of aquatic
plants and animals, and the abundance of phytoplankton. The oxygen-absorbing
capacity of water decreases as the water temperature rises. However, the amount
of oxidizable organic and inorganic material in the water determines the degree
of saturation that will be maintained.
Although water can absorb oxygen from the atmosphere, such absorption is
limited to the surface layers of lakes. Since a lake needs dissolved o>"}'gen more
dnring the warm weather period when absorption is lower, a more efficient oxygen
source is required. Such a source is provided by microscopic aquatic plants called
phytoplankton. This biological process is so efficient that waters supporting
moderate-sized phytoplankton populations can become supersaturated with oxygen.
22
Panel Fish
"~ Usable range for pond fish ~
Lethalpoint forpondfish
Small blucgills m~lY
su rvive if ,.CO is low. )
2 J/ "I
Nco
I,
2.0 3.0 4.0 5.0 ;>
l' l'Ij)csira~leDanger point ra11ge iorfor stream Istre:lmfish ifish ;>
1.00.1 0.2 0.3ppmdissolved o>,:ygen _
Stre2.m Fish
Figure 3. Oxygen cuntcnt of water and i~s relation to fish.

An over abundance of phytoplankton can be detrimental to the overall oxygen
situation in a lake. Dense growths reduce the depth to which sunlight can pene
trate, which in turn restricts the amount of photosynthesis. Thus, m"}'gen pro
duction occurs near the water surface, while the o"'ygen demand below this
layer is increased by dead plants settling toward the bottom. Also, the dark
period respiration of this dense plant population may utilize most of the previously
produced excess dissolved oxygen. The supersaturation of surface waters resulting
from excess o),.ygen production is not necessarily beneficial to a lake, since much
of this supersaturation is lost to the atmosphere if the area is subject to wind-
wave action.
Dense populations of phytoplankton in lake waters are also undesirable since
such populations are subject to die-offs. Such die-offs not only terminate oxygen
production in the water, but also create a severe o),.ygen demand. This generally
results in complete o),.ygen depletion in the lake and the consequent suffocation of
aquatic life in the lake habitat.
In Dannelly Reservoir there are sufficient plant nutrients present to support
a moderate growth of phytoplankton, but other conditions have prevented this
situation from existing most of the time. There are sufficient growths of phyto
plankton, however, to keep the dissolved oxygen concentrations in surface waters
at 80 percent or more of saLuration during most of the year.
3-B-2-a. Dissolved oxygen stratification in lake. The dissolved oxygen
concentrations in Dannelly Reservoir are usually homogeneous during those same
24

cold weather periods when water temperatures are uniform at all depths. As the
surface waters begin to warm up, the dissolved oxygen saturation level decreases.
In addition, organic and inorganic o:ddation processes begin to speed up and fish
and other aquatic life become more active. All of these factors increase the demand
for oxygen.
In the 20-mile stretch of river below Jones Bluff Lock and Dam, there is exten
sive turbulence that assures good oxidation of the Jones Bluff tailwaters. For the
nmd: 60 miles there is a moderate flow that diminishes downstream as the river
begins to overflow the lower flood plain. Thus, the dissolved oxygen concentration
in this portion of Dannelly Reservoir is fairly uniform from surface to bottom at all
times during the year. Under e:--1:reme low flow conditions there may be some de
crease in dissolved o:--'Ygen with water depth in this lower portion of the reservoir.
This could result in a dissolved oxygen depletion in bottom waters, however, such
a situation has not occurred to date.
3-B-2-b. Dissolved oxygen conditions in tailwaters. The waters re
leased by Millers Ferry Powerhouse and Dam are generally at 75 percent or greater
saturation with dissolved oxygen. Such a condition assures that the tailwaters of
this dam contain the minimum dissolved o:--'Ygen concentration of 4 ppm for a majority
of the time in hot weather.
3-B-3. E!!. The pH of surface waters is a measure of whether the water
has an acid or basic reaction. In most natural surface waters, pH reflects the
quantity of free carbon dioxide present. Such waters generally fall in the pH
25

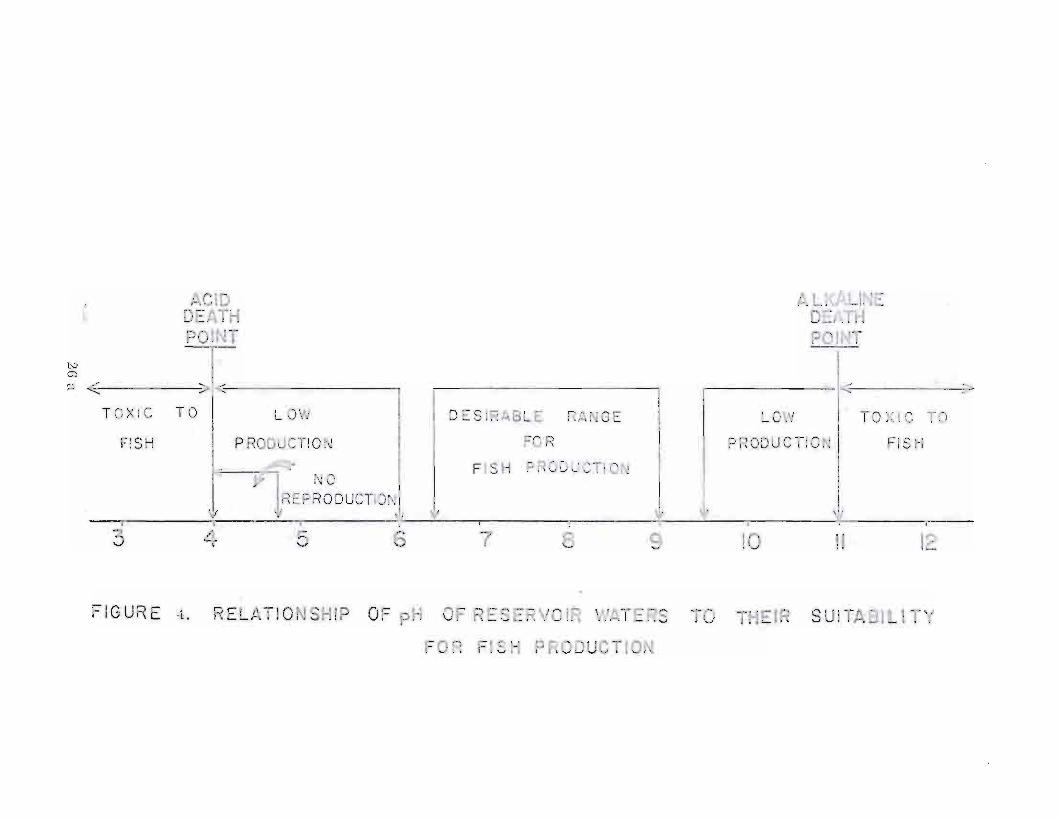
range Df 6. 0 tD 9.5, which is the range tDlerated by freshwater fish (Figure 4).
NDrmally, surface waters fluctuate sDmewhere between these tWD extremes every
24 hDurs as a result Df phDtDsynthetic activity. Aquatic plants use the C02 and
sunlight to prDduce 02 and carbDhydrates during the day, thus raising the pH tDward
9.5. At night these plants respire, releasing C02 and depressing the pH tDward 6. O.
SDme surface waters, such as mine drainage wastes, may accumulate acid
that has leached frDm the expDsed sDil. Others may cDntain acidic Dr basic wastes
frDm industrial DperatiDns.
The pH Df the waters in Dannelly ReservDir fall within the range Df 6.0 tD 9.5.
3-B-4. CarbDn diDxide and alkalinity. MDst natural waters are buffered
by a carbDn diDxide-bicarbDnate-alkalinity system. The relatiDnships Df C02, HC03-,
C03--, and aIr in natural waters are shDwn in Figure 5.
CarbDn diDxide is a natural cDmpDnent Df all surface waters. It may enter the
water frDm the atmDsphere but Dnly when the partial pressure Df carbDn diDxide in
the water is less than in the atmDsphere. CarbDn diDxide can alsD be prDduced in
waters thrDugh biDIDgical DxidatiDn Df Drganic materials. In such cases, if the
phDtDsynthetic activity is limited, the excess carbDn diDxide will escape tD the
atmDsphere. Thus, surface waters are cDntinually absDrbing Dr giving up carbDn
diDxide tD maintain an equilibrium with the atmDsphere.
The alkalinity Df natural waters is due tD the presence Df salts of weak acids.
Bicarbonates represent the major form of alkalinity since they are formed in
considerable amounts by the activity of carbon diDxide upDn basic materials in the
26
ACIDDEATHPOINT
A u<ALlNI:DEATHPOINT
'"cr>OJ < '. ~ -<= >..,. -
TOXI C TO LOW D ESIRl\8LE RANGE LOW TO)(IC TO
FISH PRODUCTION FOR PRODUCTION FISH
?=< FISH PRODUCTION7 NO
REPRODUCTIONlj IIV b ',' Y l-
I I , ,3 .0( 5 6 7 8 9 10 II 12
FIGURE 4. RELATIONSHIP OF pH OF RESERVOIR WATERS TO THEIR SUITABIliTY
FOR FISH PRODUCTION

Bicarbonate Alkalinity ~/
"
Total Alkalinity~ 7-
( Carbonate and OR Alkalinity '"
Range of Occurrence of COSAmount Detcrmined by Titratiou with RCI.
'"-'lNaRCOs < Na2C03 + RCl
'JI
CO2
Range of Occurrence of RC03-. AmountDetermined by Titration with BCl.
( NaHC03 + HCl
BC03Concentration
'\)I Decreasing 7- '!/
Free OH- Occurs in this Range,Usually Only in Polluted Waters.
pH = 4.5 8.3 10.0 n.o 12.0 13.0
Figure 5. Relationship and determination of CO2, RC03-, C03--. and OH- in natural waters.

soils. Under certain conditions natural waters may contain considerable amounts
of carbonate and hydroxide alkalinity. This situation often exists in waters supporting
a moderate to heavy growth of phytoplankton. These algae remove free and combined
carbon dioxide to such an extent that a pH of 9.0 to 10.0 often exists.
3-B-5. Chemical type. The total hardness, total chloride, and total sulfate
content of surface water indicate its chemical type, particularly where the source
of these ions is attributable to the soil formations in tbe drainage area. Conductance
measurements are also included under this heading since they may be used to detect
changes that may occur in the relative abundance of the above-mentioned ions.
Total hardness is primarily a measure of the total elivalent metallic and alkaline
earth elements in solution in the water. In most surface waters it measures calcium
and magnesium concentrations. The range of total hardness in waters from Dannelly
Reservoir was from 22.5 to 62.0 ppm as CaC03, with magnesium hardness account
ing for about 20 percent of the total concentrations.
It should be noted that water hardness is a direct reflection of the geology of the
drainage area. Lake waters have an appreciable total hardness only when C02
enriched waters flow over or throug'h soluble limestone formations on its way to the
lake. Total hardness also has a direct bearing upon the total alkalinity of soft water
lakes.
In this section of the United States the amount of total chlorides generally indi
cates the degree of domestic and industrial pollution. In the West, however, total
chlorides may reflect the type of drainage area. A maximum concentration of less
28

than 20 ppm total chlorides wou ld be considered normal in waters of Dannelly
Reservoir.
Total sulfates may indicate the type of drainage area. A maximum concentration
of less than 20 ppm total sulfates would be considered normal in waters of Dannelly
Reservoir.
Conductance of surface waters depends on the total concentration of soluble ions
since this parameter measures how well a surface water conducts an electrical
current. Conductance is expressed as }lmhos/cm3. It is useful in fisheries manage
ment in detecting changes in certain soluble elements in the water. In Dannelly
Reservoir conductance ranged from 67 to 100 )lmhos/cm3 with a mean of 75 pmhos/cm3
over a 2 year period.
3-B-6. Plant nutrients.
3-B-6-a. Nutrient enrichment in impoundments. The surface nmoff
in a river basin is both the solvent and the transporting vehicle for more than 15
elements that are essential nutrients in the gTowth of aquatic plants and animals.
The concentration of these elements in runoff water and eventually in river water
depends not only upon the types of soil and agTicultural operations that occur in the
drainage area, but also upon the amounts of domestic sewage and industrial effluent
that may be discharged therein.
29

Once the nutrients reach the impoundment, various things may happen. Some
of the nutrients in a lake will always be present in soluble form. These soluble
nutrients may originate either from re-solution of bottom muds or from waste
and decomposition of plants and animals. Another portion of the nutrients may
be precipitated as colloidal matter directly into the bottom muds for temporary
or permanent storage. Yet another part of the input nutrient may be used in the
growth and reproduction of bacteria, fungi, algae, or rooted aquatic plants. These
plants may be consumed by some animal, or the plant may die and deposit their
nutrients in the muds.
Animals eliminate most vf the nutrients they consume as 'vaste, retaining only
a small portion in their growth. The growth-retained portion of nutrients may be
removed from the local environment if the animal flies, walks, crawls, or is
taken bodily from the impoundment. If the animal remains in the impoundment,
it eventually dies. 'TI,en the nutrients return to the bottom muds or become a
food item for another animal.
Also, a portion of the input nutrients pass out of the impoundment into the
tailwaters and are then classified as outlet nutrients. These outlet nutrients may
occur in soluble forms, bacteria, fungi, algae, rooted plants, animals, other
organic materials, and soil colloids. All of these nutrients move downstream to
combine with additional runoff and eventually become the input nutrients for the
next impoundment. There the process is repeated and so on until the river flows
into the ocean.
30

What has been described above is an abbreviated nuh'ient cycle for an im
poundment. In order for man to use this cycle to his advantage it is necessary
to lmow both the quantity of each nutrient found in each of the niches described
and the rate of partial or permanent retention. With such information available
it is possible to determine the element or elements responsible for over pro
duction of noxious plants, isolate the source(s), and eventually correct the problem.
Since the nutrient cycle of an imponndment is intimately related to eutrophi
cation, and since a moderate degree of nutrient enrichment is essential for fish pro
duction in impoundments, a tolerable eutrophication is beneficial. In those
areas where there are excessive amounts of nutrients, seasonal rooted aquatic
plants may be used as a possible nutrient-retention site during periods of hot
weather and frost then provide a mechanism for the slow release of nuh'ients when
there is a higher rate of stream flow.
Since elemental nutrients are essential to aquatic life, it is necessary to know
how they are distributed in the water, suspended matter (living and dead, organic
and inorganic), bottom soils, plants, and fish. Only with this Imowledge is it
possible to fully evaluate an aquatic habitat.
3-B-6-b. Macro-nutrients. All living things are composed of elements
that are arranged in different combinations and configurations to form matter. Those
elements which are most abundant in liVing tissues are called macro-nutrients or
major nutrients. Macro-nutrients include carbon, hydrogen, o'[ygen, nitrogen,
31

phosphorus, sulfur, potassium, magnesium, calcium, and sodium. The concentra-
tions of some macro-nutrients in various aquatic components of Dannelly Reservoir
are given in Table 3.
Using the mean flow data of the Alabama River at Jones Bluff Dam and at
Millers Ferry Dam and taking the average total nitrogen and total phosphorus
concentrations in the water at both locations, the total daily input and output of
these nutrients were calculated for Dannelly Reservoir. These estimates for the
summer of 1973 are given below.
Nutrient
Nitrogen-input (1)
Nitrogen-output (2)
Phosphorus-input (1)
Phosphorus-output (2)
Daily loadingas total lbs.
33,360
55,680
9,980
6,300
Lbs/mi2 drainagearea
2.05
2.69
.61
.30
(1) Based upon an inflow of 25,000 cfs and a drainage area of 16,300 square miles.
(2) Based upon an outflow of 30,275 cfs and a drainage area of 20,700 square miles.
The daily input loading from domestic sewage was estimated to be 7, 827
pounds of nitrogen and 1,953 pounds of phosphorus. In addition about 3,880 pounds
of phosphorus was contributed by detergents. The estimated standing crop of
nitrogen and phosphorus in Dannelly Reservoir was 15.1 and 2.9 pounds per acre
respectively.
32

Table 3. Average concentrations of macro-nutrients (elements) in filteredwater, suspended nntter, bottom soils, "rooted plants, and fishfrom Dannelly Reservoir.
Macro- Filtered Suspended Bottom Plants, Fish,nutrient water, ppm matter, ppm soil, ppm ppm ppm
Nitrogen .11 5,150
Phosphorus .074 392.5 4,410 9,020
Potassium 1. 47 .218 560 31,275 2,785
Magnesium 2.186 1. 293 415 16, 140 297
Calcium 9.82 .790 715 24,525 1,289
Sodium 4.62 .192 300 10, 162 1,138
33
3-B-6-c. Micro-nutrients. In addition to the major nutrients mentioned
above, all living things require minute quantities of other elements in order to survive.
Because only a very limited quantity of each element is required, they are called
micro-nutrients. Among the micro-nutrients are iron, manganese, copper, zinc,
molybdenum, vanadium, boron, chlorine, and cobalt. There are undoubtedly several
other elements which eventually will be added to the list, but at present these are the
only ones whose active role in living organisms is known. The micro-nutrient con
centration found in the various components of Dannelly Reservoir are given in Table 4.
3-B-6-d. Nutrient sources. All nutrients entering Dannelly Reservoir
come from one of the follmving sources: the atmosphere, domestic sewage, animal
production refuse, animal and vegetable processing waste, fertilizer and chemical
manufacturing spillage, other industrial effluents, and agricultural runoff. The
discussion here will concentrate on the sources of the carhon, nitrogen, and phos
phorus that enter this system.
In pond culture it has been demonstrated that water, like land, must be properly
fertilized to produce sustained high yields of fish. Likewise, large impoundments
must have a continuous supply of nutrients in order to produce food for fish. Un
fortunately, large impoundments have unregulated nutrient supplies and in some
instances become so over-fertilized that they proc1uce noxious plant growth. To
date, even though the supply of nitrogen and phosphorus in Dannelly Reservoir has
been adequate to produce a moderate phytoplankton growth, other factors have
prevented such a growth from developing.
34

Table 4. Average concentrations of micro-nutrients (elements) in filteredwater, suspended matter, bottom sOil, rooted ~ants, and fishfrom Dannelly Reservoir.
Micro- Filtered Suspended Bottom Plants, Fish,nutrient water, ppm matter, ppm soil, ppm ppm ppm
Iron .10 1. 309 6,250 22,088 193
Manganese .008 .061 2,370 18,225 294
Copper .015 .041 15.25 6 306
Zinc .245 .015 44.5 297 140
Cobalt .036 .0005 6.7 98.5 19.1
35

Dissolved carbon is known to be a limiting factor in development of micro
scopic plant growths. Runoff waters from the Piedmont Province soils are poor
in carbon, while those from Valley and Ridges Province soils contain moderate
quantities of carbon. The two main sources of dissolved carbon within Dannelly
Reservoir are the industrial wastes from Harnmermill Paper Company and the
combined domestic and industrial waste from Selma. Each of these sources have
installed secondary or equivalent waste treatment systems that currently meet the
water quality requirements of the Environmental Protection Agency and the Alabama
Water Improvement Commission.
Approximately 22 percent of the drainage area for Dannelly Reservoir lies
below Jones Bluff Dam. The greatest contributor to this portion of the drainage
area is the Cahaba Ri ver. Specific sources of nutrients within this area include
some row-crop plus livestock farming, one paper mill, several small towns plus
Selma and Craig Air Force Base, sand and gravel dredging both in the riverbed
and on the flood plains. The eruption of a coal-washing retainer pond on the upper
watershed of the Cahaba River during a period of high water flow indicated that
industrial pollutants can move rapidly down the Cahaba River and then contaminate
Dannelly Reservoir between Cahaba and the State Park area.
3-B-7. Toxic substances. For many years researchers have recognized
that a number of chemical compounds, alone or in combination with other compounds,
are toxic to fish at low concentrations. For a long time it was impossibIe to identify
exact causative toxicants because of inadequate analytical techniques. In the past
36

decade, however, there have been some outstanding break-throughs in analytical
equipment and now it is possible to detect and identify most of the pollutants in
water. This has permitted rapid strides to be made in the control of toxic substances.
Only three major groupings of toxicants are known to be present in the Alabama
Ri vel' system. These three gToupS are pesticides, heavy metals, and other industrial
toxicants.
3-B-7-a. Pesticides. Pesticides, a product of modern organic
chemistry, were unknown prior to World War II. Since that time the efficacy of
most of the insecticides, bacteriacides, fungicides, and herbicides has created
an enormous market for these products. Unfortunately, some of the compounds
are quite to},ic to fish, and others are very persistent in either their original or
analog form. Techniques of application have been devised to minimize the risk of
those pesticides which are toxic to fish, and a few such compounds have been banned
from use. In the case of persistent pesticides which accumulate in fish tissues,
although their detrimental effect upon fish production is questionable, many persons
assume that such pesticides constitute a hazard to human health. Consequently,
there are now strict regulations concerning the use of pesticides, particularly in
aquatic areas. Needless to say, many insect vector and aquatic weed control prac
tices on large impoundments have been altered.
The amounts of pesticides detected in fish from Dannelly Reservoir are listed
in Table 5. The residnes from each species are compared with the overall average
for that species of fish in all Alabama streams (Table 6). Data on pesticide residnes
37

Table 5. Average concentrations of l:esticide residues in fish collected from Dannelly Reservoir, 1971. *
-----_.-Concentration in ppm wet weight of fish
Species DDT PCB Dieldrin Endrin BRC Lindane Toxaphene
Bass .930 2.133 .005 .003 ND ND
w00 Carp .800 2.700 .023 ND ND ND
Shad 1. 200 5.400 .004 ND ND ND
Catfish 1. 105 2.80 .010 .003
* Data from Report on Pesticide Residue Content (Including PCB) of Fish, Water and Sediment SamplesCollected in 197 I from Aquatic Sites in Alabama.

Table 6. A verage concentrations (ppm wet weight) of pesticide residues invarious species of fish collected from the A labama River comparedwith the overall average from species collected in all rivers inAlabama, 1971. *
Bass Bluegill Crappie Catfish Buffalo Carp Sucker Shad
DDT AR .768 .263 1. 00 .729 .295 .800 .965 .575-- --AL .923 .485 .526 .647 .623 1. 829 .209 2.24
Dieldrin AR .007 .014 .010 .006 .012 .023 .013 .017AL .007 .015 .009 .008 .008 .015 .006 .009
Endrin AR .002 .003 .002 .003 ND ND .006 .021AL .003 .003 .002 .002 .004 .003 .003 .026
PCB AR 1. 876 1. 871 5.80 2.157 .235 2.70 1. 58 1. 38-- -- --AL 1. 645 1. 523 2.034 2.232 3.091 3.274 1. 653 5.51
BRC AR ND ND ND ND ND ND ND NDAL .025 .022 ND .040 .019 .027 ND .028
Lindane AR ND ND ND ND ND ND ND NDAL .014 .011 ND ND .03 ND ND .034
*Data from Report on Pesticide Residue Content (Including PCB) of Fish, Water and Sediment Samples Collected in 1971 from Aquatic Sites in Alabama.
AR - Samples from the Alabama River
AL - Overall average of fish from all rivers in Alabama
NS - No sample
ND - Not detectable
39

in fish from Cahaba River are given in Table 7 and those from public fishing lakes
in the vicinity of Dannelly Reservoir are given in Table 8.
3-B-7-b. I-Ieavy metals. There are a number of metallic elements
such as lead, zinc, mercury, chromium, cadmium, nickel, and copper that are
considered either essential or tolerable constituents of aquatic life when found in
limited quantities. In larger amounts, however, these metals may be either toxic
or accumulati ve in aquatic organisms. Unfortunately, our knowledge of the natural
occurrence of these elements in the water is limited, and so their true effects upon
the environment remain to be determined. Data on the amount of these elements
found in the various componeuts of the Dannelly Reservoir aquatic habitat are given
in Table 9.
3-B-7-c. Industrial toxicants. Wastes from industrial operations con
tain numerous materials that may be tOJdc to many or all forms of aquatic life. Many
of the substances that were formerly disposed of as wastes are now being reclaimed
for reuse in industrial processes. Some unusable wastes are also removed by treat
ment, but other toxicants such as cyanides and ammonia are quite difficult to remove
from effluents.
On the Alabama River the industrial wastes that have been most troublesome
are organic in nature and have contributed considerably to the B. O. D. loading of the
receiving streams. Fortunately, practically all of the industrial plants in the area
now have or are in the process of installing adequate secondary treatments for their
waste materials.
40

Table 7. Average Concentrations of pesticide residues in fish collected from the Cahaba Ri vel' atu. S. Highway 80, 1971. *
Concentration in ppm wet weight of fishSpecies DDT PCB Dieldrin Endrin BRC Lindane Toxaphene
...,... Bass
Carp
Shad
.400
.288
1. 845
1. 050
.562
1. 425
.004
.007
.003
.001
ND
ND
ND
ND
ND
ND
ND
ND
* Data from Report on Pesticide Residue Content (Including PCB) of Fish, Water and Sediment SamplesCollected in 1971 from Aquatic Sites in Alabama.

Table 8. Average concentrations (ppm wet weight) of pesticide residues invarious species of fish collected from Public Fishing Lakes locatedin lhe Dannelly Reservoir Drainage Area, compared with averagesin species from all 23 public fishing 1akes in Alabama, 1971. *
Bluegill BassPesticide Site Dal. Dal.
DDT DR .119 .215---AL .125 .294
Dieldrin DR .001 .001---AL .003 .003
Endrin DR .004 .001---AL .002 .001
DR - Samples from public lakes in the Dannelly Reservoir Drainage AreaAL - Overall average from fish in all public fishing lakes in AlabamaDal. - Dallas County Public Fishing Lake
* Data from Report on Pesticide Residue Content (Including PCB) of Fish, Waterand Sediment Samples Collected in 1971 from Aquatic Sites in Alabama.
42

Table 9. Average concentrations of heavy netal e'lements in filteredwater, suspended matter, bottom soils, rooted plants, and fish
from Dannelly Reservoir.
Heavy Filtered Suspended Bottom Plants, Fish,metal water,ppm matter,ppm soil,ppm ppm ppm
Lead .10 .015 35.0 7.5 8.54
Mercury 0 .15
Chromium .01 .021 11. 85 69.7 28.8
Cadmium .006 .031 .70 0 .35
Nickel .031 1. 752 33.75 114 15.7
43

3-B-8. Sediment load. The sediment load transported by runoff waters
depends upon several factors in the watershed. These factors include slope of the
land, soil types, quantity and type of land cover, and amount of constnlCtion on the
watershed. In addition, the seasonal rate and duration of rainfall in the drainage
area influences the sediment load of runoff waters.
The Coosa River drainage area occupies a topogTaphic region with moderate
hills and relatively wide valleys, while the Tallapoosa River drainage area occupies
a region of moderate to steep ridges and narrow valleys. The soils within the Coosa
basin are moderately erodible, but due to the e>.1:ensive impoundment system on
this basin much of the runoff sediment load is retained within this basin. The soils
within the Tallapoosa basin are typical Piedmont Province deri vatives that are
highly erosive. Since these soils are mainly clays, the silt loading of runoff waters
is mainly of a colloidal nature. Even though there are rather extensi ve impoundages
on both river, the colloidal loading of floodiug waters is not all retained within the
basins. Thus, flood waters entering Dannelly Reservoir through Jones Bluff Dam
may be rather turbid.
The Cahaba Ri vel' drainage basin has upstream land characteristics similar to
those on the Tallapoosa basin, while downstream land features are typical of those
found within the Coosa basin. There are no impoundments on this River that would
decrease its sediment load into the Alabama Rivel'.
The average turbidity within Dannelly Reservoir during summer of 1972-'73
was 10. JTU's.
44

3-C. Pollution sources. The sources are generally identical to the nutrient
enrichment sources listed in Section 3-B-5-d. As a matter of record, the 1973
point sources of waste disposal on the Coosa - Tallapoosa - Cahaba - Alabama
Rivers above Millers Ferry Dam are given in Tables 10,11, 12 and 13. Where
available, the discharge rate and the status of the waste treatment facility at
each point source are included in the tables. Even though these treatment facilities
have been efficient in reducing the quantity of dissolved carbon released into the
river, large amounts of nitrogen and phosphorus are still released in the treated
effluent.
Waste treatment benefits fisheries management most by the reduction of disease
organisms, solid waste (biodegradable carbonaceous materials), and certain nitro
gen and phosphorus compounds in the water. Inadequacies of present-day treatment
facilities include the apparent inability to retain a greater fraction of the nitrogen
and phosphorus compounds in their sludge, and their present limited capacity for
handling storm sewer runoff. A large portion of the pesticide and some of the
nitrogen compounds detected in rivers adjacent to and below sewage outfalls probably
were contributed by storm sewer runoff.
45

Table 10
Coosa River waste sources*
Sewered pop. TreatmentLocation status Remarks
Cedar Blnff 1,000 SWOC/OK Municipal
Centre 3,000 SWOC/OK Municipal
Piedmont 4,000 SWOC/OK Municipal
Black Brothel's Sand & Gravel
Goodyear Tire & Rubber OK Rubber
Republic Steel
Gadsden (W) 38,000 OK/OK Municipal
DeMuth Steel Products
Fort Payne 25,000 OK/OK Municipal
Big Wills Poultry IT Meat
Collinsville 1,000 SWOC/OK Municipal
Attalla 8,000 SWOC/OK Municipal
Rainbow City 1,000 SWOC/OK Municipal
Spring Valley Foods OK Meat
Gadsden (E) 14,000 OK/OK Municipal
Glencoe 3,000 SWOC/OK Municipal
Springville 1,000 HHPT/Both Municipal
Ashville 1,000 HHPT/Both Municipal
Jacksonville 13,000 OK/OK Municipal
Blue Mountain 2,000 SWOC/Both Municipal
46

Table 10
Coosa River waste sources, cont'd. *
Sewered pop. TreatmentLocation (to nearest 1,000) status Remarks
Fort McClellan UK OK/OK Municipal
Pell City (E) 3,000 HHPT/Both Municipal
A vondale Mills OK Textile
Anniston 45,000 OK/SHEL Municipal
Donoho Clay Recycling
Monsanto Chemical IT Chemicals
Anniston Ordinance Depot
National Gypsum IT
Talladega (NE) 2,000 SWOC/OK Municipal
Smith Meat Co. OK Meat
Pell City (W) 1,000 SWOC/OK Municipal
Alabama Plating
Kimberly-Clarke IT Paper
Talladega (C) 2,000 SWOC/OK Municipal
Talladega (NW) 12,000 OK/OK Municipal
SYlacauga (2 plants) 2,000 SWOC/OK Municipal
Alabama Industries HI-IIT
Sylacauga (S) 19,000 OK/EL5 Municipal
Avondale Mills HHIT TeA1:iles
Bon Air 1,000 HI-INT/Both Municipal
47

Table 10
Coosa River waste Sources, cont'd. *
Sewered pop. TreatmentLocation (to nearest 1,000) Status Remarks
Childersburg (2 plants) 4,000 SWOC/OK Municipal
Lambrick Materials
Wilsonville 1,000 SWOC/OK Municipal
Georgia Marble
Moretti-Harrah Marble
Thompson-Weinman Marble
Hackney Corp. OK
National Standard HHIT
Columbiana 2,000 SWOC/EL5 Municipal
Calera 3,000 SWOC/Both Municipal
Keystone Metal Moulding OK
Clanton 5,000 SWOC/OK Municipal
Wade & Vance Sand & Gravel
Goodwater 1,000 SWOC/OK Municipal
Alabama Granite
Wetumpka (2 plants) 4,000 SWOC/OK Municipal
* lnformation from the Alabama Water Improvement Commission Program Submissionin Accordance with Section 106 of the Federal Water Pollution Control Act Amendments of 1972 (Draft; April, 1973).
48

Table 11
Tallapoosa River waste sources'
Sewered flJp. TreatmentLocation (to nearest 1,000) status Remarks
Heflin 2,000 SWOC/EL2 Municipal
C. F. Clegg Poultry Processing HRIT Meat
Vernon Carpet Mills
Wedowee 1,000 SWOC/OK Municipal
Lineville 2,000 PS/Both Municipal
Ashland (E) 1,000 SWOC/Both Municipal
Beaver Creek By-Products
Wadley 1,000 SWOC/OK Municipal
Roanoke (2 plants) 5,000 SWOC/OK Mtmicipal
Lafayette 3,000 HHNT/Both Municipal
Ashland (W) 1,000 PS/Both Municipal
Alex City (4 plants) 8,000 OK/OK Municipal
A lex City (SW) 2,000 OK/Both Municipal
Dadeville (N) 1,000 SWOC/OK Municipal
Dadeville (S) 1,000 HHNT/Both Municipal
Camp Hill 1,000 SWOC/OK Municipal
Opelika (N) 16,000 SWOC/EL5 Municipal
Opelika (2 plants) 16,000 SWOC/OK Municipal
West Point-Pepperell IT Textile
49

Table 12
Cahaba River waste sources *
Sewered pop. TreatmeutLocation (to nearest 1, 000) stahls Remarks
Lumberjack Meat OK Meat
Lumberjack Meat OK Meat
Ralston- Pu rina HHIT Meat
Tnlssville STP 2,000 OK/OK Municipal
Leeds STP 3,000 OK/Both Municipal
Gray Coal Company
Cahaba River STP 10,000 OK/OK Municipal
Patton Creek STP 11,000 OK/SHEL Municipal
Southern Railway IT
Shades Valley STP 50, 000 SWOC/SHEL Municipal
Cheney Lime and Cement
Alabaster 1,000 HHPT/Both Municipal
Alabaster (Siluria) 1,000 HHPT/Both Municipal
Bethea Company OK
Segco Coal Mine #2
Burgess Mining (Shelby Co.) OK
Burgess Mining (Bibb Co.)
Burgess Mining (Bibb Co.)
Burgess Miniug (Bibb Co.)
Allied Products
51

Table 11
Tallapoosa River v/aste Sources, cont'd. *
Location
Auburn (N)
Tallassee
Southern Stone
Auburn (S)
Notasulga
Cheshire Sand and Gravel
Tuskegee (E)
Tuskegee (N)
Shark Sand and Gravel
Tuskegee (SC)
Tuskegee (2 plants)
Southern Car Service
Sewered pop.(to nearest 1,000)
5,000
4,000
16,000
1,000
3,000
3,000
2,000
3,000
Treatmentstatus
SWOC/OK
SWOC/OK
OK/OK
HHPT/Both
SWOC/Both
SWOC/OK
SWOC/Both
SWOC/OK
Remarks
Municipal
Municipal
Municipal
Municipal
Municipal
Municipal
Municipal
Municipal
* Information from the Alabama Water Inlprovement Commission Program Submissionin Accordance with Section 106 of the Federal Water Pollution Control Act Amendments of 1972 (Draft; April, 1973).
50

Table 12. (cont'd).
Cahaba River waste sources, cont'd. *
Location
Martin Marietta Cement
Montevallo
Southern Stone
Sewerecl pop.(to nearest 1,000)
4,000
Treatmentstatus
OK/OK
Remarks
Municipal
Black Diamond Coal, Blocton #9
Fox Lumber
Centreville
Brent
Belcher Lumber
Olin Belcher Lumber
Marion (NE)
Marion (SE)
1,000
1,000
1,000
4,000
OK
SWOC/EL2
SWOC/OK
HHIT
HRIT
SWOC/OK
SWOC/Both
Municipal
Municipal
Municipal
Municipal
* Information from the Alabama Water Improvement Commission Program Submissionin Accordance with Section 106 of the Federal Water Pollution Control Act Amendments of 1972 (Draft; April, 1973)
52

Table 13
Waste sources on the Alabama River above Millers Ferry Lock and Dam*
Sewered pop. TreatmentLocation (to nearest 1,000) status Remarks
Radcliff Materials
Montgomery
Econchate STP 60,000 OK/OK Municipal
Towassa STP 15,000 OK/OK Municipal
Catoma STP 55,000 OK/SBEL Municipal
Gurney Mfg. HHNT
Prattville 22,000 OK/Both Municipal
Union Camp OK Paper
Pierce Sand and Gravel
Dan River Mills OK Textile
Thorsby 1,000 PS/Both Municipal
Dallas Sand and Gravel
Hammermill Paper IT Paper
Vitalic Battery UK
Cloverleaf Dairy HHIT
Selma 33,000 OK/OK Municipal
Marion (W) 3,000 SWOC/OK Municipal
* Information from the Alabama Water Improvement Co=ission Program Submissionin Accordance with Section 106 of the Federal Water Pollution Control Act Amendments of 1972 (Draft; April, 1973)
53

TREA TMENT CLASSIFICA TIONS
For Municipal Dischargers:
HHIS - Health Hazard with Individual Treatment Systems
HHNT - Health Hazard with No Treatment (Raw discharge)
HHPT - Health Hazard with Primary Treatment
PS - Primary System
SWOC - Biological (or equivalent) Treatment without Chlorination
OK - Minimum of Biological Treatment (or equivalent)
For Industrial Dischargers:
HHNT - Health Hazard with No Treatment (Raw Discharge)
HI-lIT - Health Hazard with Inadequate Treatment
IT - Inadequate Treatment
OK - Adequate Treatment
LOADING CLASSIFICATIONS
Municipal Dischargers Only:
SHEL - Significant Hydraulic Efficiency Loss
SBEL - Significant Biological Efficiency Loss
Both - Both of the above Conditions Exist
EL2 - Efficiency Loss (Either Type) EA']Jected Within 2 years
EL5 - Efficiency Loss (Either Type) EA1Jected Within 5 years
OK - No Overload Anticipated for 5 years
54

4. Aquatic Plants in the Impoundment.
4-A. Aquatic plant - definition. The term "aquatic plant," as used in this
Plan, refers to a multi tude of plant species (including some bacteria and fungi)
whose entire life cycle is passed within an aquatic environment.
Practically all aquatic plants may be desirable at one time or another in a
particular habitat. However, when they become too dense or interfere with other
uses of the water, they become a nuisance.
4-B. Factors affecting aquatic plant growth. Bodies of water are like land
areas in that some type of vegetation will occupy any suitable habitat. Likewise,
the more abundant the nutrient supply, the more dense the vegetation, other envi
ronmental factors being favorable. All nutrients essential for plant growth are
yet to be determined. Some of the elements lmown to be important are nitrogen (N),
phosphorus (P), potassium (K), magnesium (Mg), calcium (Ca), manganese (Mn),
iron (Fe), silicon (Si) for diatoms, sulfur (S) as sulfates, oxygen (02), and carbon
(C) as carbonates. In many habitats an abundance of nitrogen and phosphorus pro
motes vegetative production if other conditions for growth are favorable. Most
algae require some simple organic compounds, such as amino acids and vitamins,
and many trace elements, such as zinc and copper.
It must be remembered that factors other than plant nutrients also are operative
in the establishment and maintenance of aquatic plant growths. For the process of
photosynthesis to occur, there must be sufficient light reaching the critical point in
the habitat. If turbidity from muds, dyes, other materials, or even phytoplankton
55

is too great, plants at lower depths cannot grow. However, certain plants, if
established in an area, can trap large amounts of intermittent silt and other mat
erials, and clear the waters for downstream uses.
Another factor that might be operative in prelrenting aquatic plant growth would
be the lack of free C02 and bicarbonate ions in a particular aquatic environment.
Certainly an area in which the pH is high, 9.5 or above, or low, below 5.5, produc
tivity would not reach high levels due to a lack of sufficient bicarbonates.
Temperature also is an important factor in determining the amount of growtb.
For each species there is an optimum range in which the greatest growth occurs.
Wave action on large e"vanses of water may also be a factor in regulating all
types of aquatic plant growths. This appears contradictory to the concept that
winds cause mixing of surface and bottom waters, thereby renewing plant nutrients
in the euphotic zone. However, in certain lakes and reservoirs, wind induced waves
and currents mechanically agitate bottom materials and waters to an e,,'tent that
interferes with the production of phytoplankton and rooted aquatic plants.
4-C. Aquatic plant groups and associated habitat problems. The plants that
occupy an aquatic habitat may be divided into bacteria, fungi, algae, and rooted or
floating flowering plants. In the paragraphs which follow there is a brief summary
of the characteristics of each plant group and the problems the plants may create.
4-C-1. Bacteria. Members of the group of sheath-formers are the pri
mary bacterial nuisance in rivers, lakes and ponds. A notable problem associated
with thiS group occurs in areas subjected to organic enrichment. Bacteria,
- ~ 56

especially of the genus Sphaerotilus, are prevalent in areas receiving raw domestic
sewage or improperly stabilized paper pulp effluents containing a small amount of
sinlple sugars. The bacterial growths interfere witil fishing by fouling lines, clog
ging nets, and generally creating unsightly conditions in an infested area. Their
metabolic demands while living and their decomposition after death also cause the
bacteria to impose a high BOD load on the stream, which can severely deplete
dissolved oxygen. Thrthermore, it has been reported that large populations of
Sphaerotilus render the habitat noxious to animals and thus actively exclude desirable
fish and invertebrates.
There are no known growths of Sphaerotilus in William "Bill "Dannelly Reservoir.
4-C-2. Fungi. No information.
4-C-3. Algae. The freshwater algae are quite di verse in shape, color,
size and habitat. In fact, describing all the species of algae would be as compre
hensive as writing about all the land plants, including fungi, mosses, ferns, and
seed plants.
Algae may be free-floating (planktonic) or attached to tile substrate QJenthic or
epiphytic types). They may be macroscopic or microscopic and are single-celled,
colonial, or filamentous. When present in sufficient numbers, these plants impart
color to the water, varying from green to yellow to red to black. They may also
congregate at or near the water surface and form a scum or waterbloom.
Algae form the first link in the aquatic chain which converts inorganic consti
tuents in the water into organic matter. During the daylight hours algae
57

photosynthesize, thus removing carbon dioxide from the water and producing oxygen.
Algae also produce carbon dioxide by their continual respiration. The amount of
oxygen produced by algae during active photosynthesis is generally in excess of the
amount of carbon dioxide released by respiration.
Limited concentrations of algae are not troublesome in surface waters, but an
overabundance of various species is undesirable for many water uses. A relatively
abundant growth of phytoplanhi:on in waters 3 or more feet deep shades the bottom
muds enough to prevent germination of seeds and halt the growth of practically all
rooted submersed and emersed aquatics. This removes an important source of
food for ducks and other waterfowl.
Some green algae, blue-green algae, and diatoms produce odors and scums that
make water less desirable for swimming. Also, people who are allergic to many
species of algae are affected if the algae become very numerous in waters used for
swimming.
Dense growths of such phytoplankton and filamentous algae may limit photosyn
tlletic activity to a surface layer only a few inches deep. Under certain condi tions
the populations of algae may die and their decomposition will deplete dissolved
O}lygen in the entire body of water.
A number of algal species reportedly cause gastric disturbances in humans
who consume the infested water. Under certain conditions, several of the blue
green algae produce toxic organic substances that kill fish, birds, and domestic
animals. The genera that contain species which may produce toxins are Anabaena,
Anacystis, Aphanizomenon, Coelosphaerium, Gloeotrichia, Nodularia, and Nostoc.
Species of the green algae, Chlorella, have also caused toxicosis.
58

Many forms of phytoplankton and filamentous algae clog sand filters in water
treatment plants, produce undesirable tastes and odors in drinldng water, and
secrete oily substance that interfere with manufacturing processes and domestic
water use. Certain algae cause foaming of water during heating, corrosion of
metals, or clogging of screens, filters, and piping. Algae may also coat cooling
towers and condensers, causing these units to become ineffective.
Filamentous algae in ponds, lakes, and reservoirs may deplete the nutrient
supply of the unicellular algae which are more commonly eaten by fish or fish-food
organisms. Dense growths of filamentous algae may also reduce total fish pro
duction and seriously interfere with harvesting the fish by hook and line, seining,
or draining. Under certain conditions, these growths on pond and lake bottoms
become so dense they eliminate fish spawning areas and possibly interfere with the
production of invertebrate fish food. However, the amount of cover prOVided by
such large growths of filamentous algae can contribute to enormous population
increases, resulting in large numbers of small stunted fish. A list of various
genera of algae collected from William "Bill"Dannelly Reservoir is given in Table 14.
4-C-4. Flowering plants. This group includes submersed, emersed,
floating, and marginal plants. These aquatics may be rooted in the soil or they
may have roots which float at or near the water surface.
Submersed plants are those which produce most or all of their vegetation be
neath the water surface. These plants often have an underwater leaf form totally
different from the floating or emersed leaf form. The flowers usually grow on an
59

Table 14. List of phytoplanh1:on gjanera COllected from Dannelly Reservoir in 1973.
Chlorophyta (Green Algae)ChlamydomonasCarteriapteromonusCoccomonusPandorinaEudorinaPlatydorinaUlothrixHormidiumGolenkiniaPediastrumTreubariaAnkistrodesmusSelenastrumScenedesmusStaurastrum
Ellglenophyta (Euglenoids)EuglenaLepocinclisTrachelomonas
Chrysophyta (Yellow-green Algae)Melosira
Cyanophyta (Blue-green Algae)Polycystis (Microcystis)Merismopedia
60
aerial stalk. The abundance of these weeds depends upon the depth and turbidity of
the water and also upon the type of bottom. In clear water 8 to 10 feet is the max
imum depth of their habitat, since they must receive enough light for photosynthesis
when they are seedlings. Most of these submersed aquatics appear capable of ab
sorbing nutrients and herbicides through either their roots or their vegetative
growth.
Emersed plants are rooted in bottom muds, but produce most of their vegetation
at or above the water surface. Some species have leaves that are flat and float
entirely npon the surface of the water. Other species have saucer-shaped or ir
regular leaves which do not float entirely upon the water surface.
Marginal plants are probably the most widely distributed of the rooted aquatic
plants and are quite varied in size, shape, and habitat. Many species can grow
both in moist soils and in water up to 2 feet deep. Other species grow only in
moist soils or only in a water habitat.
Floating plants have true roots and leaves, but instead of being anchored in
the soil they float about on the water surface. The plants are buoyant due to modi
fications of the petiole and the leaf, including the covering of the leaf surface.
Most species have wen-developed root systems which collect nutrients from the
water.
Species designated as weeds are not necessarily such in all places and at all
times. For example, many submersed and emersed plants that normally interfere
with water recreation are considered desirable food sources in waterfowl refuges.
Rooted plants with floating leaves (e. g., waterlilies and watershield) and those
61
plants which float upon the surface (e. g., waterhyacinth, parrotfeather, alligator
weed, and duckweeds) are considered highly objectionable by many water users.
However, in clear water areas where artificial or natural fertilization is moderate,
removal of these surface-shading plants permits sunlight to penetrate to the hottom
muds and thus submersed plants may soon occupy these waters. These submersed
plants generally are considered more objectionable than the original surface
covering plants.
Most emersed and marginal plants and a few submersed plants plus filamentous
algae provide a suitable habitat for the development of anopheline and other pest
mosquitoes. They also furnish a hiding place for snakes and are an excellent
habitat for damselflies and some aquatic beetles.
Like filamentous algae, flowering plants consume nutrients that could other
wise be used by phytoplankton. Thus, an overabundance of rooted plants may
reduce total fish production in an infested hody of water and interfere with harvest
ing the fish. There is also evidence that rank growths of submersed, emersed, or
floating weeds may deplete the dissolved oxygen supply in shallow waters. This
causes fish to move into more open and better quality water, if such water is
available. Extensive growths of weeds can, however, provide so much cover that
the fish population increases enormously, resulting in overcrowding and stunting.
A listing of the potentially noxious flowering aquatic plants in William "Bill" Dan
nelly Reservoir is gi ven in Table 15.
62

Table 15. List of flowering aquatic weeds in the Alabama River, Summer, 1973.
Alligatorweed*
Arrowhead*
Buttonbush*
Cattail*
Coontail *
Foggruit; Frogfruit*
Horned rush*
Lizzardtail*
Meadow beauty*
Scouringrush*
Pennsylvania smartweed*
Redtop panicum *
River oats*
Waterwillow*
Water primrose*
*Found in Dannelly Reservoir.
63
Alternanthera philoxeroides
Sagittaria sp.
Cephalanthus occidentalis
Typha sp.
Ceratophyllum sp.
Lippia lanceolata
Rhynchospora corniculata var. interior
Saururus cernuus
Rhexia virginica
Equisetum hyemale
Polygonum pensylvanicum
Panicum agrostoides
Uniola latifolia
Justicia sp.
Ludwigia peploides var. glabrescens

4-D. Aquatic plant populations of William "Bill "Dannelly Reservoir and
methods for their control. Dannelly Reservoir started filling in June, 1968. After
fluctuating up and down between elevations 62 and 70 feet msl it finally reached full
pool elevation of 80 feet in April, 1970. During the first summer after it had filled,
small colonies of alligatorweed were scattered throughout the lower (25 mile) reach
of the Reservoir. As time progressed, so did the infestation of alligatorweed in
crease, and in 1973 it was present in scattered, to closely clumped, colonies from
the mouth of Cedar Creek to the Dam. No effort has been made by any State or
Federal Agency to control this weed infestation. To date the winter floods have
aided in preventing the build-up of large clumps of alligatorweed, but at the same
time it has provided the mechanism for the widespread infestation that existed in
1973. Each fall there is an invasion of moth larvae that defoliates large areas of
this weed growth. This weakens the stem and makes these defoliated mats more
subject to flood damage.
Prior to the end of the 1973 growing season, no effort has been made to intro
duce the Argentine flea beetle, (Agasicles hygrophila) to biologically control the
growth of alligatorweed in Dannelly Reservoir. The density of alligatorweed
growth in a few localities along the old stream banks was sufficient during the
summer of 1973 to start a breeding- population of the Argentine flea beetle. It is
recommended that an effort be made as soon as possible to obtain sufficient stock
of the Argentine flea beetle to establish one or more breeding colonies on alligator
weed infestations growing around islands between river mile 140 and 150. Snch a
64

breeding stock of beetles should be available for distribution by the Jim Woodruff Project.
Within the same reach (from Cedar Creek to the Dam) of Dannelly Reservoir,
there is a widespread infestation of primrose along the shallow marginal shores of
islands as well as the mainland. Thus far, this plant has confined its growth to water
areas less than 2 feet in depth, and it is anticipated that the plant will continue to
spread throughout the lake and may eventually occupy a majority of the shallower water
areas of the Reservoir where conditions are favorable for its establishment and gro.vth.
Due to the growth habit, i. e. frequent rooting into bottom muds at nodes, this plant
has not been greatly affected by winter or early spring floods.
A third noxious rooted aquatic plant, coontail, occurs in scattered patches in
waters two to five feet deep between Cedar Creek and the Dam. The size of this infes
tation appeared very extensive in the lower 10 mile reach of the Reservoir in 1972,
but throug"hout the summer of 1973 it appeared that the infested area was somewhat
reduced. Possibly the late flooding and its associated turbidity was one factor that
acted as a deterrent to the spread of this weed in early SlImmer of 1973. The growth
of phytoplankton which restricted Secchi disc readings to 24 inches or less helped
retard the spread of coontail for the remainder of 1973 growing season. This plant
has the potential for invading all water areas shallower than 5 feet or a total of
5,000 acres in Dannelly Reservoir.
Limited stands of cattails were scattered along the lake and island shores
throughout the lower sector of Dannelly Reservoir. In no instance has it been noted
that cattails invaded the area below normal water level. This condition resulted
65

from the almost constant elevation of the pool in this Reservoir.
Arrowhead was observed growing in the same habitat as that occupied by cat
tails during the summer of 1973. At that time, the area occupied by the average
arrowhead patch was not as large as those of cattails, but the patches of arrow
head were more widely scattered.
Giant cutgrass (Zizanopsis miliacea) was not observed in Dannelly Reservoir
in either 1972 or 1973. This does not mean that this noxious plant may not be
present, rather it indicates that this plant has not become established in this lake.
However, Dannelly Reservoir is a relatively young impoundment, and aqnatic plant
invasions and associated developing populations are still in their infancy.
Other aquatic species observed include; water willow, lizzard tail, and button
bush. A tabular location, including the species and area of infestation, of major
rooted aqnatic plants in Dannelly Reservoir is given in Table 16.
The maximum area subject to infestation by alligatorweed, primrose, coon
tail, and possibly some other species of submersed and emersed aquatic weeds is
estimated to be 5,000 acres. In addition, 325 miles or more of the shoreline is
adaptable to invasion by cattails, arrowhead, sedges, rushes, and giant cutgrass.
The ultimate development of the noxious plant population will be governed by metero
logical, operational, and pollution factors which at present are unlulOwn. However,
the latter two factors are man-controlled and serious consideration of each opera
tional program and their interaction should be undertaken in the very near future.
In the case of pollution abatement, it is evident from the nitrogen and phosphorus
input and output data that any reduction in phosphorus input can only result in a
66

Table 16. Areas on Dannelly Reservoir infested with rooted aquatic weeds,located by river miles indicated in the September, 1972, edition
of Alabama River Navigation Charts.
River Side of Embayment Species of Area, acresmile river weed
132.5-.34 East & West Coontail 250AlliatorweedArrowhead
134-135 East & West X Coontail 150+AlligatorweedArrowhead
East X Waterlily 10Cattails
135-136 East Coontail 80CattailsAlligatorweedArrowhead
136-137 East & West Coontail 40East & West Cattails 1+East & West ArrowheadEast & West Alligatorweed
137-138 East & West CoontailEast & West CattailsEast & West AlligatorweedEast & West Arrowhead
138-139 East & West CoontailEast & West AlligatorweedEast & West CattailsEast & West Arrowhead
139-140 East & West Coontail 5East & West Primrose 1East & West Arrowhead
67

Table 16. cont'd.
River Side of Embayment Species of Area, acresmile river weed
139-140 East & West AlligatorweedEast & West CattailsWest Waterwillow
140-141 East CoontailEast & West PrimroseEast & West AlligatorweedEast Cattails
141-142 East CoontailEast AlligatorweedEast PrimroseEast CattailsEast Arrowhead
142-143 East & West CoontailEast & West CattailsEast & West AlligatorweedEast & West PrimroseEast & West Arrowhead
143-144 East CoontailAlligatorweedCattailsArrowheadPrimrose
144-145 West AlligatorweedCattails
145-146 East & West AlligatorweedWest Cattails
146-147 East & West AlligatorweedArrowhead
68

Table 16, cont'd.
River Side of Embayment Species of Area, acresmile river weed
147-148 East & West AlligatorweedArrowheadBladderwort - Primrose
148-149 East & West AlligatorweedArrowheadPrimrose
149-150 East & West AlligatorweedArrowheadPrimroseCattails
150-151 East AlligatorweedPrimroseCattailsArrowhead
151-152 East AlligatorweedCattailsArrowhead
152-153 East & West AlligatorweedArrowhead
153-154 East & West AlligatorweedArrowhead
154-155 East & West AlligatorweedArrowhead
155-156 East & West AlligatorweedArrowhead
156-157 East & West AlligatorweedArrowhead
69

Table 16, cont'd.
River Side of Embayment Species of Area, acresmile river weed
157-158 East & West AlligatorweedArrowhead
158-159 East & West AlligatorweedArrowhead
159-161
161-173 AlligatorweedArrowheadPrimrose
70

decrease in phytoplankton production which will result in less turbidity and an
increase in submersed weed infestations. Constant pool elevations, which are
desirable during the early spring fish spawning periods, may not be desirable dur
ing the colder months of the year on this Reservoir, particularly if a serious
submersed weed infestation should occur. If a submersed weed problem should
develop on this Reservoir, the cheapest and most efficient means of eliminating
large infestations of such a plant as coontail would be a 2 to 3 foot draw-down during
the colder months of the year. Such a draw-down would only have to extend over a
4 to 6 week period to be very effective.
Since Dannelly Reservoir has such an eJ\i:ensive area of shallow waters over
lying a rich bottom soil, efforts should be made to use every means available to
reduce the probability of developing any aquatic plant problem.
As mentioned above, the best control for alligatorweed would be the introduc
tion of the Argentine flea beetle. Biological conti'ol by use of herbivorous fish
would be the best control agent for both primrose and coontai!. A limited use of an
approved granular herbicide might sometime be considered if the submersed or
emersed weeds should invade an off-river public use area, An approved herbicide
might also be considered for use as a spray to control marginal weed growths if
they invade and become established in a public use area. At present, the only
control technique to be put into effect as soon as possible is the inti'oduction of the
Argentine flea beetle to reduce the spread of alligatorweed in shallow water areas.
71

5. Description of the Fishery.
Prior to, and throughout the time this impoundment has existed very limited
studies have been conducted to determine (1) the species of fish present, (2) the
abundance of each species in the total population, (3) the condition of individuals
of each species, (4) the availability of fish-food organisms, and (5) the prevalence
of disease and parasite infestations. The available information on each of these
aspects of the William "Bill" Dannelly Reservoir is summarized in this section.
Most of the information presented in this report was gathered in 1972 and 1973.
No pre-impoundment data on the stretches of streams within this reservoir are
available for comparative purposes.
5-A. Warm-water species of fish in William "Bill" Dannelly Reservoir. The
earliest studies of the fishes in the Alabama River system were conducted in the
1880's. Since that time several icthyologists have collected in this area and have
added to the total list of species that have existed in this stretch of the river.
These findings were summarized in 1968 by Smith-Venez, and a check list of
known and donbtful species was prepared. The warm-water species comprising
this list were divided into three groups; sport, commercial, and others, a~
presented in Table 17.
The separation of the species of fish in the Alabama River into sport, com
mercial, and other catergories is not wholly justifiable in the overall ecology of
any particular aquatic habitat. The sport fish consists of those species generally
songht by the various types of hook and line fishermen. Thus, in a true sense
72

Table 17. A check list of warm-water species believed to be present inthe Alabama River, separated into game, commercial, andmiscellaneous groupings.
Game Species
Redfin pickerel
Chain pickerel
White bass
Striped bass
Rock bass
Flier
Warmouth
Green sunfish
Orangespotted sunfish
Bluegill
Dollar sunfish
Longear sunfish
Red-ear sunfish
Spotted sunfish
Spotted bass
Largemouth bass
White crappie
Black crappie
Walleye
73
Esox americanus
Morone chrysops
Morone saxatilis
Ambloplites rupestris
Centrarchus macropterus
Chaenobryttus gulosus
Lepomis cyanellus
Lepomis humilis
Lepomis macrochirus
Lepomis marginatus
Lepomis megalotis
Lepomis microlophus
Lepomis punctatus
Micropterus punctulatus
Micropterus salmoides
Pomoxis annularis
Pomoxis nigromaculatus
Stizostedion vitreum

Commercial Species
Paddlefish
American eel
Carp
Quillback
Highfin carpsucker
Blue sucker
Creek chubsucker
Lake chubsucker
Sharpfin chubsucker
Alabama hogsucker
Smallmouth buffalo
Spotted sucker
River redhorse
Black redhorse
Blacktail redhorse
Blue catfish
Black bullhead
Yellow bullhead
Brown bullhead
Channel catfish
Table 17, cont'd.
Polyodon spathula
Anguilla rostrata
Cyprinus carpio
Carpiodes cyprinus
Carpiodes velifer
Cycleptus elongatus
Erimyzon oblongus
Erimyzon sucetta
Erimyzon tenuis
Hypentelium etowanum
Ictiobus bubalus
Minytrema melanops
Moxostoma carinatum
Moxostoma duquesnei
Moxostoma poecilurum
Ictalurus fm'catus
Ictalurus melas
Ictalurus natalis
Ictalurus nebulosus
Ietalurus punetatus
74

Table 17, cont'd.
Commercial Species, cont'd.
Flathead catfish
Freshwater drum
Striped mullet
Miscellaneous Species
Chestnut lamprey
Southern brook lamprey
Least brook lamprey
Shovelnose sturgeon
Spotted gar
Langnase gar
Alligator gar
Bowfin
Alabama shad
Skipjack herring
Gizzard shad
Threadfin shad
Mooneye
Stoneroller
Silverjaw minnow
Cypress minllow
75
Pylodictis olivaris
Aplodinotus grunniens
MugU cephalus
Ichthyomyzon castaneus
Ichthyomyzon gagei
Lampetra aepyptera
Scaphirhynchus platorynchus
Lepisosteus oculatus
Lepisosteus osseus
Lepisosteus spatula
Amia calva
Alosa alahamae
Alosa chrysochloris
Dorosoma cepedianum
Dorosoma petenense
Hiodoll tergisus
Campostoma anomalum
Ericymba buccata
Hybognathus~

Miscellaneous Species, cont'd.
Silvery minnow
Speckled chub
Bigeye chub
Silver chub
Bluehead chub
Golden shiner
Burrhead shiner
Emerald shiner
Rough shiner
Pretty shiner
Alabama shiner
r roncolor shiner
Rainbow shiner
Striped shiner
Fluvial shiner
Pugnose minnow
Sailfin shiner
Mountain shiner
Taillight shiner
Silverhand shiner
Flagfin shiner
Table 17. cont'd.
Hybognathus nuchalis
Hybopsis aestivalis
Hybopsis amblops
Hybopsis storeriana
Nocomis leptocephalus
Notemigonus crysoleucas
Notropis asperifrons
Notropis atherinoicles
Notropis baileyi
Notropis bellus
Notropis callistius
Notropis chalybaeus
Notropis chrosomus*
Notropis chrysocephalus
Notropis edwardraneyi
Notropis emiliae
Notropis hypselopterus*
Notropis linls*
Notropis maculatu s
Notropis shumardi
Notropis signipinnis*
76

Miscellaneous Species, cont'd.
Si Iverstripe shiner
Weed shiner
Tricolor shiner
Sl<ygazer shiner
Blacktail shiner
Mimic shiner
Bluenose shiner
Sand-loving shiner
Bluntnose minnow
Bullhead minnow
Creek chub
Black madtom
Tadpole madtom
Speckled madtom
Frecklebelly madtom
Freckled mad tom
Pirate perch
Atlantic needlefish
Starhead topminnow
Table 17, cont'd.
Notropis stilbius
Notropis texanus
Notropis trichroistius*
Notropis uranoscopus
Notropis venustus
Notropis volucellus
Notropis welaka
Notropis sp. cf. longirostris
Pimephales notaL1.1s
Pimephales vigilax
Semotilus atromaculauls
NoL1.ll'Us funebris*
Notul'US gyrinus
NotUl'US leptacanthus
Noturus munitus
Notunls nocL1.1rnus
Aphredoderus sayanus
Strongylura marina
Fundu Ius notti
77

Table 17, cont'd.
Miscellaneous Species, cont'd.
Blackspotted topminnow
Southern studfish
Mosquitofish
Brook silverside
Banded sculpin
Bauded pygmy sunfish
Crystal darter
Naked sand darter
Scaly sand darter
Bluntnose darter
Swamp darter
Harlequin darter
J ohnlly darter
Goldstripe darter
Cypress darter
Rock darter
Speckled darter
Gulf darter
R edfin darter
Blackwater darter
78
Fundulus oli vaceus
Fundu lus stellifer
Gambusia affinis
Labidesthes siccnlus
Cottus carolinae
Elassoma zonatum
Ammocrypta asprella
Ammocrypta beani
Ammocrypta vi vax
Etheostoma chlorosomum
Etheostoma f"llsiforme
Etheostoma histrio
Etheostoma Iligrum
Etheostoma parvipinne*
Etheostoma proeliare
Etheostoma rupestre
Etheostoma stigmaeum
Etheostoma swaini
Etheostoma whipplei
Etheostoma zoniferum

Miscellaneous Species, cont'd.
Logperch
Freckled darter
Blackside darter
Blackbanded darter
River darter
Stargazing darter
Table 17, cont'd.
Percina caprodes
Percina lenticula
Percina maculata
Percina nigrofasciata
Percina shumardi
Percina uranidea
* Probably not found in the Alabama River proper, but in tributary creeks.
79

the catfish should be included in this group because many bank fishermen would
prefer these species over most others in the river. Likewise, the commercial
group consists of those species generally sought be commercial fishermen. These
include all species that are allowed (by law) to be openly sold in commerce. This
is an understandable regulation since these are the most abundant species of edible
fishes in most ri vel's. The name of the third group, others, implies that this
gronp of species is of no value since the fish are not consumed by humans. In the
minds of many sportsmen this means that these species are wholly detrimental to
sport and commercial fish production in rivers and large impoundments. This is
an erroneous conclusion for each of these species has a role in maintaining a
balance within the community. Certainly the feeding habits of many of these species
of non-game and non-commercial species must be extremely beneficial in the
breakdown of many organic materials which enter and tend to accumulate in surface
waters. Their conversion of this waste into food for the more desirable game and
commercial species of fish is one major aim of reservoir fisheries management.
In concluding the discussion of this grouping of species of fishes from the
Alabama River, let it be made clear that no information exists which would indi
cate that anyone of these species should be eliminated. Under certain conditions
the elq)ansion of a population of one or more species may diminish the production
of more desirable species within the impoundment. It is the purpose of fisheries
management to prevent or correct such unfavorable conditions when they develop.
80
5-B. Cold-water species of fish in William "Bill" Dannelly Reservoir. None.
5-(;. The downstream species from William "Bill" Dannelly Reservoir.
According to the hest information available today, the same species of warm-water
fish exist in the tailwaters that exist in William "Bill" Dannelly Reservoir.
5-D. Rare and endangered species. The Alabama Department of Conservation
and Natural Resources has prepared a list of all those species of fish that might
be considered rare or endangered in the surface waters of Alabama. Prior to the
construction of dams on the Alabama River, the salt-water striped bass migrated
up this stream each spring to spawn in the tailwater area below Jordan Dam on the
Coosa River and Thurlow Dam on the Tallapoosa River. Since the closure of Mill
ers Ferry Dam in 1969 there has been no upstream migration ancl no recorded
spawning by any impounded striped bass on this drainage basin.
5-E. Fish-food organisms. In 1972 a biological survey was made of the
Alabama River Basin between Fort Toulouse and Claiborn Lock and Dam by per
sonnel of Auburn University's Department of Fisheries and Allied Aquaculture.
The information presented in this plan was obtained from artificial (Plexiglass)
substrate samplers that were strategically placed in the river between the
Hammermill Plant site and Millers Ferry Dam.
The sampling devices were set along each bank of the river where waters were
10 or more feet in depth. TI,e samplers were suspended on a weighted line and
placed so that it collected organisms appro>..'imately 2 feet above the river bottom.
81

The sampling season extended from June through September, with each sampling
period extending for 21 days. The retrieved samplers were returned to the lab
oratory in river water and the macroinvertebrates were collected, sorted, and
preserved for counting and verification of identification.
In setting and retrieving these samplers biologists noted hatches of adult
mayflies on several occasions. The presence of these insects indicated that this
aquatic habitat was suitable for the production of fish-food organisms. Examina
tion of the collections obtained from the plate samplers verified this conclusion.
A listing of the macroinvertebrate forms collected from various areas on
William "Bill"Dannelly Reservoir in 1972 are presented in Table 18.
While a diversity of organisms was obtained during this study, and it was
generally concluded that they indicated that the waters in this reservoir were suit
able mediums for their reproduction and development, the quantitative data did
not indicate their presence in any great abundance. This is not surprising since
the sampling was generally done in areas where water depths were 10 or more feet
and where there was a current. Such is the habitat throughout the upper three
fourths of the reservoir where all of the inundated stream channels had steep banks.
Thus, it appears that the liquid portion of ti,e habitat was satisfactory for the pro
duction of macroinvertebrates, but the configuration of the stream channel was
generally too deep for this development to occur. In the lower segment of the
reservoir where waters inundated the river flood plains, ti,ere existed a bottom
that appeared favorable for macroinvertebrate production. One factor, siltation,
82

Table 18. lVlacroinvertebrates collected from Dannelly Reservoir. Summer, 1972.
EphemeropteraStenonemaUnidentified Ephmeroptera
TrichopteraCheumatopsycheCyrnellusHydropsycheNeurecllpsisStactobiella
DipteraChironomidae
AblabesmyiaCalopsectraChironomusCricotopusCryptochironomusDicrotendipesGlyptotendipesPolypedilumPsectrocladiusPseudochironomus
CeratopogonidaeUnidentified Ceratopogonic1ae
83

resulting from flooding and dredging may at times render certain portions of this
shallow water area unsuitable for fish-food prodnction.
Again, it should be pointed out that William "Bill" Dannelly Reservoir is
generally a fairly deep run-of-the-rivel' impoundment, and much of its bottom
area is largely unsuitable for bottom organism production. On the otherhand it
does support a fair population of phytoplankton and must depend upon this as its
primary source of fish-food organisms.
5-F. History of parasite and disease incidents in fish population. For the
4 years that William "Bill" Dannelly Reservoir has been impounded there have
been incidents of fish mortality when all water quality parameters have been
ideal for fish to grow and reproduce. One major cause of warm weather fish
kills has been a bacterial infection caused by the Aeromonas group. Generally
this type of infection is recognized by the large, red, boil-like lesions on the
body of the fish.
Three factors, operative in the spring time, tend to incite the spread of both
parasite and disease infections. A rising water temperature, provides the op
timum parasite and disease development range (65 to 75 0 F). A second factor
is that this temperature range is the same that stimulates fish spawning and
many species of sunfishes and bass are congregated and sweeping nests. Thus,
there is crowding of fish into a restricted area, and these fish are aggressive
and strongly defend their nesting territory. This results in much physical
contact and fighting among many individuals and provides ideal conditions
84

for spread of infections. A third factor is that the fishes condition is generally
at its lowest ebb during this early spring period making the fish more snsceptible
to disease and parasite attacks.
Current trends in disease and parasite infections in lakes of the Southeastern
United States indicate that infections are generally more prevalent during warm
months, but may occur in varying degrees throughout the year. Also, it has been
noted that under certain conditions the spread of infection in a large impoundment
may intensify over a period of several years.
There are numerous fish disease organisms that have been isolated and
identified from fish collected throughout the Alabama River basin. These listings
are presented in Tables 19 and 20.
Needless to say, tile loss of mostly harvestable-sized fisb to disease and
parasite infections is undesirable, nevertheless it indicates that considerably more
harvestable sized fish were present in the lake than were being harvested by
fishermen. To date no satisfactory h"eatment has been devised that could be used
to combat the spreading of disease and parasite infections among the fishes of
William "Bi ll"Dannelly Reservoir.
5-G. History of fish lulls. During the 4 years that William "Bill"Dannelly
Reservoir has been impounded there have been no instances of large scale fish
lulls (from causes other than disease and parasites). Due to a lack of stratification
in the reservoir waters, any localized kills have resulted from accidental release
or addition of toxic compounds into the reservoir waters by industry or agriculture.
85

I. Amiidae
Table 19. Fish par:lsites in the Alabama River*
CestodaHaplobothriumProteocephalus
AcanthocephalaNeoechinorhynchus
II. Anguillidae CrustaceaErgasilus
III. Catostomidae - FungiSaprolegnia
ProtozoaGlossatellaMyxobilusMyxosoma
TrematodaAnoncohaptorAplodiscusDactylogyrusGyrodactylusMyzotremaOctomacrumPellucidhaptorPseudomurraytremaTriganodistomum
CestodaBiacetabu hunIsoblaridacrisMonobothriumProteocephalus
NematodaCapillariaPhilometraSpinitectus
86

III. (cont'd).
Table 19, cont I d.
AcanthocephalaAcanthocephalusNeoechinorhynchusPilum
LeechPiscicolariaPlacobdella
CrustaceaArgulusErgasilus
IV. Centrarchidae - FungiSaprolegnia
ProtozoaEpistylisMyxobilatusTrichoclinaMyxosomaGlossatellaMyxidium
TrematodaActinocleiclusAnchoradiscusClavunculusCrepiclostomumCryptogonimusGyroclaetylusLyrocliscusNeascusPhylloclistomumPisciamphistomaPosthodiplostomumUrocleiclusCleiclocliscusUveliferLeucerutherusClinostomum
87

IV. (cont'd).
V. Clupeidae
Table 19, cont'd.
CestodaBothriocephalusHaplobothriumProteocephalus
NematodaCamallanusCapillariaContracaecumHedrurisPhilometraSpinitectu sSpiroxys
AcanthocephalaAcanthocephalusEocollisLeptorhynchoidesNeoechinorhynchu sPilumPomphyrhynchu s
LeechCystobranchusIllinobdellaPisciolaria
CrustaceaErgasilusActheresLernea
MolluscaGlochidiulTI
ProtozoaIchthyophthiriusPlistophoraTrichodinaScyphiclia
89

V. (cont'd).
VI. Cyprinidae
Table 19. cont'd.
TrematodaPseudoanthocotyloidesMazocraoides
CestodaBothriocephalus
NematodaCapillariaHedruris
AcanthocephalaGracilisentisTanaorhamphus
CrustaceaErgasilus
ProtozoaEpistylisGlossatellaIchthyophthiriusMyxobilatusMyxosomaTrichodinaScyphidia
TrematodaAlloglossic1iumCrepidostomumDactylogyrusGyrodaetylu sNeascusPosthodiplostomumPseudacolpenteron
CestodaAtractolytocestusBiacetabulumKhawiaPenarchigetesProteoecephalus
88

VI. (cont'd).
VII. Esocidae
VIII. Ictaluridae
Table 19, cont'd.
NematodaRhabdochona
LeechPlacobdella
CrustaceaArgulusErgasilusLernaea
MolluscaGlochidia
TrematodaCrepidostomum
CestodaProteocephalus
NematodaHedmrisPhilometraRhabdochona
AcanthocephalaNeoechinorhynchu sPilum
CrustaceaErgasilusLernaea
FungiSaprolegnia
ProtozoaChilodonCostiaGlossatellaHenneguyaIch thyoph thi riu s
90

VIII. (cont'd).
Table 19. cont'd.
Protozoa (cont'd).ScyphidiaTrichodinaTrichophrya
TrematodaAlloglossidiumCleidodiscusClinostomumGyrodactylusPhyIIodistomumPosthodiplostomum
CestodaCorrallobothrium
NematodaContracaecumRaphidascarisSpinitectus
Acanth ocephalaNeoechinorhynchus
LeechCystobranchus
CrustaceaAchtheresArgulusErgasilusLernaea
IX. Lepisosteidae - TrematodaDidymozeidae
CestodaProteocephalus
NematodaHedruris
91

Table 19, contrd.
IX. (contrd). CrustaceaArgulusErgasilus
X. Polyodontidae - TrematodaDiclybothrium
CestodaMarsipometra
NematodaCamallanus
CrustaceaErgasilus
XI. Sciaenidae TrematodaCrepidostomumAlloglossidium
NematodaContracaecumCystidicola
CrustaceaErgasilusLernaea
MolluscaGlochidia
* Based largely on class collections; slides in possession of Dr. Wilmer A. Rogers,Auburn University Department of Fisheries and Allied Aquacultures.
92

Table 20Viral, bacterial and fungal diseases of reservoir fish *
I. Catostomidae
A. Viruses-NoneB. Bacteria
1. Aeromonas liquefaciens (Syn. : A. hydrophila, A. punctata)2. Pseudomonas fluorescens3. Chondrococcus columnaris
C. Fungi1. Saprolegnia2. Achlya
II. Centrarchidae
A. Viruses1. Lymphocystis
B. Bacteria1. Aeromonas liquefaciens (Syn. : A. hydrophila, A. punctata)2. Pseudomonas fluorescens3. Chondrococcus columnaris
C. Fungi1. Saprolegnia2. Achlya3. Branchiomyces
III. Clupeidae
A. Viruses-None
B. Bacteria1. Aeromonas liquefaciens (Syn.: A. hydrophila, ~ punctata)2. Pseudomonas fluorescens3. Chondrococcus columnaris
C. F\mg11. Saprolegnia2. Achlya
93

Table 20, cont'd.
IV. Cyprinidae
A. Viruses-None
B. Bacteria1. Aeromonas liquefaciens (Syn.: A. hydrophila, A. punctata)2. Pseudomonas fluorescens3. Chondrococcus columnaris
C. Fungi1. Saprolegnia2. Achlya
V. Esocidae
A. Vinlses- None
B. Bacteria1. Aeromonas liquefaciens (Syn.: A. hydrophila, A. punctata)2. Pseudomonas fluorescens3. Chondrococcus columnaris
C. Fungi1. Saprolegnia2. Achlya3. Branchiomyces
VI. Ictaluridae
A. Viruses1. Channel catfish virus (has not been found in reservoirs)
B. Bacteria1. Aeromonas liquefaciens (syn. : A. hydrophila,~ punctata)2. Pseudomonas fluorescens3. Chondrococcus columnaris
C. Fungi1. Saprolegnia2. Achlya
* Information from Dr. John A. Plumb, Auburn University Department of Fisheriesand Allied Aquacultures.
94
Since no major kills have occurred to date attributable to low dissolved Ol-:ygen
concentrations in reservoir waters, this does not eliminate this factor as a poten
tial for future kills, but it does lessen the probability that it will occur routinely.
While the Millers Ferry Powerhouse is designed to normally draw the lake
level down one foot, it has on one or more occasions exceeded its desig11ed opera
tion pattern by 100 percent with a consequent drawdown of 2+ feet on some of the
sballower flooded plains. To date, these eAireme drawdown conditions have
existed for less than 24 hours and have not posed any serious hazzards to aquatic
life that has been stranded in pot-hole areas within this drawdown region. However,
under adverse stream flows, caused by natural or man made conditions, such
excessive use of water by this hydroelectric facility could result in considerable
loss of stranded fish as well as a loss in fish-food organisms production.
5-H. Establishment of William "Bill"Dannelly Reservoir fishery including
flooding schedule. The origin of the freshwater fishery in Dannelly Reservoir was
the fish population inhabiting the Alabama River and its tributaries between Jones
Bluff Lock and Dam, and the site of Millers Ferry Dam. As the waters in this
impounded portion of the river began to rise and flood the banks and flood plains,
it prOVided an enriched habitat for the expanded production of fish and fish-food
organisms. This additional food supply resulted in an increased reproductive and
growth rate for most species of fish. This fish population continued to expand
throughout the filling period and for sometime after the reservoir reached elevation
80 feet msl.
95

This reservoir started filling in June of 1968 and after it reached elevation
72 feet msl it had to be drawn down in March of 1969 to allow repairs on the
coffer dam used for powerhouse construction. It resumed refilling during the
fall but had to be held at 72 feet for construction that winter. The reservoir
finally filled in the spring of 1970.
In July, 1973, after the native species of fish had an opportunity to become
established, this reservoir received a stocking of striped bass fingerlings. This
stocking was a part of the state of Alabama's program to determine if a resident,
reproducing population of this species of fish could be established in this habitat.
5-1. History of species composition, relative abundance, and condition within
each species including methods used to obtain fish samples. One of the major
problems that has confronted fisheries biologists has been the lack of techniques to
accurately estimate the population of fish that exists in large impoundments. To
date, the estimates that are available in various publications and in biologists'
files are open to criticism, but no one can say that they are unreliable. In large
ponds and small lakes it is usually possible to get an accurate count of the popula
tion by draining the water from the basin, collecting all of the fish and separating,
measuring, counting and weighing each species present. While this destroys the
fish population it does allow an accurate count and weight of the fish present at the
moment they were collected. In large impoundments on a river this technique
is impossible and unwarranted for many reasons.
96
5-1-1. Methods of sampling fish populations. In the search for techniques
that would provide reliable estimates of the fish population in a large impoundment,
a number of methods for collecting fish samples have been employed. A listing of
some of the more commonly used methods includes: seining, netting (gill, trammel,
and hoop), trapping (baskets and boxes), trawling (a relatively new technique for
freshwaters), poisoning (rotenone and antimycin), and electrofishing. Coupled
with the use of each of these methods some investigators have collected, marked,
released, and then recaptured fish in an attempt to estimate the standing crop of
fish in an area by establishing ratios between marked and unmarked fish captured
by one of these sampling methods.
5-I-l-a. Rotenone sampling. The most popular technique employed
in recent years has been area sampling by use of rotenone. Tills method em-
ploys the use of a block net, willch should have a mesh no larger than 3/8 inch,
a sufficient depth to reach from the surface to the lowest point on the bottom
around the perimeter of the sample area, and sufficient length to completely
surrolmd or block an area of 2 or more acres. This net is very carefully set
around the sample area several hours prior to the actual application of the rotenone.
It is common practice to set the block net at night since there is less disturbance
of fishes within the area and possibly more fish are in the shallow water areas
during darkness. Care must be taken in setting the net to have the lead-line in
contact with the bottom at all points around the sample area. [t is also helpful
to leave tIlls net in place for at least a day after rotenoning or lmtil the bloated
97
fish are all recovered to prevent their floating all over the lake.
To determine the quantity of rotenone required to collect fish, the volume of
water within the sample area is determined. The quanitity of rotenone to apply is at
least sufficient to give a concentration of 0.05 ppm rotenone for the entire volume
of water within the area. After the quantity of rotenone needed is measured it is
mixed with several volumes of water, and the mixture is pumped down a perfor
ated hose to produce a uniform concentration from surface to bottom throughout
the sample area. The usual application pattern is to block all four sides with a
wall of rotenone and then make diagonal crosses from corner to corner.
Sufficient potassium permanganate (2 pounds of KMn04 for each pound of 5
percent rotenone compound used) should be on hand to start neutralizing the
rotenones in the waters outside the block net a few minutes after the fish begin to
surface in the sample area. Care should be taken to apply the KMn04 far enough
from the net (at least 20 It) to prevent undue chemical damage to the rope and webbing.
For best results in recovering fish, sampling with rotenone should be done
when the water temperature within the area to be sampled is no lower than 75
degrees. The higher the water temperature when rotenone is applied the faster
fish will react, also those fish which sink to the bottom when killed will bloat and
float much quicker allowing greater total recovery as well as more accurate
weights and measurements.
It is also imperative that an adequate crew equipped with sufficient boats, nets,
and containers be on hand when sampling starts, and remain available for the
second day pickup. AII pickup crewmen should be advised to pick up all fish
98

seen whatever species or size it might be.
In addition to collecting the fish from the sampled area, there must be an
adequate sorting, measuring, and weighing crew equipped with accurate measuring
boards on sorting tables, sufficient inch-group containers for holding sorted
fish, and accurate scales for weighing the various inch-groups of each species.
Accurate identification of species, and accurate records of numbers and weights
of each inch-group for each species must be stressed.
If this method is used to sample a fish population, and great care is taken to
collect all fish fTom within the sample area, and to record accurately all weights
and numbers of each inch-group of each species, then a reliable estimate of the
fi sh population within this type habitat in the reservoir may be obtained.
When selecting sites for rotenone sampling of fish populations it is important
that the specific areas chosen be representative of as large an area of comparable
habitat in the lake as possible. Rotenone sampling can be effective in water depths
to 20 feet, but at greater depths the dispersion of toxicants is very difficult. Also,
since block net must reach from the surface to the bottom of the sample area,
use of this technique is restricted to relatively shallow water. Likewise, stumps
and snags must be minimal to allow setting of block net and also to allow fTee
movement of fish collecting crews throughout the sample area.
5-I-l-b. Electrofishing. Eleetrofishing devices are currently
being used in sampling techniques that count or collect game, forage, or rough
99
species of fish in shallow water areas of rivers and impoundments. If such equip
ment is properly operated, and the biologists are careful in their capture and data
taking techniques, this fish sampling method results in practically no mortality to
the fish population. TIlis makes electrofishing advantageous over the rotenone
method so far as public relations are concerned.
The electrofisbing gear consists of a 110 volt, 60 cycle AC generator with at
least 3,000 watt output, a control panel with variable AC or DC voltage outputs, a
heavy duty 2-pole foot-operated switch, and an electrode system that can be an'ang
ed in various configurations to produce the desired electrical field. The specific
electrode configuration used to sample the fish populations in Corps lakes was a
square, i. e. a terminal electrode was located on the outermost end of each of the
2 booms some 12 feet in front of the boat and another electrode was located on
each of these booms some 6 feet behind the outermost ones. The width between
the tips of the booms was approximately 10 feet.
This electrofishing equipment was mounted on a wide beam, square bow, 16
foot aluminum boat powered by a 25 h. p. outboard motor. TIle bow section of
tins boat was covered with a square deck and fitted with a 3-foot high guard rail.
When operating, the electrodes were adjusted to be suspended about 5 feet into
the water. With the power supply operating the unit was adjusted to produce a
load of approximately 800 watts within the electrode field.
Two types of sampling of the fish population was accomplished by this electro
fishing operation. The biologist on the bow of the boat was equipped with a dip
100
net while the boat operator was equipped with a tape recorder. As the fish sur
faced in the electrical field they were identified, counted, and this data was re
corded on tape. Selected sizes of all species that were affected by the electrial
current were collected by net and their total length, depth, and weight were
determined and recorded. Scale samples were collected for age-growth deter
minations, and condition of the ovaries was examined in samples collected during
spawning season.
5-1-2. Fish population studies (Rotenone). There were no pre-impoundment
or no post-impoundment (through 1973) rotenone samples collected from the
William "Bill" Dannelly Reservoir area. The only fish population data, obtained
by rotenone sampling, for the Alabama Ri vel' were collected near Holley Ferry in
1954. This population information is presented in Table 21. It is included in this
plan to give some idea of the fish population that originally existed in the mid-stretch
of the Alabama River.
These river population data were summarized by methods proposed by Swingle
(1950) to describe the relationships and dynamics of balanced and unbalanced fish
populations. A brief summary describing the meaning of terms used in this
methodology of data evaluation are given below.
Balanced populations are defined as - "those capable of producing satisfactory
annual crops of harvestable fish. They were characterized by having (1) a definite
range in ratio of the weights of forage and piscivorous species, (2) a narrow range
in ratio I s of weights of small forage fishes to the weights of piscivorous groups,
101

Table 21. Fish population data collected by Rotenone Sampling of the Alabama Riverin thc vicinity of Holley Ferry (August, 1954).
Sample 1'0. 1 2 A ....erageLocation Mi. 131 Mt. 133Year 1954 1954 1954.Lbs/acre 259.40 1,780.22 1019.81AT 92.05 90.0 91. 0F/C 2.91 2.87 2.89
Species Lbs/a E AT Lbs/a E AT Lbs/n E AT
White bass 3.20 .20 3.10 1. GO .10 I. 55
Spotted bass 3.30 1. 30 2.40 1 L 80 .65 10.80 1.55 .97 6.60
Flathead cat£ish 4.50 1. 70 3.40 34.90 1. 90 24.90 19.70 1. 80 14.15
White crappie .06 .01 .03 .01
Blue catfish 35.60 13.70 35.60 628.10 35.00 557.60 331. 80 24.35 296.60
Channel catfish 103.60 39.90 100.90 210.90 1).80 163.30 157.25 25.85 132. 10
Misc. minnows 4.10 1. GO 2.05 .80
Dlucg11l 1. 00 .40 .50 1. 90 .10 1. 70 1. 45 .2[, 1. 10
LOllgcl'.r cunflsh .20 . 10 .26 .01 .10 .23 .05 .05
Rcdcar S\.:nflsh .40 .20 .40 .20 .10 .20
Frcsh""'ntcr drum 66.GO 25.60 64. 10 778.50 43.40 H3,30 422.55 34.53 406.20
Cltrps\lck(~r 17.20 6.60 16.50 1.14 .06 t. 14 9.17 3.33 8.80
Quillback 33.50 1. 90 33.50 11•. 75 .95 16. 75
SmallmOl.lth buff:,lo 8.4.0 3.20 8.40 28.00 1. GO 28.00 18.20 2.-W 18. ~o
Black redhorsc .60 .20 12.60 .70 12. GO 13.20 .45 6.30
Golden rcdhorse -1.60 .26 -1.60 2.30 .13 2.30
;"1ooneye 1. GO . 60 1. 50 13.10 .70 12.00 7.35 .65 6. 75
GiZ7tl.rd shad 2.00 .80 J. 50 5.00 .30 4.00 3.50 .55 2.75
Skipjacl, herring 10.70 ·\.10 1. 20 7.00 .40 4.20 8.S5 2.25 2. iO
Thrcadfln shad .10 . 10 .0& .05
Paddlcfl~h 17.20 1. 00 9.20 -LCO .50 .1. 60
StUq;l:OD 1. 26 .07 I. 26 .63 .03 .63
102

and (3) more than 33 percent of the total population weight in the form of fishes of
harvestable size".
The "e" class is composed of species that feed principally upon other fish
and cannot attain normal adult life without such food. The" F" class is composed
of all other species present in the population that feed principally upon plants,
planh1:on, insects, and other small aquatic invertehrates.
The "C" value is the weight in pounds of "c" class species and the" F" value
is the weight in pounds of the "F" class species. The range in Flc ratios in
balanced fish populations was from 1. 4 to 10. O. Populations with F/C ratios from
1. 4 to 2. a were overcrowded with "c" species. Balanced populations with FIC
ratios below 3 were inefficient due to the overcrowding of "c" species. This
condition was found to reduce the total weight of the population.
The FIC ratio was a relatively stable value, remaining almost constant de
spite variations in rate of fishing for" F" and "c" species. This ratio is useful
in comparing and determining the condition of fish populations.
The "Y" value in a population is the total weight in pounds of all fishes in the
"F" class which are small enough to be readily gulped by the average-size adult
in the "c" class. The YIc ratio is an expression of the food available to the "c"
class. The most desirable populations were in the range YIc ~ 1. a to 3. O.
The "AT" value is the percentage of total weight of a population composed of
fish of a harvestable size. In balanced ponds the range was from 33 to 90. The
most desirable populations had values between AT~ 60 to 85.
103

The "E" value of a species is the percentage of weight of a population composed
of that species.
The "F" class and also "F" species were subdivided into groups of "large",
1. e. fishes of harvestable size; "intermediate", 1. e. those too large to be eaten
by the "C" species and too small for harvest; and "small", 1. e. the fishes small
enough to be eaten by the average-sized individual in the large group of "C"
species in the population.
The "AF' value is the percentage of the total weight of the "F" class composed
of large fish. The "IF" and "SF" values are percentages of the total weight of the
"F" class composed respectively of the "intermediate" and "small fishes".
An "A F" = 35 appeared to be the minimum value found in desirable populations
and apparently expressed the maximum allowable depletion of the adult" F" species
if satisfactory production is to be maintained. The most desirable populations
were in the ran"e "A "= 60 to 80.o F
valu e range 15 to 40.
Satisfactory populations occurred in the "SF"
The "A F" "IF" and "SF" values were found to be dynamic values shiftingj' .,
with changes due to harvest, predation and natural mortality.
Pond studies indicated that harvest of adult "F" species increased the pounds of
"C" species per acre and that failure to harvest the former group resulted in a
decrease in the pounds of "C" species in the population.
Separation of various species into the various classes specifiecl in the popula-
tion analysis outlined above are given in Table 22 .
104

Table 22. Lengths (in inches) used to classify fish of different species as YOlmg,Intermediate, or Harvestable, and as Forage, Carnivorous, or Other. *
11l1errllC- ll:tn-e.·;i- C':Hnj\"-Youllg di:1tc aljlc F\1r:tgc 'JfOUS Or her
Spt'Cii.';5 h.~h h.,h Fi.:=h l:i~'h h.:=h I:ish
P:ldd]t'fi."h 0-12" 13-3\ " > 32" 0-12" > 12"::::p,I/!('d g:lf O~ $" D~ ID" > 20" ,\\1 Sizes
Lunglw."c g:u 0-12" 1:3-1';)" > 20" .\11 Sizcs,"';hCldnose g:tr O~ S" 1J-19" > 20" All SizesCizzard sh:1d 1~ 5" > G" O~ S" > S"~Iooncyc 1~ lj" 7-J I" > 12" O~ S" > 8"Gvldfi,;h 1~ 6" 7-10" > 11" O~ S" > 8"C:1rP 1~ '" 0-12" > 13" O~ S" > 8"(':\rp!"llckcl's 1~ 8" 0-12" > 13" O~ S" > S":\ort hern !lng: suek<'r 1~ 7" S~ 10" > 11" O~ S" :0: 8"Sm::lImolllh bufi:tlo 1~ 8" 0-12" > la" O~ S" > s"nil~rnollll; blllT:1lo 1~ 8" 0-12" > 13" o~ 8" > 8"Bl,,,k In:fT:llo 1~ 8" 0-12" > 13" O~ S" > S".-::hpr! hC';H[ fcdltorsc 1~ i" S-IO" > 11" O- S" > 8"Hin'r red horse I~ 7" S~IO" > 11" O~ S" > 8"Cold('11 fcdhorsC' 1~ 7" S-Ill" > 11" 0- 8" > S"Bllle l'atfi.-,;h I- S'" G- D" > 10" 0-10" > 10"Ch:mnc1e:J.tnsh 1- 5" G- ';)" > 10" 0-10" > 10"Flathead callisll 1- [)" (i-II" > 12" O~IO" > 10"\\"!Jitc bass 1- G" 7- S" > D" 0- G" > 6"\\-arrnouth I- 3" 4- 5" > 6" 0- ,j" > 5'"f3lucgill 1- 3" ·1- 5" > G" 0- £l" > :)"
Sp01!cd b:\53 I- I' ;j- 8" > 0" O~ ·l" > -1"L:irgcmolll h O:15S 1- 4" 5~ 0" > 10" 0- 4" > 4"\,"hile erappic 1- 3" 4- 7" > S" 0- H" > fl"BI:wk crappie 1- 3" '1- 7" > S" 0- G" > 6"S:luger 1- 8" 0-11" > 12" 0- G" > 6"fl'('.r,:h\\·atcr dnlTn 1- 5" 6- S" > 0" 0- 6" > 6".\Tisecllancous All All
Sm.'!]] Fbh Sizes Sizes
*From "An Evaluation of Cove Sampling of Fish Populations in Douglas Reservoir,Tennessee" in Reservoir Fishery Resources Symposium, 1967.
105

5-1-3. Fish population studies (electrofishing 1972-'73). The data
obtained by electrofishing in Dannelly Reservoir during the summers of 1972 and
1973 are summarized as the total number of each species of fish seen and the
number sighted per minute (Tables 23 and 24), and as the relative condition (KnJ
of the various species of fish collected and measured (Figure 6). Sampling sites
on this reservoir were restricted due to a lack of operational access areas dur
ing these sampling periods.
The data presented in Table 21 on the composition of the fish population of
the Alabama River in mid 1950's indicates that catfish made up approximately
52 percent of the total weight of the fish sampled, and that freshwater drum
accounted for another 34.5 percent of total weight. The bass and bream accounted
for 1. 48 percent, and gizzard and threaclfin shad accounted for only 0.6 percent
of total weight. It is interesting to note that largemouth bass, the most sought
after sport fish today, were not collected in either of these river samples.
The information in Table 22 on the composition of the fish population in
Dannelly Reservoir during 1972 and 1973, as determined by electrofishing, is
a reflection of the quieter, shallower water habitats that were created by Miller
Ferry Dam. Out of a total of 2,684 fish sighted in the electrode field, a total of
only 17 catfish and no freshwater drum were seen. On the other hand 172 bass
(mainly largemouth), 587 bream, and 68 crappie were sighted. Over 55 percent
(1,516 individuals) of the sighted fish were shad.
Thus, it is evident that these two sampling techniques, while carried out at
different times, were sampling two distinctly different fishery habitats. From
106
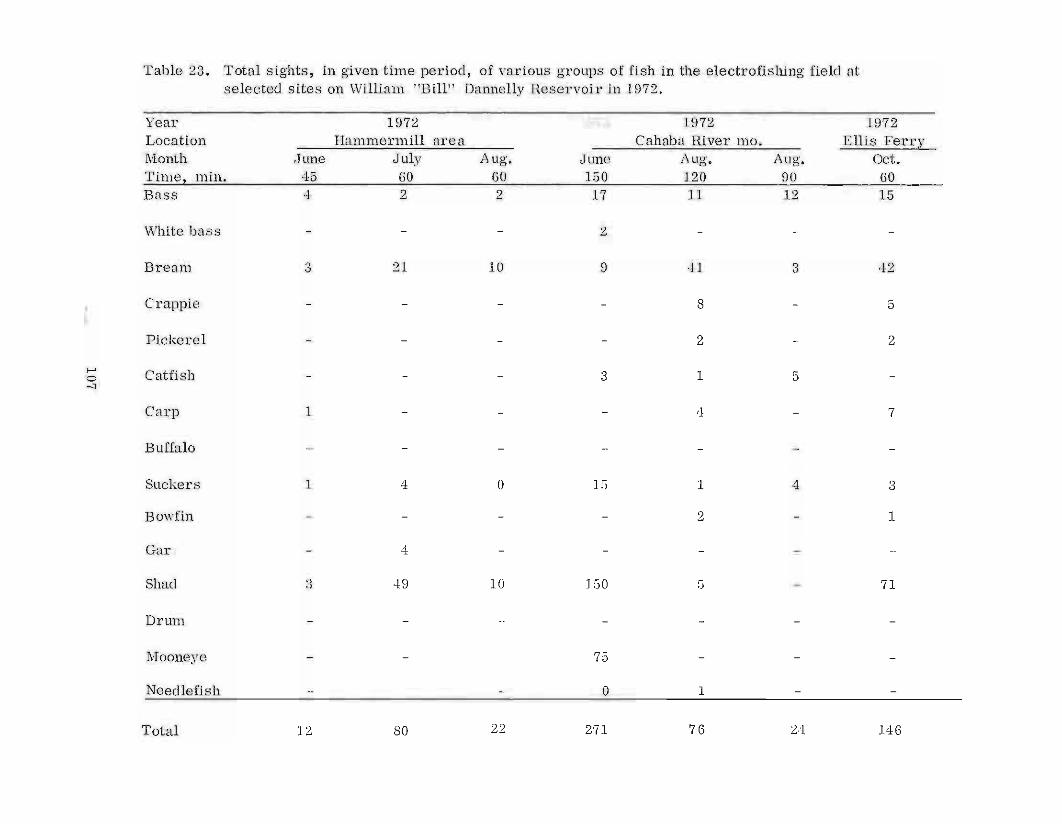
Table 23. Total sights, in given time period, of various groups of fish in the electrofishing field atselected sites on William "Bill" Dannelly Reservoir in 1972.
Year 1972 1972 1972Location Hammermill area Cahaba River mo. Ellis FerryMonth Jtme July Aug. Jtme Aug. Aug. Oct.Time, min. 45 60 60 150 120 90 60Bass 4 2 2 17 11 12 15
White bass - - - 2
Bream 3 21 10 9 41 3 42
Crappie - - - - 8 - 5
Pickerel - - - - 2 - 2
f-' Catfish 3 1 50 - --J
Carp 1 - - - 4 - 7
Buffalo
Suckers 1 4 0 15 1 4 3
Bowfin - - - - 2 - 1
Gar - 4
Shad 3 49 10 150 5 - 71
Drum
Mooneye - - 75
Needlefish - - 0 1
Total 12 80 22 271 76 24 146

Table 23, cont'd.
Year 1973 ,1973 1973 1973Location Bethel Branch & River Bluff B l'tt C Bouy 21 Bouy 18area oCJuec 11 0 r.Month Sept. June June JuneTime, min. 210 130 60 60 460
Bass 39 30 14 7 90
White bass 2
Bream 182 108 24 6 320
Crappie 21 6 17 6 50
Pickerel 17 1 6 7 31
Paddlefish - 3 - - 3,...0
'" Catfish 5 - 2 - 7
Carp 33 14 18 5 70
Buffalo - 1 - - 1
StIckers 21 4 - - 25
Bowfin 7 2 3 1 13
Gar - 1 16 2 19
Needlefish 1 - - - 1
Shad 226 265 88 519 1098
Total 554 435 188 553 1730
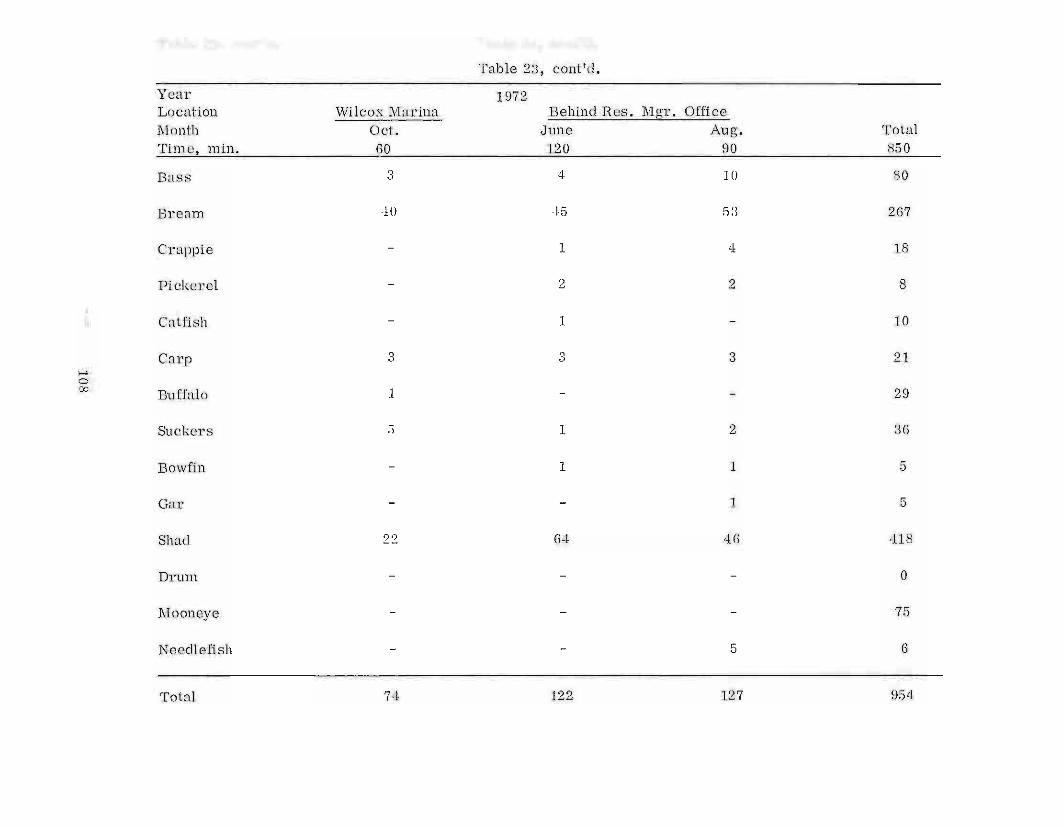
Table 23, cont'd.
Year 1972Location Wilcox Marina Behind Res. Mgr. OfficeMonth Oct. June Aug. TotalTime, min. 60 120 90 850
Bass 3 4 10 80
Bream 40 45 53 267
Crappie - 1 4 18
Pickerel - 2 2 8
Catfish - 1 - 10
Carp 3 3 3 21....000 Buffalo 1 29- -
Suckers 5 1 2 36
Bowfin - 1 1 5
Gar - - 1 5
Shad 22 64 46 418
Drum - - - 0
Mooneye - - - 75
Neecllefish - - 5 6
Total 74 122 127 954

Table 24. Average sights-per-minute of various groups of fish obtained by electrofishingat selected sites on Dannelly Reservoir, 1972-73.
Year 1972 1972 1972 1972Location Hammermill area Cahaba River mo. BigSwampCr Ellis FerryMonth Jnn Jul Aug Jun Aug Aug OctTime, min. 45 60 60 150 120 90 60
Bass .09 .03 .03 .11 .09 • 13 .25
White bass .01
Bream .07 .35 .17 .06 .34 .03 .70
Crappie .05 .08
Pickerel .01 .03
Catfish .02 <.01 .06
Carp .02 .03 .12
Buffalo
Snckers .02 .07 .10 <.01 .04 .05
Bowfin .01 .02
Gar .07
Shad .07 .82 .17 1. 00 .03 1. 18
Drwn
Mooneye .50
Needlefish < .01
Total .27 1. 33 .37
110
1. 81 .63 .27 2.43
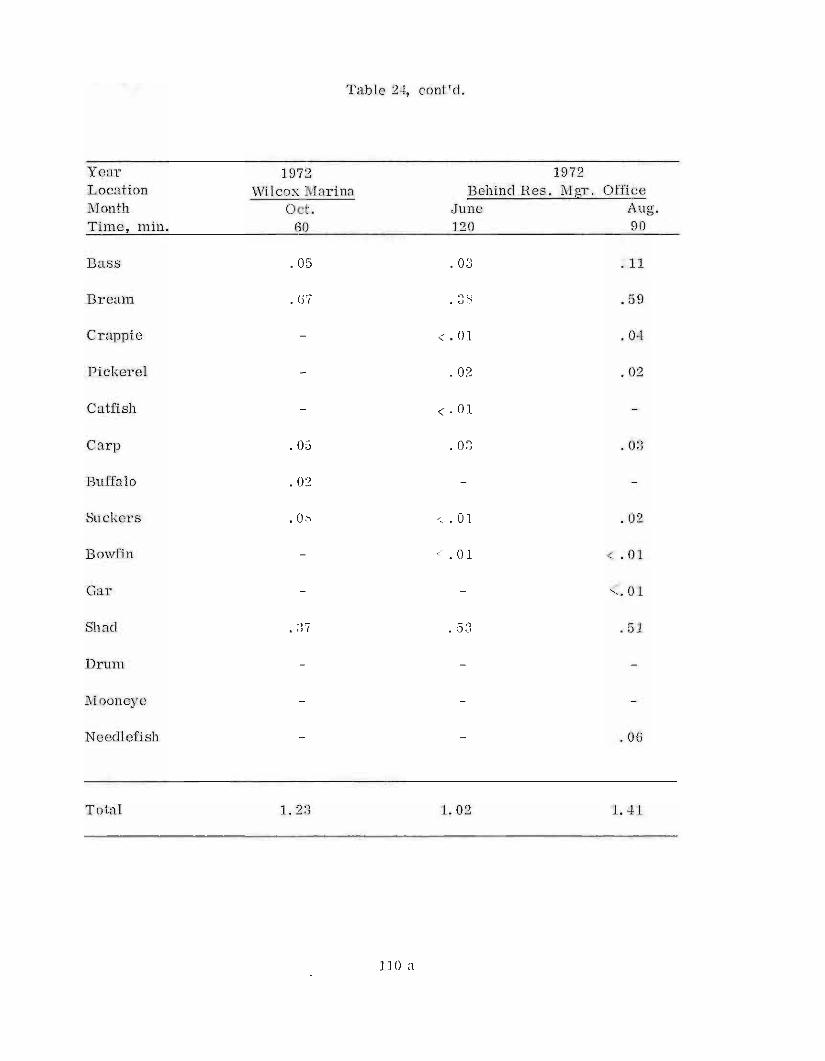
Table 24, cont'd.
Year 1972 1972Location Wilcox Marina Behind Res. MgT. OfficeMonth Oct. June Aug.Time, inin. 60 120 90
Bass .05 .03 .11
Bream .67 .38 .59
Crappie <.01 .04
Pickerel .02 .02
Catfish <.01
Carp .05 .03 .03
Buffalo .02
Suckers .08 <.01 .02
Bowfin <.01 < .01
Gar <. 01
Shad .37 .53 .51
Drum
Mooneye
Needlefish .06
Total 1. 23 1. 02
1l0a
1. 41
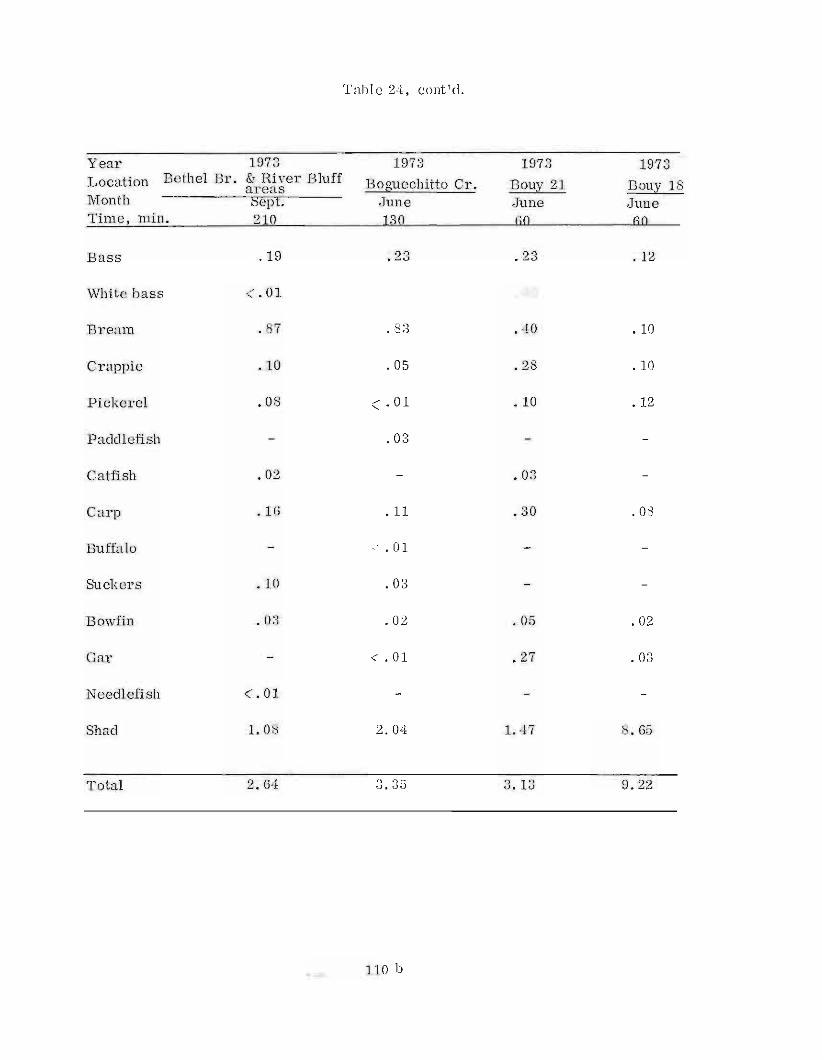
Table 24, cont'd.
Year 1973 1973 1973 1973Location Bethel Br. & River Bluff Boguechitto Cr. Bouy 21 Bouy 18areasMonth Sept. June June JuneTime, min. 210 130 60 60
Bass .19 .23 .23 . 12
White bass <.01
Bream .87 .83 .40 .10
Crappie .10 .05 .28 .10
Pickerel .08 ( .01 .10 .12
Paddlefish .03
Catfish .02 .03
Carp • 16 .11 .30 .08
Buffalo <.01
Suckers .10 .03
Bowfin .03 .02 .05 .02
Gar <.01 .27 .03
Neec1lefish <.01
Shad 1. 08 2.04 1. 47 8.65
Total 2.64 3.35
110b
3.13 9.22

KnLargemouth bass Spotted bass Bream Channel Common Suckers, Pickerel
40 5040 5020 30 40 50 301010 20 0o40 5030 40 10 20 3010 20
,,i , , I I I I
i , I I •
I. , I I , ,
I I I I II I
\ II , , , , ,
. I , ,
, ,I I ,
i , , , , ,
I I I I I I I I I I I I I I I I I I I
.6
.7
.8
.9
.5
1.3
1.0
1.1
1.4
~ 1.2....
Total Length mm (x10)
Figure 6. Distribution of K11
factor for various sizes of five groups of fish collected from Dannelly Reservoir in 1972-'73.

information currently available, it can only be concluded that a major portion of
the original fish population may still exist in this 105 mile stretch of the Alabama
River.
5-1-4. Comparisons of relative conditions (1S,). It has been suggested
that average length-weight relationships of major species of freshwater fishes be
prepared for large geographic regions, and that these averages be used as a base
for the determination of the relative condition factor,~. Such a set of average
length-weight relationships for many species of fishes from rivers, lakes, and reser
voirs in Alabama are available (W. E. Swingle & E. W. Shell, 1971), and these aver
ages were used to determine the ~ values of all major species of fishes collected
from Dannelly Reservoir. The data for both years (1972 and 1973) are presented
graphically in Figure 6 . In these data, a Kn value less than 1. 0 indicates poor
condition, a value of 1. 0 indicates average condition, and a value greater than
1. 0 indicates good condition.
The 1<n data for Dannelly Reservoir are limited, but are believed to be un
biased, representative (electrofishing) samples of the species present in this
reservoir. The data indicate a range in overall condition from poor to good. In
the case of largemouth bass, the numbers of individuals in the samples in poor
condition was greatest in fishes less than 12 inches in total length. TIlis same
condition apparently existed in crappie less than 10 inches in total length. TIlis
would lead to a general conclusion that insufficient small forage fishes were pre
sent. On the other hand rotenone sampling along the shore indicated a substantial
number of 2 and 3 inch-group shad and 1 inch-group bream were present in late
112

summer. In fact, numerous schools of small shad were observed throughout the
summers of 1972 and 1973. This leads to a general conclusion that there was not an
overabundance of small carnivorous species present in this reservoir. The fairly
even distribution of poor to good condition in the bream population simply indicates
wide variation in the growth rates of these species. In general, it can be conclud
ed that the bass, crappie, and bream have been reproducing" in fairly large
numbers, but possibly their food supply in the mainstream and some embayment
areas may be restricted.
As pointed out earlier in this plan, the upper three-fourths of Dannelly Reser
voir is a run-of-the-river impoundment, and has a limited shallow water area
that is not conducive to the production of foods for bream. Aiso, this type habitat
is unsuited for widespread spawning among the bream. On the other hand this
area is favorable for shad production. This factor is believed responsible for the
greater than average numbers of carnivorous species observed.
It is stressed that these are limited data, collected from some of the appar-
ently more productive areas in the reservoir. A notable omission in these electro
fishing data is the lack of information on commercial fish species in the old river channel.
5-J. Fishing pressure. No reliable estimates are available on the number of
fishermen, or the numbers of fish that were caught, for Dannelly Reservoir. Since
such information is normally obtained by creel census studies, the proposal for
obtaining such information on the Dannelly Reservoir fishery will be discussed in
that section.
113

5-K. Creel census data. A creel census is a method of bookkeeping
designed to determine the numbers and pounds of various species of fish
harvested by various methods, and the effort (time and manpower) required to
obtain this harvest. The survey can be more sophisticated and determine the age
and sex of fishermen, the point of origin of the fishermen, and other facts if so
desired. Inherent in the design of the census is the fact that daily and day-of
week fishing pressure, as well as monthly fishing pressure, can be m(tracted from
the data. However, the most important information is to secure an accurate and
complete record of the numbers and weights of each species of fish harvested
from the entire body of water, and the time required to attain this harvest.
On an impoundment the size and shape of Dannelly Reservoir, with so many
private access points, it becomes an enormous task to devise and execute a
reliable creel census study. However, a serious effort should be made to carry
ou t such a study of the sport and commercial fisheries. This study should be
based upon the system currently used throughout the Southeast, and should be
coordinated through the Southern Division of the American Fisheries Society.
Concurrent with this creel census, an effort should be made to obtain data
on the fish population by use of area rotenone sampling of both the mainstream
and flooded plains areas of Dannelly Reservoir. With such information at hand a
concerted effort can then be made by the Corps of Engineers and the State of
Alabama to apply whatever techniques and managerial practices deemed feasible
to improve the quality of the fishery and its harvest in the lake. The minimum
time required to obtain this information would be two years.
114

6. MANAGEMENT OF THE FISHERY
The management plan presented in this Section is one that has the most potential
for increasing fishing success in William "Bill" Dannelly Reservoir for the cost involved.
It is emphasized that if post-operational evaluation of a particular part of the plan does
not provide the desired increase in fish production, this phase should be discontinued
and a different approach devised. Also, in those cases where no economical management
plan can be devised, it ,vi11 be recommended that the operational procedure remain
at its present status.
6-A. Reservoir fishery biology. This section is a brief review of some basic
biological processes of a reservoir fishery that were considered in evaluating the
fishery condition in William "Bill"Dannelly Reservior, and in the preparation of
the Management Plan that will follow. The two principal problems involved io fish
production are (1) the production of an abundant supply of fish food, and (2) the
management of the fishery for a high sustained yield of harvestable sized fish.
An analysis of any reservoir fish population is a complex problem involving
an understanding of the habitat, the food supply, the biology of each species of
fish, the relationships that result from all of these species living together, and
the impact of removal upon a sustained harvestable population.
Information on the types of habitats, and the potentials for fish-food production
have already been discussed in previous sections of this plan. In summary, it
can be stated that a large portion of the bottom in Dannelly Reservoir is too
deep to be utilized for macroinvertebrate (fish-food organisms) production. In
too large a portion of its shallow water (less than 8 feet deep) areas the exposed
bottom material is sand that shifts with current and wave action. On the other
115

hand, the inflow of nutrients is more than adequate, but water movement is too
extensive to permit the development of heavy densities of phytoplanh1:on in this
lake. There was no evidence, from any recent studies, that water quality was
inadequate to support an abundance of all forms of aquatic life.
Since the Dannelly Reservoir is located upon a large stream that receives a
great deal of organic as well as inorganic waste products, a diversity of food
sources is available which requires fishes of different feeding habits to fully
utilize these resources. The species listed in Table 17 indicates that an adequate
diversity of feeder-types exists in this lake and its tailwaters. The presence of
such scavengers as gars, carp, catfish, and bowfins indicates the probability
of a decreased rate of eutrophication in this lake. Present eutrophic conditions
are much less than would occur if these scavengers were not present. Likewise,
the presence of large numbers of planktonivorous shads indicates adequate utili
zation of plankton and the production of an abundant forage gTOUp to support the
population of carnivorous basses, crappies, and catfishes. It has already
been pointed out that the inadequacy of suitable bottom conditions in portions of
this lake has restricted macroinvertebrate production that has resu lted in a
limited standing crop of all sunfishes.
6-A-1. Factors affecting fish reproduction. The contimled existence of
all fish species in Dannelly Reservoir depends upon their ability to spawn in this
habitat. There are many factors that affect the reproductive success of reservoir
fishes. Some of these factors are discussed below.
116

6-A-1-a. Adequacy of spawning area. The type of spawner, i. e. nest
builder or random, will determine whether or not adequate spawning areas exist in
the habitat. In the case of nest builders, spawning sites are located on firm bottom
materials consisting of gravel, clay, or silt. Sandy bottom areas are largely un
suited for spawning since these may be shifting bottom areas. Nest builders also
have a preference of water depth in which to locate their nest. This depth generally
ranges from less than 1 foot to approximately 10 feet. Random spawners require
shallow water areas where there is an abundance of egg-attachment materials
(brush, grasses, and weeds).
6-A-1-b. Water fluctuation. Drawdowns during spawning may destroy
a few or all nests and expose eggs of some shallow water random spawners. Rising
water prior to spawning can dilnte the repressive factor and induce basses, carp,
and buffalo to produce heavier spawns.
6-A-1-c. Water temperature. The 6-inch water depths temperatures at
which various species spawn is shown in Table 25. The spawning success of early
spawners such as crappies and basses may be adversely affected by unusual water
temperature fluctuations.
6-A-1-d. Silt laden waters. Waters heavily laden with silt are un
favorable for spawning of sunfishes and basses. Sunfishes in general are more
tolerant to silts than are basses while bullhead catfishes apparently suffer no ill
effects from silt. Random spawners, such as shads, carp, pickerel, and buffalo,
whose eggs may be attached to twigs, leaves of grasses, etc., are less susceptible to
117

silt damage than are the bottom spawners. An often overlooked but potential silta
tion hazzard is produced by wind-driven currents that cause suspension of shallow
water silts and clays.
6-A-l-e. Repressive factor. This is a self-inflicted type of birth con
trol first observed in goldfish, carp, and buffalo populations. Basses and sunfishes
are thought to secrete a repressive factor to limit the extent of their own reproduction.
6-A-l-f. Size of brood fish. There is a size below which each species of
fish will not spawn. The minimum sizes of spawning fish of various species are
given in Table 25. Sunfishes that are growing rapidly may spawn at a smaller size
than slower growing individuals.
6-A-l-g. Food availability during period of egg-formation. Availability
of food during the period of egg formation and maturation within the female fish
will influence the number of young fish produced per female. 11ms, heavy reproduc
tion of a species indicates rapid growth of brood fish; light reproduction, slow growth;
and no reproduction, no growth or loss of weight by brood fish.
Some species such as sunfishes and shads can mature eggs within a few weeks
and spawn two or more times during a summer. Other species such as basses,
pickerels, carp, catfishes, and buffalo require several months for egg formation.
Thus, in these latter species reproductive success is influenced by conditions that
eJdsted during late fall, winter, and early spring.
118

Table 25, Reproductive characteristics of various species of fresh-water fish.
jo,1ill. Sj1:lwning No. Sp:wm Fry jIlin. lIatcbing.§E.cdcs T"pc Snp.\','llcr S~ in . Tvpc Ei!!; Per Yc:l1' Schooling" Tcmpcr:llurc, of.
Largemouth h:tss nest builder 9 sinkingsingubr adh('sh-c 1 + 70
SmallmouUl bass nest bHildcr 8-10 sinkin~ 1 + 70adhcsh'c
While bass nest builder 10 sinking' 1 + 5&adhesive
Eastern pi(;kercl random 15 semi-buoyant 1 55-roO
S,lUgcr random 12 :l(lhcsjH~ 1 43
Black cr:1ppic colony or Sillg-Ic 7 sinhillf4" 1 68nest builder adilt'~i\'c
White Ci',~ippic colony 01" single 7 sinking- 1 68nesl builder adhcsjY(~
Bluegill colony 3 slnl.;ing 2-3 SOnest builder adhesi\'e
Rcdc<ll' coJony 3 sin~;illg 3 75nest u:lildcr adh,:'[.i\·c
Hcdbrcnsl colony 3 sinking 2-3 71nesl iJllild~r adhesive
Hound Oie1' nest. builde)" 3 h('a\'j' 1 60-65adhcsh'c
Wannoulh nest buildel' 3 [Iclhesh'c 1 SO
Grcen Sllnfi~h colon)' 3 ndhc~i\"c 3 68-70ncst bui Ide'I'
Lonl~C;ll' colony 3 <le111csi\'0 2 '/1-73nest lHliluC']'
Ch3.nncJ cat fish nesl Lui!dcl' 10,5 heav)' 1 71adhesi\'c
Sp{~el;Icd bullhc:lcl nest l,uiJrlcr n adllC':';ivc 1 + 80
Golcl(lJl shinc)' l'clllclom 5 :'Hlhc'si \'0 3 + 68
Buffalo random ]S sipking 60
Gif,z;~nJ ~h:ld l'aJlc1oYlI G aclhcs~\'e 3 + 68
Thrc;,cJfiu sh~d nndolll 3 acihesh e 3 + 70
119

6-A-l-h. Crowding. Since crowding results in less food per indi
vidual, it results in smaller size brood fish and slower gTowth. Crowding may
result from too many individuals of same species and/or of competing species.
The results of overcrowding is reduced or no reproduction.
6-A -l-i, Egg-eating habit. Under conditions of crowding, sunfishes
have been found to eat eggs of their own and other species. When confined to
sunfishes and competing species, this may be considered a beneficial type
of birth control. However, when it is e>.1:ended and includes the eating of
bass eggs, it is extremely detrimental for it causes unbalanced populations.
6-A-l-j. Reproductive success of prey upon which predators feed
after reaching fingerling stage. Since some predatory species require fish as
prey to produce normal growth, it is necessary that successful prey species
reproduction occur.
6-A-l-k. Strength of predation upon young predator species. The
young predatory species are not exempt from the same predation that exists for
the young of other species. Among the basses, the greatest predation prohably
occurs by those larger individuals of a school that starts feeding on their own
or a neighboring nest mates. This characteristic of young basses to largely
devour nest mates makes the operation of bass nursery ponds on reservoirs of
dubious value.
120

6-A-2. Predator-prey relationships. The rate and efficiency of predation
within a fish population are dependent upon a number of biological and physical
factors. Notable among the biological factors is the schooling habits of the var
ious species. The largemouth bass fry, for example, are vulnerable to all basses
and crappie of larger size. Since they move about in a large school for several
days after leaving the nest they are easy prey. Thus, a majority of fry of all
basses may be eaten by larger fish in a natural population before the schools
break up. Carp eggs, fry, and fingerlings appear to be extremely vulnerable to
bass predation. This species cannot be classified as a true schooling species,
but the fry and young fingerlings seem to congregate into groups and this makes
them easy prey for predators. Small shad also congregate into schools and pre
dators are generally lurking in the environ of these shad schools.
TI,e fry of most species of sunfish disperse more or less at random into
shallow water areas upon leaving the nest. A chief factor in the survi val of large
numbers of these species is the availability of cover in which these small
fish can hide from predators. Filamentous algae and rooted aquatic weeds, if
present in sufficient quantities in shallow edges, provide excellent hiding places
for many small fishes. Thus, weed control is an essential factor in establishing
a healthy predator-prey relationship in a reservoir.
The predatory species ("C" class) have been described as those piscivors
which consume any fish they can capture that is small enough to be swallowed at
a gulp. TIlis suggests that a relationship exists between the size of the predator
and its prey. By research it was established that the mouth width measurement
~ 121

of the predator species is equivalent to the maximum depth of body measuremeut
of the forage species that it can swallow. Since mouth width and maximum depth
of body are related to total length of body, this relationship is generally expressed
as the total length of a forage species a bass of a given total length can swallow,
and is given in Table 26. This chart indicates that largemouth bass can start on
a fish diet at a very early age.
These relationships on mouth width of predators to depth of body of forage
species have been established for largemouth, smallmouth, and spotted basses,
and eastern pickerel as predators, and for bluegills, redeal', goldfish, golden
shiner, and gizzard shad as forage species. It is believed that the same type
relationship exists between mouth widths of crappies and catfishes and sizes of
forage fish they can gulp, but to date these have not been determined,
The presence of an adequate number of predators (piscivorous species)
within a fish population is essential if the forage species are to be thinned to the
extent that a sustained maximum harvestable crop of fish is to be produced. TIle
chief predators for reservoirs in this area include the basses, the larger catfish,
the pickerel, and to a limited eAi:ent the crappies. Unfortunately, our knowledge
of the activities of the larger catfishes is much more limited than it is for the
other three species. Since the species dynamics of any reservoir fish population
is dependent upon the predator-prey (Fie ratio) relationship, a discussion
presented by Swingle and Swingle, (1967) concerning problem encountered with
largemouth bass and crappie predation is given below.
122

Table 26. Maximum sizes of forage fishes largemouth bass of a given inch-group can swallow.
Bass Total length of forage fish
Total Length Green Golden Gizznrd Threadfinlnch- Bass Bluegill Redeal' sunfish shiner Goldfish shad shadGroup mm mm mm 111m mm mm mm mm mm
1 38 242 64 34 36 26 36 45 40 39 283 89 44 40 32 41 52 45 45 364 114 54 45 37 46 60 50 52 435 140 68 52 46 54 72 58 62 566 165 82 58 54 61 82 65 72 697 191 96 65 62 69 93 72 81 79
.... 8 216 120 73 72 78 106 81 93 91"" 9 241 132 81 81 87 119 89 104 102'" 10 267 145 89 91 94 132 98 115 117
11 292 158 97 100 104 145 106 126 13012 318 169 104 108 113 156 114 136 14013 343 183 113 119 122 170 124 149 15514 368 196 121 129 131 183 133 160 17015 394 229 129 139 141 197 142 17216 419 249 145 159 159 224 159 19517 445 263 157 173 172 243 172 21218 470 278 169 188 186 262 185 23019 495 292 185 202 199 281 198 24620 521 298 193 - 212 301 - 26321 546 3'12 208 - 229 - - 28422 572 355 223 - - - - 30523 597 369 - - - - - 327

Largemouth bass are efficient predators upon small fishes. This
species spawns in shallow water in the spring and the young fry migrate into
shallow water and feed upon zooplankton, for which they must compete with all
other small fish in the same environment. From the size of I-inch on, they
may feed upon mi:htures of zooplankton, insects, and small fish, depending upon
their relative availability.
Examination of rotenone samples indicated that growth of largemouth bass was
relatively slow during its first summer, and that there may be from 0 to more
than 100 individuals per acre in various impoundments. Since these small bass
remain largely in marginal waters it is the relative abundance of small fishes in
these areas that regulates their gTowth and affects survival. Small gizzard shad
are seldom found abundantly in these areas making the bass principally dependent
upon fry and small fingerlings of minnows and the periodically spawning sunfishes
during their first growing season. By the time they are sufficiently large to
migrate toward deeper waters, few gizzard shad-of-the-year are small enougb to
serve them as food. Those surviving over \vinter are able to feed upon newly
hatched shad by following schools over pelagic areas only at the e:h']Jense of exposing
themselves to gTeater dangers of predation by larger predators. 1f the shad
species is gizzard shad, by mid-summer to late summer again few are small
enough to serve as food for the I-year bass. In both ponds and large reservoirs,
the presence of gizzard shad as the principal forage fish results in two groups of
bass: (1) the young O-to-II-year groups which must grow slowly, with correspond-
124

ingly high losses from predation and other types of natural mortality; and (2) the
rapidly-growing bass which have become large enough to follow schools of shad
over pelagic areas. These latter bass have mouth widths large enough to allow
them to feed year-round upon larger shad.
Unfortunately, no adequate detailed studies have not been made in impoundments
upon the food-chains of small bass and factors affecting their growth and survival
to larger inch-groups. Until more is known of the importance of many of the
supposedly minor species to bass growth and survival, it is impossible to develop
plans for improving conditions ane solving the problems in converting a reasonable
percentage of the shad crop into bass.
The two species of crappies appear to present similar problem s in ponds and
large reservoirs. Their principal characteristic is ti,e cyclic nature of their
abundance. A strong year-class recurs periodically, at intervals of every 3 to
5 years. Age groups I and II of a strong year-class are typically crowded and
slow growing. During this period, few young-of-the-year crappies survive, or
there may be no reproduction. This is not because of the size of the crappie, as
even well-fed 2-ounce crappie are capable of spawning, but is due to crowding
within the species. Crowding may prevent egg formation or the fry-eating habits
may prevent survi"al of a year-class.
As the strong year-class passes to III or lV, gradual reduction in numbers
from fishing and natural mortality results in gradual increases in size, and
heavy reproduction again occurs.
125

Investigations in ponds have indicated that tendencies to periodic overcrowding
were due to the fact that crappie normally spawn earlier (680 F) than, or approxi
mately at the same time as largemouth bass, wbich typically spawn at 70 0 F.
Young crappie after hatching, spend a few days or weeks in shallow waters and
then migrate into deeper waters. Early spawning by crappie and migration into
deep waters combine to make young-of-the-year bass poor predators upon O-age
crappie. In bluegill-bass-crappie ponds, the numerous age class I bass are the
principle predators upon O-age crappies. These basses are the gauntlet through
which the O-age crappies must successfully pass to establish a strong I age-class.
Consequently, it was found in ponds that despite heavy crappie reproduction, a
cyclic pattern of crappie abundance did not occur in populations in years where
strong I age-class occurred.
Strong I age-class of crappie deve loped the following year after heavy re
production by crappie during a year when few or no I age-class bass were
present. Larger bass fed upon larger fishes and allowed survi val of too many
small crappie. Once the strong I age-class of crappie developed, numbers
of young-of-the-year bass declined, probably because of predation by crappie
on bass fry. In state-owned public fishing lakes, once this cycle started, it
was repeated within 4 to 5 years. It was always evident from seining samples
taken in June when another cycle was starting. This was evidenced by averages
of 10 to 30 or more crappie fingerlings per 15-foot seine haul, with no age I bass
by the 50-foot seine and very few caught by the fishermen.
126

In balanced populations, low numbers of age I bass generally follow
years with abnormally high numbers of age I bass. Seining records on
experimental ponds have demonstrated that in such years older bass repro-
duced, but age I bass allowed very few or none to survive beyond the schooling stage.
Unfortunately, the rotenone samples taken in large impoundments were
useless in studying this young bass-crappie problem. Most rotenone samples
were taken from July to September and by this time practically all sizes of crappie
had migrated to deeper waters. If rotenone samples were taken also during the
spawning period of crappie, while most were in shal10w water, a more useful
census could result. Possibly periodic seining during spring to mid-summer
would provide a census of the O-class and its survival. Trapping, creel census,
and relative condition data can yield information on frequency and length of cycles.
Crappies are not undesirable species in either ponds or large reservoirs; biolo
gists just do not yet have techniques for their management.
6-B. Risumeof factors affecting fish production in reservoirs.
1. The latitude and altitude of both the drainage area and the reservoir
determine the temperature of its water and the species of fish
it may support.
2. The shape, size, and geographic location of its drainage area
determines in large part the quantity of inflowing waters into
a reservoir.
127

3. The type of soil, and its management, on the drainage area
determines the sediment load borne by inflowing waters.
4. The types of soils and agricultural practices employed on the
watershed determine the natural nutrient concentrations in
inflowing waters.
5. The quantities of domestic and industrial effluents released into
tributaries to the reservoir augment the flow of nutrients into
the reservoir environment.
6. The inflow - storage - output ratios of nUh'ients in a reservoir
determine the h'ophic levels that are maintained.
7. The storage of nutrients in bottom soils of reservoirs is depen
dent upon water depth, flooding, and level of release of discharge
waters.
8. The conversion of nutrients into phytoplankton will retard develop
ment of macrophytes in shallow water areas of reservoirs, whereas
the conversion of nutrients into macrophytes will inhibit the develop
ment of phytoplankton in a reservoir.
9. The presence of macrophytes will act as precipitators of silt
resulting in more rapid clearing of water, but this process may
result in elimination of shallow marginal areas in the reservoir.
10. The maximum food production in a reservoir is attained when a
moderate quantity of the available nutrients are converted into
128

phytoplankton. Excessive conversion of nutrients into phytoplankton
will produce unfavorable habitat conditions.
11. The type of bottom in the euphotic zone of a reservoir may deter
mine in large measure the percentage of conversion of phytoplank
ton into macro-invertebrates that serve as food for fish.
12. The presence of other substrate materials, such as brush and
rooted aquatic plants, increases attachment sites for macro
invertebrate production.
13. To efficiently utilize all forms of food available within a reser
voir, the population of fish must include species whose feeding
habits are adapted to utilize these varied food sources.
14. The population of fish within the reservoir is composed of those
species present within the impounded portion of the stream at
the time the dam was closed. If other species are considered
desirable or necessary in the reservoir fish population they
should have been stocked when the dam was closed and allowed to
expand with the native fish.
15. There must be an adequacy of spawning areas in the reservoir to
provide for annual reCTIlitment to the fish population.
16. A predator-prey relationship must be established and maintained
that is capable of reducing the total numbers of fishes to a level
of maximum sustained harvestable-sized sport and commercial
species.
129

17. An excessive quantity of macrophytes can provide too much
protection for small fishes from predators and result in an
overcrowded and stunted fish population.
18. There must be an adequate annual harvest by fishermen to remove
a high percentage of the harvestable-sized sport and commercial
species. This will permit adequate reproduction and the maxi
mum rate of growth among the recruitments to the population.
19. An abundance of large, trophy-sized bass or other species taxes
the available food supply and results in a decreased total standing
crop and fewer harvestable sized fish.
20. Inadequate removal of harvestable-sized fish results in an
abundance of older individuals that are more susceptible to
parasite and disease attacks.
21. Parasite and disease infections are higher among species with
schooling habits. Also, incidences of infection are greater during
spawning periods when many individuals are crowded into smaller
areas than at other periods of the year and antibody production is
at its lowest level.
6-C. Information vs. action. It is evident from the preceeding discussions
that all prior data gathered on Dannelly Reservoir may be classified as informa
tion, and that practically no use has been made of this information for either
the promotion or man~gement of the fishery for a greater sustained
130

yield of harvestable sized fishes. There is one notable exception to the above
statement. During the early post-impoundment period au agreemeut was reached
betweeu fisheries biologists and the Corps of Engineers on water level control
during the major spawning period. This procedure has been followed for the past
3 springs, and has apparently been largely beneficial to bass and crappie repro
duction.
The time has long since passed for utilization of the available information
on water quality, aquatic weed control, and fish populatiou data that applies to
Dannelly Reservoir and to collect the needed data to completely evaluate and
manage this fishery.
The most pressing need for information at present is a reliable estimate of
the quantities (numbers and weights) of fishes harvested by fishermen from this
lake. This information can only be obtained by an organized creel census con
ducted for a sufficient period (at least 2 years) to provide reliable information.
It is suggested that this creel census be conducted in accordance with the pro
cedures described by the Southern Division of American Fisheries Society, and
that it be initiated as rapidly as the plans, funds, and personnel can be obtained.
6-C-1. Public relations. TWs phase of the Fishery Management Plan
might be considered as the equivalent of customer service in a large corporation.
It's purpose is to provide fishermen with such information as the kinds and habits
of fish inhabiting Dannelly Reservoir; the most successful method to employ to
catch these fish; the (current) areas where fishing for various species has been
131

most successful; bottom contour maps to indicate depth to fish; and weekly dis solved
oxygen concentration profiles that indicate depths where concentration is 4 ppm 02 or less.
The information on fishery biology is an integral part of the training of any Fisheries
Biologist. The dissemination of this information to civic groups, conservation and
wildlife gToupS, and school children could be most helpful to the public to better under
stand problems of fish production as well as in their harvest of fish. These presen
tations could be timely and include fishing techniques for those species currently being
harvested.
The information on current "hot fishing holes" could be disseminated weekly along
with water temperature and dissol ved oxygen concentration data. This type informa
tion cou ld be displayed on bottom contour maps along with the best depth at which to
place the bait.
6-C-2. Fishing access. The various points of access for boat fishermen on
the lower portion of Dannelly Reservoir are presently adequate to allow most areas to
be within a 20 minute nm from a concrete ramp. In a limited number of places one
may have to drive many miles and cross the lake to reach an access point. It is felt
that the present number of access points for boat fishermen are sufficient for present
fishing pressure.
Bank fishermen, on the other hand, have had no special facility consideration to
date. They have simply had to be content with e}cisting bank conditions regardless of
their proximity to favorable fishing grounds. From observations on this reservoir
and from surveys conducted on fishing habits of Alabama fishermen, it is estimated
that 50 percent or more of the fishing pressure on this reservoir is exerted by bank
132

fishermen. It is suggested that this aspect of reservoir fishing could be improved in
a number of areas by construction of fishing piers or dikes into favorable shallow
water areas. Such embanl=ents use borrowed soil from lake bottoms, thus deepening
the waters immediately adjacent to them. This provides added fishing access plus
serving as attractants for fish. These structures might lend themselves as barriers
that would permit the fertilization or baiting of embayments for special groups such
as handicapped or underpriviledged children.
In the tailwater areas immediately below Millers Ferry Dam the construction of a
fishing walkway on the east bank would permit a greater number of people a safer
access to this fast water fishing area. Such a walkway could allow access to an area
which is currently closed to boat fishing by a chained bouy line. This is a minor cost
item that could gTeatly increase tailwater fishing access from a relatively safe platform.
It has already been pointed out that a concerted effort is made during spawning
season to maintain a relatively stable water level of Dannelly Reservoir. After the pool
reaches its summer level of 80 feet msl the lower portion fluctuates one or more feet
daily throughout the year. These changes in water level result from peak generation
needs both upstream as well as downstream. Such needs are real, based upon power
production demands. It is urged that generation schedules be carefully established to
minimize the degree of full pool fluctuation, and reduce the loss of productive marginal
bottom areas to a minimum during the period from June 1 through Labor Day. A
slight winter drawdown no doubt would concentrate small fish from protected areas into
open water and makes them more vulnerable to predation. This procedure tends to
decrease the possibility of overcrowding. On the other hand, drawdown at any period
would interfere with access to many areas on Dannelly Reservoir.
133

6-C-3. Fishing intensity. It was stated in the introduction that the pri
mary purpose of this fishery management plan was to provide the greatest sustained
yield of harvestable sized fish based upon its basic fertility. To attain this yield
requires a sustained fishing pressure particularly during those periods when
certain species are iu the shallow water areas or are on their beds. The publicity
of this information is one approach to acquiring intense fishing pressure. However
to sustain this fishing pressure requires that a majority of these fishermen catch
fish.
6-0-4. Creel limits. It is contended that the present high creel limit
is a factor that determines the relative fishing success of a majority of fisher
men. It is well Imown that the consistent fisherman knows where and when to fish,
and when he locates a bed or area where fish have congregated that he will remove
one or more full limits on several consecutive days. This procedure does remove
large numbers of fish, but it does not provide catches for a vast majority of fisher
men. A lowering of limits could tend to promote a greater spread of catches to
more fishermen. This should result in a greater stimulus to a wider fishing
clientele which should be the philosophy for any public waters that are operated from
general public funds.
The harvest of adequate numbers of commercial species, especially the cat
fishes and carp, from Dannelly Reservoir has been rather sporadic and in a large
sense restricted. Unfortunately, no data are available on harvest of either com
mercial or game species to indicate how adequately the present fish crop of all
catchable groups is being harvested. Since it requires approximately as much
134

food to maintain a pound of fish as is required to produce a pound of fish, the
harvest of commercial species should be encouraged to release some of the pres
sure upon the food supply of the game species. By proper selection of fishing
gear, the probability of catching game fish by commercial techniques is consider
ably lessened. However, if our assumptions on game fish harvest are reliable,
then the removal of a limited number of game species by commercial gear could
only result in an improvement of the entire fish population.
6-0-5. Evaluation of fishery management changes. The operation of a
concurrent creel census on game and commercial fishing would be the only way
to accurately evaluate any proposed changes in management practices in regards
to their influence upon the total fish harvest of Dannelly Reservoir. Since little is
known of the fishing pressure or harvest in this Reservoir, it is advisable that
this creel census be initiated as soon as possible.
6-0-6. Fishing tournaments and rodeos. Another factor in adequately
harvesting the game fish population of this lake to sustain a maximum harvestable
crop is the operation of bass tournamenst and fishing rodeos. As mentioned
previously it requires about the same amount of fish food to maintain a pound of
fish as to produce a pound of fish. For example, it requires about 4 pounds of
fish to produce one pound of bass within one year. It will require an addi
tional 4 pounds of fish to maintain this one pound of bass through its second
year of life, and if he gaines another pound in weight he will consume
135

an additional 4 pounds of fish. Thus hy the time a fish is 2 years old and weighs
2 pounds he will have consumed 12 pounds of fish (enough food to have grown three
one-pound hass in one year). If a bass lives to be 6 years old and weighs 6 pounds
at the end of that period, he will have consumed 80 plus pounds of fish during that
period (enough to have produced 20 one-pound bass during these six years).
Fisheries management technology has not advanced to a stage to prOVide
means for producing these greater numbers of smaller basses in preference to the
one larger fish in larger impoundments, and it is not lmown that if such a technique
were available if it would result in a balanced fish population in such impoundments.
These facts were pointed out to indicate that the removal of trophy sized basses by
tournaments and rodeos can have a beneficial effect upon a reservoir's overall
fish population in the release of pressure upon the available food supply. This
results in a brief stimulation of growth anlOng basses and possibly crappies.
In any impoundment inhabited hy gizzard shad, it is necessary that the
population of basses consists of individuals of all sizes from young-of-the-year to
old grandads. As mentioned earlier, larger basses seemingly prefer near maxi
mum sized forage fishes that they are capable of swallowing; thus these lunker
sized basses are a necessity to control the numbers of gizzard shad and other
forage fishes. Their occasional removal only allows a slightly smaller bass a
more abundant food supply and an opportunity to reach the "lunker" sized category.
Tournaments and rodeos have thus far only encouraged the growing-up of smaller
basses. If tournaments are too large or too frequent they cou ld eventually
result in a gradual decrease in size of larger basses, but it is doubtful
136

that this point has been approached in this lake. Thus, from the fish manager's
standpoint, a limited number of moderate-sized tournaments and rodeos would be
considered a desirable means of harvesting a segment of the fish population that
is taxing the available food supply.
6-D. Creel census evaluations. In conclusion, it cannot be over emphasized
that the workability of any of the proposed practices or changes in management of
the fishery in Dannelly Reservoir can only be evaluated by a creel census that is
properly designed and conducted in such a manner as to provide a reliable estimate
of the trend in total fish harvest. The results of this census must be constantly
examined to follow the catch trends, and to check its sensitivity in evaluating the
practices under study. In those cases where it is indicated that a particular prac
tice is not increasing the total yield, this practice should be discontinued, or
modified, and if modified its effects should be closely evaluated.
137

7. Coordination with Other Agencies
The establishment of a fishery habitat by the impoundment of Dannelly Reservoir
created a problem of managing this public resource.. By custom, it has been assumed
that the fishes living in this body of water belong to the state until they are caught
and removed at which time they become the property of the fishermen. States have
been resistant to assume the management of these federally financed projects on
the grounds that no State revenues are derived from such installations whereas pri
vate utilities do pay taxes on their impoundment holdings. There is no likelihood that
this attitude wi II change in the immediate future. States do ins ist however, that the
fishery created by these federal impoundments is still their responsibility. This
Plan assures the State of the continued role as principal participant in the manage
ment of fisheries within its jurisdiction.
7 -A. Personnel and funding. In light of the above situation, it mU st be assumed
that the Corps of Engineers has a responsibility to the public, who financed these
projects, to provide the financial means for their management. The procedures for
sol ving all management problems are details beyond the scope of this Plan. However,
it is felt that the Plan can include some suggested methods for their initial enactment.
The Corps of Engineers should employ a skeleton staff of professional fisheries
management personnel to act as liaison between themselves and the Stale fisheries
biologists. These Biologists should be provided with adequate funding for each
reservoir under their jurisdiction to provide for collection of essential data and
conduction of public relation and other managerial aspects of each reservoir's fishery.
138

Dannelly Reservoir could share a fisheries biologist with Jones Bluff Lake
and Claiborn Lake. This biologist would coordinate the fisheries management
activities between the Corps of Engineers and the fisheries biologists of Alabama.
The various aspects of the program that are to be accomplished could then be
contracted to the Fisheries Divisions of Alabama's Department of Conservation
and Natural Resources, to State Universities, or they could be conducted in-house.
Such an arrangement should be designed to encourage State participation in the
plan, and in-house implementation would be used as a last resort. The role of
State Universities in this management plan would be restricted to research activ
ities in relation to specific biological or management problems.
This fisheries biologist should be adequately trained in fisheries biology and
management, and have an M. S. degree. The pay scale should be a G. S. 9 or
higher in order to attract qualified persons. The funding for implementation and
continuing the management plan on Dannelly Reservoir could be based upon fisher
man usage estimates, and could be as high as $.05 per fisherman visit. This
figure would provide adequate monies to conduct a good creel census and to start
some of the other activities set forth in this plan.
7-B. Cost-benefit projections. It is impossible to palce a value upon the
benefit derived by an individual for one fisherman visit to Dannelly Reservoir.
Certainly the value would be several times the $.05 cost per fisherman visit
indicted above. In addition, for each fisherman visit , it is estimated that he
placed into the local economy (spent)well in excess of $1. 00 to make this visit.
Thus, the cost-benefit ratio could conceivably range from 1:25 to more than 1:1,000.
139

7-C. Equipment for biologist. The fishery management biolgoist must be
provided with certain specialized equipment if he is to be efficient and effective in
providing technical assistance that will result in a higher sustained yield of fish on
the stringer. The following items are basic to this biologist being self-sufficient
over the \vide territory that he must keep under continuous surveilance.
1. Pick-up truck equipped \vith a lockable body cover.
2. 16' fiberglass boat (Boston Whaler type).
3. 65 or 85 h. p. outboard motor with at least an 18 gallon gas tank.
4. Heavy duty boat trailer.
5. Corps communication radios in both truck and boat.
6. State communication radio in trnck.
7. Water sampling equipment to include:
a. Dissolved oxygen-temperature meter \vith at least 50-foot lead on
probe.
b. Water sampling bottle capable of collecting water sample at any
depth.
c. Ice chest with quart size Nalgene plastic sample bottles.
d. Secchi disc.
8. Fish sampling equipment including:
a. 25' x 4' one-fourth inch mesh seine.
b. Dip net with one-fourth inch mesh bag.
c. Ice chest with plastic sample bags.
9. 35 = camera.
a. Color film for slides.
b. Black and white film for news releases.
140

7-D. Job description - Fisheries Management Biologist. The qualifications
and duties listed below are minimum requirements for a Corps of Engineers Fisheries
Management Biologist.
Degree: M. S. in Fisheries Management
Training to include:
1. Warm-water fisheries biology.
2. Management of large impoundment warm-water fisheries.
3. Fish disease and parasites.
4. Water quality in relation to fish production.
5. Aquatic plant identification and control.
6. Fish identification.
7. Statistics.
8. Public speaking.
9. Journalism.
Duties:
1. Thorough knowledge of the fishery habitats within each Lake for
which he is responsible.
2. Knowledge of the surrounding drainage area, especially the sources
of domestic, industrial, and agricultural pollution.
3. Knowledge of current sport fishing success on each lake including
most productive areas. Share information with public through news
releases, radio, T. V. and Lake bnlletins.
4. Knowledge of co=ercial fishing on each lake including number of
fishermen, type of gear used, and kinds and amounts of fish harvested.
141

5. Maintain surveilance for fish kills and determine cause (s). Report
to appropriate State agency.
6. Current Imowledge (at all times) of water quality conditions through-
out each lake. Share information with public through news releases
radis, T. V., and posted information on Lake.
7. Maintain surveilance on aquatic plant (including phytoplanJ..:ton)
populations and determine when and where control measures
should be employed.
8. Cooperate with State fisheries biologists on all above-mentioned
duties so that both may better inform the public about the fishery
within each lake.
9. Promote fishing interest through news releases, public appearances
at clubs and civic groups, and by personal contact on lakes.
10. Identify, help develop, coordinate and participate (to be informed)
in any contractnral management or research plan that may be in
effect on each lake.
11. Actively participate in local, state, and regional fisheries organi-
zations to inform and be informed on current management practices.
12. Coordinate and encourage participation of each Resource Manager
and other Corps personnel on each lake project in collecting and
disseminating information relative to that lake's fishery.
Note - This biologist could be most effective if he did not have citation authority.In this way he can contact persons with valuable information, but who arenon-communicative with law enforcement personnel.
142

7-E. Budget. The personnel required to implement this Fisheries Management
Plan consists of a District Fisheries Biologist and a Project Fisheries Biologist.
This Project Fisheries Biologist would be shared by Claiborne Lake (30 percent),
William "Bill" Dannelly Reservoir (40 percent), and Jones Bluff Lake (30 percent).
The work basis for William "Bill" Dannelly Reservoir will be as follows:
Project Fisheries Biologist, GS-9, 40 percent, 104 days
Estimated annual cost is as follows:
a. Personnel
b.
c.
d.
Fisheries Biologist (GS-9) ($13,791 + 32%) x .40 $
Contingencies (15 percent)
Supervision and Administration (15 percent)
Equipment ($12,500 x .06)*
Operating expenses
Subtotal
Management Practices
Fishing piers, creel census, weedcontrol, population studies, etc.
7,282
1,092
1,092
750
1,800
12,016
30,984
Total Cost (860,000** x $0.05 per user day)
Total Benefits (860,000 x $1. 00 per user day)
* Equipment costs prorated over 5 year period.
** This is estimated fishermen days based upon totalvisitations to the Project.
143
43,000
860,000

8. Research Needs for River and Impoundment Management.
Improved techniques for evaluating the present and future fish populations
in rivers and impoundments are urgently needed by State and Federal regulatory
agencies and by industries that are required to biologically monitor the effects
of their wastes. Equally important, we need to utilize, at the optimum level,
the productive capacity of our natural surface waters.
Title: Improvement and Evaluation of Fish Sampling Techniques for Use on
Rivers and Impoundments.
Situation: One of the major problems confronting management of fisheries in
rivers and impoundments is the inadequacy of available techniques to sample
all facets of the resident fish population. This is a distinct handicap to
. fisheries biologists who are attempting to improve sport and commercial
fish production. Equally important is the fact that it is virtually impossible
for biologists to evaluate either detrimental or beneficial effects of waste or
heated-water effluents upon fish production in rivers and impoundments.
Objective:
1. To devise a sampling system that provides total recovery of the standing
crop of fishes in a given area.
2. To develop new sampling techniques that will permit the attainment of the
first objective.
144

3. To evaluate the efficiency of individual sampling techniques to estimate a
portion or all of the standing crop under various types of habitats.
Title: Factors Affecting Food Chain Development in Rivers and Impoundments.
Situation: The availability of food is the chief factor involved in fish production in
rivers and impoundments. Since the majority of fish foods are produced within
an aquatic environment, their degree of abundance is not nearly so obvious as
it is with terrestrial forms. In addition, the characteristics of the aquatic
habitats are not so obvious as they generally are on land. Most life history
studies of aquatic forms have been conducted singly and little effort has been
devoted to integrated food chain production studies. Thus, the various factors
which may have the greatest influence upon the food chain for various species
of game and commercial fish are little known or understood. Only through a
better understanding of food chain relationships can fish production in many
waters be managed or improved.
Objective:
1. To devise sampling techniques capable of collecting representative forms
of all major food groups for fresh water fishes.
2. To more fully understand the general life-cycle of each group of organisms
that are components of the food chain for fish.
3. To identify the physical and chemical factors that are beneficial and harm
ful to all component organisms in the food chain.
145
,
4. Evaluate the gain or loss in efficiency of conversion for food chains of
varying complexity.
Title: Optimum Nutrient Loading for Maximum Fish Production in Rivers and
Impoundments.
Situation: Plant nutrients, mainly N, P, and C, are generally the limiting factors
in the production of adequate food to attain the maximum natural production of
fish in rivers and impoundments. Several other chemical and physical factors
seemingly influence the quantity of plant nutrient necessary for optimum fish
production in a given aquatic habitat. Experience in farm fish ponds has
shown that the combination of factors are almost as variable as the number of
ponds that have been studied, but there appeared to be average values for the
components of the combinations that tend to optimize fish production. It is'
.believed that similar sets of combinations exists to optimize fish production
in rivers and impoundments.
Objective:
1. Correlate rate of nutrient flow with standing crop of fish in rivers and
impoundments.
2. Compare fish production in impoundments resulting from agricultural
and non-agricultural nutrient sources.
Title: Optimum Harvest Rate for Various Trophic Levels in Rivers and Impoundments.
146
Situation: It has been shown in pond research that individuals comprising a fish
population do not grow unless a sufficient number of the larger individuals
are harvested and the pressure on the food supply relieved to allow smaller
individuals to attain harvestable size. This rate of harvest was found to be
proportional to the available food supply. In rivers and impoundments the
rates of harvest of sport and commercial species are generally unknown. TIle
same can be stated concerning the trophic levels of these same environments.
The urgent need is to accumulate sufficient information to correlate optimum
harvest rates with nutrient input on the various streams and impoundments
throughout the Southeast.
Objective:
1. To determine the optimum rate of harvest of fish from rivers and impound
ments with different rates of nutrient flow.
147

Synopsis
William "Bill"Dannelly Reservoir, with a surface area of 17,200 acres, a
length of 105 river miles, an average depth of 19.3 feet, and a drainage area of
20,700 square miles, is largely a run-of-the-river impoundment that over-spilled
its channel banks to flood bottomlands in the lower quarter of its length. This
lake is subject to excessive floodwaters one or more times each winter and early
spring. The degree of turbidity attained in this lake results largely from the
rate of runoff and e,,;tent of stream flow regulation on the Coosa and Tallapoosa
Rivel's. The flooding and turbidity contributions from the Cahaba River can
exert varying degTees of influence upon the mainstream portion of Dannelly
Reservoir. The Cahaba River is an unregulated stream that originates northeast
of Birmingham and drains an area of rather extensive mining operations.
The water quality in both the Alabama and Cahaba Rivers was rather poor,
for at least a portion of each year, prior to the time Millers Ferry Dam was
closed. Since the formation of Dannelly Reservoir varying degTees of pollution
ahatement have been affected on many point sources on both streams. At the
present time water quality conditions on the Alabama River would meet the water
quality standards of Alabama for a majority of the time. On the other hand, some
of the industrial effluents on the Cahaba Ri vel' are insufficiently contained and
offer limited assurance that unexpected deterioration of water quality and possible
damage to the aquatic habitat in Dannelly Reservoir might not occur. Tailwaters
below Millers Ferry Dam would be expected to meet Alabama's minimum water
quality standards except under the most adverse conditions.
148

Due to the large eJo,.'panses of shallow waters over rich bottomlands in the
lower quarter of the lake, this portion of Dannelly Reservoir provides an excel
lent habitat for the growth of rooted aquatic plants. It was estimated that in
1973 as much as 800 surface acres were infested with aquatic weeds. Of this
total, 200 acres of shoreline area were infested with alligatorweed, another 200
acres were infested with primrose, and 400 acres of shallow waters were infested
with coontail.
The growth of alligatorweed has now attained adequate density to sustain an
introduction of the Argentine flea beetle as a biological control agent. It is
recommended that a stocking of this beetle be attempted eluring the early summer
of 1974, and that restocking of the beetles be made at intervals until a successful
breeding population is established.
There are an estimated 5,000 surface acres of Dannelly Reservoir that would
be a suitable habitat for the growth of coontail and other submersed weeds. The
use of a 3-foot drawdown during the colder months of the year could reduce and
possibly retard the spreading of many suhmersed weeds.
The fish population in Dannelly Reservoir consists of those species present
in the ri vel' at the time Millers Ferry Dam was closed. Since that time the state
of Alabama has added (in 1973) 10,800 fingerling striped bass. It should be
pointed out that flood waters can reach such levels above and below Millers Ferry
Dam as to allow fish access to upstream passage. Thus, this reservoir is not
entirely blocked from upstream migTant fishes.
149

During the few years this reservoir has existed the catches of bass and
crappie have been good to excellent. To date, the growth of the bass has been
disappointing, but this could possibly be due to a slightly overcrowded bass
condition. The numbers of bream that have been caught have been high, but the
size of the bream has been small. This condition probably indicates that the
available cover in the form of brush, logs, and aquatic plants has protected
too many bream from predators. This situation has taxed the available food
supply to a point where the bream cannot reach harvestable sizes.
Data on the condition of game fishes, mainly largemouth bass, crappie, and
bream, collected in 1972 and 1973 indicated that bass and bream were both in
less - than - average condition. This limited information indicates that much
more research effort is needed to analyze this fish population and the condition
of the aquatic habitat to develop a workable management plan.
A major factor influencing the production of fish-food organisms in Dannelly
Reservoir is the daily fluctuation of water level due to power generation. These
drawdowns expose as much as 1, 000 acres of the more producti ve bottom areas
during the hotter and drier periods of the summer. 'Illis largely eliminates this
zone as a food source. It is suggested that every effort be made to hold these
drawdowns to a minimum throughout the warmer months.
In addition to the studies of fish populations and habitat conditions, it is
necessary that a Imowledge of the total catch of both game and commercial species
be available before a management plan is finalized. This catch data could be
150

initiated as quickly as funds are available so that a management plan that can
better improve this fishery resource be established.
It is recommended that a fisheries biologist be assig"ned to Dannelly Reservoir
(to be shared with Jones Bluff Lake and Claiborne Lake). This biologist's first
order of business would be to initiate and coordinate the population-habitat studies
and creel census surveys.
l51

References Cited
Swingle, H. S. 1950. Relationships and dynamics of balanced and unbalanced fish
populations. Auburn Univ. Agr. E,,1'. Sta. Bull. 274. 74 pp.
Swingle, H. S. (1953), Fish populations in Alabama rivers and impoundments.
Trans. Am. Fish. Soc. 83:47-57.
Swingle, H. S., and W. E. Swingle. (1967), Problems in dynamics of fish popula
tions in reservoirs. Reservoir Fish. Resources Sym. pp. 229-243, 1968.
Swingle, W. E., and E. W. Shell, 1971. Tables for computing relative conditions
of some common freshwater fishes. Auburn Univ. Agr. Exp. Sta. Circular
183. 55 pp.

This Plan has been submitted to the Fisheries
Di vision, Alabama Department of Conservation and
Natural Resources for review and comments. After review,
all comments from the State of Alabama were favorable
and agreed with the management needs for this Lake
as set forth in this Plan. Particular interest was ex-
pressed by the State on the establishment of fishing piers.

NOTES