design implications for visual- manual interfaces in cars...
TRANSCRIPT
DOCTORA L T H E S I S
Department of Business Administration, Technology and Social SciencesDivision of Human Work Science
Design Implications for Visual-Manual Interfaces in Cars
Robert Broström
ISSN 1402-1544ISBN 978-91-7583-396-5 (print)ISBN 978-91-7583-397-2 (pdf)
Luleå University of Technology 2015
Robert B
roström D
esign Implications for V
isual-Manual Interfaces in C
ars
DOCTORAL THESIS
Design implications for visual-manual interfaces in cars
ROBERT BROSTRÖM
LULEÅ UNIVERSITY OF TECHNOLOGY Department of Human Work Sciences Division of Engineering Psychology
Luleå, Sweden
2015

Design Implications for Visual-Manual Interfaces in Cars
Robert Broström
Luleå University of TechnologyDepartment of Business Administration, Technology and Social Sciences
Division of Human Work Science, Engineering Psychology

Printed by Luleå University of Technology, Graphic Production 2015
ISSN 1402-1544 ISBN 978-91-7583-396-5 (print)ISBN 978-91-7583-397-2 (pdf)
Luleå 2015
www.ltu.se

Till Bea.


i
Abstract During the past decades there has been an extensive evolution in computer and communication technologies. In the last ten years these technologies have become an integrated part of our cars via in-vehicle information systems. Considerable efforts are put into research and development of the interface between the in-vehicle information systems and the driver. Due to the fact that vision is imperative in driving, the focus is in particular on the visual-manual interface and on apt usability evaluation methods. The purpose of this thesis is to study design implications for the development of visual-manual interfaces in cars. A point of departure is that the practice of the usability concept, usability evaluation methods, and compliance tests has implications for the design process. Four papers are appended to the thesis. Paper I focuses on differences between rotary control and touch screen interfaces in terms of driving simulator and glance metrics. Paper II investigates correlations between data from customer evaluations and expert evaluations for visual-manual interfaces. Paper III searches for the presence of and possible explanations for individual glance strategies in a driving simulator study. Paper IV investigates effects of individual glance strategies on the NHTSA visual-manual distraction test in a driving simulator set-up. In the thesis it is concluded that the optimal input device is dependent on the task being performed, that is, the touch screen is more efficient for alphanumeric input while rotary control performs list scrolling more efficiently. In addition, drivers seem to adapt their glance behaviour based on the display position. It is evident that efficiency metrics correlate between several usability evaluation methods. Hence, it is possible to generalise results from expert evaluations at an early design phase, to customer survey samples based on car ownership. Concerning glance behaviour, it is clear that individual glance strategies exist. Especially interesting are two glance strategies, long glancers and frequent glancers, that affect the results of the NHTSA compliance testing. These glance strategies have to be controlled for in the test situation. Finally, a framework is proposed that combines a classification of visual-manual actions with different visual fixations. The task analysis framework has the potential to analyse actions in terms of required visual resources, thus already providing an evaluation of visual-manual interfaces in the concept phase. Keywords: Usability, In Vehicle Information Systems (IVIS), Input devices, Interfaces, Rotary Control (RC), Touch Screen (TS), Visual-manual interface (VMI), Driving simulator, Customer survey, Individual Glance Behaviour, Task-analysis, NHTSA, Distraction, Guidelines

ii
Acknowledgements I would like to thank Professor Peter Bengtsson, my supervisor at the Division of Engineering Psychology, Department of Human Work Sciences, Luleå University of Technology, for supporting me across experimental planning, statistical analysis, paper writing and other academic predicaments.
I would also like to thank my closest research fellows, Dr. Annie Rydström, Dr. Staffan Davidsson, Dr. Mikael Ljung Aust and Patrik Palo.
Annie, I thank you for sharing the burden and the complexities in our many simulator studies. You are a great colleague and a great researcher.
Staffan, I thank you for being a wonderful friend, and an experienced practitioner in the car industry with similar encounters as myself in bringing together the academic and industrial traditions. I think we have had some amazingly creative moments in our Workload case study, and also at the rehearsals in Gamlestan.
Mikael, I thank you for your peer reviews, your excellent support and sparring in the NHTSA topic, and for being an inspirational musician. I really admire your ability to always find time.
Patrik, I thank you for your stamina in undertaking continuous research applications in my area of research. I believe that your determination in these topics at Volvo will give you advantages in your next challenge as a long haul cyclist.
I also thank all colleagues at Volvo Car Corporation that work with driver interaction for bringing everyday challenges into my research, including my managers during most of this journey, Louise Floberg and Petter Hörling. I would also like to thank Professor Urban Kristiansson, probably the most tactical person that ever worked at Volvo Car Corporation, for encouraging me to be part of the Volvo Cars Industrial PhD program as a complement to my specialist carrier.
Thank you all. Without you this journey would neither have been possible nor relevant.
Lastly I send my highest form of admiration and love to my wife, Beatrice Broström, who has spent more than a lot of her time supporting me in all of the domestic challenges that three children bring, while I was hiding and writing.
Thank you Beatrice, this thesis is for you and our wonderful kids, Felix, Elliot and Ella !.
The PhD project was financially supported by the FFI research foundation for Automotive Research and Volvo Car Corporation.
Göteborg, August 2015 Robert Broström
iii
Appended papers I Rydström, A., Broström, R., & Bengtsson, P. (2012). A comparison of
two contemporary types of in-car multifunctional interfaces. Applied ergonomics, 43 (3), 507-514.
II Broström, R., Bengtsson, P., & Axelsson, J. (2011). Correlation between
safety assessments in the driver-car-interaction design process. Applied Ergonomics, Volume 42 (4), 575-582.
III Broström, R., Ljung Aust, M., Wahlberg, L., & Källgren, L. (2013). What
drives off-road glance durations during multitasking – capacity, practice or strategy? In Proceedings of the Third International Conference on Driver Distraction and Inattention, Göteborg, Sweden.
IV Broström, R., Bengtsson, P., & Ljung Aust, M. (2015). Individual glance
strategies and their effect on the NHTSA Visual Manual Distraction test. Re-submitted to Transportation research part F: Traffic psychology and behaviour, after proposals for minor revisions by reviewers.
The papers will be referred to by their Roman numerals.
iv
List of abbreviations AAM Alliance of Automobile Manufacturers ANOVA Analysis of Variance APEAL Automotive Performance, Execution and Layout EGDS Eye Glance Testing Using a Driving Simulator ESoP European Statement of Principles FVUB Forward View Uncertainty Buildup HMI Human Machine Interface ISO International Organization for Standardization IVIS In Vehicle Information Systems JAMA Japanese Automobile Manufacturers Association MGD Mean Glance Duration MRT The Multiple Resource Theory NHTSA National Highway Traffic Safety Agency pTGT Total glance time as percentage RC Rotary Control RCDET Rotary Control input device with Destination Entry Task RCSST Rotary Control input device with Sound Settings Task NASA-RTLX NASA Reduced Task Load Index SWRR Steering Wheel Reversal Rate TGT Total glance time TS Touch Screen TSDET Touch Screen input device with Destination Entry Task TSSST Touch Screen input device with Sound Settings Task UEM Usability Evaluation Method VMI Visual-Manual Interface VTI Swedish National Road and Transport Research Institute
v
Table of contents Abstract .......................................................................................................................... i!Acknowledgements ................................................................................................... ii!Appended papers ...................................................................................................... iii!List of abbreviations ................................................................................................. iv!Table of contents ......................................................................................................... v!1! Introduction ............................................................................................................ 1!
1.1! Objectives ..................................................................................................... 2!1.2! Limitations of the thesis ............................................................................. 3!
2! Frame of reference ................................................................................................. 5!2.1! Visual-manual interface definition ........................................................... 5!2.2! Visual-manual tasks .................................................................................... 6!2.3! The rapid expansion and integration of visual-manual interfaces ...... 7!2.4! Usability in the context of visual-manual interfaces .............................. 8!
2.4.1! Driving context and interaction with visual-manual tasks ....... 8!2.4.2! Differences in usability between input devices .......................... 9!
2.5! Individual differences among drivers .................................................... 10!2.6! Usability evaluation methods .................................................................. 11!
2.6.1! Formative and summative usability evaluation methods ....... 12!2.6.2! Usability evaluation methods for secondary tasks .................. 13!
2.7! The role of vision in driver interaction .................................................. 15!2.7.1! Visual activities in the brain ........................................................ 15!2.7.2! Functions of the eye ...................................................................... 15!2.7.3! Vision for driving .......................................................................... 16!2.7.4! Vision for visual-manual interfaces ............................................ 16!
2.8! Classification of visual actions and fixations ........................................ 17!2.8.1! Visual-manual interaction ............................................................ 17!2.8.2! The role of fixations ....................................................................... 17!
2.9! Guidelines for development of visual-manual interfaces ................... 18!3! Methods ................................................................................................................ 23!
3.1! Research theory ......................................................................................... 23!3.2! Test samples ............................................................................................... 24!3.3! Data acquisition ......................................................................................... 25!3.4! Data analysis .............................................................................................. 26!
4! Summary of appended papers .......................................................................... 27!4.1! Paper I ......................................................................................................... 27!4.2! Paper II ........................................................................................................ 29!4.3! Paper III ...................................................................................................... 30!4.4! Paper IV ...................................................................................................... 31!
5! Discussion ............................................................................................................. 33!5.1! Efficiency in visual-manual interfaces ................................................... 33!
5.1.1! Directness and efficiency .............................................................. 33!5.1.2! Display position and glance behaviour ..................................... 35!
5.2! Application of usability evaluation methods ........................................ 35!5.2.1! Correlation between formative and summative evaluations . 35!
5.3! Improvement of NHTSA compliance testing ....................................... 36!

vi
5.3.1! Differences in glance behaviour .................................................. 37!5.3.2! Changes to the test and analysis procedure .............................. 37!
5.4! Visual-manual task analysis framework ............................................... 38!5.4.1! Introduction to the framework .................................................... 38!5.4.2! Competing resources .................................................................... 39!5.4.3! Classification of visual effort in visual-manual tasks .............. 39!5.4.4! Exemplification of the framework .............................................. 40!
5.5! Methodological considerations ............................................................... 43!6! Conclusions .......................................................................................................... 45!7! Further work ......................................................................................................... 47!References .................................................................................................................. 48!Addendum: Test of visual-manual task analysis framework .......................... 59!

1
1 Introduction In the context of in-vehicle information systems (IVIS) a new design trend has emerged:
whatever you can do on your phone you should be able to do in your car without interacting with the phone
From a safety point of view, the interaction with IVIS while driving is part of a secondary task that can interfere with driving the car. However, from the driver’s point of view, with the expectations built up from what they can do on their smartphone, that secondary task is now becoming an increasingly important part of using the car. For example, in 2012 smartphone users spent 46% of their time on entertainment, 19% on socialising, twelve on seeking a product or a service, eleven on managing finances, and seven percent on planning for upcoming activities (How People Really Use Mobile, 2013). Hence, a new design situation has appeared. This challenges the development process of IVIS. IVIS development includes harmonization of strategic attributes, such as safety, usability and user experience. This is a multifaceted process influenced by several stakeholders. Safety measures are regulated by different principles and guidelines (AAM 2006; JAMA, 2004; NHTSA, 2013). To assess usability and user experience, usability evaluation methods (UEMs) are important for car companies. Examples of UEMs are simulator studies, expert evaluations, and customer satisfaction surveys (Broström, Bengtsson & Axelsson, 2007). An important aspect of usability in the context of IVIS is that better efficiency of visual-manual interfaces (VMIs) will reduce the demands imposed on the driver, hence allowing more visual resources to be dedicated to the driving task. However, UEMs for identifying usability issues in IVIS are often focusing on the later stages of the development process, at the point when it is too late for any findings to have practical impact on the final designs. Hence, there is a need for a new focus on usability and its evaluation at the earliest stages of development to ensure that practical improvements are made for better usability of IVIS and enhanced overall driving experience (Stanton & Young, 1999).
2
1.1 Objectives The purpose of this thesis is to study design implications for the development of visual-manual interfaces (VMIs) in cars. A point of departure is that the practice of the usability concept, usability evaluation methods (UEMs), and compliance tests has implications for the design process. More specifically, the objectives of the thesis are to:
1) Contribute to an increased knowledge VMI usability.
Usability depends on the complex relation between tasks, context-of-use, input devices, output devices, and users. Hence, the design challenge for VMIs includes knowledge of these relations. The purpose of VMIs today is to handle a majority of car functions, and to meet the continuous functional growth.
2) Understand the application of UEMs in formative and summative development phases. The formative development phase deals with usability issues from design prototypes while the summative phase evaluates the final designs. If formative evaluations can predict the real user reaction, the final design can be significantly improved.
3) Investigate the way in which the NHTSA visual-manual compliance
test could be improved in terms of sensitivity to individual differences. The NHTSA test has been criticised for being too sensitive to individual differences. A better understanding of the test can help in the development of new technology for safe driving.
4) Propose an analytical method for the formative development phase to guide the design of VMIs. Even though analytical methods are applicable at any stage of design, they should be applied as early as possible so that predictions to the design of VMIs can be made before spending resources on developing prototypes.

3
1.2 Limitations of the thesis This thesis is limited to visual-manual interfaces (VMIs) that are to be used while driving. Visual-manual interaction can be handled by many means of input, such as push buttons, touch controls, rotary controls, levers, gestures, and voice control. A further limitation to this thesis is that it investigates VMIs with rotary control (RC) and touch screen (TS) input. The studies included in the present thesis have all investigated design implications for VMIs that are used to operate secondary tasks by means of in-vehicle information systems (IVIS). However, all in all, the results and conclusions should be applicable to most types of VMIs in cars.

4

5
2 Frame of reference This chapter provides a framing of the context of visual-manual interfaces (VMIs) for in-vehicle information systems (IVIS) in cars. It defines terminology in the context of VMIs and provides theoretical reviews regarding identified design implications for VMIs. The chapter is divided into nine sections, where the first four sections give an overview and definition of the context in which VMIs are used. To gain an understanding of the relation between input and output devices, the sections also provide a literature review of differences between touch screen (TS) and rotary control (RC) input devices. The design challenge for VMIs includes understanding differences in the driver population. The fifth section therefore provides a review of the mechanisms that mediate individual differences and how some of these differences can affect driver behaviour. To gain an understanding of how usability evaluation methods (UEMs) can be applied, the sixth section reviews UEMs and metrics of usability that can be used in different phases of the development of VMIs. As the driving is a task that relies very much on vision and on resources related to vision, sections seven and eight therefore reviews psychology literature related to vision. Finally, the ninth section goes through various design guidelines for VMIs.
2.1 Visual-manual interface definition In general, an interface is the aggregate of means by which users interact with a particular machine, device, computer program, or other complex system (Griffin & Baston, 2007). One can say that the user interface is the space where interactions between humans and machines occur. This space is known to be a challenge for designers of complex systems. According to Norman (2002), designers often have a clear model of the system image but not as clear an understanding of the user´s model of the system. User interfaces usually include the interactive aspects of e.g. computer interfaces, door handles, process controls, and car interfaces. This includes tasks such as starting an application, opening a door, monitoring and regulating process quality, and setting a destination with a VMI. In the vehicle domain, the user interface is often referred to as the human machine interface (HMI). In this thesis, a VMI is the space that provides the user´s model and is a combination of an input device, for example a TS or a RC, an output device, such as a graphical display, and a visual-manual task (Figure 1).

6
Figure 1. An illustration of a visual manual interface (VMI) for a touch screen (TS) and a rotary control (RC) input device. The VMI is the combination of an input device, an output device (a graphical display), and a visual-manual task. The VMI is the means by which the drivers interact with the IVIS and by which the task is carried out.
2.2 Visual-manual tasks Functions in IVIS can improve aspects of roadway use by providing navigational information, traffic information, and vehicle data (Seppelt & Wickens, 2003). These functions can also improve comfort by allowing control of the climate, entertainment, including audio features such as radio, CD, and MP3, and visual media. They also provide the driver with the opportunity to communicate via telephone and Internet applications. This functional growth will likely continue with increased speed. Today the majority of IVIS functions are implemented in the area of car entertainment and communication. Improved maps, new sensors, more connected functions, and information based on cars talking to cars and cars communicating with the infrastructure will continuously increase the number of interactions with IVIS functions. In practice, the design trend is that whatever you can do on your phone, you should be able to do in your car, without interacting with the phone.
!!!!!!
Driver!
TS!
IVIS!
VMI!
Task!!!!!!!
Driver!
Display!
IVIS!
VMI!
Task!
RC!

7
2.3 The rapid expansion and integration of visual-manual interfaces
There has been an extensive evolution in computer and communication technologies during the past decades. In the last ten years these technologies have also become an integrated part of our cars via IVIS. Today three centre panel layout configurations are available on the market that control IVIS functions. These are called conventional, hybrid and integrated layouts (Tan, Okamoto & Irinatsu, 2004). Conventional centre panel layouts contain dedicated displays and controls for each sub-system, while hybrid layouts contain at least one common display shared by the sub-systems. Integrated centre panel layouts, on the other hand, have a single display and a set of controls that operate all sub-systems. The premium car segment has been dominated by integrated layouts for more than a decade to be able to incorporate more functionality in the car. An important design challenge, described by Tan et al., is to avoid cluttering the centre panel. In integrated centre panel layouts, there are two dominant input devices to control IVIS: TS and RC. The layouts are different in the way they are installed in the vehicle and how interaction is done. Since TS interaction is made directly with the display, the display has to be mounted near the driver for easy reach. In RC layouts, the display does not have to be reachable by the driver. Hence the display can be mounted either close to or farther away from the RC. Examples of these integrated layouts can be found among premium car manufacturers such as Audi, BMW, Jaguar, Lexus, Mercedes, Tesla and Volvo. According to a categorisation by Broström et al. (2007), TS input devices can be further divided into close control layouts and remote control layouts. In close control layouts, the mode buttons and multifunctional controls are arranged in close proximity to the display, while remote control layouts have mode buttons and multifunctional controls grouped in a position away from the display (Broström et al., 2007). Research has shown that lower button positions can have a negative effect on perceived safety (Dukic, Hanson, & Falkmer, 2006). Also, if fewer numbers of functions require indirect manipulation, drivers can interact more efficiently (Hutchins, Hollan, & Norman, 1985). In the car domain, indirect interaction can be demanding for driver resources because of their visual and manual demands (Wierwille, 1993b). This increasing number of functions available in cars today has started a debate about driver distraction and traffic safety risks from the use of IVIS. For example, the 100-car Naturalistic Driving Study, conducted in the United States in 2006, indicated that inattention caused by all secondary tasks accounted for 23 percent of all crashes and near crashes in the study (Klauer, Dingus, Neale, Sudweeks & Ramsey, 2006). Recently, the American National Highway Traffic Safety Administration (NHTSA, 2013) published a guideline that relates to IVIS. It contains specific requirements on the permitted content of IVIS while driving and strict requirements regarding the efficiency of VMIs.

8
2.4 Usability in the context of visual-manual interfaces
Due to this functional and regulatory revolution, usability of VMIs and UEMs has gained importance in the vehicle domain (Broström et al., 2007; Keinath, Durach, Eckstein, & Niedermaier, 2008; Mattes, 2003). The term usability was employed in professional and technical writing on the topic in the early 1980s (Bevan, Kirakowski, & Maissel, 1991). Almost twenty years after the first use of the term usability, Gray and Salzman (1998) stated, “Attempts to derive a clear and crisp definition of usability can be aptly compared to attempts to nail a blob of Jell-O to the wall.” (p. 242). There are several reasons why it has been so difficult to define usability. Usability is not a property of a person or thing. There is no thermometer-like instrument that can provide an absolute measurement of the usability of a product (Dumas, 2002). Usability is a developing property that depends on the relation between tasks, context-of-use, products, and users. What is clear about usability, however, is that methodologies described within usability are used to evaluate the efficiency, effectiveness and satisfaction of user interfaces (ISO, 1998). To bridge this general definition of usability relations into the perspective of the present thesis, it is important to emphasize the efficiency aspect of usability. Also, the tasks to be evaluated are related to visual-manual tasks, the context of use is the dual task of driving, the product that brings design opportunities for interaction designers is the combination of a visual-manual task, an input device and an output device (Figure 1). Therefore, the purpose of the following sections is to review and define terminology for usability and interface design for the purpose of this thesis.
2.4.1 Driving context and interaction with visual-manual tasks
Fastrez and Haué (2008) proposed that one of the most important contextual factors in defining usability for IVIS is that the use of these devices is not usually the driver’s main task. Instead, the majority of the time the driver will also be performing the primary task of driving the vehicle (Stanton & Young, 1998). The driving task is comprised of obeying traffic rules, handling steering and speed control, and paying attention to, and anticipating, the actions of other road users. This fact differentiates IVIS from many other products in terms of the dual task environment (Lansdown, Brook-Carter, & Kersloot, 2002). If too much effort and attention are diverted from the primary driving task to the interaction with IVIS then driving performance will be degraded, resulting in potential safety risks (Endsley, 1995; Matthews, Bryant, Webb, & Harbluk, 2001). The issue of degradation in dual task situations has been addressed in the multiple resource theory (Wickens, 2002). This theory assumes that there are

9
different resources, each with their own limited capacity. The theory proposes that the use of different resources will cause less interference in a dual-task situation than the use of common resources. For example, if two tasks engage different sensory modalities, there will be little dual-task effort compared to if two tasks engage the same sensory modality. When driving a car, the two hands can perform different tasks simultaneously, but using vision for other tasks than driving, require the eyes to be taken off the road. However, with practice, the interferences between tasks that use the same resources can be reduced. With practice, sensory-motor processes are developed and thus the dual task can be performed with less effort (Koch, 2004).
2.4.2 Differences in usability between input devices
TS and RC input devices have pros and cons, e.g. with respect to type of task (Rogers, Fisk, McLaughlin, & Pak) and context of use (Reimer, Mehler, Lammers, Wang, & Coughlin, 2009). Central to understanding how usability may vary between TS and RC is an understanding of the differences between the devices. First of all, TS allows straightforward interaction with the screen while RC requires translation between the hand and the screen (Rogers et al., 2005). Second, TS requires minimal training while RC often requires learning time (Greenstein, 1997). Third, while RCs are precise and give tactile feedback to the user, traditional TSs lack tactile and kinaesthetic feedback (Pitts, Burnett, Williams, & Wellings, 2010). TS also affects arm precision and arm fatigue, and the fingers can obscure the screen (Greenstein, 1997). On the other hand, as TS can control graphical objects directly on the screen, it supports novices in their learning of basic functionality quickly, while it also supports knowledgeable intermittent users in retaining the conceptual model (Hutchins et al., 1985). Comparative studies of TS and RC have found that precise operations and long distance moves are more effectively carried out with the RC, while the TS generally performs better when the system requires button pushing or other pointing tasks (Rogers et al, 2005). TSs generally have better performance for “pointing tasks” and RCs have better performance for “repetitive-precision tasks”. Moreover, TSs require minimal training while RCs often require learning time (Greenstein, 1997). In dual-task conditions such as solving visual-manual tasks while driving, VMIs have been criticized for interfering with the driving task. For example, a study done by Transport Canada found in assessing two premium cars with TS input devices that these could contribute to cognitive distraction by requiring drivers to remember what mode they were in (Burns, Trbovich, Harbluk & McCurdie, 2005). A major part of the criticism may be related to the multifunctional approach of integrating a majority of all IVIS functions in a single display. Functions that before could be reached by pressing a button now have to be accessed through several layers of menu (Burns et al., 2005). Previous research related to driving has also suggested that inputs via a TS require considerable visual attention because of the lack of tactile feedback

10
(Dingus, Hulse, & Barfield, 1998; Zwahlen, Adams, & DeBald, 1988; Burnett & Porter, 2001). Also, since the interaction is made directly with the display, it generally needs to be mounted in a low position near the driver for easy reach. Several studies have found that a low display position affects driving behaviour in terms of lateral control, longitudinal control, and event detection (Lamble, Laakso, & Summala, 1999; Wittmann et al., 2006). This low display position can be avoided with an RC, as it can be separated from the display. This allows the control to be positioned within comfortable reach and the display to be positioned high up on the instrument panel. On the other hand, TSs have the benefit of having an input device co-located in the display. Further, as all interaction is made with the display, it can be easily configured for any type of task (Pitts et al., 2010). As the TS is used as an input device, it also often makes use of pointing gestures, which is a familiar interaction method.
2.5 Individual differences among drivers The user group that interacts with VMIs is drivers that have music players, navigation systems, telephony, and/or other social media functions in their vehicles. This is a very large and very diverse user group, and it will thus include a range of individuals with variation in their capacity and their behaviour when using VMIs. Therefore, when designing VMIs, it is crucial to understand the differences among drivers. In many studies, significant variation generally exists between individuals. For example, individual variation in reading can be found with variation in working memory capacity (Daneman & Carpenter, 1980). Individual variations in capacity can also appear in visual search, motor speed and mental flexibility (Crowe 1998). Obviously, individual differences also influence driver behaviour. Variation in driving behaviour can be mediated by age (Lee, 2008), by attitude (Ulleberg & Rundmo, 2003), by physical deficits (Rike, Johansen, Ulleberg, Lundqvist, & Schanke, 2015) and by a driver’s motivation (Näätänen & Summala, 1976). It has previously been found that drivers change their behaviour depending on their goals, needs, and motivation (Näätänen & Summala, 1976). For example, when a stressor appears, such as an increased risk in a traffic scenario, or when drivers select to engage in other tasks than the driving task, they take different actions to compensate for the changed demand. Drivers can change strategy, add resources or remove stressors to cope with the changed demand (Hockey, 1997). Moreover, drivers can compensate for changed demand by mobilizing effort. The effort mechanism is active in the case of attention demanding information processing or in the case that the operator’s state differs too much from the required state (Hockey, 1986). According to this theory, central executive mechanisms compare the current cognitive state with a required or target state. Whenever there is a mismatch between these two states, changed effort can actively manipulate the current state towards

11
the target state. By investing mental effort, the harmful influences of stressors can be successfully counteracted. A similar way to compensate for changed demand is to adjust distance to factors such as time to collision, smooth and comfortable travel, and rule following (Summala, 2007). This mechanism results in a comfortable state called the "comfort zone". The same way of compensating for changed demand can be used for VMIs. If a VMI function is considered to be difficult to use, drivers can either increase the safety distance to preceding vehicles or avoid using that function (Broström & Davidsson, 2012). For example, a driver may turn down the volume on the radio when stressed, turn the telephone off in complex driving scenarios, or wait to input a destination until the car is stationary. Similar behavioural compensations were found in a simulator study that investigated effects of different TS positions (Fuller, Tsimhoni & Reed, 2008). The study tested four display positions and the results showed that drivers sacrificed completion time of the VMI task and increased the distance to the preceding vehicle to maintain safe driving performance. This was considered by the authors to be done in a similar manner as would have been done on the road. Individual differences among drivers are also reflected in their glance behaviour. A study by Donmez, Boyle, and Lee (2009) found differences in glance behaviour among young drivers. The simulator study found differences between drivers based on eye glance behaviour and driving performance measures. A significant difference between the low-risk, moderate-risk, and high-risk behaviours was that the high-risk group had significantly longer road glances than the other groups when solving VMI tasks. Wikman and Summala (2005) found in an open road study that the older age group among the participants had to glance for longer time with eyes off the road to complete the trail making test. They also found that the elderly group looked at the in-car display for longer periods of time and had a larger number of long glances (>2 sec). Another open road study (Aust, Dombrovskis, Kovaceva, & Svanberg, 2013) reported that off-road glance durations were quite robust within drivers but varied widely between drivers when VMI tasks were carried out. The study reported that a significant portion of the test participants were long glancers, i.e. had more than 15 percent glances over two seconds. Interestingly, this long glancing behaviour was present for individual participants even when the complexity of the VMI tasks varied.
2.6 Usability evaluation methods Interactive systems such as IVIS are usually designed through an iterative process. This process can be divided into three major stages of initial, prototype, and final design that are central to the iterative design process (Kies, Williges, & Rosson, 1998). To assess usability issues in an interactive system, some kind of UEM is normally used. The term UEM was defined by Gray and Salzman (1998) and refers to any method or technique used to

12
improve the usability of an interaction design at any stage of the design process.
2.6.1 Formative and summative usability evaluation methods
Hartson, Andre, and Williges (2003) further developed the work of Gray and Salzman (1998) and suggested a distinction of UEMs into two basic approaches, formative and summative UEMs. A formative evaluation focuses on the usability problem that needs to be solved during the prototype design stage before a final design can be accepted for release. The summative evaluation, on the other hand, is conducted to evaluate the final design or to compare competing design alternatives in terms of usability (Hartson et al., 2003). Several variants of UEMs can be applied to assess efficiency in the formative development phase of VMIs, for example analytical methods such as heuristic evaluation (Nielsen, 1992), and different forms of tasks analysis (Stanton & Baber, 2005). Several other analytical methods can be used in the formative phase. For example, according to a review by Harvey, Stanton, Pickering, McDonald, and Zheng (2011), hierarchical task analysis provides a breakdown of tasks into individual operations, e.g. move hand to controller, visually locate button, while multimodal critical path analysis provides an estimation of efficiency of the interaction, e.g. task completion time, modal conflicts, interference from the IVIS task. However, no analytical model yet exists that can predict glance behaviour (Harvey et al., 2011). Even though analytical methods are applicable at any stage of the design, they should be applied as early as possible so that predictions needed for the design of VMIs can be made before spending resources on developing prototype systems (Pettitt, Burnett, & Stevens, 2007). The reason for the popularity of heuristic analysis, such as the heuristic evaluation (Nielsen, 1992), lies in its simplicity and the fact that it can be carried out easily at any stage in the design process (Stanton & Salmon, 2012). A team of experts performs a series of interactions with the interface while evaluating the interface in relation to a predefined heuristics list. In the Nielsen heuristic evaluation, only six evaluators are needed to find more than 75% of the usability problems in an interface (Nielsen, 1992). Further, when applying UEMs, it is important that the data collected in the formative phase actually correlate with summative phases of development. Both Gray and Salzman (1998) and Hartson et al. (2003) identify a lack of validity of UEMs in terms of their ability to predict problems that users actually experience. Hartson et al. claim that usability issues found under formative evaluations shall predict the real users’ context, and thus have an impact on the final design. The emphasis on real users is important in this definition, because many of the UEMs evaluated in studies are usability inspection methods, where the inspectors encounter problems that do not always predict usability problems for real users. For example, the Nielsen
13
heuristic evaluation has been criticised for an evaluator effect as it involves interpretation of the heuristics (Hertzum & Jacobsen, 2001), as well as the type of problems that it detects (Wixon, 2003).
2.6.2 Usability evaluation methods for secondary tasks
In studies of accident causation, it has been concluded that many accidents and incidents are caused by secondary tasks (Klauer et al., 2006). It is important to note that the present definition of secondary tasks is much broader than the scope of IVIS. For example, as noted previously, the 100-car Naturalistic Driving Study, conducted in the United States in 2006, concluded that 23 percent of all crashes and near crashes were caused by secondary tasks (Klauer et al., 2006). However, according to the study, these secondary tasks contained several other categories of tasks than tasks with reference to IVIS. These categories were daydreaming, passenger related, internal not vehicle related, external distraction, dining, wireless devices, and personal hygiene. Still, the results of the 100-car Naturalistic Driving Study indicate that an efficient interaction design of IVIS is important, and it indeed has a potential to reduce conflicts between the primary driving task and the interaction with IVIS. In addition, it is important to note that efficiency is one of the three pillars that define usability (ISO, 1998).
ISO standard 9241-11, Guidance on Usability (ISO, 1998), defines usability as three distinct aspects: effectiveness, efficiency and satisfaction. Measures of effectiveness relate the users’ goal of exploiting a system to the accuracy (e.g. number of errors) and completeness (e.g. percentage of goals achieved) with which these goals can be achieved. Efficiency is described by the resources (e.g. task completion time and number of errors) spent in achieving the goals. Satisfaction measures users’ attitudes (e.g. frequency of complaints) towards the use of a product.
Hence, efficiency in this dual-task environment is a measure of the amount of effort used by the driver when interacting with secondary tasks such as visual-manual tasks and a key to understanding usability (ISO, 1998). The efficiency of VMIs is commonly assessed using empirical UEMs under simulated or real world conditions. When efficiency is objectively measured, the development process has often solved initial design problems, and a prototype system has been developed (Harvey, 2011). There are many UEMs that can be used to evaluate efficiency when interacting with VMIs. It is clear that the more quickly a user can complete a task with a system, the more efficient that system is for the task (Jordan, 1998). Hence, monitoring the task completion time gives an objective measure of the time spent away from the primary task, i.e. attending to the driving task and the road ahead. The more time spent on the visual-manual task, the less time available for attending to driving and therefore higher risk for accidents (Green, 1999).

14
Some of the most commonly used metrics that relate to visual efficiency are total glance time, glance frequency, mean glance duration and total glance time as a percentage. These can be used to evaluate interference from in-vehicle tasks (ISO 15007-2). These measures have been shown to vary between different visual-manual tasks (Tijerina, Parmer, & Goodman, 1998). Also, as found by Blanco, Biever, Gallagher, and Dingus (2006), glance frequency and total glance time have stronger associations to task completion time than to visual elements such as presentation format and information density. Mean glance durations, on the other hand, increase as a function of visual-manual task difficulty such as information density and the complexity of the driving scene (Victor, Harbluk & Engström, 2005). Total glance time as a percentage is expected to increase as visual demand increases (ISO 15007-2). Steering wheel reversal rate is an objective measure of steering frequency that relates to lateral control and which can be used to evaluate steering control effort (MacDonald & Hoffman, 1980). When a driver is engaged in a demanding in-vehicle task, he or she may have to increase the steering control effort to cope with the dual-task situation (Markkula & Engström, 2006). Steering wheel reversal rate is also sensitive to changes in arousal (Safford & Rockwell, 1967). It is also important to note that an increase in physiological arousal can be an indication of increased mental effort (Kahneman, 1973) such as the use of common resources in a dual-task situation (Wickens, 2002). In parallel to the objective measures presented above, there are also a number of subjective measures of usability. The ISO standard 9241-11 (ISO, 1998) concludes that measures based on users’ subjective evaluations can indeed provide guidance for the efficiency in a real user situation. It is thus recommended to obtain these data in situations where objective measures can not be collected. UEMs that apply a subjective measure can be used in any stage of design. One example is the NASA–RTLX (Byers, Bittner, & Hill, 1989). This is a subjective mental workload assessment tool that is used to measure efficiency of task performance. The method is used to derive an overall rating based upon an average of six sub-scale ratings: 1. Mental demand, 2. Physical demand, 3. Temporal demand, 4. Effort, 5. Performance, and 6. Frustration level. While experts often apply the NASA RTLX, there are several subjective methods that imply the direct involvement of users, such as observations, interviews, and questionnaires (ISO/TR 16982, 2002). In the car domain, questionnaires that collect data on car owners’ perceived efficiency are a key factor in decisions on new interaction and interior design concepts (Broström et al., 2007). The APEAL (Automotive Performance, Execution and Layout) market survey indicates customer opinions on several topics (J.D. Power, 2009). In the USA, feedback from about 100,000 new vehicle drivers is given yearly based on questionnaires that are sent to consumers during the first 90 days of ownership. The APEAL survey has become an essential step in the product improvement process for automotive manufacturers. The survey contains questions in different categories of vehicle performance and design data such

15
as instrument panel, comfort and convenience, heating, ventilation and cooling, sound system, and navigation system (J.D. Power, 2009).
2.7 The role of vision in driver interaction In the previous sections, the review shows that many usability and safety related methods include dual-task metrics. When driving a car and interacting with VMIs, the driver obviously needs to balance visual and other resources between the driving task and the VMI. As previously mentioned, the multiple resource theory (Wickens, 2002) proposes that there are several independent pools of resources to devote to task performance and also suggests that different resources will cause less interference in a dual-task situation than common resources. Hence, when two visual tasks are performed at the same time, they will interfere with each other if they both require visual attention (Koch, 2004). If two visual-motor tasks are carried out simultaneously, not only gaze but also the whole visual-motor system will be switched between tasks until one task is finalized (Land, 2006). Also, different visual-motor actions require different levels of attention. For example, reaching requires more precise representations to the visual-motor system than eye/head tracking (Victor, 2005).
2.7.1 Visual activities in the brain
There are two independent visual activities, vision for action and vision for identification, in the human brain that make use of both foveal and peripheral vision (Goodale & Milner, 2004). These two support motor control and object recognition, which activate different streams of neurons. Neurons that supervise motor control are unconsciously activated while neurons that handle object recognition are consciously activated (Findlay & Gilchrist, 2003). The visual-manual driving task requires vision to provide information to the vision for the action motor system for controlling the vehicle and visual information of the traffic scene to recognize objects, such as other vehicles and traffic signs (Land, 2006).
2.7.2 Functions of the eye
A glance is generally built up of head movements, eye movements, and fixations of the eye on an object of interest. Humans use two types of voluntary eye movement to track objects of interest using both eyes: smooth pursuit and saccades (Krauzlis, 2005). Smooth pursuits allow the eyes to closely follow a moving object while saccadic eye movements are quick, simultaneous movements of both eyes between fixation points. It is important, especially in driving situations and other time critical tasks, to note that visual processing is shut down when our eyes are moving in saccades (Rensink, 2002). This saccadic suppression could influence the driver’s judgment of the
16
dynamic traffic situation and thus cause a loss of important information that is necessary to maintain adequate situational awareness. When interacting with VMIs, glances typically consist of a series of fixations and saccades towards locations on the display followed by a transition to another location, for example the road scene (ISO 15007-1). Hence, glance length is determined by the sum of saccades and fixations within one glance and, as the saccades use about the same amount of time on every occasion (Land, 2006), glance length varies based on the number of fixations and the length of each fixation. The length of each fixation is affected by the complexity of the task. The separation between attention and fixation can be attained in very simple tasks (Posner, 1980); however, in more complex tasks such as reading, visual search, and scene perception, these are tightly linked (Posner, 1980). Hence, more attentional resources will shift towards visual-manual interaction with VMIs than towards purely manual IVIS tasks (Wierwille, 1993b).
2.7.3 Vision for driving
The main function of vision for action is to provide the driver with information needed to maintain lateral and longitudinal control, while the role of vision for identification is to identify other vehicles, cyclists and pedestrians. To maintain lateral control, the driver's eyes constantly scan the road environment for directional cues from far road information such as vanishing point, tangent points, and near road lane edges (Land, 2006). Both sources of visual information to the sensory motor control are necessary to maintain lateral control (Donges, 1978). For example, when driving along a winding road, eye fixations are made every second to determine tangents of the inner part of the curves (Land, 2006). The direction of this tangent is stored in a buffer for visual information and shortly translated into a corresponding steering wheel movement. The delay from the moment the eyes first fixate the tangent to the actual steering wheel movement is about a second, a time which is equivalent to many other visually demanding tasks such as reading, playing table tennis or preparing a pot of tea (Land, 2006). Hence, an important conclusion is that the eyes are proactive and seek out information that is required in about one second before the action takes place. Moreover, Land (2006) explains that the buffer works as a production line rather than a conventional memory system and thus will overwrite the visual information to prepare for the next action.
2.7.4 Vision for visual-manual interfaces
The above conclusion, based on human visio-motor functions, is in line with previous research on drivers’ visual behaviour. Dingus, Antin, Hulse and Wierwille (1989) stated that drivers do not tend to look away from the forward roadway longer than 1.6 seconds for any given glance. Based on the findings of Land (2006), it is likely that drivers that carry out visual-manual tasks have used their visual buffer within about 1-1.6 seconds and therefore must look

17
back to the driving scene. Wierwille (1993a) called this forward view uncertainty build-up (FVUB).
2.8 Classification of visual actions and fixations
2.8.1 Visual-manual interaction
To classify levels of visual engagement in visual-manual interaction, Wierwille (1993b) divided these actions into five categories: manual only, manual primarily, visual only, visual primarily and visual-manual. The first category, manual only, represents tasks that can be performed by one of the driver’s hands without visual reference. The second category, manual primarily, corresponds to tasks in which the driver uses vision to find a control and, as the hand approaches the control, vision is no longer required, such as in locating a push button. The third category, visual only, represents tasks in which no manual input is needed. The fourth category, visual primarily, stands for tasks in which vision is used both to locate and gather information, and some degree of manual input is needed, such as pushing a steering wheel button to accept a proposed re-routing in the navigation system. The final classification of visual-manual interaction is the visual-manual tasks. These tasks have interactive visual and manual demands. The driver gathers information to be used for the manual input and then confirms that the manual input was correct. These types of tasks include radio tuning, input of address in a navigation system, make a phone call, move through a menu system to find the appropriate function or simply adjusting the temperature. Visual-manual interaction with IVIS using buttons, knobs and displays obviously contains both manual and visual actions. Both manual and visual actions require time-sharing between the IVIS task and the driving task. While the hands have to be taken off the steering wheel when time-sharing, the eyes have to be taken off the forward roadway. An important difference is that the hands can perform different tasks simultaneously while the eyes have to share attention resources between the roadway and the display (Wierwille, 1993a).
2.8.2 The role of fixations
In addition to Wierwilles (1993a) for visual-manual classification, an extensive review of everyday activities by Land, Mennie, and Rusted (1999) classified the role of fixations that take place within a glance. The type of fixations was divided into four categories: locating, directing, guiding and checking fixations. The locating fixations are concerned with establishing the locations of objects, e.g. a button or a graphical object, without any associated motor activity at the time of the fixation. Directing fixations are concerned with a movement of the hand to contact an object. Generally, only a single fixation is involved, and the eye usually moves away from the object just before the hand

18
reaches it. Thus visual feedback is not involved in the last stage of the act. The main function of the directing fixation is to provide fovea-centered goal-position information to guide the arm/finger. Guiding fixations, on the other hand, are concerned with manipulations involving more than one object. Here, both objects have to be guided relative to each other so that they dock in an appropriate way, e.g. moving a finger to an exact position on a TS when driving on a rural road with an extended arm and a vertical acceleration component from an uneven road surface. It is more complicated than simple directing and usually involves a number of fixations that alternate between the two objects. The action is normally completed under visual control, e.g. moving the finger towards an icon on a TS or adjusting the cursor to the correct letter when using a TS. Checking fixations determine when some condition is met, for example the correct letter was selected, or the word is correctly spelled. These checking operations may require the eye to dwell on some appropriate region of an object, either in one long fixation or in a series of repeated fixations. When the specified condition is met, a new action is triggered. For example, when the correct letter is selected, the eyes look for the next appropriate letter. Interestingly, the hands themselves are never fixated, and, once objects have been acquired by the hands, they are not fixated either. An interesting implication of this finding is that vision is a scarce and valuable resource, and is disengaged from action as soon as another sense can take over from it (Land, 2006).
2.9 Guidelines for development of visual-manual interfaces
Driving is a task that relies very much on vision and resources related to vision. This has been recognised in transportation research for decades. Nearly thirty years ago Zwahlen et al. (1988) investigated the safety aspects of using a TS interface while driving. The study was carried out on an unused airport runway, and a cardboard mock-up was used as a TS. A device attached to the car that dropped liquid dye made it possible to monitor driving behaviour by measuring lateral path deviations made by the dye. Eye glances away from the road were counted manually, and the time it took to complete a task was recorded with a stopwatch. This example shows that the concern over distraction caused by the use of VMIs while driving is not new and that an evolution in test methodologies has occurred. Quite a lot of vision related research has suggested limits of glance duration, number of glances and total glance time. However, no adequate guidelines for visual behaviour yet exist (Lansdown, 2001). The work related to forward view uncertainty build-up (FVUB) (Senders et al., 1967; Wierwille, 1993b) suggests that an interface with appropriate usability should not force the driver to look away from the road more than about one second. This timing is in line with neuro-biological research by Land (2006), where a comprehensive review of research on eye movements and the control of actions suggests that correlation of the gaze angle and the steering wheel angle has its peak at 0.8

19
seconds, a delay between eye movements and actions that is equivalent to many other tasks where vision drives action (e.g. reading, walking or preparing a pot of tea). This suggests that vision is crucial and is used as a single resource for each task. Even if a number of guidelines related to visual behaviour have been suggested, no consensus has been reached. This can be exemplified by the advancement of several tentative design guidelines since the 1980s. First, Zwahlen (1988) proposed a guideline based on a hypothesis that suggests that: "if more than three looks are required inside the vehicle to obtain a specific chunk of information during a relatively short period of time then the task becomes uncomfortable for the driver since at the fourth look inside the vehicle an inadequate amount of road and traffic information is stored in the visual working memory of the driver" (page 7). The guideline that recommends pass/fail criteria for mean glance duration and maximum number of glances towards a display has been criticized since it is based on a hypothetical construct and because it does not consider the context in which glances into the vehicle occur (Lansdown, 2001). On the other hand, as the guideline provides insight, it could be applied in a worst case scenario such as busy inner city traffic (Lansdown, 2001). Second, the Alliance of Automobile Manufacturers (AAM, 2006) has suggested two "best practice" performance rules for visual and visual-manual tasks, the 2-second and the 20-second rule. The 2-second rule was created on the basis of an analysis of single glance durations on American public roads over a ten-year period (Rockwell, 1988). Based on the 1250 glances that were recorded during the vehicle studies, an engineering criterion of 2.0 seconds was suggested. It roughly represented the 85th percentile among the recorded glances. The 20-second rule was then derived by multiplying the 2-second rule with an estimate of the 85th percentile of the number of glances required (~10) when performing a radio tuning task. The number of glances required for the radio tuning task was estimated in another on-road study (AAM, 2006). Hence, the pass/fail criteria include the “2-second rule” for mean glance durations (MGD) and the “20-second rule” for total glance time (TGT). Designers that develop functions for moving vehicles should use these rules. Third, design guidelines by JAMA (2004) that apply to display systems that are installed in vehicles suggest pass/fail criteria for total glance time. The guideline states that: "operation of display monitors while a vehicle is in motion shall comply with the following critera or else be prohibited": 1. The total time of the driver's looking at the screen between the start and completion of operation task shall not exceed 8 seconds (TGT), 2. When the above total time is measured by a bench test using the occlusion method, the total of shutter opening time shall not exceed 7.5 seconds. Fourth, in the European Statement of Principles (ESoP), a number of design guidelines (principles) are suggested (ESoP, 2006). In paragraph 4.3.3.1. Information presentation principle I, it is mentioned that: "Visually displayed

20
information presented at any one time by the system should be designed such that the driver is able to assimilate the relevant information with a few glances which are brief enough not to adversely affect driving". In the ESoP, all principles include an explanation, a good and a bad example, a description of applicability and recommended verification methods. For this principle, the good example suggests "Easily legible and well structured graphics on a well positioned visual display which allows identification of the relevant menu item with one single glance of 1 second", while the bad example suggests "A navigation system which only offers support by a visual display rich in detail, which needs full and lengthy attention of the driver to identify a target on a moving map". In contrast to the earlier mentioned guidelines that include pass/fail criteria, the ESoP recommends a target level of one glance with a length of one second, instead of maximum limits on glance duration (Zwahlen et al., 1988; AAM, 2006; NHTSA, 2013; NHTSA, 2014), total glance time (AAM, 2006; JAMA, 2004; NHTSA, 2013; NHTSA, 2014), and glance frequency (Zwahlen et al., 1988). However, to provide a structured approach for assessing interface designs based on the ESoP, a checklist has been developed and aligned with the ESoP (Stevens, Quimby, Boards, Kersloot, & Burns, 2002). Fifth, results of field operational tests have shown increased risk correlated with certain glance behaviour. The 100-car on-road study (Klauer, Guo, Sudweeks, & Dingus, 2010) suggests that glances greater than 2.0 seconds by the driver away from the forward road scene are correlated with increased crash/near-crash risk. When drivers glanced away from the forward roadway for greater than 2.0 seconds out of a 6-second period, their risk of being involved in an unsafe event substantially increased relative to baseline (Klauer et al., 2010). On the other hand, a recent analysis of naturalistic driving study data (Victor et al., 2014) found that the majority of the crashes were associated with glances shorter than 2 seconds. A conclusion was that long glances are very rare and short glances are very common; thus a majority of the crashes occurred due to a combination of a relatively short glance and a high change rate in the traffic scene. Just recently, the US National Highway Traffic Safety Administration (NHTSA) proposed guidelines for reducing visual-manual driver distraction during interactions with integrated electronic devices. The purpose of these guidelines is to limit potential driver distraction from VMI tasks when interacting with non-driving related IVIS, e.g. information, navigation, communications, and entertainment tasks. The guidelines provide a structured approach for assessing interface designs by listing non-driving related tasks that are believed to interfere with safe control of the vehicle, and by proposing test procedures (NHTSA, 2013; 2014). These test procedures are meant to reduce distraction from visual-manual tasks and include e.g. an analytical step counting methodology (STEP) and a driving simulator test, Eye Glance Measurement Using Driving Simulator Test (EGDS). Using the STEP methodology, a task analysis should be carried out to assess the number of steps in a task. The maximum number of steps allowed

21
for a task to be recommended for use while driving has been set to six. The EGDS procedure, on the other hand, contains instructions on how to carry out a compliance test for visual-manual tasks in a simulator and includes performance criteria for three glance metrics: percent of glances over 2 seconds, mean glance duration and total glance time. The acceptance levels for these performance criteria have been defined on the basis of previous guidelines (AAM, 2006; JAMA, 2004), studies on visual performance for various radio tuning tasks (AAM, 2006; Rockwell, 1988), and the 100-car study (Klauer et al., 2010). In short, the acceptance criteria regarding the EGDS test from state that: A testable task should be locked out from performance by drivers while driving unless the following three criteria are all met:
1. For at least 21 of the 24 test participants, no more than 15 percent (rounded up) of the total number of eye glances away from the forward road scene have durations of greater than 2.0 seconds while performing the testable task one time.
2. For at least 21 of the 24 test participants, the mean duration of all eye glances away from the forward road scene is less than or equal to 2.0 seconds while performing the testable task one time.
3. For at least 21 of the 24 test participants, the sum of the durations of each individual participant’s eye glances away from the forward road scene is less than or equal to 12.0 seconds while performing the testable task one time.

22

23
3 Methods This chapter describes the methodologies used in the thesis (Table 1). It presents the engineering psychology research tradition in terms of test samples, data acquisition and data analysis. It also shows the appropriateness of UEMs in different phases of development for visual-manual interfaces (VMIs). For a more detailed description of the methods used in each paper, see the paper in question. Table 1. Summary of methods used in the appended papers Paper Data
acquisition Type of UEM Development phase Subjects/
Sample size I Simulator
test Empirical Formative 25 participants
I Interview Empirical Formative 25 participants II Expert
evaluation Analytical Formative/Summative 6 experts
II Customer survey
Empirical Summative 7692 consumers
II NASA- RTLX
Empirical Formative/Summative 6 experts
II On road test
Empirical Formative/Summative 6 experts
III Simulator test
Empirical Formative 16 participants
III Trail-making test (TMT)
Empirical n/a *
16 participants
IV Simulator compliance test
Empirical Formative/Summative 18 participants
* TMT is a capacity test that has no relation to development phase
3.1 Research theory The research presented in this thesis was carried out in a deductive manner, which means that research questions were put forward based on theoretical considerations (Starrin and Svensson, 1994). Both quantitative and qualitative data have been assessed. The discipline of engineering psychology is closely related to experimental psychology (Wickens & Hollands, 1999), and therefore control of variables, proper samples, and appropriate statistical analyses is

24
central (Goodwin, 2001). Also, as participants in the studies often represent consumers or developers of VMIs, knowledge about individual effects on qualitative data and the techniques for analysis of the qualitative methods are fundamental. It is of particular importance to understand whether formative evaluations actually predict the real user’s context and thus has an impact on the final design (Hartson et al., 2003). The studies reported in papers I, III, and IV were all empirical studies performed in a simulator laboratory. Participants drove a car simulator and concurrently interacted with different VMIs. In this driving context, the interaction with VMIs is secondary to the primary task of driving. Therefore, task performance, such as task completion time and glance related measures, is used to indirectly evaluate the impact of VMIs on the primary task of driving. This arrangement is most suitable for use in the formative phase of development. As described in the previous sections, interacting while driving can also have an impact on the primary task of driving. These demands can be assessed in the driving simulator since it records numerous measures of driving behaviour, for example lane keeping, speed, and distance to other vehicles. However, performance measures can also be of a subjective kind. In paper I, interviews were used to get participants’ view on effort; in paper II, an heuristic evaluation and self-reported task load index were used by evaluators, and questionnaires were filled out by real customers. These subjective sources of data also give relevant information about the usability of VMIs and can be used both in the formative and in the summative phase of development.
3.2 Test samples For papers I and IV, participants were randomly drawn from the Swedish car owner register. Owners of a Volvo C30, S40, V50 or XC90 model 2003 or later were selected to gather a group with experience of similar in-car interfaces. All were residents of the Gothenburg area and had held their driving license for at least five years. The final sample in paper I was comprised of 12 women and 13 men ranging in age from 27 to 69 years (M = 45.7, SD = 12.5) while paper IV included nine women and nine men ranging in age from 27 to 69 years (M = 41.7, SD = 11.9). Participants in paper II were collected from real customers and a set of experts. The sample of real customers came from the APEAL (Automotive Performance, Execution and Layout) survey of the USA market. This survey assessed customer opinions on in-vehicle information systems (IVIS) based on about 100,000 new vehicle drivers during their first 90 days of ownership. In paper II, answers from 7692 customers were sorted into five age groups (-34, 35-44, 45-54, 55-64, 65+) based on the cars assessed. The sample of experts in paper II was comprised of human factors professionals from the automotive
25
industry and the academia in Sweden. All were double experts, i.e. both knowledgeable in usability issues in general and about the vehicle domain in particular. The mean age among the three automotive experts was 43 (SD 12.2) years and was 34 (SD 11.6) among the three from academia. All automotive experts had more than eight years of experience in the field of HMI systems design. All the university researchers had worked with HMI analysis in the automotive industry for more than four years. One automotive expert and one university researcher were paired together during the assessment. Paper III had 30 participants that were randomly drawn from the database of the Swedish National Road and Transport Research Institute (VTI). Data from 14 participants had to be excluded due to poor eye-tracking quality. The 16 remaining participants were 25 to 54 years old (M = 36, SD = 8.6), nine men and seven women. All had held their driving license for at least five years.
3.3 Data acquisition In papers I and IV, interfaces were designed in Macromedia Director (Adobe Systems Inc., USA). The Macromedia script controlled the experimental order of the tasks, managed all graphical information, and logged all data. In paper II, both customers and experts evaluated the same interfaces in real cars on real roads. In paper III, a TS tablet computer was used to assess the prototype interfaces. The study described in papers I and IV was conducted using a fixed base Volvo XC90 simulator. In the simulator, a driving scene that simulated a curved rural road was projected on a screen in front of the participants. The radius of both the right and left curvatures was 1000 m and the signed speed limit was 90 km/h. There was on-coming traffic in the left lane, but no cars were present in the driving lane. The simulator had no rear view mirrors. In paper III, the data were collected using a moving base Saab 9-3 vehicle simulator with automatic transmission. Three LCD displays were used as rear view mirrors. Sound from vehicles, road and wind was simulated and presented via the car speaker system. The driving scene was a motorway with a signed speed limit of 90 km/h. There was oncoming traffic at an average rate of three vehicles per minute, and other cars overtook the participants once a minute on average. Slower vehicles had to be overtaken on average once every two minutes. Also, the simulators were equipped with sensors and logging apparatus for the collection of driving performance data. In papers I and IV, the faceLAB eye-tracking system (Seeing Machines, Australia) was used to log eye movements. The two eye-tracking cameras were mounted in front of the driver on the simulator dashboard, and eye movements were analysed in accordance with ISO metrics (ISO 15007-2). In paper III, a four-camera system from Smart Eye Pro 5.9 was used. Three cameras were positioned on top of the dashboard and one was positioned just to the right of the tablet computer.

26
Post driver interviews were used in paper I to gather participants’ preference for the interfaces and about the test situation. In paper II, on-road data from the expert evaluation were collected using a stopwatch and a paper based NASA–RTLX (Byers, Bittner, & Hill, 1989). Nielsen heuristics were collected during a stationary walk-through of the assessed cars (Nielsen, 1992). These data were compared with answers from the APEAL for the assessed cars. In paper III, the Trail Making Test was used to assess individual capacity in terms of visual search, motor speed and mental flexibility (Crowe 1998). In this study, a computerized version was used (Summala et al., 2008) and was carried out after the test drive.
3.4 Data analysis Two-factor, repeated-measures ANOVA with experimental conditions and task as the within-subject factors was used to analyse each dependent variable in paper I, and Sidak adjustments were used for post hoc pairwise comparisons of means. Data from the interviews were analysed using a qualitative method inspired by Flick (2006). The text was first read several times to gain an overall understanding of the data. Comparisons between the participants’ statements were made with respect to similarities and differences, and statements with similar meanings were grouped together in categories. In paper II, the data were analysed with one-factor ANOVAs with a layout as the within-subject factor. The Bonferroni procedure was used for post hoc pairwise comparisons of means. In paper IV, the data analysis was made according to the specifications in NHTSA guidelines, based on their visual performance as mean values for all six of the assessed interfaces. The proposed glance strategies were defined based on behavioural data on visual performance from previous research. Acceptance criteria from NHTSA´s visual-manual distraction (EGDS) test were used to assess the compliance of the tested interfaces.

27
4 Summary of appended papers This chapter provides summaries of the papers included in this thesis. Paper I focuses on differences between rotary control (RC) and touch screen (TS) interfaces in terms of driving simulator metrics and glance metrics. Paper II investigates correlations between results from customer evaluations and an expert evaluation for TS interfaces. Paper III searches for the presence of and possible explanations for individual glance strategies in a driving simulator study. Paper IV investigates effects of individual glance strategies on NHTSA´s Eye Glance Measurement Using Driving Simulator Test (EGDS).
4.1 Paper I The purpose of paper I was to compare usability effects of solving tasks with a TS and a TS input device. For the purpose of the thesis, paper I contributes to, firstly, objective 1, knowledge about usability for VMIs, and, secondly, objective 4, the proposal of an analytical method for the formative development phase to guide the design of VMIs. The paper reports a study in a fixed based driving simulator that was designed to compare the effects of carrying out a variety of tasks using a TS and a TS input device. A TS and interfaces manoeuvred by a RC with similar graphics were developed for the experiment. The experimental interfaces were designed to be similar to multifunctional systems available on the market. In the TS condition, the display was mounted at a lower position on the centre panel so that the participants were able to reach it easily. In the RC condition, the display was placed in a higher position and the TS was mounted between the front seats. The interfaces included the following functions: MP3 lists, an FM radio frequency band, address input in a navigation system, number entry in a telephone system, and sound setting adjustments. These functions were chosen since they represent different tasks that a multifunctional system needs to be able to assist, such as data entry and selection from continuous and discrete options. In the study, the participants drove on a curved rural road while performing tasks with the experimental interface. The tasks to be completed, e.g. “enter Dallas as destination”, were shown on the interface display. The experiment had a within-subject design with a random order of presentation for the tested interfaces. The experiment consisted of two major parts: a training session and an experimental session. In the training session, each participant practiced with all interfaces in five stationary trials and then practiced the same trials during driving. In addition to carrying out the experimental trials, a 30-s long

28
baseline, i.e. driving without performing visual-manual tasks, was also collected for each interface. The results showed that, in terms of task completion time and the number of glances made to the display, the optimal input device is dependent on the task being performed. The TS was better for entering a destination or a phone number, i.e. alphanumeric input tasks, and RC was better for the MP3 task and sound setting adjustments, i.e. list scrolling and continuous adjustments. These results were similar to previous comparisons between TS and RC in stationary set-ups. In terms of steering wheel reversal rate, it was shown that the MP3, navigation and telephone tasks were significantly better when using the RC. Also, the data for standard deviation of lane position were better for the RC when carrying out the MP3 and radio tasks. It was observed as well that tasks including alphanumeric input were more demanding than other tasks, independent of the input device used. Both input devices affected lateral control performance, but this performance deteriorated to a lesser extent when the RC was used. There were three particularly important findings in this study. First, it was clear that not one input device will always be best in terms of usability metrics. Second, the results showed that the TS had generally poorer interference with the driving related metrics such as standard deviation of lane position and steering wheel reversal rate. Third, it is interesting to conclude that these differences are present both in previous stationary tests and in the driving simulator test in this study. The result suggests that stationary tests produce relevant data in terms of usability in a formative evaluation such as a desktop simulation.

29
4.2 Paper II The purpose of paper II was to compare the results of two evaluation methodologies, a formative and a summative, to see the way in which the results correlated in terms of efficiency. For the purpose of the thesis, paper II contributes to: firstly, objective 1, knowledge about usability for VMIs; and, secondly, objective 2, understanding the application of usability evaluation methods (UEMs) in formative and summative development phases of VMIs. While paper I was carried out in a controlled car simulator set-up, this paper addressed a more real life usage approach by collecting comparable usability data from two studies: a formative and a summative. The formative study contained data from three methodologies, heuristics evaluation, on-road test and subjective workload, while the summative was a customer survey. Both studies included cars with TS input devices that were implemented in close control layouts and remote control layouts. The summative study was based on data from the APEAL (Automotive Performance, Execution and Layout) USA market survey containing cars with a minimum of three months on the market. Answers concerning subjective task efficiency when using the sound system and the navigation system were analysed in the paper. The formative study was based on the same premium cars. A team of human factors professionals collected both subjective workload data and objective task efficiency data based on an on-road test. A heuristics evaluation was also carried out while the cars were parked after the on-road test. The results of the summative survey data showed that close control layouts had a higher perceived task efficiency than the remote control layouts for both sound system and navigation system tasks. In the formative study, this result was confirmed by the metrics task completion time and NASA-RTLX. However, the Nielsen heuristics did not reveal any differences between the input devices that were evaluated. The results of the summative study show that the efficiency in sound and navigation system tasks was significantly higher for close control than for remote control layouts. The results strongly support the results of the formative, giving evidence of higher task efficiency and thus better usability and safety, in close control than remote control layouts. The joint results clearly prove a difference in efficiency between the two layouts. The efficiency and hence usability are higher for close control than remote control as concerns customer ratings, measurements of time required to complete tasks and measurements of mental workload. In addition, the paper shows a correlation between the formative assessment and the summative assessment as there is a high degree of consistency between the results.

30
4.3 Paper III The purpose of paper III was to study the prevalence of participants with long glancing behaviour and to investigate reasons for these regarding capacity, practice and strategy. For the purpose of the thesis, paper III contributes to objective 3, i.e., how the NHTSA visual-manual compliance test could be improved in terms of sensitivity for individual differences in terms of glance behaviour. A driving simulator study was set up to investigate possible underlying reasons for a relatively newly discovered population trait. Several VMI studies had found that a significant portion of their study participants had very long off-road glance times, independently of whether they were performing simple (non-visually demanding) or complex (visually demanding) tasks. In this study, all participants performed tasks of similar complexity, a radio task, a phone task, and a sound settings task in a tablet computer that was positioned in the centre stack of the car while driving. To test the possible effects of practice, all tasks were carried out in three sets. Participants’ visual maximum visual search capacity, as measured by a trail making test, was also tested after the simulator drive. The results showed no correlation between response times in the trail making test and frequency of long glances. No effect was found for glance duration. The glance duration was not significantly different between the tasks. However, glance duration was reduced as an effect of repetition for the phone and settings task, although not for the radio task. While maximum visual search capacity did not correlate with the propensity to use long off-road glances for the tasks performed, an important finding of this study was the high prevalence of long glancers among the test participants. This corroborates similar findings from previous studies. Interestingly, the same participants exceeded the 2-second limit independent of the task being solved. Another important finding was that the individual variation did not seem to come from individual capacity. Previous correlations on individual capacity were found on measures of central tendency, as this study analysed 85th percentile glance durations. This result indicates that glances in the upper tail could come from other individual factors, e.g. risk taking propensity and sensitivity to forward view uncertainty build-up.

31
4.4 Paper IV The purpose of paper IV was to investigate how individual differences in glance strategy could impact the glance performance test defined in the NHTSA visual-manual distraction guidelines. For the purpose of the thesis, paper IV contributes to: first, objective 2, application of UEMs in formative and summative development phases; second, objective 3, in what way the NHTSA visual-manual compliance test could be improved in terms of sensitivity for individual differences; and, finally, objective 4, an analytical method for the formative development phase to guide the design of VMIs. This paper investigated effects of individual differences on the NHTSA visual-manual distraction test. A driving simulator study was conducted. The driving scene was a rural road with oncoming traffic to encourage drivers to look back to the road when solving vehicle tasks. Six interfaces were designed according to the NHTSA step count methodology and other recommendations in the guidelines. The input devices were a TS and an RC, and the tasks were a radio tuning task, a sound setting task, and a destination entry task. To test for compliance with the NHTSA visual-manual distraction test, the glance metrics per interface were assessed towards NHTSA’s glance criteria. To reveal any evidence of individual glance behaviour, the glance data as a mean for all interfaces per participant were compared with levels of glance metrics from previous research. The results show that only two out of six interfaces were fully compliant. For example, the radio tuning task, which is recommended as a reference task that should have no problem in terms of complying, failed in the TS input mode. Also, the destination entry task failed in both input device versions, even though it was limited to the recommended maximum input of six characters. This result is best viewed in the context of the NHTSA guidelines, suggesting that drivers should be able to activate/open a phone, dial up to ten digits, and then press the ‘‘Send’’ or ‘‘Talk’’ button without exceeding the acceptance criteria. Previous studies of behavioural variability related to in-vehicle glances indicate an interesting approach to a further understanding of the present results. If participants have different task solving strategies that are reflected in their off-road glance duration values, the NHTSA’s assumption above, i.e. that the sampled group will not contain any variability that can influence results, becomes questionable. Put differently, one explanation for the interface failures above is that there is a mismatch between expected and actual sample variability. The results on individual glance behaviour show that participants indeed have different glance strategies. Optimizers have 0.8 seconds or less in mean glance
32
duration, a maximum of ~1 glance per task step and no glances over 2 seconds. Normal glancers have less than 1.6 seconds in mean glance duration, no more than three glances per task step and fewer than 15% glances over 2 seconds. Long glancers have more than 1.6 seconds in mean glance duration, or more than 15% glances over 2 seconds. Frequent glancers have more than three glances per task step. The interfaces were designed according to the task step method described in the guidelines, and it was expected that they all should comply with the performance test from the same guidelines. Based on the results, two main conclusions can be drawn. First, it is clear that individual variations in glance strategy exist. Second, these variations have a non-negligible influence on the results when performance testing of VMIs is done according to the NTHSA guidelines. Four categories of individual glance strategies were defined based on the data: optimizers, normal glancers, long glancers and frequent glancers. Test participants that are within the categories of long glancers or frequent glancers do affect compliance. The results show that, if these extreme glance behaviours were controlled for in the test, nearly all interfaces would comply. The only interface that did not comply was the six-step destination entry task when using the rotary control input device. Hence, if these outliers were controlled for, the results would be more in line with the anticipated compliance that NHTSA guidelines task descriptions put forward, and thus with the intention of the guidelines (a six-step task should comply according to the guidelines).

33
5 Discussion The purpose of this thesis was to study design implications for the development of visual-manual interfaces (VMIs) in cars. This chapter discusses and summarises the theoretical and experimental contributions of the thesis. The chapter is divided into four sections where the first section (5.1 Efficiency in visual-manual interfaces) contributes to understanding usability effects of the VMIs that were assessed in the different studies. In particular, it discusses how efficiency varies depending on different combinations of tasks, input devices, and the positioning of input devices and displays. The next section (5.2 Application of usability evaluation methods) discusses general methodological considerations when exploiting usability evaluation methods (UEMs), such as those that were used in the studies. The third section (5.3 Improvement of NHTSA compliance testing) contributes to an understanding of how individual glance strategies affect the NHTSA compliance test and proposes changes to the test and analysis procedure. The last section (5.4 Visual-manual task analysis framework) proposes a visual-manual framework that should be used in the formative development phase as a complement to present design guidelines for VMIs.
5.1 Efficiency in visual-manual interfaces The first objective in this thesis was to contribute to better knowledge about usability in terms of efficiency for VMIs. This objective was addressed in paper I and paper II. Paper I compared the effects of using a touch screen (TS) and a rotary control (RC) input device. The results showed that not one single input device is always best. For example, it was shown that the TS was better for alphanumeric tasks, while the RC was better for list scrolling and continuous adjustments. In paper II, comparisons between RC layouts showed that close control layouts had better efficiency for navigation and radio related tasks than remote control layouts, both in terms of customer survey data and on road test data.
5.1.1 Directness and efficiency
In paper I, as expected, the RC had better efficiency in terms of task completion time and the number glances for the adjustment tasks, i.e. MP3 and settings task. Also according to expectations, the TS had better efficiency for alphanumeric tasks, i.e. spelling a destination and dialling a phone number. It is clear from previous studies that TS and RC input devices differ quite a bit in terms of the way interaction is carried out. A TS is a direct device and does not require any translation between the input from the user and the action of the device (Rogers et al., 2005). In general, Rogers et al. (2005) found that TS performs better when the system requires button pushing or other pointing tasks, while precise operations and long distance moves are more

34
effectively carried out with an RC. The reason for this is that an input device like the RC requires translation between the input from the user and the action of the device. This way of interacting is considered to be indirect (Rogers et al., 2005; Davies & Thomas, 2001). Also, in paper IV, the result for total glance time was poorer in the destination entry task for the RC input device. Blanco, Hankey, and Chestnut (2005) showed that total glance time correlates well with the efficiency metrics for task completion time and the number of glances. Somewhat unexpectedly, the results in paper I show that the TS had higher values for steering wheel reversal rate than the RC for the navigation and telephone tasks. This difference may be due to the fact that the task completion times in those tasks were shorter for the TS, which could induce higher steering wheel reversal rate values. An alternative interpretation could be that the participants had to increase the steering control effort to cope with the dual task situation (Markkula & Engström, 2006) when interacting with the TS. In paper I, participants expressed that the RC was less phsysically demanding since the hand was held in a comfortable and relatively fixed position during interaction. Many participants mentioned that it was tiring to interact with the TS during long sequences since the arm needed to be stretched out and moved around. However, most of the participants also mentioned that, during normal driving, they would not carry out any tasks with such intensity as in the experiment. Hence, this tiring problem in the case of the TS seemed to be exaggerated during test conditions like this due to the large number of tasks performed in a short space of time. In addition, both input devices worsened lateral control performance compared to baseline driving. The opinions expressed by the participants correspond well with comparisons of efficiency in customer surveys. A paper by Broström et al. (2007) analysing the APEAL customer survey study by JD Powers showed that TSs have better results than RCs in questions of understanding and ease of use. Another important finding from previous research is that direct manipulation of the kind that can be found in TSs supports novices in their learning of basic functionality quickly, and also helps knowledgeable intermittent users in retaining the conceptual model (Hutchins, Hollan, & Norman, 1985). In line with previous research (Dukic et al., 2006), the results in paper II showed that differences between two configurations of RC layout differed in efficiency. Close control layouts had better results than remote control layouts for navigation and radio related tasks, both in terms of on-road test data and customer survey data, i.e. task completion time, self-reported workload and perceived efficiency. The devices differed in two ways. First, close control layouts had the display and the set of multifunction control in close proximity, while the remote control layouts separated the control and display. The separation of controls and display allowed a comfortable operation for the remote control layouts. However, the lower positions of the input device, as in the case of remote control layouts, may have had a negative effect on perceived safety, as shown
35
in the paper of Dukic et al. (2006). The reason for the better performance of the close control layouts could therefore depend on the higher position of the buttons and the greater amount of direct manipulation in radio and navigation tasks. In addition, as reported by Hutchins et al. (1985), direct manipulation interfaces, as for the close control layouts, are known to bridge the distance between users’ goal and the input device, thus reducing the visual and manual demands (Wierwille, 1993b).
5.1.2 Display position and glance behaviour
The interfaces in paper I were designed to be similar to the layout of TS and RC commonly used on the market: in the case of the TS, a low display position, and, in the case of the RC, a high display position. The results in paper I did not reveal any longer glance durations for the TS. However, results in paper IV indicate that the TS had longer mean glance durations than the RC when both displays were in the same low position. Although not completely statistically shown by the data, it seems as though the display position has an effect on glance behaviour. It has been found that drivers have a better ability to control the vehicle with peripheral vision when the display is in a high position (Summala, Nieminen, & Punto, 1996; Wittmann et al., 2006). This may have allowed the participants in paper I to make longer glances away from the forward roadway when interacting with the RC and the more highly positioned display. Previous research has also shown that lower display positions induce a compensatory effect on driving behaviour, such as distance to preceding vehicles (Fuller et al., 2008; Fuller & Tsimhoni, 2009). Hence, in the same manner, the low display position in paper IV may have induced a compensatory behaviour for the RC, meaning more efficient and shorter glances towards the display.
5.2 Application of usability evaluation methods The second objective of this thesis was to understand the application of usability evaluation methods (UEMs) in formative and summative development phases. This objective was addressed in papers II and paper IV. The results of paper II show correlations between one of two formative and a summative UEM. However, in paper IV, the results failed to show any correlation between the formative and the summative UEM.
5.2.1 Correlation between formative and summative evaluations
In the formative Nielsen heuristic evaluation (Nielsen, 1992), a team of experts performs a series of interactions with the interface while evaluating the interface in relation to a predefined heuristics list. Nielsen states that only six evaluators are needed to find more than 75% of the summative usability problems in an interface. In the studies described in paper II, results of the

36
formative heuristic evaluation and the summative APEAL customer survey were compared. This showed that the heuristics evaluation could not significantly differentiate between the assessed interfaces, even though differences between the same interfaces were found in the customer survey. Hertzum and Jacobsen (2001) stated that methods like the Nielsen heuristics involve interpretation that causes an evaluator effect, and thus reduce test reliability. This may have contributed to the non-correlating results. The Nielsen heuristic method has also been criticised for the type of problems that it detects (Wixon, 2003). In contrast, other formative methods used in paper II showed correlations with the customer survey. These methods included an on-road test where task completion time was measured and a subjective task load index (NASA-RTLX), reported by the evaluators. Hence, the on-road test and the task load index were predictors of customers’ perceived efficiency. This is an interesting finding, since metrics of efficiency, such as task completion time and task load, are easy and straightforward to collect in all phases of development (Green, 1999). The results suggest that these efficiency metrics are important for VMIs, as VMIs are often operated in dual-task conditions. This is in line with previous recommendations for using the NASA-RTLX method in dual-task situations, as it give realistic results on temporal demand, effort, performance and frustration level in dual-task conditions (Green, 1999). Task completion time, on the other hand, could also give relevant predictions when the car is stationary (Green, 1999). In paper IV, interfaces that were designed according to the formative step-counting method in the NHTSA guidelines were tested against the summative visual-manual performance test described in the same guideline (NHTSA, 2012). The results showed that only two of the tested interfaces were fully compliant with the test. Unexpectedly, the radio tuning task, which has been the basis for the glance criteria and thus should easily comply, failed for the TS. Similarly, the sound settings task failed to comply when the TS was used as an input device. Also a bit surprising is the fact that the destination entry task failed in both input device versions, even though it was limited to the recommended maximum input of six characters in the formative step counting method. These results are very important in terms of their lacking the ability to give recommendations in the formative development phase. A consequence might be that relatively final designs do not comply with the guidelines, which results in costly and time consuming re-designs.
5.3 Improvement of NHTSA compliance testing The third objective in this thesis was to investigate the way in which the NHTSA visual-manual compliance test can be improved in terms of its sensitivity to individual differences. This objective was addressed in papers III and IV. In previous research, the NHTSA test has been criticised for being too sensitive to variations in the data from individual participants. A better

37
understanding of how to make the test more robust would support the development of more efficient VMIs.
5.3.1 Differences in glance behaviour
In line with previous research, quite a few of the participants in paper III and paper IV had many glances towards the display that were longer than two seconds. These participants were called long glancers. Earlier studies (Aust et al., 2015; Aust et al., 2013) found that a significant portion of the test participants were long glancers. Aust et al. (2015) claimed that, if these long glancers were prevalent in the driver population at large, they would cause non-robust outcomes when testing VMIs with the NHTSA visual-manual performance test. In paper III, glance durations became shorter with repetition of the phone and settings tasks. This occurred even if drivers had practiced until they were comfortable performing the tasks prior to the trial. Hence, task practice while driving seems more efficient than practice while standing still. This was acknowledged in the amendment of the NHTSA guideline (NHTSA, 2013), where pre-trial practice was extended to include practice while driving before the actual data collection trial. In paper IV, additional glance behaviours were found beyond the already identified long glancers. These were named optimizers, normal glancers, frequent glancers, and long glancers. The results showed that both long glancers and frequent glancers had an effect in which VMIs complied with the NHTSA test. In particular, the results showed that the two extreme glance behaviours, long glancers and frequent glancers, caused several interfaces to fail the test. The reasons why this varying glance behaviour exists have not yet been empirically established. However, it has been found that drivers generally change their behaviour depending on their goals, needs, and motivation (Näätänen & Summala, 1976). Furthermore, a study by Donmez et al. (2009) found that participants with long glances towards the display belonged to a group of participants with a risk-taking strategy. This implies that the presence of different glance behaviours, such as long glancers and frequent glancers, could be mediated by general individual traits among the test participants or by behaviours that arise during the test situation.
5.3.2 Changes to the test and analysis procedure
It is unlikely that individual strategy differences can be controlled for by extensive practice prior to testing. In paper IV, the extensive training that preceded testing certainly did not eradicate the differences. Instead, to make the test more robust, the extreme glance strategies should be controlled for in the test situation.

38
For example, the effect of extreme glance behaviour could be reduced by evaluating data as mean values on a group level (Aust et al., 2015). This group level analysis has been recommended in the literature on experiment design and analysis, when between-group comparisons are made (Keppel & Wickens, 2004). Furthermore, the results reported in paper IV showed that long glancers and frequent glancers were statistical outliers. Consequently, these participants should be excluded from the analysis (Keppel & Wickens, 2004).
5.4 Visual-manual task analysis framework A fourth objective of this thesis was to propose an analytical method for the formative development phase to guide the design of VMIs. From the frame of reference chapter and the appended papers I and IV in this thesis, it is evident that the design of VMIs relies on the ability to understand and analyse consequences of glance behaviour. A concern of analysing final designs in empirical methods like the NHTSA compliance test is that the summative phase has reduced opportunities for design. Hence, an idea with this framework is to be able to make predictions for the design of VMIs before spending resources on developing prototype systems.
5.4.1 Introduction to the framework
Several variants of UEMs can be applied to assess efficiency in the formative development phase of VMIs. Examples of such methods are: heuristic evaluation (Nielsen, 1992), hierarchical task analysis (Stanton, 2006), and multimodal critical path analysis (Baber and Mellor, 2001). However, no analytical model yet exists that can predict glance behaviour (Harvey et al., 2011). Instead, a majority of the methods that assess visual behaviour in VMIs make use of empirical methods that are applied in the summative phase (Harvey, 2011). In the summative evaluations in papers I and IV, the objective metrics of efficiency for glance behaviour showed differences between the input devices. In paper I, the RC had fewer numbers of glances towards the display for the MP3 and settings task while the TS had fewer glances for the destination entry and the phone dialling task. In paper IV the TS generally had a longer mean glance duration than the RC. If an appropriate method for detailed analysis of glance behaviour had been present, the results on glance behaviour from papers I and IV could have been found without having to carry out a time consuming simulator study. The purpose of this framework is to be able to make predictions of visual behaviour in the formative development phase. These should be used to improve design solutions based on facts of human attributes, similar to the
39
guidance a seat designer gets from details of human anthropometry. Hence, the motivation for the framework is to increase the impact of knowledge of human factors in the formative phase of product development to give early guidance to interaction designers, rather than to react to poor design when it is too late to make any significant changes to the design (Stanton, Young, and Harvey, 2014).
5.4.2 Competing resources
As previously reviewed in the frame of reference, the multiple resource theory proposes that there are several independent pools of resources to devote to task performance (Wickens, 2002). The theory also suggests that different resources will cause less interference in a dual-task situation than common resources. For example, if two tasks engage different sensory modalities, there will be little dual-task effort compared to the case in which two tasks engage the same sensory modality. When driving a car, the two hands can perform different tasks simultaneously. Interaction with VMIs, on the other hand, requires the eyes to be taken off the road. Furthermore, Koch (2004) assured that when two visual tasks are carried out at the same time, they will interfere with each other in terms of visual attention. In addition, when both tasks contain visual-motor actions, the whole visual-motor system will be switched between tasks until one task is finalized (Land, 2006). Since the visual-manual driving task for controlling the vehicle requires information from the visual-motor system, interaction with the VMI will therefore use the same resources. In addition, Victor (2005) concluded that different visual-motor actions require different levels of attention. For example, reaching requires more precise representations to the visual-motor system than eye/head tracking. This is very interesting for this exemplification of the framework, as visual-manual tasks indeed vary in their complexity (Victor et al., 2005).
5.4.3 Classification of visual effort in visual-manual tasks
The classification by Wierwille (1993b) was used as a starting point for the framework. As mentioned in the frame of reference chapter, this classification contains five categories of actions: manual only, manual primarily, visual only, visual primarily and visual-manual. The first category, manual only, represents actions that can be performed by one of the driver’s hands without visual reference. The second category, manual primarily, corresponds to actions in which the driver uses vision to find a control and, as the hand approaches the control, vision is no longer required, such as locating a push button. The third category, visual only, represents actions in which no manual input is needed. The fourth category, visual primarily, stands for actions in which vision is used both to locate and gather information, and where some degree of manual input is needed, such as pushing a steering wheel button to accept a proposed re-routing in the navigation system. The fifth and last category contain visual-manual tasks. The visual-manual tasks in modern cars of control basically everything. These tasks have interactive visual and manual demands where

40
the driver search for information followed up by a manual action. It also contain actions where vision guides the manual action until the task has been completed. To give further detail to the framework, each action was classified according to the kind of fixation it contains. A suitable starting point was considered to be the classifications by Land et al. (1999), described in the frame of reference. Land proposed that that the locating fixations establish the locations of objects, e.g. a button or a graphical object, without any associated motor activity at the time of the fixation. Directing fixations are concerned with a movement of the hand to contact an object. The main function of the directing fixation is to provide fovea-centered goal position information to guide the arm/finger. Guiding fixations, on the other hand, are concerned with precise guiding, e.g. moving a finger to an exact position on a touch screen. Guiding is more complicated than simple directing and usually involves a number of fixations. In addition, guiding fixation is normally completed under visual control. Checking fixations determine when some condition is met, for example the correct letter was selected or the word is correctly spelled. These checking operations may require the eye to dwell on some appropriate region of an object, either in one long fixation or in a series of repeated fixations.
5.4.4 Exemplification of the framework
For the purpose of this thesis, the definitions based on the categorisations of Wierwille (1993b) and Land et al. (1999) were used to exemplify visual-manual interaction in TS and RC devices. TS interaction can be described by five generic actions T1, T2, T3, T4 and T5 (Table 2).
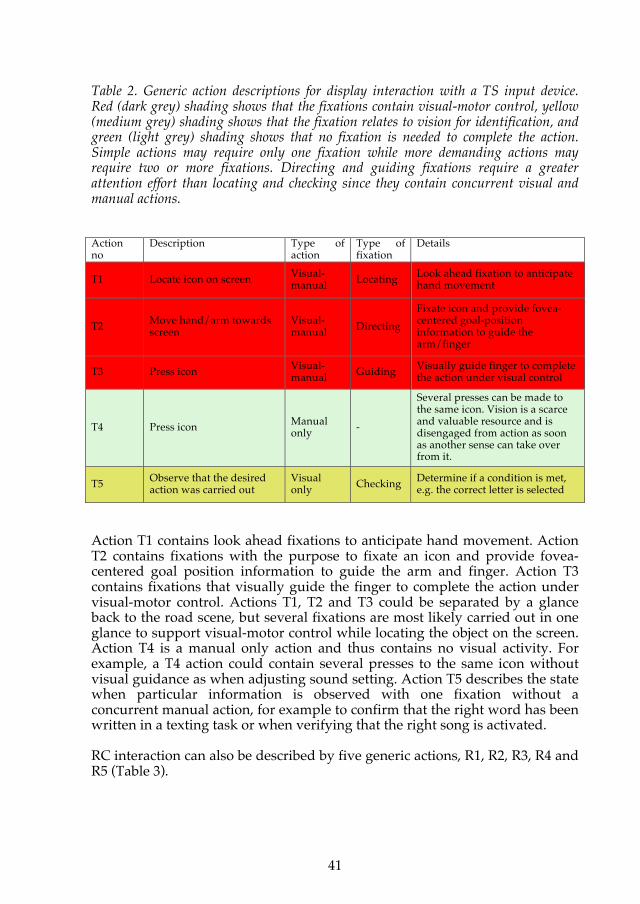
41
Table 2. Generic action descriptions for display interaction with a TS input device. Red (dark grey) shading shows that the fixations contain visual-motor control, yellow (medium grey) shading shows that the fixation relates to vision for identification, and green (light grey) shading shows that no fixation is needed to complete the action. Simple actions may require only one fixation while more demanding actions may require two or more fixations. Directing and guiding fixations require a greater attention effort than locating and checking since they contain concurrent visual and manual actions. Action no
Description Type of action
Type of fixation
Details
T1 Locate icon on screen Visual-manual Locating Look ahead fixation to anticipate
hand movement
T2 Move hand/arm towards screen
Visual-manual Directing
Fixate icon and provide fovea-centered goal-position information to guide the arm/finger
T3 Press icon Visual-manual Guiding Visually guide finger to complete
the action under visual control
T4 Press icon Manual only -
Several presses can be made to the same icon. Vision is a scarce and valuable resource and is disengaged from action as soon as another sense can take over from it.
T5 Observe that the desired action was carried out
Visual only Checking Determine if a condition is met,
e.g. the correct letter is selected
Action T1 contains look ahead fixations to anticipate hand movement. Action T2 contains fixations with the purpose to fixate an icon and provide fovea-centered goal position information to guide the arm and finger. Action T3 contains fixations that visually guide the finger to complete the action under visual-motor control. Actions T1, T2 and T3 could be separated by a glance back to the road scene, but several fixations are most likely carried out in one glance to support visual-motor control while locating the object on the screen. Action T4 is a manual only action and thus contains no visual activity. For example, a T4 action could contain several presses to the same icon without visual guidance as when adjusting sound setting. Action T5 describes the state when particular information is observed with one fixation without a concurrent manual action, for example to confirm that the right word has been written in a texting task or when verifying that the right song is activated. RC interaction can also be described by five generic actions, R1, R2, R3, R4 and R5 (Table 3).

42
Table 3. Generic action descriptions for display interaction with a RC input device. Red (dark grey) shading shows that the fixations contain visual-motor control, yellow (medium grey) shading shows that the fixation relates to vision for identification, and green (light grey) shading shows that no fixation is needed to complete the action. Simple actions may require only one fixation while more demanding actions may require two or more fixations. Directing and guiding fixations require a greater attention effort than locating and checking since they contain concurrent visual and manual actions. Action no
Description Type of action
Type of fixation
Details
R1 Check status of cursor Visual only Checking Find cursor on screen without
any associated motor activity
R2 Rotate control to move cursor towards wanted icon
Manual only - No fixation on screen needed
R3 Rotate control to adjust cursor to wanted icon
Visual-manual Guiding Visually guide cursor to complete
action under visual control
R4 Rotate control to adjust cursor to wanted icon
Manual only -
No fixations on screen needed. Make use of haptic marks or click counting
R5 Press control Manual only - No fixations on screen needed
Action R1 contains one checking fixation that initiates a task without concurrent manual control. Actions R2, R4 and R5 describe parts of a task when manual operations can be carried out without concurrent visual control, for example when moving a cursor towards an object on the screen or pressing the RC to activate a selected object. Action R3 describes fine tuning of the cursor to select a graphical object when rotating the control, for example adjusting to the correct letter in a spelling task. Based on the proposed framework and previously reviewed theory, it could be expected that glances containing several fixations would be longer than glances containing only one fixation. Land et al. (1999) pointed out that, since vision is a scarce and valuable resource, it would be disengaged from action as soon as another sense can take over from it. In addition, since the visual-manual driving task requires resources from the visual-motor system, it is likely that glances that contain visual-motor fixations have greater interference with the driving task (Land, 2006).

43
5.5 Methodological considerations The interfaces that were presented in papers I, III and IV were designed to test real-world conditions. That means that the tasks, the positioning of the input devices and displays imitated real systems. However, the interaction with the interfaces in paper I and IV were controlled, i.e. the tasks were predefined and system-paced. In natural interaction, tasks are self-paced and often drivers wait for appropriate traffic situations to interact with the task. Hence, in controlled studies, participants may be “forced” to act in situations where they would not normally solve tasks. There is obviously a trade-off in investigations between experimental control and ecological validity. Whereas field studies more closely match real-world situations, controlled studies provide the possibility to systematically compare different experimental conditions (Goodwin, 2001). The experiments in papers I, III and IV were carried out in driving simulators, and thus the ecological validity of the driving task was reduced. Even though the data collecting in paper III was carried out in a moving base-, and the data in paper I and IV had a fixed base simulator, both data sets contained long glancers. The study in paper II was based on data from the APEAL customer satisfaction survey with the opinions of real users assessing their own cars. These types of assessments are crucial within the car industry to understand how real customers perceive the design. Even if these surveys provide information for generating continuous quality improvements they should be examined carefully and used within a consistent framework (Lin & Jones, 1997). Hence, assessment of the APEAL customer survey involved a risk of selection bias, which could lead to an over-optimistic view of, e.g. perceived system efficiency. However, in paper II, the comparisons were made between cars within the same APEAL studies. This means that the same questionnaires were used to compare the same customer profiles, and to evaluate cars within the same premium car segment. This careful categorisation minimized the risk of a between-cars effect. Moreover, as previous research has found that working memory is reduced with increasing age (Pew and Hemel, 2004), the age-factor was used as means to increase sensitivity in the data. The second source of data, included in paper II consisted of experts evaluating the same systems as in the customer survey. Expert inspections have been heavily used within the car industry to identify safety issues (AAM, 2006; ESoP, 2006; Stevens et al., 1999). These inspections often use few evaluators, partly due to resource issues but also because less than six evaluators are known to find more than 75 percent of the present problem areas (Nielsen, 2005). There is indeed a risk of violating internal validity when using such a small sample participants. However, the proposed practice with expert evaluations is to use a maximum of six experts (Nielsen, 2005). Hence, to increase statistical power in the study, within subject design was used.

44

45
6 Conclusions The purpose of this thesis was to study design implications for the development of visual-manual interfaces (VMIs) in cars. The conclusions below are based on the discussion and are presented for each of the objectives in the thesis.
The optimal input device is dependent on the task being performed. A touch screen (TS) input device is more efficient for alphanumeric input, and a rotary control (RC) is more efficient for continuous adjustments and list scrolling. This emphasises the need to include tasks as well as the input device and the graphical display in the design process. Glance durations are longer in rotary control layouts with a high positioned display as compared to a rotary control in a lower position. Drivers seem to adapt to more efficient glance behaviour due to the low display position. Hence, there is a contradiction between recommendations in many guidelines where high display position is suggested (e.g. AAM, ESoP), and performance metrics for glance behaviour. Efficiency metrics correlate between several of the formative and summative usability evaluation methods (UEMs) in the thesis. Correlation is present between the formative/subjective task load index (NASA-RTLX) and the summative/subjective customer survey (APEAL), as well as between the formative/objective task completion time and the summative/subjective customer survey (APEAL). However, there are concurrently formative and summative UEMs where the efficiency metrics fail to correlate. For example, there is no correlation between the formative/analytical heuristic evaluation (Nielsen) and the summative/subjective customer survey (APEAL), neither between the formative/analytical step counting (NHTSA task analysis) and the summative/empirical compliance test (NHTSA). It is clear from the discussion that individual glance strategies exist. Two types of glance strategies, long glancers and frequent glancers, affected the results of the NHTSA compliance testing. Furthermore, pre-test practice does reduce glance times for some tasks. This may be due to the improvements that occur when test participants familiarise themselves with new tasks. Practice does not seem to have an effect in changing the long glancers´ behaviour. This implies that the strategy comes from a variation in individual behaviour rather than from individual capacity. To make the NHTSA test more robust, the extreme glance strategies should be controlled in the test situation. One simple solution is to exclude the outliers from the data; another is by means of statistical analysis.

46
Actions in in-vehicle tasks are classified according to how much visual and manual resources are required to carry out the task. However, even more interesting in the driving context is that different fixations in one glance interfere to a varying extent with the driving task. If both driving and IVIS tasks contain fixations with visual-motor control, the whole visual-motor system is switched between tasks until one task is finalized. For example, if a task is purely manual and well practiced, such as changing gear or turning on the blinker, it will not interfere with the driving task in the same way as if it includes visual guidance to be completed. Hence, the ability to identify the type fixations included in each action can help designers to understand the appropriateness of a certain interaction design. From the frame of reference and the discussion it is clear the existing analytical methods do not foresee effects on glance behaviour in final designs. The task analysis framework from the discussion has potential to differentiate actions in terms of the required visual resources.

47
7 Further work The compensatory effect that appears with varying display positions is an interesting area for further study, especially as the lower position improve glance efficiency metrics. The evidence that different glance strategies exist can be applied in present field operational test data. It would be interesting to see whether drivers that are long glancers have a higher! involvement in incidents or accidents than drivers that are normal glancers. Moreover, in relation to individual glance strategies and compliance testing, knowledge about effects of personal traits on extreme glance behaviour could be of general interest and have a potential to improve the NHTSA test procedure. The reason for the non-correlating results between NHTSA´s step counting method and NHTSA´s compliance test may be that step counting does not include instructions as how to estimate the visual effort needed in each task step. Hence, the visual-manual task analysis framework described in this thesis could be tested for correlation with the NHTSA compliance test.

48
References AAM. Driver Focus-Telematics Working Group. (2006). Statement of principles, criteria and verification procedures on driver interactions with advanced in-vehicle information and communication systems. Alliance of Automotive Manufacturers. Aust, M. L., Dombrovskis, S., Kovaceva, J., & Svanberg, B. (2013). An empirically based suggestion for reformulating the glance duration criteria in NHTSA's visual-manual interaction guidelines. SAE International Journal of Passenger Cars-Electronic and Electrical Systems, 6(2013-01-0444), 444-453. Aust, M. L., Rydström, A., Broström, R., & Victor, T. (2015). Reliability Improvement Needed in the Eye Glance Measurement Using Driving Simulator Test. In 24th International Technical Conference on the Enhanced Safety of Vehicles (ESV) (No. 15-0398). Baber, C., & Mellor, B. (2001). Using critical path analysis to model multimodal human–computer interaction. International Journal of Human-Computer Studies, 54(4), 613-636. Bevan, N., Kirakowski, J., and Maissel, J. (1991). What is usability? In H. J. Bullinger (Ed.), Human Aspects in Computing, Design and Use of Interactive Systems and Work with Terminals, Proceedings of the Fourth International Conference on Human Computer Interaction (pp. 651-655). Stuttgart, Germany: Elsevier Science Publishers. Blanco, M., Hankey, J. M., & Chestnut, J. A. (2005, September). A taxonomy for secondary in-vehicle tasks based on eye glance and task completion time. In Proceedings of the Human Factors and Ergonomics Society Annual Meeting (Vol. 49, No. 22, pp. 1975-1979). SAGE Publications. Blanco, M., Biever, W. J., Gallagher, J. P., & Dingus, T. A. (2006). The impact of secondary task cognitive processing demand on driving performance. Accident Analysis & Prevention, 38(5), 895-906. Broström, R., Engström, J., Agnvall, A., & Markkula, G. (2006). Towards the next generation intelligent driver information system (IDIS): The Volvo car interaction manager concept. In Proceedings of the 2006 ITS World Congress (p. 32).
49
Broström, R., Bengtsson, P., & Axelsson, J. (2007). Perceived styling and usability in integrated centre panel layouts as a function of interaction style and age. Human Factors Issues in Complex System Performance, Shaker Publishing, Maastricht, 193-204. Broström, R., & Davidsson, S. (2012). Towards a model to interpret driver behaviour in terms of mismatch between real world complexity and invested effort. Work: A Journal of Prevention, Assessment and Rehabilitation, 41, 5068-5074. Burnett, G. E., & Porter, J. M. (2001). Ubiquitous computing within cars: Designing controls for non-visual use. International Journal of Human-Computer Studies, 55(4), 521-531. Burns, P.C., Trbovich, P.L., Harbluk, J.L., & McCurdie, T. (2005). Evaluating one screen/one control multifunction devices in vehicles (Report 05-0339). Ottawa, Canada: Transport Canada. Davies, M.L., & Thomas, B.H. (2001). An animated 3D manipulator for distributed window-based applications. In Proceedings of the 2nd Australasian Conference on User Interface (pp. 116–123). Washington, DC, USA: IEEE Computer Society. Crowe, S. F. (1998). The differential contribution of mental tracking, cognitive flexibility, visual search, and motor speed to performance on parts A and B of the Trail Making Test. Journal of clinical psychology, 54(5), 585-591. Daneman, M., & Carpenter, P. A. (1980). Individual differences in working memory and reading. Journal of verbal learning and verbal behavior, 19(4), 450-466. Dingus, T. A., Hulse, M. C., Antin, J. F., & Wierwille, W. W. (1989). Attentional demand requirements of an automobile moving-map navigation system. Transportation Research Part A: General, 23(4), 301-315. Dingus, T. A., Hulse, M. C., & Barfield, W. (1998). Human-system interface issues in the design and use of advanced traveller information systems. In W. Barfield & T. A. Dingus (Eds.), Human Factors in Intelligent Transportation Systems (pp. 359-395). Mahwah, NJ: Erlbaum. Donges, E. (1978). A two-level model of driver steering behavior. Human Factors: The Journal of the Human Factors and Ergonomics Society, 20(6), 691-707. Donmez, B., Boyle, L. N., & Lee, J. D. (2009). Differences in off-road glances: Effects on young drivers’ performance. Journal of transportation engineering, 136(5), 403-409.

50
Dukic, T., Hanson, L., & Falkmer, T. (2006). Effect of drivers’ age and push button locations on visual time off road, steering wheel deviation and safety perception. Ergonomics, 49, 78-92. Dumas, J. S. (2002, January). User-based evaluations. In The human-computer interaction handbook (pp. 1093-1117). L. Erlbaum Associates Inc. Endsley, M. R. (1995). Toward a theory of situation awareness in dynamic systems. Human Factors: The Journal of the Human Factors and Ergonomics Society, 37(1), 32-64. ESoP, 2006. European Statement of Principles on Human Machine Interface. Retrieved from ftp://ftp.cordis.europa.eu/pub/telematics/docs/tap_transport/hmi.pdf Fastrez, P., & Haué, J. B. (2008). Designing and evaluating driver support systems with the user in mind. International journal of human-computer studies, 66(3), 125-131. Findlay, J. M., & Gilchrist, I. D. (2003). Active Vision: The Psychology of Looking and Seeing. Oxford: Oxford University Press. Flick, U. (2006). An Introduction to Qualitative Research (3rd ed.). London: Sage. Fuller, H., & Tsimhoni, O. (2009). Glance strategies for using an in-vehicle touch-screen monitor. Fuller, H., Tsimhoni, O., & Reed, M. P. (2008, September). Effect of in-vehicle touch screen position on driver performance. In Proceedings of the Human Factors and Ergonomics Society Annual Meeting (Vol. 52, No. 23, pp. 1893-1897). Sage Publications. Goodale, M., & Milner, D. (2004). Sight Unseen: An Exploration of Conscious and Unconscious Vision. Oxford: Oxford University Press. Goodwin, C. J. (2001). Research in Psychology: Methods and Design (3rd ed.). New York: Wiley. Gray, W. D., & Salzman, M. C. (1998). Damaged merchandise? A review of experiments that compare usability evaluation methods. Human–Computer Interaction, 13(3), 203-261. Green, P. (1999). Navigation system data entry: estimation of task times (No. UMTRI-99-17).

51
Greenstein, J., 1997. Pointing devices. In: M. Helander, T.K. Landauer, and P. Prabhu, eds. Handbook of human- computer interaction. Oxford: Elsevier Science, 1317–1348. Griffin, B., & Baston, L. (2007, March 13). Interfaces. Retrieved August 19, 2015, from http://peace.saumag.edu/faculty/kardas/Courses/CS/Interfaces2007_files/Interfaces2007.ppt Harvey, C. (2011). Modelling and evaluating drivers’ interactions with in-vehicle information systems (IVIS) (Doctoral dissertation, University of Southampton). Harvey, C., Stanton, N. A., Pickering, C. A., McDonald, M., & Zheng, P. (2011). A usability evaluation toolkit for in-vehicle information systems (IVISs). Applied ergonomics, 42(4), 563-574. Hart, S. G., & Staveland, L. E. (1988). Development of NASA-TLX (Task Load Index): Results of empirical and theoretical research. Advances in psychology, 52, 139-183. Hartson, H. R., Andre, T. S., & Williges, R. C. (2001). Criteria for evaluating usability evaluation methods. International journal of human-computer interaction, 13(4), 373-410. Hertzum, M., & Jacobsen, N. E. (2001). The evaluator effect: A chilling fact about usability evaluation methods. International Journal of Human-Computer Interaction, 13(4), 421-443. Hockey, G.R.J. (1986). A state control theory of adaptation and individual differences in stress management. In G.R.J. Hockey, A.W.K. Gaillard and M.G.H. Coles (Eds.), Energetics and human information processing (pp. 285-298). Dordrecht, The Netherlands: Martinus Nijhoff Publishers. Hockey, G.R.J., 1997. Compensatory control in the regulation of human performance under stress and high workload: a cognitive energetical framework. Biological Psychology, 45, 73– 93. How People Really Use Mobile. (2013). Retrieved September 4, 2015. Hutchins, E. L., Hollan, J. D., & Norman, D. A. (1985). Direct manipulation interfaces. Human–Computer Interaction, 1(4), 311-338. ISO 15007-1. Road vehicles—Measurement of driver visual behaviour with respect to transport information and control systems. Part 1: Definitions and parameters.

52
ISO 15007-2. Road vehicles—Measurement of driver visual behaviour with respect to transport information and control systems. Part 2: Equipment and procedures. ISO/TR 16982. (2002). Ergonomics of human-system interaction – Usability methods supporting human-centred design. ISO, W. (1998). 9241-11. Ergonomic requirements for office work with visual display terminals (VDTs). The international organization for standardization. Japanese Automobile Manufacturers Association (JAMA), 2004. Guideline for In-Vehicle Display Systems—Version 3.0. Retrieved from http://www.umich.edu/~driving/documents/JAMA_guidelines_v30.pdf. J.D. Power, 2009. Retrieved from http://www.jdpower.com/ corporate/news/releases/pressrelease.aspx?ID_2008078 (accessed 30.10.2009). Jordan, P. W. (1998). An introduction to usability. CRC Press. Kahneman, D. (1973). Attention and effort (p. 246). Englewood Cliffs, NJ: Prentice-Hall. Keinath, A., Durach, S., Eckstein, L., & Niedermaier, B., 2008. The BMW iDrive -The next step of a revolution. In: Proceedings of the 2008 Applied Human Factors and Ergonomics Conference, Las Vegas. Keppel, G., & Wickens, T. D. (2004). Design and Analysis: A Researcher’s Handbook (4th ed.). Upper Saddle River, NJ: Prentice Hall. Kies, J. K., Williges, R. C., & Rosson, M. B. (1998). Coordinating computer�supported cooperative work: A review of research issues and strategies. Journal of the American Society for Information Science, 49(9), 776-791. Klauer, S. G., Dingus, T. A., Neale, V. L., Sudweeks, J. D., & Ramsey, D. J. (2006). The impact of driver inattention on near-crash/crash risk: An analysis using the 100-car naturalistic driving study data (No. HS-810 594). Klauer, S. G., Guo, F., Sudweeks, J., & Dingus, T. A. (2010). An analysis of driver inattention using a case-crossover approach on 100-car data: Final report (No. HS-811 334). Koch, C. (2004). The Quest for Consciousness: A Neurobiological Approach. Englewood: Roberts and Company Publishers. Krauzlis, R. J. (2005). The control of voluntary eye movements: new perspectives. The Neuroscientist, 11(2), 124-137.
53
Lamble, D., Laakso, M., & Summala, H. (1999). Detection thresholds in car following situations and peripheral vision: Implications for positioning of visually demanding in-car displays. Ergonomics, 42(6), 807-815. Land, M. F., Mennie, N., & Rusted, J. (1999). Eye movements and the roles of vision in activities of daily living: making a cup of tea. Perception, 28(4), 1311-1328. Land, M. F. (2006). Eye movements and the control of actions in everyday life. Progress in Retinal and Eye Research, 25(3), 296-324. Lansdown, T. C. (2001). Causes, measures and effects of driver visual workload. Stress, Workload and Fatigue. Lansdown, T. C., Brook-Carter, N., & Kersloot, T. (2002). Primary task disruption from multiple in-vehicle systems. ITS Journal-Intelligent Transportation Systems Journal, 7(2), 151-168. Lee, J. D. (2008). Fifty years of driving safety research. Human Factors: The Journal of the Human Factors and Ergonomics Society, 50(3), 521-528. Lin, B., & Jones, C. A. (1997). Some issues in conducting customer satisfaction surveys. Journal of Marketing Practice: Applied Marketing Science, 3(1), 4-13. Macdonald, W. A., & Hoffmann, E. R. (1980). Review of relationships between steering wheel reversal rate and driving task demand. Human Factors: The Journal of the Human Factors and Ergonomics Society, 22(6), 733-739. Markkula, G., & Engström, J. (2006). A steering wheel reversal rate metric for assessing effects of visual and cognitive secondary task load. In Proceedings of the 13th ITS World Congress, London, 8-12 October 2006 Mattes, S. (2003). The lane-change-task as a tool for driver distraction evaluation. In H. Strasser, K. Kluth, H. Rausch & H. Bubb (Eds.), Quality of Work and Products in Enterprises of the Future (pp. 57-60). Stuttgart, Germany: Ergonomia Verlag. Matthews, M., Bryant, D., Webb, R., & Harbluk, J. (2001). Model for situation awareness and driving: Application to analysis and research for intelligent transportation systems. Transportation Research Record: Journal of the Transportation Research Board, (1779), 26-32. National Highway Traffic Safety Administration. (2013). Visual-Manual NHTSA Driver Distraction Guidelines for In-Vehicle Electronic Devices (Docket No. NHTSA-2010-0053). Washington, DC: US Department of Transportation National Highway Traffic Safety Administration (NHTSA).

54
National Highway Traffic Safety Administration. (2014). Visual-Manual NHTSA Driver Distraction Guidelines for In-Vehicle Electronic Devices (Docket No. NHTSA-2014-0088). Washington, DC: US Department of Transportation National Highway Traffic Safety Administration (NHTSA). Nielsen, J. (1992, June). Finding usability problems through heuristic evaluation. In Proceedings of the SIGCHI conference on Human factors in computing systems (pp. 373-380). ACM. Norman, D. A. (2002). The Design of Everyday Things. Näätänen, R., Summala, H., 1976. Road User Behaviour and Traffic Accidents. North-Holland/American Elsevier, Amster- dam, New York. Pettitt, M., Burnett, G., & Stevens, A. (2007). An extended keystroke level model (KLM) for predicting the visual demand of in-vehicle information systems. In Proceedings of the SIGCHI Conference on Human Factors in Computing Systems (pp. 1515-1524). ACM. Pitts, M. J., Burnett, G. E., Williams, M. A., & Wellings, T. (2010, November). Does haptic feedback change the way we view touchscreens in cars?. In International Conference on Multimodal Interfaces and the Workshop on Machine Learning for Multimodal Interaction (p. 38). ACM. Posner, M. I., (1980). Orienting of attention. Quarterly Journal of Experimental Psychology, 32, 3–25. Reichheld, F. F. (1996). Learning from customer defections. Harvard business review, 74(2), 56. Reimer, B., Mehler, B., Lammers, V., Wang, Y., & Coughlin, J. F. (2009, October). A comparison of three manual destination entry methods on their impact on visual attention and driving performance: an on-road evaluation. In Proceedings of the Human Factors and Ergonomics Society Annual Meeting (Vol. 53, No. 23, pp. 1757-1761). Sage Publications. Rike, P. O., Johansen, H. J., Ulleberg, P., Lundqvist, A., & Schanke, A. K. (2015). Exploring associations between self-reported executive functions, impulsive personality traits, driving self-efficacy, and functional abilities in driver behaviour after brain injury. Transportation research part F: traffic psychology and behaviour, 29, 34-47. Rockwell, T. H. (1988). Spare visual capacity in driving-revisited: New empirical results for an old idea. In Vision in Vehicles II. Second International Conference on Vision in Vehicles.

55
Rogers, W. A., Fisk, A. D., McLaughlin, A. C., & Pak, R. (2005). Touch a screen or turn a knob: Choosing the best device for the job. Human Factors: The Journal of the Human Factors and Ergonomics Society, 47(2), 271-288. Safford, R. R., & Rockwell, T. H. (1967). Performance decrement in twenty-four hour driving. Highway Research Record. Senders, J. W., Kristofferson, A. B., Levison, W. H., Dietrich, C. W., & Ward, J. L. (1967). The attentional demand of automobile driving. Highway Research Record, (195). Seppelt, B., & Wickens, C. D. (2003). In-vehicle tasks: Effects of modality, driving relevance, and redundancy. Urbana: Aviation Human Factors Division, University of Illinois at Urbana-Champaign. Stanton, N. A. (2006). Hierarchical task analysis: Developments, applications, and extensions. Applied ergonomics, 37(1), 55-79. Stanton, N. A., & Baber, C. (2005). Validating task analysis for error identification: reliability and validity of a human error prediction technique. Ergonomics, 48(9), 1097-1113. Stanton, N. A., & Salmon, P. M. (2012). Human factors methods: a practical guide for engineering and design. Ashgate Publishing, Ltd. Stanton, N.A., & Young, M.S., 1998. Ergonomics methods in consumer product design and evaluation, in: N.A. Stanton, (ed). Human factors in consumer products. Taylor and Francis, London, 21-54. Stanton, N.A., Young, M.S., 1999. A guide to methodology in ergonomics: designing for human use. Taylor and Francis, London. Stanton, N. A., Young, M. S., & Harvey, C. (2014). Guide to methodology in ergonomics: Designing for human use. CRC Press. Starrin, B., & Svensson, P. G. (1994). Kvalitativ metod och vetenskapsteori. Stevens, A., Quimby, A., Boards, A., Kersloot, T., & Burns, P. (2002). Design Guidelines for Safety of In-vehicle Information Systems (Report PA3721/01). Berkshire, UK: Transport Research Laboratory. Summala, H., Nieminen, T., & Punto, M. (1996). Maintaining lane position with peripheral vision during in-vehicle tasks. Human Factors: The Journal of the Human Factors and Ergonomics Society, 38(3), 442-451.
56
Summala, H. (2007). Towards Understanding Motivational and Emotional Factors in driver Behaviour: Comfort through Satisfaction. in Cacciabue, P. C. (ed.). Modeling Driver Behaviour in automotive environments. Springer. London. UK. Summala, H., Etholén, T., Leino, N., Niskakangas, M., Laine, M. & Saarinen, S. (2008). FR-TMT: Visuospatial (working) memory in a computerized Trail-Making test. Poster presented at the Psykologia 2008 Congress, August 20-22, Helsinki. Tan, A.K., Okamoto, M., & Irinatsu, T. (2004). Strategy and Challenges for an Integrated HMI (Report Convergence Transportation Electronics Association 2004-21-0091). Tokyo, Japan: Nissan Motor Co. Tijerina, L., Parmer, E., & Goodman, M. J. (1998, October). Driver workload assessment of route guidance system destination entry while driving: A test track study. In Proceedings of the 5th ITS World Congress (pp. 12-16). Ulleberg, P., & Rundmo, T. (2003). Personality, attitudes and risk perception as predictors of risky driving behaviour among young drivers. Safety science, 41(5), 427-443. Victor, Trent. "Keeping eye and mind on the road." (2005). Victor, T. W., Harbluk, J. L., & Engström, J. A. (2005). Sensitivity of eye-movement measures to in-vehicle task difficulty. Transportation Research Part F: Traffic Psychology and Behaviour, 8(2), 167-190. Victor, T., Bärgman, J., Boda, C. N., Dozza, M., Engström, J., Flannagan, C., ... & Markkula, G. (2014). Analysis of Naturalistic Driving Study Data: Safer Glances, Driver Inattention, and Crash Risk (No. SHRP 2 Safety Project S08A). Wickens, C. D., & Hollands, J. G. (1999). Engineering Psychology and Human Performance (3rd ed.). Upper Saddle River, NJ: Prentice Hall. Wickens, C. D. (2002). Multiple resources and performance prediction. Theoretical Issues in Ergonomic Science, 3(2), 159-177. Wikman, A. S., & Summala, H. (2005). Aging and time-sharing in highway driving. Optometry & Vision Science, 82(8), 716-723. Wierwille, W. W. (1993a). Demands on driver resources associated with introducing advanced technology into the vehicle. Transportation Research Part D: Emerging Technologies, 1(2), 133-142. Wierwille, W. W. (1993b). Visual and manual demands of in-car controls and displays. In B. Peacock & W. Karwowski (Eds.), Automotive Ergonomics (pp. 299-320). London, GB: Taylor & Francis.

57
Wittmann, M., Kiss, M., Gugg. P., Steffen. A., Fink. M., Pöppel, E., & Kamiya. H. (2006). Effects of display position of a visual in-vehicle task on simulated driving. Applied Ergonomics, 37, 187–199. Wixon, D. (2003). Evaluating usability methods: why the current literature fails the practitioner. interactions, 10(4), 28-34. Zwahlen, H.T., Adams, C.C., & DeBald, D.P. (1988). Safety aspects of CRT touch panel controls in automobiles. In A.G. Gale, M.H. Freeman, C.M. Hasselgrave, P.A. Smith, and S.P. Taylor (Eds.), Vision in Vehicles II (pp. 335-344). Amsterdam, The Netherlands: Elsevier.

58

59
Addendum: Test of visual-manual task analysis framework To examine the applicability of the task analysis framework outlined in section 5.4, a preliminary (yet unpublished) analysis was carried out. The purpose of the analysis was to verify the proposed framework in terms of its predictive capabilities of performance metrics in a driving simulator set-up. The analysis was made on data collected in paper IV and contained four interfaces. The theoretical basis for this assumption relies on the fact that different levels of visual-motor activity require different levels of resources. Hence, based on this framework, it could be hypothesized that actions with higher proportions of fixations that control visual-motor actions (locating, directing and guiding fixations) could interfere more with steering control than interfaces with low proportions of visual-motor actions. In addition, as the number of fixations affects glance duration, tasks that contain high proportions of actions with fixations may have longer glance durations than interfaces with low proportions of fixations. Application of the framework A timeline analysis (Stanton and Baber, 2005) was used to apply the task analysis framework on the interfaces (see illustration in appendix, Figure 2-5). If the framework were to be fully applied, task analysis could be made for more than one user category, for example: optimizers, normal glancers, long glancers or frequent glancers (see appended paper IV). In this addendum, however, the normal glancer scenario was reported. Two input devices, a rotary control (RC) and a touch screen (TS) was used. Four interfaces were tested. The interfaces consisted of a sound setting task carried out with a TS (RCSST), a sound setting task controlled with a TS (TSSST), a destination entry task carried out with a TS (RCDET), and a destination entry task controlled with a TS (TSDET), see Figure 1. Find more details about the interfaces and the test procedure in appended paper IV.
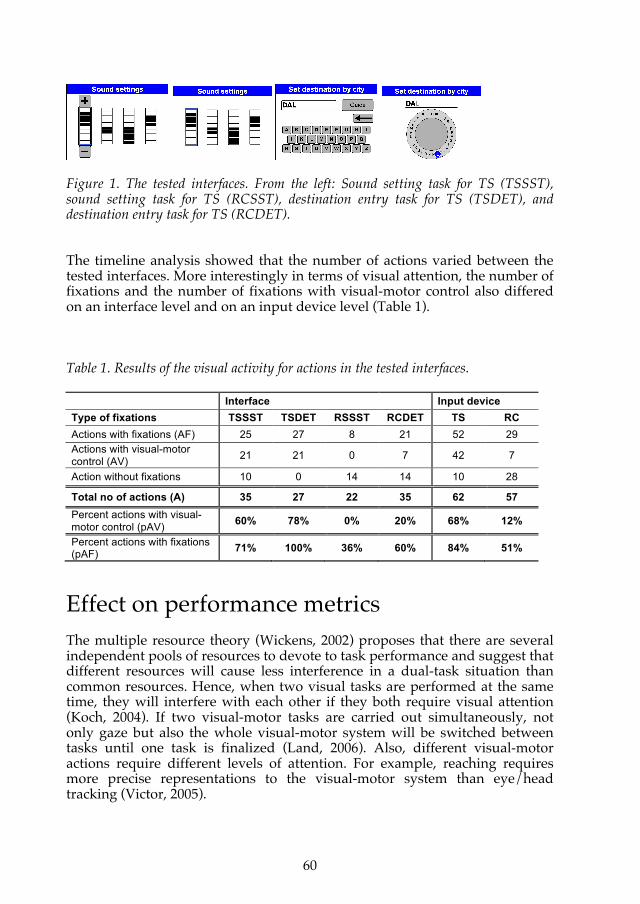
60
Figure 1. The tested interfaces. From the left: Sound setting task for TS (TSSST), sound setting task for TS (RCSST), destination entry task for TS (TSDET), and destination entry task for TS (RCDET). The timeline analysis showed that the number of actions varied between the tested interfaces. More interestingly in terms of visual attention, the number of fixations and the number of fixations with visual-motor control also differed on an interface level and on an input device level (Table 1). Table 1. Results of the visual activity for actions in the tested interfaces. Interface Input device Type of fixations TSSST TSDET RSSST RCDET TS RC
Actions with fixations (AF) 25 27 8 21 52 29 Actions with visual-motor control (AV) 21 21 0 7 42 7
Action without fixations 10 0 14 14 10 28
Total no of actions (A) 35 27 22 35 62 57
Percent actions with visual-motor control (pAV) 60% 78% 0% 20% 68% 12%
Percent actions with fixations (pAF) 71% 100% 36% 60% 84% 51%
Effect on performance metrics The multiple resource theory (Wickens, 2002) proposes that there are several independent pools of resources to devote to task performance and suggest that different resources will cause less interference in a dual-task situation than common resources. Hence, when two visual tasks are performed at the same time, they will interfere with each other if they both require visual attention (Koch, 2004). If two visual-motor tasks are carried out simultaneously, not only gaze but also the whole visual-motor system will be switched between tasks until one task is finalized (Land, 2006). Also, different visual-motor actions require different levels of attention. For example, reaching requires more precise representations to the visual-motor system than eye/head tracking (Victor, 2005).

61
Three metrics were used to test any effects of the differences identified in the task analysis: steering wheel reversal rate (SWRR), mean glance duration (MGD), and total glance time as percentage of task completion time (pTGT). Steering wheel reversal rate (SWRR) is an objective measure of steering frequency that relates to lateral control, which can be used to evaluate steering control effort (MacDonald & Hoffman, 1980). When a driver is engaged in a mentally demanding IVIS task, he or she may have to increase the steering control effort to cope with the dual-task situation (Markkula and Engström, 2006). SWRR is also sensitive to changes in arousal (Safford and Rockwell, 1967). Increased mental effort, as a result of increased task demand, induces a corresponding increase in physiological arousal (Kahneman, 1973). Mean glance duration (MGD) is an objective measure of visual behaviour that can be used to evaluate interference from visual tasks (ISO 15007-2). Mean glance durations increase as a function of task difficulty (e.g. information density) and, due to the complexity of the driving scene, e.g. longer glance durations on straight sections of the road than in curves (Victor, et al., 2005). Total glance time as a percentage of task completion time (pTGT) is an objective measure of visual behaviour that can be used to evaluate interference from visual tasks (ISO 15007-2). As visual demand increases, pTGT is expected to increase (ISO 15007-2). It was hypothesised that the variation in percent actions with visual-motor control (pAV) and the variation in percent actions with fixations (pAF) would have an effect on the proposed metrics. It was hypothesised that: 1) VMIs with higher percentages of actions that require visual-motor control
(locating, directing and guiding fixations) would have a higher steering wheel reversal rate (SWRR) than an interface with relatively lower percentages
2) an interface with higher percentages of actions that contain fixations
(locating, directing, guiding, and checking fixations) would create longer glance durations (MGD) than an interface with low percentages
3) an interface with higher percentages of actions that contain fixations
(locating, directing, guiding, and checking fixations) would create a higher pTGT than an interface with low percentages
A two-factor (task, input device), repeated-measures ANOVA with an input device (TS and RC) and task (SST and DET) as within-subject factors were used to analyse each dependent variable. If Mauchly's test of sphericity indicated that the assumption of sphericity had been violated, the degrees of freedom were corrected using Greenhouse-Geisser estimates of sphericity
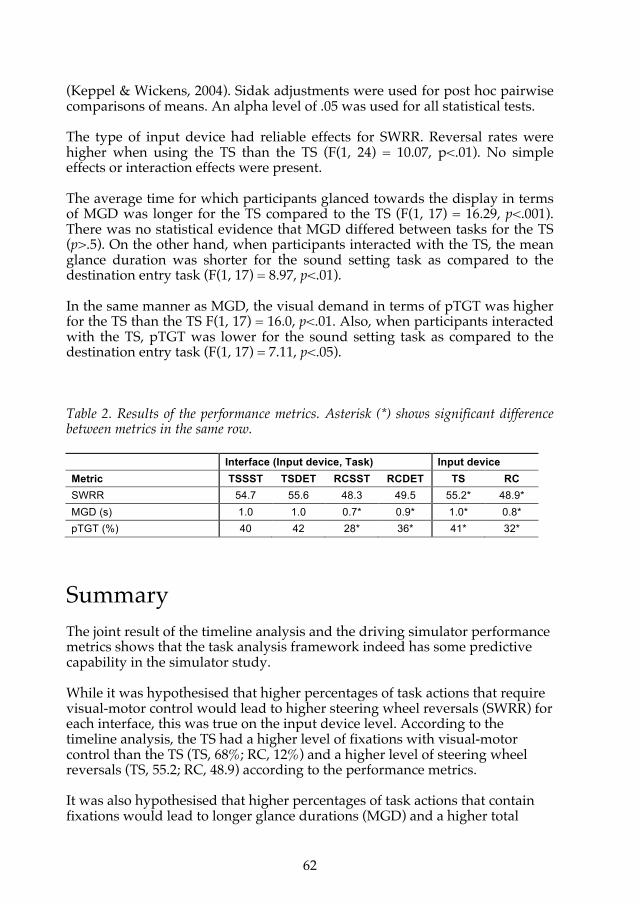
62
(Keppel & Wickens, 2004). Sidak adjustments were used for post hoc pairwise comparisons of means. An alpha level of .05 was used for all statistical tests. The type of input device had reliable effects for SWRR. Reversal rates were higher when using the TS than the TS (F(1, 24) = 10.07, p<.01). No simple effects or interaction effects were present. The average time for which participants glanced towards the display in terms of MGD was longer for the TS compared to the TS (F(1, 17) = 16.29, p<.001). There was no statistical evidence that MGD differed between tasks for the TS (p>.5). On the other hand, when participants interacted with the TS, the mean glance duration was shorter for the sound setting task as compared to the destination entry task (F(1, 17) = 8.97, p<.01). In the same manner as MGD, the visual demand in terms of pTGT was higher for the TS than the TS F(1, 17) = 16.0, p<.01. Also, when participants interacted with the TS, pTGT was lower for the sound setting task as compared to the destination entry task (F(1, 17) = 7.11, p<.05). Table 2. Results of the performance metrics. Asterisk (*) shows significant difference between metrics in the same row. Interface (Input device, Task) Input device
Metric TSSST TSDET RCSST RCDET TS RC SWRR 54.7 55.6 48.3 49.5 55.2* 48.9*
MGD (s) 1.0 1.0 0.7* 0.9* 1.0* 0.8* pTGT (%) 40 42 28* 36* 41* 32*
Summary The joint result of the timeline analysis and the driving simulator performance metrics shows that the task analysis framework indeed has some predictive capability in the simulator study. While it was hypothesised that higher percentages of task actions that require visual-motor control would lead to higher steering wheel reversals (SWRR) for each interface, this was true on the input device level. According to the timeline analysis, the TS had a higher level of fixations with visual-motor control than the TS (TS, 68%; RC, 12%) and a higher level of steering wheel reversals (TS, 55.2; RC, 48.9) according to the performance metrics. It was also hypothesised that higher percentages of task actions that contain fixations would lead to longer glance durations (MGD) and a higher total

63
glance time as percentage of task completion time (pTGT) than an interface with low percentages of fixations. According to the timeline analysis, the TS had a higher number of fixations than the TS (TS, 84%; RC, 51%). As hypothesised, the performance metrics showed the same difference between input devices for mean glance duration (TS, 1.0; RC, 0.8) and total glance time as percentage of task completion time (TS, 41; RC, 32). In addition, significant differences for the performance metrics were found between interfaces with the same input device. The sound setting task had both a lower mean glance duration (RCSST, 0.7; RCDET, 0.9) and a total glance time as percentage of task completion time (RCSST, 28; RCDET, 36) than the destination entry task for the TS input device. Hence, these results are in line with the results of the timeline analysis. While the present analysis should be viewed as preliminary, it illustrates the value of using a simple form of task analysis in early phases of development to predict effects on performance metrics that will be used in later phases, both as general assessment during development (ISO 15007-2), and as compliance test (NHTSA, 2013). In conclusion, this framework looks promising for use in examining interaction design prototypes and their effect on visual behavior. For example, interaction designers could use this task analysis framework for low fidelity prototypes, to estimate their visual-motor demand, and to respond to that knowledge with appropriate design solutions to minimize this effect.

64
Appendix: Timeline analysis
Figure 2. Red (dark grey) shading shows that the action contains fixations related to visual-motor control, yellow (medium grey) shading shows that the action contains fixations related to vision for identification, and green (light grey) shading shows that no fixation is needed to complete the action.
1.#Adjust#all#sound#settings#to#the#midpoint
Touch#screen
1.1#Adjust#first#bar
1.2#Adjust#second#bar
1.3#Adjust#third#bar
1.4#Adjust#fourth#bar
1.#Locate#icon#
2.#Move#arm
3.#Press#icon
4.#Press#icon
5.#Press#icon
6.#Press#icon
7.#Observe#that#the#desired#
value#was#selected
8.#Locate#bar#
12.#Move#arm
13.#Press#icon
14.#Press#icon
10.#Press#bar
9.#Move#arm
15.#Observe#that#the#desired#
value#was#selected
11.#Locate#icon#
16.#Locate#bar#
20.#Move#arm
21.#Press#icon
22.#Press#icon
18.#Press#bar
17.#Move#arm
26.#Observe#that#the#desired#
value#was#selected
19.#Locate#icon#
23.#Press#icon
24.#Press#icon
25.#Press#icon
27.#Locate#bar#
31.#Move#arm
32.#Press#icon
33.#Press#icon
29.#Press#bar
28.#Move#arm
35.#Observe#that#the#desired#
value#was#selected
30.#Locate#icon#
34.#Press#icon

65
Figure 3. Timeline analysis for interface RCSST. Red (dark grey) shading shows that the action contains fixations related to visual-motor control, yellow (medium grey) shading shows that the action contains fixations related to vision for identification, and green (light grey) shading shows that no fixation is needed to complete the action.
1.#Adjust#all#sound#settings#to#the#midpoint
Rotary#Control
1.1#Adjust#first#bar
1.2#Adjust#second#bar
1.3#Adjust#third#bar
1.4#Adjust#fourth#bar
1.#Identify#bar#
2.#Rotate#control
5.#Rotate#control#and#observe#that#
desired#value#is#selected
7.#Identify#bar# 11.#Identify#bar# 18.#Identify#bar#
6.#Press#control
3.#Rotate#control
4.#Rotate#control
9.#Rotate#control#and#observe#that#
desired#value#is#selected
8.#Rotate#control
10.#Press#control
12.#Rotate#control
13.#Rotate#control
14.#Rotate#control
15.#Rotate#control
16.#Rotate#control#and#observe#that#
desired#value#is#selected
17.#Press#control
19.#Rotate#control
20.#Rotate#control
21.#Rotate#control#and#observe#that#
desired#value#is#selected
22.#Press#control

66
Figure 4. Timeline analysis for interface TSDET. Red (dark grey) shading shows that the action contains fixations related to visual-motor control, yellow (medium grey) shading shows that the action contains fixations related to vision for identification, and green (light grey) shading shows that no fixation is needed to complete the action.
2.#Spell#destination#NEAPEL
Rotary#Control
2.1#Select#letter#N
2.2#Select#letter#E
2.3#Select#letter#A
2.4#Select#letter#P
1.#Locate#letter#
2.#Rotate#control#towards#letter
2.5#Select#letter#E
2.6#Select#letter#L
2.7#Select#GUIDE#button
3.#Rotate#control#towards#letter
4.##Adjust#to#letter
6.#Locate#letter#
7.#Rotate#control#towards#letter
8.#Rotate#control#towards#letter
9.#Adjust#to#letter
11.#Locate#letter#
12.#Rotate#control#towards#letter
13.Rotate#control#towards#letter
14.#Adjust#to#letter#
16.#Locate#letter#
17.#Rotate#control#towards#letter
18.#Rotate#control#towards#letter
19.#Adjust#to#letter
21.#Locate#letter#
22.#Rotate#control#towards#letter
23.#Rotate#control#towards#letter
24.#Adjust#to#letter
26.#Locate#letter#
27.#Rotate#control#towards#letter
28.#Rotate#control#towards#letter
29.#Adjust#to#letter
31.#Locate#icon#
32.#Rotate#control#towards#icon
33.#Rotate#control#towards#icon
35.#Press#control#
5.#Press#control#
10.#Press#control
15.#Press#control#
20.#Press#control#
25.#Press#control#
30.#Press#control#
34.#Adjust#to#icon
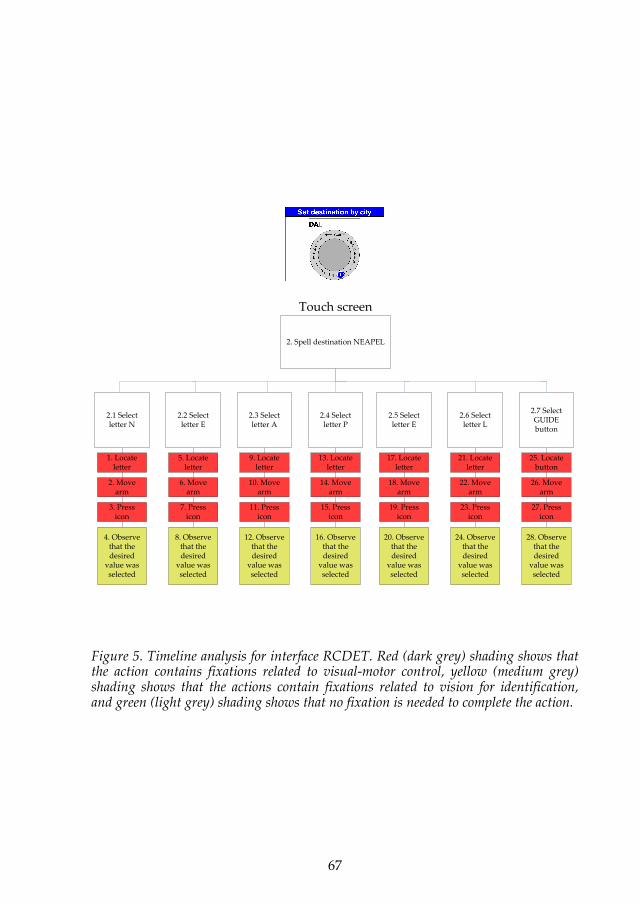
67
Figure 5. Timeline analysis for interface RCDET. Red (dark grey) shading shows that the action contains fixations related to visual-motor control, yellow (medium grey) shading shows that the actions contain fixations related to vision for identification, and green (light grey) shading shows that no fixation is needed to complete the action.
2.#Spell#destination#NEAPEL
Touch#screen
2.1#Select#letter#N
2.2#Select#letter#E
2.3#Select#letter#A
2.4#Select#letter#P
1.#Locate#letter#
2.#Move#arm
3.#Press#icon
4.#Observe#that#the#desired#
value#was#selected
2.5#Select#letter#E
2.6#Select#letter#L
2.7#Select#GUIDE#button
5.#Locate#letter#
6.#Move#arm
7.#Press#icon
8.#Observe#that#the#desired#
value#was#selected
9.#Locate#letter#
10.#Move#arm
11.#Press#icon
12.#Observe#that#the#desired#
value#was#selected
13.#Locate#letter#
14.#Move#arm
15.#Press#icon
16.#Observe#that#the#desired#
value#was#selected
17.#Locate#letter#
18.#Move#arm
19.#Press#icon
20.#Observe#that#the#desired#
value#was#selected
21.#Locate#letter#
22.#Move#arm
23.#Press#icon
24.#Observe#that#the#desired#
value#was#selected
25.#Locate#button#
26.#Move#arm
27.#Press#icon
28.#Observe#that#the#desired#
value#was#selected


Paper I Rydström, A., Broström, R., & Bengtsson, P. (2012). A comparison of two contemporary types of in-car multifunctional interfaces. Applied ergonomics, 43(3), 507-514.


A comparison of two contemporary types of in-car multifunctional interfaces
Annie Rydström a,b,*, Robert Broström a,b, Peter Bengtsson a
aDepartment of Human Work Sciences, Luleå University of Technology, SE-971 87 Luleå, SwedenbDepartment of Vehicle HMI, Volvo Car Corporation, SE-405 31 Gothenburg, Sweden
a r t i c l e i n f o
Article history:Received 14 May 2010Accepted 5 August 2011
Keywords:Secondary taskMultifunctional interfaceTouch screenRotary control
a b s t r a c t
A driving simulator study was conducted to investigate the effects of carrying out a variety of tasks usingtwo different types of contemporary in-car multifunctional interfaces: a touch screen interface and aninterface manoeuvred by a rotary control. Participants drove on a curved rural road while performingtasks such as list scrolling, radio tuning, alphanumeric input and continuous adjustments. The resultsindicate that, in terms of task completion time and the number of glances made to the display, theoptimal interface is dependent on the task being performed. The touch screen interface was better foralphanumeric input tasks and the interface manoeuvred by a rotary control was better for continuousadjustments and list scrolling. Alphanumeric input seems to be more demanding than other tasks,independent of the interface used. It was apparent in this simulator study that both interfaces affectedthe lateral control performance, but lateral control performance deteriorated to a greater extent whenthe touch screen interface was used, probably partially as a result of the lower display position.
� 2011 Elsevier Ltd and The Ergonomics Society. All rights reserved.
1. Introduction
There has been an extensive evolution in computer andcommunication technologies in the past decade and, accordingly,the number of functions being implemented in cars has beensteadily increasing. Hence, in addition to the traditional radio,functions such as MP3 player, navigation system and telephone areaccessible in modern cars. To be able to integrate more function-ality in the car without increasing the clutter of displays, controlsand buttons, there is a trend among car manufacturers to mergefunctions into multifunctional interfaces (e.g. see Jaguar, Lexus,Audi and BMW). These interfaces are generally based on onedisplay and one or a few interaction devices, thus saving space onthe centre panel. However, one drawback of such interfaces is thatfunctions, which are directly accessible via dedicated controls ina conventional interface, may be available several layers down ina menu structure.
While a great deal of the information in multifunctional inter-faces is structured inmenus, there are also several other actions theinterfaces need to support. Burnett (2008) described differentactions a navigation system must be able to assist, such as movethrough the system (within and between menus), enter
alphanumeric data and select from continuous and discreteoptions. The same actions hold for multifunctional interfaces.
The way a user interacts with a multifunctional interfacedepends on the interaction device on which it is based. Touchscreen and rotary control are commonly utilized interaction devicesfor multifunctional in-car interfaces today. A touch screen can becategorised as a direct device since it allows straightforwardinteraction with the screen, while a rotary control can be cat-egorised as an indirect device since it requires translation betweenthe hand and the screen (Rogers et al., 2005). The two devices haveadvantages and disadvantages. Rogers et al. (2005) point out thatdirect devices are generally best for discrete, pointing and ballistictasks whereas indirect devices are better for precision tasks orrepetitive tasks. A number of car manufacturers, such as Jaguar andLexus, have chosen the touch screen as an interaction device fortheir multifunctional interfaces. One documented advantage ofutilizing touch screens in cars is that they are often easy tounderstand and use (Broström et al., 2007; Rydström et al., 2005).However, it is mentioned in the literature that touch screens mayrequire considerable visual attention because of the lack of tactilefeedback (Burnett and Porter, 2001; Dingus et al., 1998; Zwahlenet al., 1988). In addition, since the interaction is made directlywith the display, it generally needs to be mounted in a low positionon the centre panel for the driver to be able to reach it easily. Thedriver must thus move the gaze a long distance from the normaldriving forward field of view to look at the display. Several carmanufacturers, such as BMW and Audi, have instead chosen rotarycontrol as an interaction device for their multifunctional interfaces.
* Corresponding author. Present address: Department of Vehicle HMI, Volvo CarCorporation, SE-405 31 Gothenburg, Sweden. Tel.: þ46 31 59 46 27.
E-mail address: [email protected] (A. Rydström).
Contents lists available at SciVerse ScienceDirect
Applied Ergonomics
journal homepage: www.elsevier .com/locate/apergo
0003-6870/$ e see front matter � 2011 Elsevier Ltd and The Ergonomics Society. All rights reserved.doi:10.1016/j.apergo.2011.08.004
Applied Ergonomics 43 (2012) 507e514
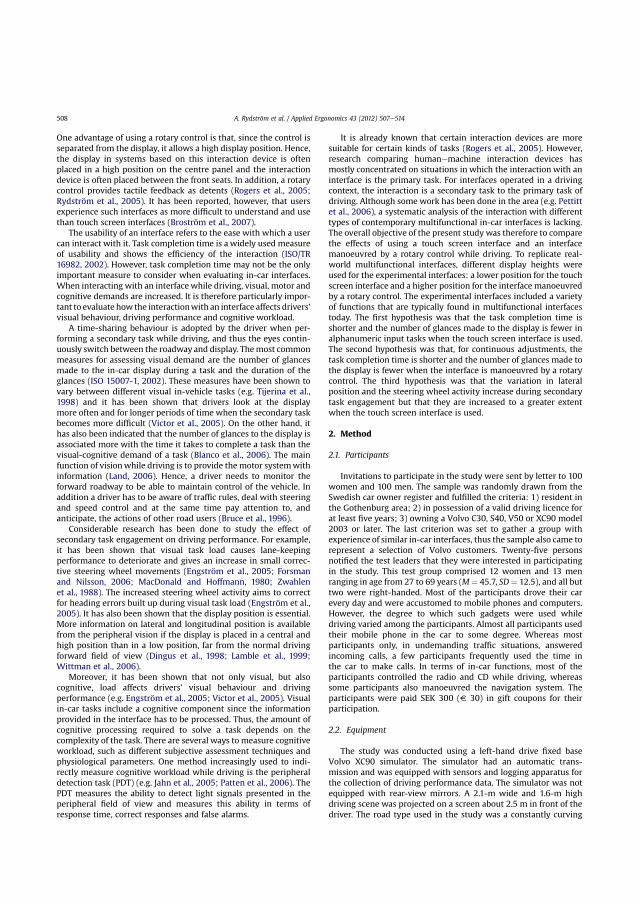
One advantage of using a rotary control is that, since the control isseparated from the display, it allows a high display position. Hence,the display in systems based on this interaction device is oftenplaced in a high position on the centre panel and the interactiondevice is often placed between the front seats. In addition, a rotarycontrol provides tactile feedback as detents (Rogers et al., 2005;Rydström et al., 2005). It has been reported, however, that usersexperience such interfaces as more difficult to understand and usethan touch screen interfaces (Broström et al., 2007).
The usability of an interface refers to the ease with which a usercan interact with it. Task completion time is a widely used measureof usability and shows the efficiency of the interaction (ISO/TR16982, 2002). However, task completion time may not be the onlyimportant measure to consider when evaluating in-car interfaces.When interacting with an interface while driving, visual, motor andcognitive demands are increased. It is therefore particularly impor-tant to evaluate how the interactionwith an interface affects drivers’visual behaviour, driving performance and cognitive workload.
A time-sharing behaviour is adopted by the driver when per-forming a secondary task while driving, and thus the eyes contin-uously switch between the roadway and display. Themost commonmeasures for assessing visual demand are the number of glancesmade to the in-car display during a task and the duration of theglances (ISO 15007-1, 2002). These measures have been shown tovary between different visual in-vehicle tasks (e.g. Tijerina et al.,1998) and it has been shown that drivers look at the displaymore often and for longer periods of time when the secondary taskbecomes more difficult (Victor et al., 2005). On the other hand, ithas also been indicated that the number of glances to the display isassociated more with the time it takes to complete a task than thevisual-cognitive demand of a task (Blanco et al., 2006). The mainfunction of visionwhile driving is to provide themotor systemwithinformation (Land, 2006). Hence, a driver needs to monitor theforward roadway to be able to maintain control of the vehicle. Inaddition a driver has to be aware of traffic rules, deal with steeringand speed control and at the same time pay attention to, andanticipate, the actions of other road users (Bruce et al., 1996).
Considerable research has been done to study the effect ofsecondary task engagement on driving performance. For example,it has been shown that visual task load causes lane-keepingperformance to deteriorate and gives an increase in small correc-tive steering wheel movements (Engström et al., 2005; Forsmanand Nilsson, 2006; MacDonald and Hoffmann, 1980; Zwahlenet al., 1988). The increased steering wheel activity aims to correctfor heading errors built up during visual task load (Engström et al.,2005). It has also been shown that the display position is essential.More information on lateral and longitudinal position is availablefrom the peripheral vision if the display is placed in a central andhigh position than in a low position, far from the normal drivingforward field of view (Dingus et al., 1998; Lamble et al., 1999;Wittman et al., 2006).
Moreover, it has been shown that not only visual, but alsocognitive, load affects drivers’ visual behaviour and drivingperformance (e.g. Engström et al., 2005; Victor et al., 2005). Visualin-car tasks include a cognitive component since the informationprovided in the interface has to be processed. Thus, the amount ofcognitive processing required to solve a task depends on thecomplexity of the task. There are several ways to measure cognitiveworkload, such as different subjective assessment techniques andphysiological parameters. One method increasingly used to indi-rectly measure cognitive workload while driving is the peripheraldetection task (PDT) (e.g. Jahn et al., 2005; Patten et al., 2006). ThePDT measures the ability to detect light signals presented in theperipheral field of view and measures this ability in terms ofresponse time, correct responses and false alarms.
It is already known that certain interaction devices are moresuitable for certain kinds of tasks (Rogers et al., 2005). However,research comparing humanemachine interaction devices hasmostly concentrated on situations in which the interaction with aninterface is the primary task. For interfaces operated in a drivingcontext, the interaction is a secondary task to the primary task ofdriving. Although some work has been done in the area (e.g. Pettittet al., 2006), a systematic analysis of the interaction with differenttypes of contemporary multifunctional in-car interfaces is lacking.The overall objective of the present study was therefore to comparethe effects of using a touch screen interface and an interfacemanoeuvred by a rotary control while driving. To replicate real-world multifunctional interfaces, different display heights wereused for the experimental interfaces: a lower position for the touchscreen interface and a higher position for the interface manoeuvredby a rotary control. The experimental interfaces included a varietyof functions that are typically found in multifunctional interfacestoday. The first hypothesis was that the task completion time isshorter and the number of glances made to the display is fewer inalphanumeric input tasks when the touch screen interface is used.The second hypothesis was that, for continuous adjustments, thetask completion time is shorter and the number of glances made tothe display is fewer when the interface is manoeuvred by a rotarycontrol. The third hypothesis was that the variation in lateralposition and the steering wheel activity increase during secondarytask engagement but that they are increased to a greater extentwhen the touch screen interface is used.
2. Method
2.1. Participants
Invitations to participate in the study were sent by letter to 100women and 100 men. The sample was randomly drawn from theSwedish car owner register and fulfilled the criteria: 1) resident inthe Gothenburg area; 2) in possession of a valid driving licence forat least five years; 3) owning a Volvo C30, S40, V50 or XC90 model2003 or later. The last criterion was set to gather a group withexperience of similar in-car interfaces, thus the sample also came torepresent a selection of Volvo customers. Twenty-five personsnotified the test leaders that they were interested in participatingin the study. This test group comprised 12 women and 13 menranging in age from 27 to 69 years (M¼ 45.7, SD¼ 12.5), and all buttwo were right-handed. Most of the participants drove their carevery day and were accustomed to mobile phones and computers.However, the degree to which such gadgets were used whiledriving varied among the participants. Almost all participants usedtheir mobile phone in the car to some degree. Whereas mostparticipants only, in undemanding traffic situations, answeredincoming calls, a few participants frequently used the time inthe car to make calls. In terms of in-car functions, most of theparticipants controlled the radio and CD while driving, whereassome participants also manoeuvred the navigation system. Theparticipants were paid SEK 300 (V 30) in gift coupons for theirparticipation.
2.2. Equipment
The study was conducted using a left-hand drive fixed baseVolvo XC90 simulator. The simulator had an automatic trans-mission and was equipped with sensors and logging apparatus forthe collection of driving performance data. The simulator was notequipped with rear-view mirrors. A 2.1-m wide and 1.6-m highdriving scene was projected on a screen about 2.5 m in front of thedriver. The road type used in the study was a constantly curving
A. Rydström et al. / Applied Ergonomics 43 (2012) 507e514508
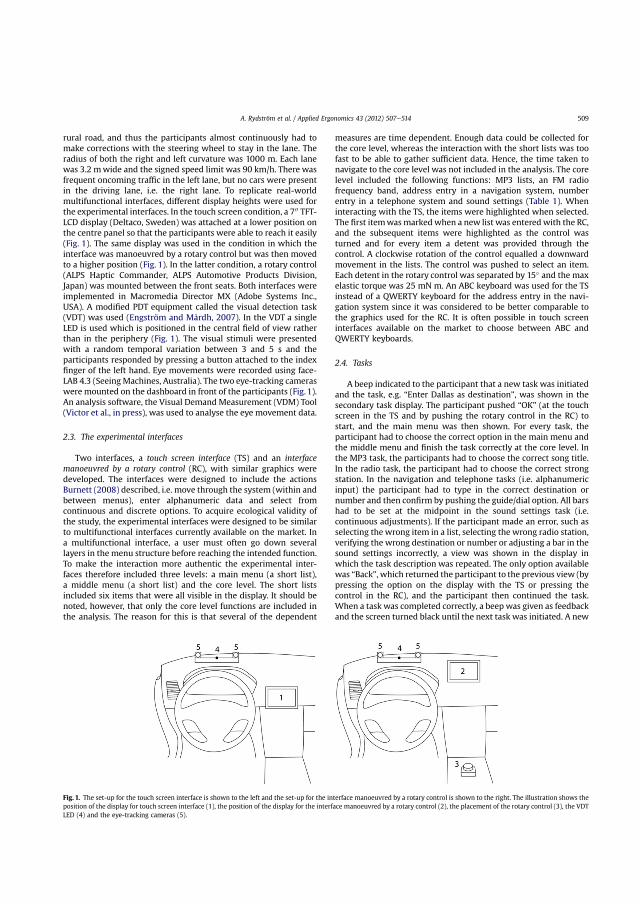
rural road, and thus the participants almost continuously had tomake corrections with the steering wheel to stay in the lane. Theradius of both the right and left curvature was 1000 m. Each lanewas 3.2 mwide and the signed speed limit was 90 km/h. There wasfrequent oncoming traffic in the left lane, but no cars were presentin the driving lane, i.e. the right lane. To replicate real-worldmultifunctional interfaces, different display heights were used forthe experimental interfaces. In the touch screen condition, a 700 TFT-LCD display (Deltaco, Sweden) was attached at a lower position onthe centre panel so that the participants were able to reach it easily(Fig. 1). The same display was used in the condition in which theinterface was manoeuvred by a rotary control but was then movedto a higher position (Fig. 1). In the latter condition, a rotary control(ALPS Haptic Commander, ALPS Automotive Products Division,Japan) was mounted between the front seats. Both interfaces wereimplemented in Macromedia Director MX (Adobe Systems Inc.,USA). A modified PDT equipment called the visual detection task(VDT) was used (Engström and Mårdh, 2007). In the VDT a singleLED is used which is positioned in the central field of view ratherthan in the periphery (Fig. 1). The visual stimuli were presentedwith a random temporal variation between 3 and 5 s and theparticipants responded by pressing a button attached to the indexfinger of the left hand. Eye movements were recorded using face-LAB 4.3 (SeeingMachines, Australia). The two eye-tracking cameraswere mounted on the dashboard in front of the participants (Fig. 1).An analysis software, the Visual Demand Measurement (VDM) Tool(Victor et al., in press), was used to analyse the eye movement data.
2.3. The experimental interfaces
Two interfaces, a touch screen interface (TS) and an interfacemanoeuvred by a rotary control (RC), with similar graphics weredeveloped. The interfaces were designed to include the actionsBurnett (2008) described, i.e. move through the system (within andbetween menus), enter alphanumeric data and select fromcontinuous and discrete options. To acquire ecological validity ofthe study, the experimental interfaces were designed to be similarto multifunctional interfaces currently available on the market. Ina multifunctional interface, a user must often go down severallayers in the menu structure before reaching the intended function.To make the interaction more authentic the experimental inter-faces therefore included three levels: a main menu (a short list),a middle menu (a short list) and the core level. The short listsincluded six items that were all visible in the display. It should benoted, however, that only the core level functions are included inthe analysis. The reason for this is that several of the dependent
measures are time dependent. Enough data could be collected forthe core level, whereas the interaction with the short lists was toofast to be able to gather sufficient data. Hence, the time taken tonavigate to the core level was not included in the analysis. The corelevel included the following functions: MP3 lists, an FM radiofrequency band, address entry in a navigation system, numberentry in a telephone system and sound settings (Table 1). Wheninteracting with the TS, the items were highlighted when selected.The first itemwasmarked when a new list was entered with the RC,and the subsequent items were highlighted as the control wasturned and for every item a detent was provided through thecontrol. A clockwise rotation of the control equalled a downwardmovement in the lists. The control was pushed to select an item.Each detent in the rotary control was separated by 15� and the maxelastic torque was 25 mN m. An ABC keyboard was used for the TSinstead of a QWERTY keyboard for the address entry in the navi-gation system since it was considered to be better comparable tothe graphics used for the RC. It is often possible in touch screeninterfaces available on the market to choose between ABC andQWERTY keyboards.
2.4. Tasks
A beep indicated to the participant that a new task was initiatedand the task, e.g. “Enter Dallas as destination”, was shown in thesecondary task display. The participant pushed “OK” (at the touchscreen in the TS and by pushing the rotary control in the RC) tostart, and the main menu was then shown. For every task, theparticipant had to choose the correct option in the main menu andthe middle menu and finish the task correctly at the core level. Inthe MP3 task, the participants had to choose the correct song title.In the radio task, the participant had to choose the correct strongstation. In the navigation and telephone tasks (i.e. alphanumericinput) the participant had to type in the correct destination ornumber and then confirm by pushing the guide/dial option. All barshad to be set at the midpoint in the sound settings task (i.e.continuous adjustments). If the participant made an error, such asselecting the wrong item in a list, selecting the wrong radio station,verifying the wrong destination or number or adjusting a bar in thesound settings incorrectly, a view was shown in the display inwhich the task description was repeated. The only option availablewas “Back”, which returned the participant to the previous view (bypressing the option on the display with the TS or pressing thecontrol in the RC), and the participant then continued the task.When a task was completed correctly, a beep was given as feedbackand the screen turned black until the next task was initiated. A new
Fig. 1. The set-up for the touch screen interface is shown to the left and the set-up for the interface manoeuvred by a rotary control is shown to the right. The illustration shows theposition of the display for touch screen interface (1), the position of the display for the interface manoeuvred by a rotary control (2), the placement of the rotary control (3), the VDTLED (4) and the eye-tracking cameras (5).
A. Rydström et al. / Applied Ergonomics 43 (2012) 507e514 509

task was initiated 15 s after the previous one was completed. Toreduce practice effects, the tasks, i.e. MP3 tracks, radio frequencies,navigation destinations, telephone numbers and sound settingsadjustments, did not repeat throughout the experiment. However,all tasks were similar, e.g. all destinations were well known andincluded six characters, the telephone numbers included sixnumbers and were easily chunked (e.g. 17 18 19) and all targettracks in the MP3 lists were about equally as far down in the lists.MP3 lists with well-known artists were used, but the song titles(target tracks) may not have been familiar to all participants. Fivevariants of each task were included in the experiment.
2.5. Procedure
The experiment had a within-subject design and the order inwhich the interfaces were presented to the participants wasrandomized. Upon arriving to the laboratory, each participant wasgiven a brief description of the experimental procedure, given theopportunity to ask questions about the study and asked to fill in
a consent form. When the eye-tracking cameras had been cali-brated the participant was informed about the VDT. The participantwas instructed to try to respond to the visual stimuli throughoutthe experiment. With sufficient training on this task it was expec-ted that any additional load imposed by it would become insig-nificant. The participant then practiced driving for a fewminutes toacclimate to the simulator. The participant was also instructed tomake the task of driving the primary task and to notify the testleader if s/he felt any simulator sickness. However, none of theparticipants felt sick during the experiment.
The experiment consisted of two major parts: a training sessionand an experimental session. In the training session, each partici-pant trained at interacting with the interfaces. For each interface,the participant went through five stationary practice trials and thenwent through the same trials during driving. They were givena break after the training session during which they were asked tofill in a background questionnaire (including age, driving habits,experience with technology etc.). The experimental session wassimilar to the training session. The interfaces were presented in the
Table 1An explanation of the functions at the core level.
Function Touch screen interface (TS) Interface manoeuvred by a rotary control (RC)
Graphics Description Graphics Description
MP3 list
48 song titles are listed inalphabetical order. The listmoves one item when a buttonwith a single arrow is pushedand moves six items when abutton with a doublearrow is pushed.
48 song titles are listedin alphabetical order. Thelist moves when the markerreaches the second last orthe second top object.
FM radiofrequencyband
Strong stations aremarked. A push on theright or left arrow buttoncauses the frequency bandto move one step. An arrowbutton has to be held to scrollin the frequency band.
Strong stations are marked.A step with the rotarycontrol causes the frequencyband to move one step.
Navigationsystem e
address input
An ABC keyboard isused. There is a delete(arrow) and guide option.
The alphabet is arrangedin a circle to make use ofthe circular movement ofthe control. There is a delete(arrow) and guide option.
Telephonesystem e
number input
A standard telephonekeypad is used. Thereis a delete (arrow) anddial option.
The numbers are arrangedin a circle to make use of thecircular movement of thecontrol. There is a delete(arrow) and dial option.
Soundsettingsadjustments
Plus and minus buttonsare used to set the levelat a bar. The active bar ismarked with a frame.To activate a bar ithas to be pushed.
The control is rotatedto adjust the levelat a bar. The active baris marked with aframe. The control ispushed to activate thenext bar.
A. Rydström et al. / Applied Ergonomics 43 (2012) 507e514510

same randomized order as in training, but the tasks and the order ofthe tasks differed. During the experimental session, a 30-s longbaseline, i.e. driving without performing secondary tasks, wascollected for each interface. All tasks (and baseline) wererandomized over the interfaces so that participants did not solvethe same task with the same interface in the same order. Theparticipants were instructed to try to stay in the centre of the laneand maintain the signed speed limit (90 km/h). The participantswere also instructed to solve the secondary tasks and respond tothe visual stimuli to the best of their ability. The participants wereasked at the end of the experimental session if any interface wassuperior for any of the tasks and which interface they would prefer.A full session took a total of about 2 h.
2.6. Dependent variables
The interaction performance with the experimental interfaceswas measured in terms of task completion time and number oferrors made (ISO/TR 16982, 2002). Eye movements were analysedin accordance with the ISO-metrics number of glances and glanceduration (ISO 15007-1, 2002). The lateral control performance wasmeasured in terms of the variation in lateral position, i.e. standarddeviation of lane position (SDLP), and steering wheel activity, i.e.steering wheel reversal rate (SRR). The SRR metric is defined as thenumber of steering wheel reversals larger than a specific angularvalue perminute. An angular value of 0.1� and a cut-off frequency of2 Hz were used in this study. The detection performance of thevisual stimuli (VDT) was measured in terms of response time.Standard deviation of lane position, steering wheel reversal rateand VDT response time were also collected for baseline driving.
3. Results
To compare the touch screen interface (TS) and the interfacemanoeuvred by a rotary control (RC), within-group t-tests (two-tailed) were made separately for each task for all the dependentvariables. Subsequent statistical analyses were conducted for thevariables standard deviation of lane position, steering wheelreversal rate and VDT response time to examinewhether the valuesfor the tasks differed from the baseline values. Thus, for thesevariables, one-way repeated measures ANOVAs were also madeand followed up by simple contrasts. Where Mauchly’s test ofsphericity indicated that the assumption of sphericity had beenviolated; the degrees of freedom where corrected using theGreenhouse-Geisser estimates of sphericity (Keppel and Wickens,2004). An alpha level of 0.05 was used for all statistical tests. Allresults are graphically summarized in Fig. 2. A floor effect wasfound for the variable number of errors and it is therefore notincluded in Fig. 2. For the statistical analysis SPSS was used.
3.1. Task completion time
In terms of task completion time it was shown that the partic-ipants completed the MP3 and settings task faster when using theRC, t(24) ¼ 2.65, p < 0.05 and t(24) ¼ 6.28, p < 0.001, and that thenavigation and telephone tasks were completed faster when usingthe TS, t(24) ¼ �8.25, p < 0.001 and t(24) ¼ �3.61, p < 0.01. Taskcompletion time did not differ significantly between the interfacesfor the radio task.
3.2. Eye movements
Errors in the eye-tracking data collection caused corrupted datafor almost half of the participants and the data from these partic-ipants were thus excluded from the analysis. For some of the
participants the data was corrupted when the display was in thelower position. Hence, eye movements were analysed for 13participants for whom satisfactory quality of the tracking wasavailable.
The results showed that the number of glances to the displaywas fewer when the participants completed the navigation andtelephone tasks with the TS, t(12) ¼ �6.85, p < 0.001 andt(12) ¼ �4.27, p < 0.01, and that the number of glances was fewerwhen participants completed the settings task with the RC,t(12) ¼ 2.41, p < 0.05. The number of glances did not differ signif-icantly between the interfaces for the MP3 and radio tasks.
Glance duration did not differ between the interfaces for any ofthe tasks.
3.3. Lateral control performance
In terms of standard deviation of lane position it was shown thatthe participants deviated more when they carried out the MP3 andradio tasks when using the TS, t(24) ¼ 2.26, p < 0.05 andt(24) ¼ 3.18, p < 0.01. Lateral control performance did not differsignificantly between the interfaces for the other tasks. Thesubsequent ANOVAs including baseline showed no statisticaldifference for the TS, F(2.98, 71.39) ¼ 2.64, p ¼ 0.58. A significantdifference was present for the RC, F(3.02, 72.58) ¼ 3.01, p < 0.05.However, for the TS, the simple contrasts showed that the standarddeviation of lane position was significantly different from baselinefor all tasks (MP3, phone and settings p < 0.05 and radio andnavigation p < 0.01). For the RC, the simple contrasts showed thatthe standard deviation of lane position was significantly differentfrom baseline for the navigation and settings tasks (both p < 0.05).
In terms of steering wheel reversal rate it was shown that thenumber of times the steering wheel was reversed was significantlyhigher for the MP3, navigation and telephone tasks when using theTS, t(24) ¼ 2.07, p < 0.05, t(24) ¼ 3.09, p < 0.01 and t(24) ¼ 2.77,p < 0.05. Steering wheel reversal rate did not differ significantlybetween the interfaces for the other tasks. The subsequent ANOVAsincluding baseline showed that a significant difference was presentfor both the TS and the RC, F(3.69, 8.63) ¼ 15.81, p < 0.001, F(5,120) ¼ 5.61, p < 0.001. For the TS as well as the RC, the simplecontrasts showed that the steering wheel reversal rate was signif-icantly different from baseline for all tasks (TS: all p < 0.001, RC:MP3 and telephone p < 0.001 and radio, navigation and settingsp < 0.01).
3.4. VDT response time
The results showed that VDT response time was significantlyshorter when the RC was used for the MP3 task, t(24) ¼ 2.94,p< 0.01. VDT response time did not differ significantly between theinterfaces for the other tasks. The subsequent ANOVAs includingbaseline showed that a significant difference was present for boththe TS and the RC, F(5, 120) ¼ 4.81, p < 0.001 and F(3.18,76.31) ¼ 925, p < 0.001. For the TS, the simple contrasts showedthat the VDT response time was different from baseline for all tasksbut the radio task (MP3 p < 0.05 and for navigation, telephone andsettings p < 0.01). For the RC, the simple contrasts showed that theVDT response time was significantly different from baseline for alltasks (MP3, radio and settings p < 0.05 and navigation and tele-phone p < 0.01).
3.5. Interview
Most of the participants preferred the RC prior to the TS. Themain reason for this seemed to be that it was easier to have somecontrol of the surrounding traffic during the interaction since the
A. Rydström et al. / Applied Ergonomics 43 (2012) 507e514 511

display was in a high position at the centre panel. In addition, theRC was also experienced to be less manually demanding since thehand was held in a comfortable and relatively fixed position duringthe interaction. Several participants mentioned that it was tiring tointeract with the touch screen during long interaction sequencessince the arm needed to be stretched out and moved around.However, several participants also mentioned that in normalcircumstances they would not use an in-car interface with suchintensity as in the experiment. In fact, a number of participants saidthat they would normally not perform tasks they find too difficultwhile driving at all. Most participants asserted that alphanumerictasks were more efficient using the TS. Many of them therefore
favoured the touch screen for this type of tasks. List scrolling, soundsettings and radio tuning tasks were considered to be easier tocomplete with the RC.
4. Discussion
The results of this study indicate that alphanumeric input tasks,i.e. navigation address input and telephone number input, arecompleted more rapidly and with fewer glances when a touchscreen interface is used, thus confirming the first hypothesis. Theresults also indicate that continuous adjustments, i.e. soundsettings, are completed more rapidly and with fewer glances when
Fig. 2. The graphs summarise the results for all dependent variables. Significant differences from the t-tests (two-tailed) are indicated as are significant differences from the simplecontrasts, where each task value was compared to the baseline value. The error bars representing 95 percent confidence intervals have been adjusted in the graphs to suit within-subject comparisons (Loftus and Masson, 1994).
A. Rydström et al. / Applied Ergonomics 43 (2012) 507e514512
an interface manoeuvred by a rotary control is used, thus con-firming the second hypothesis. In addition, scrolling through MP3lists was faster with the interface manoeuvred by a rotary control,but the number of glances was not significantly lower. The inter-view results agree with these findings. Most participants experi-enced that alphanumeric tasks were more efficient using the touchscreen interface and sound settings and list scrolling wereconsidered to be easier to complete with the interface manoeuvredby a rotary control. There were no significant differences betweenthe interfaces for the radio task, but most of the participantspreferred the interface manoeuvred by a rotary control for this task.These data support the view that there is not one optimal inter-action device that is always the best choice; it depends on the taskbeing performed (Rogers et al., 2005). Blanco et al. (2006) pointedout that the number of glances made to an in-car display is asso-ciatedwith the time it takes to complete a task. This seems to be thecase in this study, as it can be seen in Fig. 2 that task completiontime and number of glances correspond quite well. Hence, theresults indicate that efficient interaction is important.
As hypothesised, it was found that the standard deviation oflane position and steering wheel activity was increased to somedegree during secondary task engagement. This supports researchshowing that secondary task load causes lane-keeping perfor-mance to deteriorate and gives an increase in small correctivesteering wheel movements (Engström et al., 2005; Forsman andNilsson, 2006). As hypothesised, the results also indicate that thevariation in lateral position and the steering wheel activity increaseto a greater extent when a touch screen interface is used thanwhenan interface manoeuvred by a rotary control is used. In accordancewith Dingus et al. (1998), Lamble et al. (1999) and Wittman et al.(2006), the most likely interpretation of this effect would be that,since the display was mounted in a lower position for the touchscreen interface, the drivers’ peripheral vision could not be effec-tively used to support driving when looking at the display. Hence, itis evident that a high display position in important. The interviewresults also indicate that the display position is essential. Most ofthe participants preferred the interface manoeuvred by a rotarycontrol since they experienced that it was easier to have somecontrol of the surrounding traffic during the interaction when thedisplay was in a high position at the centre panel. However, it is notpossible on the basis of the results of this study to ascertainwhether the decrease in lateral control performance when inter-acting with the touch screen interface depends only on the lowerdisplay position of this interface or also has to do with the inter-action technique. Several participants mentioned that it was tiringto interact with the touch screen during long interaction sequencessince the arm needed to be stretched out and moved around.Hence, there might have been some increased manual interferencewith the driving task. A follow-up study is needed to investigate theeffect of display position versus interaction technique.
The results in glance duration indicate that the mean glanceduration at the secondary task displaywas longer for the navigationand telephone tasks as compared to the other tasks for bothinterfaces. This indicates that these tasks were more demanding,given that glance duration tends to increase as a function of taskdifficulty (Victor et al., 2005). A concern with the VDT may be that,although the single LED should have been visible even whenlooking at the secondary task display, there may be some unwantedeffects related to visual eccentricity and affected scanning patterns.However, the results in glance duration partly correspond to theresults in the VDT response time, which shows longer responsetimes for the navigation and telephone tasks. These results pointstowards increased cognitive workload for the navigation and tele-phone tasks for both interfaces. The task of inputting data manuallyis of concern (Tijerina et al., 1998; Tsimhoni et al., 2004), and on
several markets this functionality is blocked while the vehicle is inmotion, but there are ways to facilitate this. Possible improvementswould be to utilize a spelling function, like those found in today’snavigation systems, where characters “grey out” depending on thepossible entries, and to use a hit list of probable destinations ornumbers. In addition, it was shown that VDT response time wasshorter in the MP3 task when the interface manoeuvred by a rotarycontrol was used. Perhaps it is less demanding to navigate in thealphabetically arranged lists when scrolling smoothly down the listtitle-by-title, instead of jumping page-by-page as in the touchscreen interface.
The experimental interfaces were designed with the intentionto make them comparable and at the same time imitate real-worldinterfaces. Although somewhat simplified, the interfaces ought tobe representative of systems available on the market. There areseveral ways to evaluate in-car interfaces, the method to usedepends on the maturity of the interface and the intention of theevaluation (Broström et al., 2011; Harvey et al., 2011). This studyused an experimental method since an important criterion for in-car interface usability relates to the interference on the primarydriving task caused by secondary task engagement (Harvey et al.,2011). The driving task was made as realistic as possible in theexperiment, within the limitations of a fixed base driving simulator.There is always a trade-off between experimental control andecological validity in experiments. In real driving the drivingdemand varies over time and a driver can choose if and when toperform a task. The interviews revealed that in normal circum-stances the participants would not use an in-car interface with suchintensity as in the experiment and that they would not performtasks that they find too demanding. However, by controlling thedriving environment and tasks it was possible to keep the demandof the driving task constant and it was possible to systematicallycompare the impact on the driving task when interacting with thedifferent interfaces. Car manufacturers may also be interested ininvestigating whether an interface reach usability and safetyguidelines and standards. There are several different guidelines andstandards available, for example for maximum visual time off roadand acceptable time on task in a static vehicle. See Green (2009) foran overview on relevant guidelines and standards.
Harvey et al. (2011) stated that poor lateral control could indi-cate low levels of effectiveness, efficiency, user compatibility,learnability andmemorability of an in-car interface. Hence, tomakean interface usable there has to be a focus on interaction design.Perhaps the interaction with multifunctional in-car interfaces canbe improved if different interaction devices are combined or if newtechnologies are utilized. For example, current mobile devicesbased on touch screen technology (such as iPhone) have revealednew ways to interact with the screen. Accordingly, it is possible toutilize new techniques to ease the interaction with in-car touchscreen interfaces. It has been brought up in the literature that touchscreens may require considerable visual attention because of thelack of tactile feedback (Burnett and Porter, 2001; Dingus et al.,1998; Zwahlen et al., 1988). Touch screens that provide tactilefeedback are now available and has been shown to be beneficial(Pitts et al., 2009; Serafin et al., 2007). There are also rotary controlsthat provide a variety of haptic cues, such as detents, limit stops,friction and vibration. A haptic rotary control can be programmedto imitate the feel of different conventional controls and canprovide sensations that correspond to features in the graphics. Thistechnology can be used to enhance the interaction with in-carmultifunctional interfaces based on a rotary control as an interac-tion device (Rydström et al., 2009). Other ways to input data, suchas using handwriting touchpads or speech recognition, have alsoshown to be promising, especially for alphanumeric input (Burnettet al., 2005; Tsimhoni et al., 2004).
A. Rydström et al. / Applied Ergonomics 43 (2012) 507e514 513

5. Conclusions
The interfaces compared in this studywere designed to replicatemultifunctional interfaces available on the market. It is apparentfrom this simulator study that, in terms of task completion timeand the number of glances made to the display, there is not oneinput device that is always the best choice, since certain interactiondevices are more suitable for certain kinds of tasks. It was shownthat both interfaces caused deterioration in lateral control perfor-mance. However, in view of the fact that lateral control perfor-mance deteriorated to a greater extent when the touch screeninterface was used, one can argue in favour of the interface man-oeuvred by a rotary control. However, innovative ways to interactwith in-car systems should be the object of further research.
Acknowledgements
This study was supported by the Swedish Program Board forAutomotive Research and the Swedish IVSS (Intelligent VehicleSafety Systems) Research Foundation.
References
Blanco, M., Biever, W.J., Gallagher, J.P., Dingus, T.A., 2006. The impact of secondarytask cognitive processing demand on driving performance. Accident Analysis &Prevention 38, 895e906.
Broström, R., Bengtsson, P., Axelsson, J., 2007. Perceived styling and usability inintegrated centre panel layouts as a function of interaction style and age. In: deWaard, D., Hockey, G.R.J., Nickel, P., Brookhuis, K.A. (Eds.), Human Factors Issuesin Complex System Performance. Shaker Publishing, Maastricht, pp. 193e204.
Broström, R., Bengtsson, P., Axelsson, J., 2011. Correlation between safety assess-ments in the driver-car interaction design process. Applied Ergonomics 42,575e582.
Bruce, V., Green, P.R., Georgesson, M.A., 1996. Visual Perception: Physiology,Psychology, and Ecology, third ed. Psychology Press, Hove.
Burnett, G.E., Porter, J.M., 2001. Ubiquitous computing within cars: designingcontrols for non-visual use. International Journal of Human-Computer Studies55, 521e531.
Burnett, G.E., Lomas, S.M., Mason, B., Porter, J.M., Summerskill, S.J., 2005. Writingand driving: an assessment of handwriting recognition as a means of alpha-numeric data entry in a driving context. Advances in Transportation Studies,Special Issue, 59e72.
Burnett, G.E., 2008. Designing and evaluating in-car user-interfaces. In: Lumsden, J.(Ed.), User Interface Design and Evaluation for Mobile Technology. InformationScience Reference, Hersey, pp. 218e236.
Dingus, T.A., Hulse, M.C., Barfield, W., 1998. Human-system interface issues in thedesign and use of advanced traveller information systems. In: Barfield, W.,Dingus, T.A. (Eds.), Human Factors in Intelligent Transportation Systems. Erl-baum, Mahwah, pp. 359e395.
Engström, J., Mårdh, S., 2007. SafeTE Final Report (Rep. No. 2007:36). SwedishNational Road Administration, Borlänge, Sweden.
Engström, J., Johansson, E., Östlund, J., 2005. Effects of visual and cognitive load in realand simulated motorway driving. Transportation Research Part F 8, 97e120.
Forsman, Å, Nilsson, L., 2006. Effects of cognitive and visual load in real andsimulated driving (Rep. No. 533A). Swedish National Road and TransportResearch Institute, Linköping, Sweden.
Green, 2009. Driver interface safety and usability standards: an overview. In:Regan, M.A., Lee, J.D., Young, K.L. (Eds.), Driver Distraction: Theory, Effects, andMitigation. CRC Press, Boca Raton, pp. 445e464.
Harvey, C., Stanton, N.A., Pickering, C.A., McDonald, M., Zheng, P., 2011. A usabilityevaluation toolkit for In-Vehicle Information Systems (IVISs). Applied Ergo-nomics 42, 563e574.
ISO 15007-1, 2002. Road vehicles e Measurement of Driver Visual Behaviour withRespect to Transport Information and Control Systems e Part 1: Definitions andParameters.
ISO/TR 16982, 2002. Ergonomics of HumaneSystem Interaction e UsabilityMethods Supporting Human-Centred Design.
Jahn, G., Oehme, A., Krems, J.F., Gelau, C., 2005. Peripheral detection as a workloadmeasure in driving: effects of traffic complexity and route guidance system usein a driving study. Transportation Research Part F 8, 255e275.
Keppel, G., Wickens, T.D., 2004. Design and Analysis: A Researchers Handbook,fourth ed. Prentice Hall, Upper Saddle River.
Lamble, D., Laakso, M., Summala, H., 1999. Detection thresholds in car followingsituations and peripheral vision: implications for positioning of visuallydemanding in-car displays. Ergonomics 42, 807e815.
Land, M.F., 2006. Eye movements and the control of actions in everyday life.Progress in Retinal and Eye Research 25, 296e324.
Loftus, G.R., Masson, M.E., 1994. Using confidence intervals in within-subjectdesigns. Psychonomic Bulletin & Review 1, 476e490.
MacDonald, W.A., Hoffmann, E.R., 1980. Review of relationships between steeringwheel reversal rate and driving task demand. Human Factors 22, 733e739.
Patten, C.J.D., Kircher, A., Östlund, J., Nilsson, L., Svenson, O., 2006. Driver experienceand cognitive workload in different traffic environments. Accident Analysis &Prevention 38, 887e894.
Pettitt, M.A., Burnett, G.E., Bayer, S., Stevens, A., 2006. Assessment of the occlusiontechnique as a means for evaluating the distraction potential of driver supportsystems. Intelligent Transport Systems. IEE Proceedings 153, 259e266.
Pitts, M.J., Williams, M.A., Wellings, T., & Attridge, A., 2009. Assessing subjectiveresponse to haptic feedback in automotive touchscreens. Proceedings of theFirst International Conference on Automotive User Interfaces and InteractiveVehicular Applications, Essen.
Rogers, W.A., Fisk, A.D., Collins McLaughlin, A., Pak, R., 2005. Touch a screen or turna knob: choosing the best device for the job. Human Factors 47, 271e288.
Rydström, A., Bengtsson, P., Grane, C., Broström, R., Agardh, J., Nilsson, J., 2005.Multifunctional systems in vehicles: a usability evaluation. In: Thatcher, A.,James, J., Todd, A. (Eds.), Proceedings of the Fourth International CyberspaceConference on Ergonomics. International Ergonomics Association Press,Johannesburg.
Rydström, A., Broström, R., Bengtsson, P., 2009. Can haptics facilitate the interactionwith an in-vehicle multifunctional interface? IEEE Transactions on Haptics 2,141e147.
Serafin, C., Heers, R., Tschirhart, M., Ullrich, C., & Ramstein, C., 2007. User experiencein the U.S. and Germany of in-vehicle touch Screens with integrated haptic andAuditory Feedback. Proceedings of SAE World Congress, Detroit, MI.
Tijerina, L., Parmer, E., Goodman, M.J., 1998. Driver workload assessment of routeguidance system destination entry while driving: a test track study. Proceed-ings of the 5th ITS World Congress, Seoul.
Tsimhoni, O., Smith, D., Green, P., 2004. Address entry while driving: speechrecognition versus a touch-screen keyboard. Human Factors 46, 600e610.
Victor, T.W., Harbluk, J.L., Engström, J., 2005. Sensitivity of eye-movement measuresto in-vehicle task difficulty. Transportation Research Part F 8, 167e190.
Victor, T.W., Blomberg, O., Zelinsky, A., Automating driver visual behaviormeasurement. Vision in Vehicles 9, in press.
Wittman, M., Kiss, M., Gugg, P., Steffen, A., Fink, M., Pöppel, E., Kamiya, H., 2006.Effects of display position of a visual in-vehicle task on simulated driving.Applied Ergonomics 37, 187e199.
Zwahlen, H.T., Adams Jr., C.C., DeBald, D.P., 1988. Safety aspects of CRT touch panelcontrols in automobiles. In: Gale, A.G., Freeman, M.H., Haslegrave, C.M., ASmith, P., Taylor, S.P. (Eds.), Vision in Vehicles II. Elsevier, Amsterdam,pp. 335e344.
A. Rydström et al. / Applied Ergonomics 43 (2012) 507e514514

Paper II Broström, R., Bengtsson, P., & Axelsson, J. (2011). Correlation between safety assessments in the driver-car-interaction design process. Applied Ergonomics, Volume 42 (4), 575-582.


Correlation between safety assessments in the driverecar interactiondesign process
Robert Broström a,b,*, Peter Bengtsson b,1, Jakob Axelsson c,2
aVehicle HMI-Dept 94750, Driver Interaction & Infotainment, Volvo Car Corporation PV32, SE-405 31 Göteborg, Swedenb Engineering Psychology, Luleå University of Technology, SE-971 87 Luleå, Swedenc Swedish Institute of Computer Science (SICS), Box 1263, SE-16429 Kista, Sweden
a r t i c l e i n f o
Article history:Received 30 October 2009Accepted 25 June 2010
Keywords:SafetyUsabilityIVISUEM
a b s t r a c t
With the functional revolution in modern cars, evaluation methods to be used in all phases of driverecarinteraction design have gained importance. It is crucial for car manufacturers to discover and solve safetyissues early in the interaction design process. A current problem is thus to find a correlation between theformative methods that are used during development and the summative methods that are used whenthe product has reached the customer. This paper investigates the correlation between efficiency metricsfrom summative and formative evaluations, where the results of two studies on sound and navigationsystem tasks are compared. The first, an analysis of the J.D. Power and Associates APEAL survey, consistsof answers given by about two thousand customers. The second, an expert evaluation study, was done bysix evaluators who assessed the layouts by task completion time, TLX and Nielsen heuristics. The resultsshow a high degree of correlation between the studies in terms of task efficiency, i.e. between customerratings and task completion time, and customer ratings and TLX. However, no correlation was observedbetween Nielsen heuristics and customer ratings, task completion time or TLX. The results of the studiesintroduce a possibility to develop a usability evaluation framework that includes both formative andsummative approaches, as the results show a high degree of consistency between the different meth-odologies. Hence, combining a quantitative approach with the expert evaluation method, such as taskcompletion time, should be more useful for driverecar interaction design.
! 2010 Elsevier Ltd and The Ergonomics Society. All rights reserved.
1. Introduction
The use of secondary task functions such as information andentertainment devices while driving is under debate owing topossibly increased driver distraction and traffic safety risks. In the100-car Naturalistic Driving Study, Klauer et al. (2006) concludedthat 78 percent of all crashes and 93 percent of rear end crasheswere caused by drivers’ inattention. The study also indicated thatinattention caused by secondary tasks accounted for 23 percent ofall crashes and near crashes in the study.
During the last ten years secondary task functions, such as InVehicle Information Systems (IVIS), have become an increasinglyimportant part of modern cars. Today, hundreds of functions are
incorporated in the context of the centre panel, earlier known as“the radio”. This development has made car interaction design andcar interior design more challenging than ever and, as a conse-quence, usability evaluation methods (UEMs) for use in all phasesof product development have gained importance (Broström et al.,2007; Keinath et al., 2008; Mattes, 2003). Owing to the functionalrevolution in modern cars, UEMs employed within the car domainnow have similar requirements as those employed within thegeneral HCI domain. In the HCI domain, much effort has been spenton securing the reliability and validity of UEMs (Gray and Salzman,1998; Hartson et al., 2003; Hertzum and Jacobsen, 2003; Jeffriesand Desurvire, 1992; Ling and Salvendy, 2009; Nielsen, 1994;Wixon, 2003). However, in the case of UEMs for IVIS, where theassessed systems are operated as secondary tasks and are thuscentral to safety, more effort has been put into identifying safetyrelated problems in expert inspections (AAM, 2002; ESOP, 2006;Stevens et al., 1999) rather than verifying whether the problemsencountered are found in user assessments. Hence, an importantquestion is whether UEMs help experts to discover real usabilityproblems. Hartson et al. define this as a realness attribute of UEMs:
* Corresponding author. Engineering Psychology, Luleå University of Technology,SE-971 87 Luleå, Sweden. Tel.: !46 31 32 50 146.
E-mail addresses: [email protected] (R. Broström), [email protected] (P. Bengtsson),[email protected] (J. Axelsson).
1 Tel.: !46 92 049 24 74.2 Tel.: !46 72 734 29 52.
Contents lists available at ScienceDirect
Applied Ergonomics
journal homepage: www.elsevier .com/locate/apergo
0003-6870/$ e see front matter ! 2010 Elsevier Ltd and The Ergonomics Society. All rights reserved.doi:10.1016/j.apergo.2010.06.019
Applied Ergonomics 42 (2011) 575e582

“A usability problem (e.g. found by a UEM) is real if it isa predictor of a problem that users will encounter in real work-context usage and that will have an impact on usability (userperformance, productivity, or satisfaction, or all three). Thiswould exclude problems with trivially low impact and situa-tions real users would or could not encounter. The emphasis onreal users is important in this definition, because many of theUEMs evaluated in studies are usability inspection methods,where the inspectors encounter problems that do not alwayspredict usability problems for real users.”
In this paper, we compare UEMs that can be used during theinteraction design process and one targeting end users, i.e.customers.
1.1. Usability testing
ISO standard 9241-11, Guidance on Usability (ISO, 1998), definesusability as three distinct aspects: effectiveness, efficiency andsatisfaction. Measures of effectiveness relate the users’ goal ofexploiting a system to the accuracy (e.g. number of errors) andcompleteness (e.g. percentage of goals achieved) with which thesegoals can be achieved. Efficiency is described by the resources (e.g.mental effort and task completion time) spent in achieving thegoals. Satisfaction measures users’ attitudes (e.g. frequency ofcomplaints) towards the use of a product.
It is clear that the more quickly a user can complete a taskwith a system, the more efficient that system is for the task(Jordan, 1998). It is also evident that task completion time for IVISis correlated with crash risk, that it is easier to measure than e.g.eyes-off-the-road time, and that it is computable early in thedevelopment process, thus supporting iterative design (Green,1999). This has been taken into consideration in developingevaluation metrics. The 15-Second Rule specifies the recom-mended maximum time for drivers to complete tasks related tonavigation that involve visual displays and manual controls ina moving vehicle (SAE, 2004). Eye glances and cognitive work-load are used to correlate task complexity with driving perfor-mance (Blanco et al., 2005). For example, Victor et al. (2005)found that, when the secondary visual task became morecomplex, drivers looked less at the road centre area ahead andmore often and for longer periods at the display, hence increasingthe risk of disastrous consequences while driving. However,technical equipment must be installed in the vehicle to measureeye glance behaviour and cognitive workload, which may not besuitable for some evaluations.
The term usability evaluation method (UEM) was defined byGray and Salzman (1998) and refers to any method or techniqueused to improve the usability of an interaction design at any stageof the design process. The work of Gray and Salzman has beenfurther built upon, for example by Hartson et al. (2003), whosuggest a distinction of UEMs into two basic approaches, formativeand summative UEMs. In the first the formative evaluation is doneduring development to improve an interaction design, while, thesecond, the summative, is done after development when the designis complete. Both Gray and Salzman and Hartson et al. identifya lack of validity of UEMs in terms of their ability to predict prob-lems that users actually experience.
The car domain employs two diverse research approachesrelevant to safe interaction with IVIS. The first, a formativeapproach, is often directly related to traffic safety and is dominatedby driving performance and driver behaviour studies (e.g. Horberryet al., 2006). The second, a summative approach, is related tocustomer satisfaction studies, such as small scale customer clinicsor large scale customer surveys. Both approaches are relevant for
estimations of the safety of use. While the first is often carried outby research institutes and universities, the second is led by carmanufacturers.
A current problem for both groups of researchers is to finda correlation between objective studies of performance andbehaviour and subjective results based on customer surveys.Objective studies are often conducted in experimental environ-ments, using immature products but with excellent control, i.e.there is a high level of reliability. Customer surveys on the otherhand are based on customers’ opinions of the final products, i.e.delivering low levels of control but optimal levels of validity.
As the car industry is under tremendous pressure to sell prod-ucts, it is crucial to understand what customers really like. Ifa correlation can not be identified between objective studies andcustomer surveys, there is a risk that fewer resources will be spenton the former.
Three viable solutions can be tested to avoid this scenario. Thefirst is to compare data already collected in experimental studieswith results of customer surveys. Here, a comparison will becomplex since prototypes used in experimental studies often havea simplified design to test specific characteristics (Rogers et al.,2005) and thus do not match a fully functional final product. Asecond alternative is to use a group of potential customers to testIVIS that are present in vehicles in production and to compare thesedata with those of the customer survey. This solution is likely to becriticized by practitioners, since it is both complex and expensive totest a valid sample of the customer population. Moreover, factorssuch as age, education, nationality etc. may confound this kind oftest. As a third alternative, we suggest a modification to the second:Instead of using an invalid sample from the customer population,we use a small number of trained usability experts that, in additionto performing the traditional usability inspection, can “play therole” of a real customer.
There are several methods that imply direct involvement ofusers, such as observations, performance related measures, inter-views, questionnaires etc. (ISO, 2002). In the car domain, ques-tionnaires that collect data on car owners’ perceived usability area key factor in decisions on new interaction and interior designconcepts (Broström et al., 2007).
Yet perceived usability can be difficult to interpret. Forexample, Tractinsky et al. (2000) and Kurosu and Kashimura(1995) found in studies of computerized systems that perceivedusability was affected more by the interfaces’ aesthetics than bythe actual usability of the systems examined. This phenomenonwas contradicted by Broström et al. (2007), however, who foundthat multifunctional control layouts with similar APEAL ratings inaesthetics indeed had different results in perceived usability ifthe data were analysed taking age groups into consideration.Older adults are known to have difficulty retrieving informationfrom the working memory, and the age difference becomes evengreater when tasks include effortful processing (Pew and Hemel,2004).
Irrespective of interpretation and incompatibility problems, ISO(1998) stated that measures based on users’ subjective evaluationscan provide an indication of the real efficiency (e.g. mental effortand task completion time) and shall be used if it is not possible toobtain more objective measures. As customer survey question-naires and evaluations made by experts are important sources ofdata for usability and safety analysis in the car industry, there isclearly a need for research concerning the relation between thetwo.
The objective of this paper was to investigate whether theresults on subjective efficiency gathered in a customer survey couldalso be found in a usability inspection that measures real efficiency,subjective efficiency and exploited usability principles.
R. Broström et al. / Applied Ergonomics 42 (2011) 575e582576

1.2. Overview of the studies
The two studies described in this paper were conducted in carsalready in production, thus in a summative manner. Since theobjective of the paper was to investigate whether usability resultsconcerning task efficiency in a customer survey could be comparedwith a usability inspection, it was important that both studies usedsimilar cars. In particular, on the basis of ISO (1998), we investigatedwhether perceived efficiency in customer survey reports could beverified by collecting efficiency metrics in tasks performed byexperts and by experts exploiting usability principles.
The first study reported customer survey results for closecontrol (Acura-CC1 and Infiniti-CC2) and remote control (Audi-RC1and BMW-RC2) rotary devices, Fig. 1. Ratings were based onperceived task efficiency data from a large customer survey data-base in the North American market.
The second study reported usability inspection of one closecontrol (CC1) and two remote control (RC1 and RC2) layouts, Fig. 1.As study II was conducted in Europe, layout CC2, which was onlyavailable on the North American market, could not be included inthe study. The measures for usability inspection adopted in thesecond study were of a kind that, if used in an iterative design
Fig. 1. Control configurations and examples of LCD screen layouts for the assessed layouts. Layout CC1 was an Acura RL model year 2006, layout CC2 was an Infiniti M model year2006, layout RC1 was an Audi A6 model year 2006 and layout RC2 was a BMW 530 model year 2006.
R. Broström et al. / Applied Ergonomics 42 (2011) 575e582 577

process (Keinath et al., 2008), would be conducted in a formativemanner.
2. Study I: customer survey e APEAL
The objective of study I was to assess differences in perceivedefficiency between close control and remote control layouts forsound and navigation system tasks. According to ISO (1998),measures based on users’ subjective evaluations can provide anindication of the real efficiency (e.g. mental effort and taskcompletion time) and shall be used if it is not possible to obtainmore objective measures.
2.1. Study I: method
The APEAL (Automotive Performance, Execution and Layout)USA market surveys of 2005 and 2007 (J.D. Power, 2009) eachassessed customer opinions based on about 100,000 new vehicledrivers during their first 90 days of ownership. The APEAL ques-tionnaire was sent to households with owners of new vehicles, andthe attached letter pointed out the importance of the survey as “anessential step in the product improvement process for automotivemanufacturers”. Moreover, the person in the household who drovethe new vehiclemost oftenwas encouraged to complete the survey.The survey contained questions in different categories of vehicleperformance and design data such as cockpit/instrument panel,comfort/convenience, heating, ventilation/cooling, sound systemand navigation system.
In this study, answers concerning perceived task efficiencywhen using the sound system and the navigation system wereextracted from the APEAL surveys. The question selected fromAPEAL 2005 that relates to the efficiency of using the sound systemwas ability to easily use the controls while driving (answers in thesurvey were given on a scale of 1e10, where 1 denotes unaccept-able, 5 average and 10 outstanding). The question selected fromAPEAL 2007 related to the efficiency of using the navigation systemwas ease of using the navigation system (answers were given ona scale of 1e10, where 1 denotes unacceptable, 4 average, 7outstanding and 10 truly exceptional).
Four premium cars with rotary control layouts were selected,Table 1. The cars had state of the art functionality with a similarnumber of infotainment (sound and navigation) functions. Thefunctions were manoeuvred from multifunction control unitsand displayed on high positioned colour LCDs. Mean values fromfive predefined age groups were derived from the surveys. The
age group data were further sorted according to the layouts’control display configuration, based on the study of Broströmet al. (2007), Table 1: First, the close control layouts (CC),meaning a layout where a display, mode buttons and multi-functional controls are arranged in close proximity; and second,the remote control layouts (RC), signifying mode buttons andmultifunctional controls grouped in remote proximity to thedisplay, Fig. 1.
2.2. Study I: results
The data were analysed with one-factor ANOVAs with layout(CC and RC) as thewithin-subject factor. Mean values from each agegroup in the APEAL data were used as subject in the analysis. Alleffects are reported as significant at p < .05. The Bonferroniprocedure was used for post-hoc pair wise comparisons of means.The error bars in the figures represent 95% confidence interval forthe means and have been adjusted to suit within-subject compar-isons (Loftus and Masson, 1994).
2.2.1. Task efficiency e sound system tasks in APEALThe results show that the question on ability to easily use the
controls while driving was significantly affected by the type oflayout, F(1, 4) " 8.56, p < .05. The post-hoc test revealed that CClayouts had a higher APEAL result and thus a higher perceived taskefficiency than the RC layouts for sound system tasks, Fig. 2.
2.2.2. Task efficiency e navigation system tasks in APEALThe results show that the question of ease of using navigation
system was significantly affected by the type of layout, F(1, 4) " 103.5, p < .001. The post-hoc test demonstrated that CClayouts also had higher APEAL results and thus a higher perceivedtask efficiency than the RC layouts for navigation system tasks,Fig. 2.
3. Study II: expert evaluation
It was hypothesized that the effects observed in study I oncustomers’ perceived efficiency would be confirmed when thesame layouts were assessed using experts as inspectors and testsubjects:
# A high APEAL result will lead to a high Nielsen heuristics rating(experts used as inspectors)
# A high APEAL result, i.e. high perceived task efficiency, will leadto a high task efficiency (high task efficiency " low taskcompletion time and low RTLX value) among the experts usedfor the road test. (experts used as test subjects)
3.1. Study II: method
3.1.1. ParticipantsSix human factors professionals participated in the evaluation,
three from the automotive industry and three universityresearchers. All were double experts, i.e. both knowledgeable inusability issues in general and the vehicle domain in particular. Themean age was 43 (SD 12.2) years among the automotive expertsand 34 (SD 11.6) years among the researchers. All automotiveexperts had more than eight years of experience in the field of HMIsystems design. All the university researchers had worked withHMI analysis in the automotive industry for more than four years.One automotive expert and one university researcher were pairedduring the assessment.
Table 1Distribution of number of answers within each age group according to type ofcontrol layout. Values show the number of answers from APEAL 2005 and 2007surveys (2005/2007).
Type of layout/Age group
$34 35e44 45e54 55e64 65! All age groups
Close Control 1(CC1)
15/50 67/108 126/117 155/141 121/93 484/509
Acura RLClose Control 2
(CC2)10/32 17/87 41/158 37/139 24/90 129/506
Infiniti M2006Remote Control 1
(RC1)39/39 84/123 129/116 153/100 79/56 484/434
Audi MMIRemote Control 2
(RC2)88/46 178/116 233/148 199/122 91/79 789/511
BMW IdriveTotal 152/167 346/434 529/539 544/502 315/318 1886/1960
R. Broström et al. / Applied Ergonomics 42 (2011) 575e582578

3.1.2. Multifunctional control layoutsThree cars with multifunction control layouts that were part of
the analysis in study I were further assessed in study II: CC1, RC1and RC2. All cars had multifunction control layouts with a rotaryknob that could be rotated and pressed and a centrally highmounted LCD screen. Layout CC1 was a 2006 Honda Legend (samelayout as Acura RL on the USmarket). It consisted of a centrally highmounted LCD screen and a centrally mounted multifunctionalcontrol group, Fig. 1. Layout RC1 was a 2006 Audi A6 with a cen-trally high mounted LCD screen and a centrally low mountedmultifunctional control group. Layout RC2 was a 2006 BMW 530with a centrally high mounted LCD screen and a centrally lowmounted multifunctional control group, Fig. 1.
3.1.3. IVIS tasksThe tasks consisted of ten typical sound system functions and
two typical navigation system functions: 1. Activate radio FM, 2.Adjust volume to appropriate level, 3. Select a specific radio stationwith a well known frequency, 4. Change to the next radio station, 5.Change to a specific radio station with a less known frequency, 6.Change to CD, 7. Select song 8 in CD, 8. Adjust bass and treble (Max-Min-Zero on both), 9. Decrease volume to zero (Mute),10. Move fivesongs forward, 11. Input a specific destination by the spellingmethod and 12. Add a specific petrol station to the route list.
3.1.4. Usability measuresThe usability inspection measured task completion time, task
load index and Nielsen heuristics.Task completion time is a commonly used metric to assess task
efficiency (ISO, 1998). It is known to require minimal imple-mentation and is correlated with crash risk (Blanco et al., 2005;Green, 1999).
The NASA Task Load Index (NASA TLX; Hart and Staveland, 1988)is a subjective mental workload assessment tool that is used tomeasure mental workload during task performance. The method isused to derive an overall workload rating based upon an average ofsix workload sub-scale ratings: 1. Mental demand, 2. Physicaldemand, 3. Temporal demand, 4. Effort, 5. Performance and 6.Frustration level. The TLX also employs a paired comparisonsprocedure. The paired comparison was excluded in the presentstudy, which means that we used a reduced TLX (NASA RTLX; Byerset al., 1989).
Heuristic usability inspections offer a quick and simple approachto interface evaluation. The popularity of heuristic analysis lies inits simplicity and the fact that it can be made easily at any stage inthe design process (Stanton et al., 2005). A team of expertsperforms a series of interactions with the interfacewhile evaluatingthe interface in relation to a predefined heuristics list. In the Niel-sen heuristic evaluation, only six evaluators are needed to findmore than 75% of the usability problems in an interface (Nielsen,2005). Nine of ten principles from the Nielsen heuristic
evaluation were assessed (Nielsen, 1994). The evaluators docu-mented usability pros and cons concerning: 1. Visibility of systemstatus, 2. Match between system and real world, 3. User control andfreedom, 4. Consistency and standards, 5. Error prevention, 6.Recognition rather than recall, 7. Flexibility and efficiency of use, 8.Aesthetic and minimalist design and 9. Help users recognize,diagnose and recover from errors. A rating for each category ona scale of 1e5, where 1 denotes unacceptable, 3 average and 5excellent, was also logged.
3.1.5. ProcedureBefore driving, each team of evaluators started by exploring all
of the 12 tasks while stationary in the cars. The evaluators were toldto use the multifunctional control groups exclusively and not thesteering wheel controls. For each layout, the evaluators wereinstructed to practice on all tasks in a stationary condition untilthey were able to carry them out. The on-road evaluation thenstarted and was carried out in two driving conditions, city drivingand highway driving. All evaluators were familiar with the twodefined routes. The city driving scenario was a part of a city centrewith pedestrian crossings and roundabouts every 200m. The trafficwas less dense in the highway scenario than in the city scenario,and the evaluators were told tomaintain a speed of 90 km per hour.The evaluators were instructed to continue driving along thedefined routes until they had solved all tasks.
One evaluator in each team started by driving the city scenariowhile the other evaluator, the co driver, initiated the driver in eachtask and used a stopwatch to record the time used on the task. Aftereach completed task-scenario condition (1. Sound-City, 2. Navi-City,3. Sound-Highway and 4. Navi-Highway) the driver filled outa Paper-based NASA Raw Task Load Index (RTLX) form (Byers et al.,1989). Once the first evaluator had finalized all task-scenarioconditions, the team changed their roles from driver to co driver.The starting order in each team was the same for all cars. Theheuristic evaluation was carried out after the on-road evaluation.
3.2. Study II: results
The study had a within-subject design with the variable oflayout (CC1 and RC). The analysis was made using one-factor,repeated-measures ANOVA. All effects are reported as significant atp < .05. The Bonferroni procedure was used for post-hoc pair wisecomparisons of means. The error bars in the figures represent 95%confidence interval for the means and have been adjusted to suitwithin-subject comparisons (Loftus and Masson, 1994).
3.2.1. Dependent measuresTask efficiency was observed by collecting task completion time
and RTLX data. The mean task completion time in seconds wascomputed by making an average of all tasks within one system.Sound system tasks contained task nos. 1e10 and navigation
Type of layout
AP
EA
L S
ou
nd
ad
jus
te
d
RCCCType of layout
RCCC
10,09,59,08,58,07,57,0 A
PE
AL
Na
vi
ad
jus
te
d
10,09,59,08,58,07,57,0
95% CI for the MeanAPEAL Sound
95% CI for the MeanAPEAL Navi
Fig. 2. Mean values for the answers on ability to easily use the sound controls while driving and for the answers on ease of using the navigation system for close control (CC) andremote control layouts (RC). A high result on the APEAL survey stands for high perceived task efficiency, based on the assumptions in ISO (1998).
R. Broström et al. / Applied Ergonomics 42 (2011) 575e582 579

system task nos. 11e12. The mean value for RTLX factors (mentaldemand, physical demand, temporal demand, performance, effortand frustration level) was also computed as an average for eachsystem. The mean usability heuristic was computed by making anaverage of all nine Nielsen heuristics.
3.2.2. Task efficiency e sound system tasksThe results showed that themean task completion time (MT) for
sound system tasks was significantly affected by the type of layout,F(1, 4) " 8.51, p < .05. The post-hoc test revealed that MT for CC1was lower than in the RC layouts, Fig. 3. Further, the result for RTLXwas significantly affected by the type of layout, F(1, 4) " 8.23,p < .05. The post-hoc test indicated that RTLX for CC1 was lowerthan in the RC layouts, Fig. 3. Both metrics indicate that CC1 hasa higher task efficiency than the RC layouts for sound system tasks.
3.2.3. Task efficiency e navigation system tasksTherewas also a significant effect of layout in the tasks related to
the navigation system, F(1, 4) " 47.5, p < .01, for mean taskcompletion time (MT). The post-hoc test revealed that MT for CC1was lower than in the RC layouts, Fig. 4. The results for RTLX andnavigation system tasks were also significantly affected by the typeof layout, F(1, 4)" 16.1, p< .05. The post-hoc test indicated that RTLXfor CC1 was lower than in the RC layouts, Fig. 4. Again, both metricsindicate that CC1 has a higher task efficiency than the RC layouts.
3.2.4. Nielsen heuristicsThe results showed that the type of layout was not significantly
affected by the Nielsen heuristics, F(1, 4) " 4.49, p > .05, Fig. 5. Themean results were 3.5 for CC1 and 2.8 for the RC layouts.
4. Discussion
The objective of study I was to investigate differences incustomers’ perceived efficiency of close control and remote controllayouts for sound and navigation system tasks. The studywas basedon data from the APEAL customer survey concerning premium cars
where sound and navigationwere operated bymultifunction rotarycontrols.
The results of study I show that, in terms of ease of use whiledriving, the perceived efficiency of sound system tasks was signif-icantly higher for close control than for remote control layouts(Fig. 2). Analogously, the customers’ perceived efficiency of navi-gation system tasks in terms of ease of use was significantly higherfor close control than for remote control layouts (Fig. 3). Thus, theresults clearly indicate a higher task efficiency and thereforegreater safety and usability for close control than remote controllayouts. This is an important result since it is based on the opinionsof real users of the cars in question, and the results of APEAL carrysubstantial weight among car manufacturers. The industry basi-cally approaches interaction with IVIS by means of customerstudies, such as small clinics or large scale surveys. They areconsidered to give valid information about the opinions of andsatisfaction among end-customers.
In short, when designing new cars, data on car owners’perceived usability collected from customer survey questionnairesare a key factor in decisions about new interaction and interiordesign concepts (Broström et al., 2007). However, end-user studiesare also recognized by researchers who focus on IVIS and usabilityas a means of identifying problems that can only be found by realusers who use the final product (Nielsen, 1994).
One important issue in assessing the APEAL customer survey datais the risk of selection bias,whichmay lead to anover-optimistic viewof e.g. perceived system efficiency. The APEAL survey containsinformation fromcustomers that,first,made the decision to buy theircar and, second, decided to respond to the questionnaire. On theother hand, the comparisons in this paper were made between carsthat were part of the same APEAL studies and the same premium carsegment, hence giving a minimal risk for a between-cars effect.However, an over-optimistic view of system efficiency may createa ceiling effect, which reduces the sensitivity of the data.
Another important issue in an assessment of the APEAL customersurvey data is the general data format. It is presented inmean valuesper layout andmay thus contain confounding factors. To increase the
Layout
MT
So
un
d(s)
RCCC1Layout
RCCC1
7,57,06,56,05,55,0
4,54,0
95% CI for the MeanTask completion time -Sound system -
95% CI for the MeanRTLX -Sound system -
RT
LX
So
un
d
5,04,54,03,53,02,52,0
Fig. 3. Results for task efficiency in sound system tasks. Low values of mean task completion times and RTLX represent high task efficiency, according to ISO (1998).
Layout
MT
Na
vi
(s
)
RCCC1Layout
RCCC1
656055504540
3530
95% CI for the MeanTask completion time -Navigation system-
95% CI for the MeanRTLX -Navigation system-
RT
LX
Na
vig
atio
n
5,0
4,5
4,0
3,5
3,0
2,5
2,0
Fig. 4. Results for task efficiency in navigation system tasks. Low values of mean task completion times (MT) and RTLX represent high task efficiency, according to ISO (1998).
R. Broström et al. / Applied Ergonomics 42 (2011) 575e582580

control of age, and therefore increase the sensitivity of the data, themean value for each age groupwas treated as one subject value. Thiswas done because, with increasing age, it becomes more difficult toretrieve information from theworkingmemory, especially when theinformation to be retrieved is complex and when there are few cuesor other environmental support (Pew and Hemel, 2004). For thisreason, when tasks include manipulation of menu systems andrequire recall rather than recognition of information, which is thecase in the tested layouts, the mental effort in combinationwith agemight be of importance. While it is clear that other factors such ascomputer experience and educational level might be hidden in theage factor, a majority of premium car owners are older than 50 years(Table 1) and the age factor must thus be taken into considerationwhen IVIS are designed.
The conclusion made that the higher efficiency, the better theusability and safety in close control as compared to remote controllayout is important. At the same time however this finding issomewhat unexpected and must be verified in further studies. Thiscan be done by more of the same, i.e. customer studies, or by usinga different usability evaluation methodology.
In addition to verifying the results of Study I, an objective ofstudy II was to test whether the task efficiency perceived bycustomers could be forecasted by performance and heuristicstudies of task efficiency in the same control display configuration.On the basis of the APEAL customer survey results in study I, it washypothesized that a high perceived efficiency would yield a highmeasured efficiency in terms of short task completion time, a lowRTLX value and a high usability principles rating given by experts.
The results of study II show that the efficiency measured forsound and navigation system tasks in terms of shorter taskcompletion time was significantly higher for close control than forremote control layouts (Fig. 3). Furthermore, the efficiency in termsof mental workload measured by RTLX, was significantly higher forclose control than for remote control layouts (Fig. 3). The resultsstrongly support the results of study I, giving evidence of highertask efficiency, and thus better usability and safety, in close controlthan remote control layouts.
The results establish an opportunity to predict the outcome ofcustomer surveys by other methodologies, in this case an on-roadtest that measures time on task performance and mental effort,where usability experts act both as users and evaluators. Othermethodologies using other efficiency metrics may also support thisprediction, such as, a static test that measures time on taskperformance (SAE, 2004), eye glances with the occlusion technique(Baumann et al., 2004), cognitive workload using PDT (Jahn et al.,2005) or a simple driving simulator test such as the Lane ChangeTask (Mattes, 2003).
The results agree with the ideas given in ISO (1998), whichsuggested that measures based on users’ subjective evaluations cangive an indication of real efficiency (e.g. task completion time andmental effort).
As mentioned above, car manufacturers for obvious reasonsoften use customer studies while, on the other hand, researchers atuniversities are more inclined to carry out driving performance anddriver behaviour studies using IVIS prototypes and simulators(Horberry et al., 2006). The lattermethodology allows a high degreeof control and reliability but is not always considered valid by carmanufacturers with regard to customer opinion and is hence givenlower priority. Broström et al. (2007) argued that there is a need tointerpret customer survey data within a consistent framework thatincludes data originating from other methodologies.
It is furthermore important to include in a framework of thiskind usability evaluation methodologies that are both formative,i.e. can be used during the development process to directly improvethe design, and summative, i.e. can be carried out when the designis complete (Hartson et al., 2003). Although the methodologies inboth study I and study II were used in a summative context withreal products, the expert evaluation applied in study II can just aseasily be used in a formative context. In that case, accuracy inpredicting customers’ perceived efficiency will most likely dependon the similarity of prototypes to the final product. Therefore,a suitable design phase for this “modified expert evaluation” couldbe when decisions are to be made on concept selection.
It can also be concluded that no significant difference was foundbetween the layouts in the case of the Nielsen heuristics rating. Thismay be explained as an evaluator effect, since the Nielsen heuristicsrating involves interpretation of the heuristics (Hertzum andJacobsen, 2003). It is interesting to note that customer ratings,time on task measurements and mental workload measurementsyield the same results, while the Nielsen heuristics rating does not.The latter has also been questioned in terms of the type of problemsthat it detects (Wixon, 2003) and of evaluator effects (Hertzum andJacobsen, 2003; Jeffries and Desurvire, 1992; Ling and Salvendy,2009).
Hence, combining different UEM traditions in the formativephase should be more useful for driverecar interaction design. Thepresent paper emphasises an improvement of the commonly usedexpert evaluation with an addition of a quantitative approach, e.g.task completion time.
Obviously, task completion time for IVIS is correlated with crashrisk (Green, 1999) and this fact has been taken into consideration inthe 15-Second Rule, where any navigation function that is acces-sible by the driver while a vehicle is in motion shall have a statictotal task completion time of no more than 15 s. The 15-SecondRule can be used in a formative manner and, as the functionalrevolution in modern cars is continuously introducing more taskswith a complexity similar to that of navigation functions, there isa need to further examine evaluation methods that are easy toimplement and computable early in development in an iterativemanner. As the 15-Second Rule does not discover all aspects of taskcomplexity, supplementary tests that pertain to visual and cogni-tive task complexity should be added to assess effects on drivingperformance (Blanco et al., 2005). Furthermore, it would be inter-esting to test whether static methods or simple driving simulatortasks (Mattes, 2003) that can be easier to carry out than the on-roadtest in study II may also be able to predict customer perceivedefficiency.
According to Hartson et al. (2003), a usability problem foundin a formative context is real only if it is a predictor ofa summative context. The results in this study suggest taskcompletion time and NASA RTLX to be predictors of customers’perceived efficiency.
Layout
Me
an
ra
tin
g
RCCC1
5
4
3
2
1
0
95% CI for the MeanNielsen heuristics
Fig. 5. Results of Nielsen heuristics; comparison of Honda (CC1), Audi (RC1) and BMW(RC2) for mean values of nine usability principles (1. Visibility of system status,2. Match between system and real world, 3. User control and freedom, 4. Consistencyand standards, 5. Error prevention, 6. Recognition rather than recall, 7. Flexibility andefficiency of use, 8. Aesthetic and minimalist design, 9. Help users recognize, diagnoseand recover from errors).
R. Broström et al. / Applied Ergonomics 42 (2011) 575e582 581

5. Conclusion
The joint results of studies I and II clearly prove a difference inefficiency between the two control display configurations for IVIS.The efficiency and hence usability and safety are higher for closecontrol than remote control as concerns customer ratings,measurements of time required to complete tasks and measure-ments of mental workload.
In conclusion, the results reported here offer an opportunity todevelop a safety and usability evaluation framework that includesboth formative and summative approaches, as there is a highdegree of consistency between the different methodologies.
References
AAM (Alliance of Automobile Manufacturers, Driver Focus-Telematics WorkingGroup), 2002. Statement of Principles, Criteria and Verification Procedures onDriver Interactions with Advanced In-Vehicle Information and CommunicationSystemsdVersion 2.0. Obtained through the Internet. http://www.umich.edu/edriving/guidelines/AAM_DriverFocus_Guidelines.pdf (accessed 30/10.2009).
Baumann, M., Keinath, A., Krems, J.F., Bengler, K., 2004. Evaluation of in-vehicle HMIusing occlusion techniques: experimental results and practical implications.Applied Ergonomics vol. 35, 197e205.
Blanco, M., Hankey, J. M., Chestnut, J. A., 2005. A taxonomy for secondary in-vehicletasks based on eye glance and task completion time. In: Proceedings of the 49thHuman Factors and Ergonomics Society Annual Meeting, Orlando, FL, pp.1975e1979.
Broström, R., Bengtsson, P., Axelsson, J., 2007. Perceived styling and usability inintegrated centre panel layouts as a function of interaction style and age. In:de Waard, D., Hockey, G.R.J., Nickel, P., Brookhuis, K.A. (Eds.), Human FactorsIssues in Complex System Performance. Shaker Publishing, Maastricht, pp.193e204.
Byers, J.C., Bittner, A.C., Hill, S.G., 1989. Traditional and raw task load index (TLX)correlations: are paired comparisons necessary? In: Mital, A. (Ed.), Advances inIndustrial Ergonomics and Safety. Taylor & Francis, London, pp. 481e485.
ESOP, 2006. European Statement of Principles on Human Machine Interface.Obtained through the Internet. http://www.esafetysupport.org/download/working_groups/hmi_esop221206_en.pdf (accessed 30.10.2009).
Gray,W.D., Salzman,M.C.,1998. Damagedmerchandise? A review of experiments thatcompareusabilityevaluationmethods.HumanComputer Interaction13, 203e261.
Green, P., 1999. Navigation system data entry: estimation of task times. UMTRI99e17.
Hart, S.G., Staveland, L.E., 1988. Development of a NASA-TLX (Task Load Index):results of empirical and theoretical research. In: Hancock, P.A., Meshkati, N.(Eds.), Human Mental Workload. North Holland Press, Amsterdam, pp.239e250.
Hartson, H.R., Andre, T.S., Williges, R.C., 2003. Criteria for evaluating usabilityevaluation methods. International Journal of Human-Computer Interaction 15(1), 145e181.
Hertzum, M., Jacobsen, N.E., 2003. The evaluator effect: a chilling fact aboutusability evaluation methods. International Journal of Human-ComputerInteraction 15 (1), 183e204.
Horberry, T., Anderson, J., Regan, M.A., Triggs, T.J., Brown, J., 2006. Driver distraction:the effects of concurrent in-vehicle tasks, road environment complexity and ageon driver performance. Accident Analysis and Prevention 38, 185e191.
ISO/TR 16982, 2002. Ergonomics of Human-System Interaction e Usability methodssupporting human-centred design.
ISO 9241e11, 1998. Ergonomic Requirements for Office Work with Visual DisplayTerminals (VDTs) Part 11: Guidance on Usability.
Jahn, G., Oehme, A., Krems, J., Gelau, C., 2005. Peripheral detection as a workloadmeasure in driving: effects of traffic complexity and route guidance system usein a driving study. Transportation Research Part F 8, 255e275.
Jeffries, R., Desurvire, H., 1992. Usability testing vs. heuristic evaluation: was therea contest? SIGCHI Bulletin 24 (4), 39e41.
Jordan, P.W., 1998. An Introduction to Usability. Taylor and Francis, London.Keinath, A., Durach, S., Eckstein, L., Niedermaier, B., 2008. The BMW iDrive e The
next step of a revolution. In: Proceedings of the 2008 Applied Human Factorsand Ergonomics Conference, Las Vegas.
Klauer, S.G., Dingus, T.A., Neale, V.L., Sudweeks, J.D., Ramsey, D.J., 2006. The Impactof Driver Inattention on Near-Crash/Crash Risk: An Analysis Using the 100-CarNaturalistic Driving Study Data (Report DOT HS 810 594). Virginia TechTransportation Institute, Blacksburg, Virginia, USA.
Kurosu, M., Kashimura, K., 1995. Apparent usability vs. Inherent usability: experi-mental analysis on the determinants of the apparent usability. ConferenceCompanion on Human Factors in Computing Systems. ACM Press, New York, NY,USA (Denver, USA)292e293.
Ling, C., Salvendy, G., 2009. Effect of evaluators cognitive style on heuristic evalu-ation: field dependent and field independent evaluators. International Journalof Human Computer Studies 67, 382e393.
Loftus, G.R., Masson, M.E., 1994. Using confidence intervals in within-subjectdesigns. Psychonomic Bulletin & Review 1, 476e490.
Mattes, S., 2003. The lane-change-task as a tool for driver distraction evaluation. In:Strasser, H., Klutch, K., Rausch, H., Bubb, H. (Eds.), Quality of Work and Productsin Enterprises of the Future. Ergonomia Verlag, Stuttgart, pp. 57e60.
Nielsen, J., 1994. Heuristic evaluation. In: Nielsen, M.a.c.k. (Ed.), Usability InspectionMethods. John Wiley & Sons, New York, pp. 25e62.
Nielsen, J., 2005. Obtained through the Internet: http://www.useit.com/papers/heuristic/ (accessed 07.04.2010).
Pew, R., Hemel, S.V., 2004. Technology for Adaptive Aging. National AcademiesPress, Washington, DC.
Power, J.D., 2009. Obtained through the Internet: http://www.jdpower.com/corporate/news/releases/pressrelease.aspx?ID"2008078 (accessed 30.10.2009).
Rogers, W.A., Fisk, A.D., Collins McLaughlin, A., Pak, R., 2005. Touch a screen or turna knob: choosing the best device for the job. Human Factors 47, 271e288.
SAE J2364, 2004. Surface Vehicle Recommended Practice. Navigation and RouteGuidance Function Accessibility while Driving. Society of Automotive Engi-neers, Warrendale, PA.
Stanton, N.A., Salmon, P.M., Walker, G.H., Baber, C., Jenkins, D.P., 2005. HumanFactors Methods: a Practical Guide for Engineering and Design. Ashgate.
Stevens, A., de Lancey, A., Davison, A., Allen, P., Quimby, A., 1999. A Safety Checklistfor the Assessment of In-vehicle Information Systems. Project Report SE/589/99. Transportation Research Laboratory, Berkshire, England.
Tractinsky, N., Katz, A.S., Ikar, D., 2000. What is beautiful is usable. Interacting withComputers 13, 127e145.
Victor, T.W., Harbluk, J.L., Engström, J.A., 2005. Sensitivity of eye-movementmeasures to in-vehicle task difficulty. Transportation Research Part F 8,167e190.
Wixon, D., 2003. Evaluating usability methods: why the current literature fails thepractitioner. Interactions 10, 28e34.
R. Broström et al. / Applied Ergonomics 42 (2011) 575e582582
Paper III Broström, R., Ljung Aust, M., Wahlberg, L., & Källgren, L. (2013). What drives off-road glance durations during multitasking – capacity, practice or strategy? In Proceedings of the Third International Conference on Driver Distraction and Inattention, Göteborg, Sweden.


PROCEEDINGS of the 3rd international Conference on Driver Distraction and Inattention, September 4-6, 2013, Gothenburg, Sweden (No. 08-P)
What drives off-road glance durations during multitasking –
capacity, practice or strategy?
Robert Broström 1, Mikael Ljung Aust1, Linnea Wahlberg2, Laban Källgren2
1Volvo Car Corporation, Sweden
2 Swedish National Road and Transport Research Institute (VTI), Sweden
Abstract
NHTSA has proposed compliance criteria for in-vehicle tasks in driving simulators.
These criteria exclude usage of interfaces with too many long glancing participants. In
the current study 30 participants performed three infotainment tasks while driving a high-
fidelity driving simulator. Off-road glance durations for three data-trails were analysed to
assess the prevalence of long glancers and possible reasons for the existence of long
glancers. Results show that 85th percentile off-road glance durations were common, and
significantly varied between participants. Also, the number of long glancers was reduced
with repetition, but did not change between task types. Furthermore, there was no
correlation between drivers’ performance on a Trail Making Test and the 85th percentile
off-road glance durations. Hence, variations in glance duration seem more to reflect
individual glance strategies than in-vehicle task complexity or individual performance
capacity measured by the Trail Making Test. The findings in this study have implications
for further development of compliance testing procedures.
Introduction
Naturalistic driving studies indicate that looking away from the forward roadway for more
than a certain period of time is a key crash contributing factor (Dingus et al. 2006, Klauer
et al. 2006, Victor and Dozza, 2011, Liang et al. 2012). This fact, combined with the
societal transition towards ubiquitous use of information technology, has put driver
distraction on top of the traffic safety agenda. From a vehicle design point of view, many
sources of distraction such as eating, drinking and interacting with passengers lie outside
the manufacturer’s influence. However, as OEMs do control the design of in-vehicle
systems that involve visual-manual interaction while driving, guidelines that give
recommendations on how to maximize usability and minimize distraction during visual-
manual interactions are being incorporated in the vehicle design process (Broström,
Bengtsson and Axelsson, 2011).
Several design guidelines have been published, including the European Statement
of Principles (EU 2008), the JAMA guidelines (JAMA 2004) and the Alliance guidelines
(Alliance of Automobile Manufacturers 2006). The latest addition is the visual-manual
interaction in-vehicle system interaction guidelines proposed by the National Highway
Traffic Safety Administration (NHTSA, 2012). This guideline approaches visual
distraction in a two-step procedure. First, it lists certain tasks that always should be
unavailable when driving, e.g., internet and social media browsing. For other tasks, the
guidelines specify several criteria against which in-vehicle system tasks should be
evaluated before being enabled during driving.

PROCEEDINGS of the 3rd international Conference on Driver Distraction and Inattention, September 4-6, 2013, Gothenburg, Sweden (No. 08-P)
2
The publication of these guidelines is very timely and will drive vehicle safety
forward. However, some formulations may need revision as new information comes to
light, and the first off-road glance duration criterion that NHTSA proposes may be one of
those. It reads as follows:
For at least 21 of the 24 test participants, no more than 15 percent (rounded
up) of the total number of eye glances away from the forward road scene
should have durations of greater than 2.0 s while performing the in-vehicle
task
To explain why this criterion may need revision, a short discussion on visual
attention sharing between the forward roadway and an in-vehicle task is necessary. Such
attention sharing can be portrayed as an iterative cycle. Drivers first look at the road to
check their safety margins, then at the in-vehicle display to complete the next step in the
current task, then back at the road again to check the safety margins, and so forth.
Drivers will generally try to get information from the in-vehicle task within a
second or less, and then return their gaze to the road (Wierwille, 1993). If retrieval of
adequate information takes longer they may continue to look away from the forward
roadway some additional time. However, if it takes more than about 1.5 s (Wierwille,
1993), drivers return their gaze to the road and try again later, see Figure 1.
Human performance is normally associated with certain variability within and
between individuals. Thus, even if all drivers have a point where they feel compelled to
return their gaze to the road (Wierwille, 1993), it is unlikely that this point lies at the same
value for all drivers. Some may prefer a faster cycle pace (i.e. a short glance on the
display, a short glance on the road, a short glance on display, etc.), while others may be
considered “long glancers”, i.e. they dwell longer in each cycle step (Ljung et al., 2013).
The potential problem implied by such variability in relation to NHTSA’s
criterion is that as currently written, the criterion brings the pass/fail measurement of off-
road eye glance durations down to an individual level instead of measuring at the group
level. First, each individual is assessed based on whether they meet what can be called an
85th percentile off-road glance duration criteria, i.e. whether at least 85 % of their off-
road glances during a task are shorter than 2.0 seconds. Next, the proportion of drivers
meeting this requirement is determined.
If we assume the off-road glance duration variability between drivers exists, some
drivers may naturally prefer cycle times that will make them fail on the 85th percentile
criterion. Hence, if the relative prevalence of such natural “long glancers” is greater than
the 3 in 24 allowed by NHTSAs criterion, then repeated random sampling of 24
compliance-test-participants will from time to time lead to failing in-vehicle tasks due to
normal driver variability rather than poor task design. It is therefore important to find out
if “long glancers” exist and how common they are in the normal driver population.
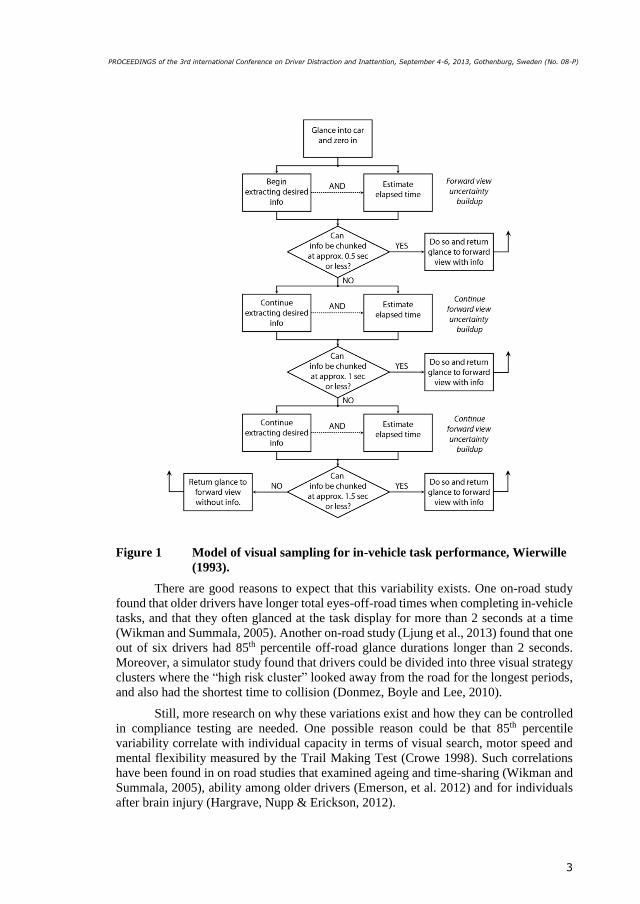
PROCEEDINGS of the 3rd international Conference on Driver Distraction and Inattention, September 4-6, 2013, Gothenburg, Sweden (No. 08-P)
3
Figure 1 Model of visual sampling for in-vehicle task performance, Wierwille
(1993).
There are good reasons to expect that this variability exists. One on-road study
found that older drivers have longer total eyes-off-road times when completing in-vehicle
tasks, and that they often glanced at the task display for more than 2 seconds at a time
(Wikman and Summala, 2005). Another on-road study (Ljung et al., 2013) found that one
out of six drivers had 85th percentile off-road glance durations longer than 2 seconds.
Moreover, a simulator study found that drivers could be divided into three visual strategy
clusters where the “high risk cluster” looked away from the road for the longest periods,
and also had the shortest time to collision (Donmez, Boyle and Lee, 2010).
Still, more research on why these variations exist and how they can be controlled
in compliance testing are needed. One possible reason could be that 85th percentile
variability correlate with individual capacity in terms of visual search, motor speed and
mental flexibility measured by the Trail Making Test (Crowe 1998). Such correlations
have been found in on road studies that examined ageing and time-sharing (Wikman and
Summala, 2005), ability among older drivers (Emerson, et al. 2012) and for individuals
after brain injury (Hargrave, Nupp & Erickson, 2012).
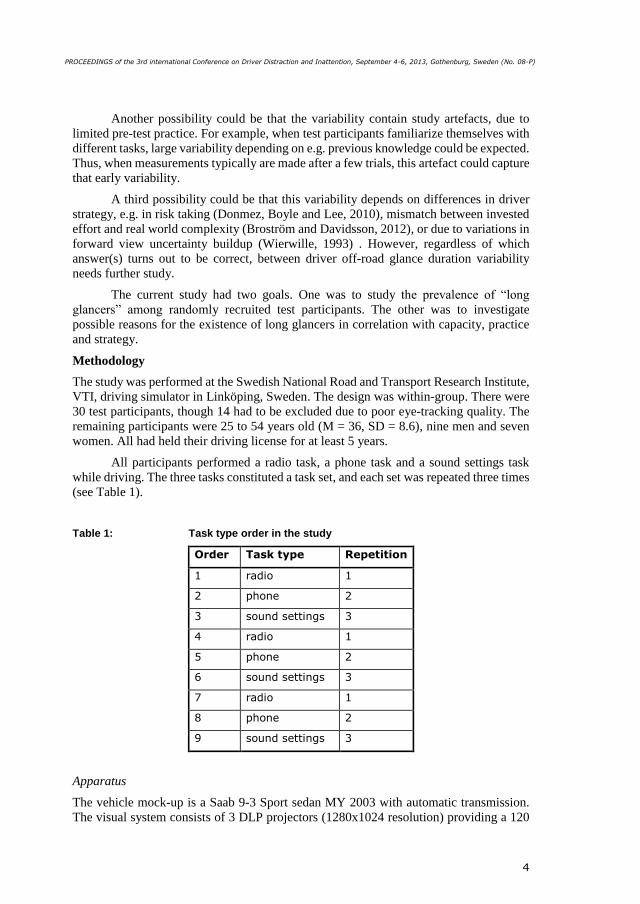
PROCEEDINGS of the 3rd international Conference on Driver Distraction and Inattention, September 4-6, 2013, Gothenburg, Sweden (No. 08-P)
4
Another possibility could be that the variability contain study artefacts, due to
limited pre-test practice. For example, when test participants familiarize themselves with
different tasks, large variability depending on e.g. previous knowledge could be expected.
Thus, when measurements typically are made after a few trials, this artefact could capture
that early variability.
A third possibility could be that this variability depends on differences in driver
strategy, e.g. in risk taking (Donmez, Boyle and Lee, 2010), mismatch between invested
effort and real world complexity (Broström and Davidsson, 2012), or due to variations in
forward view uncertainty buildup (Wierwille, 1993) . However, regardless of which
answer(s) turns out to be correct, between driver off-road glance duration variability
needs further study.
The current study had two goals. One was to study the prevalence of “long
glancers” among randomly recruited test participants. The other was to investigate
possible reasons for the existence of long glancers in correlation with capacity, practice
and strategy.
Methodology
The study was performed at the Swedish National Road and Transport Research Institute,
VTI, driving simulator in Linköping, Sweden. The design was within-group. There were
30 test participants, though 14 had to be excluded due to poor eye-tracking quality. The
remaining participants were 25 to 54 years old (M = 36, SD = 8.6), nine men and seven
women. All had held their driving license for at least 5 years.
All participants performed a radio task, a phone task and a sound settings task
while driving. The three tasks constituted a task set, and each set was repeated three times
(see Table 1).
Table 1: Task type order in the study
Order Task type Repetition
1 radio 1
2 phone 2
3 sound settings 3
4 radio 1
5 phone 2
6 sound settings 3
7 radio 1
8 phone 2
9 sound settings 3
Apparatus
The vehicle mock-up is a Saab 9-3 Sport sedan MY 2003 with automatic transmission.
The visual system consists of 3 DLP projectors (1280x1024 resolution) providing a 120

PROCEEDINGS of the 3rd international Conference on Driver Distraction and Inattention, September 4-6, 2013, Gothenburg, Sweden (No. 08-P)
5
degrees forward field of view. A dedicated graphics card provides edge blending and
geometrical correction. There are 3 LCD displays incorporated into the rear view mirrors
for rearward views. Sound from vehicles, road and wind is simulated and presented via
the in-vehicle speaker system. The moving base has three parts: a linear sled, a tilt motion
system and a vibration table. The sled can provide linear motion with amplitude of ± 3.75
m at speeds up to ± 4.0 m/s and accelerations up to ± 0.8 g. The tilt motion system can
produce pitch angles between - 9 degrees and + 14 degrees and roll angles of ± 24 degrees.
The vibration table gives ± 6.0 cm in vertical and longitudinal movement, with a
maximum roll angle of ±6 degrees and pitch angle of ± 3 degrees.
A tablet computer with a 9.7-inch touch screen was positioned in front of the
centre stack in the car. The computer contained mock-up infotainment applications
including phone dialling, radio tuning and sound settings. For eye-tracking, a four-camera
system from Smart Eye Pro 5.9 (Smart Eye, n.d.) was used. Three cameras were
positioned on top of the dashboard and one was positioned just to the right of the tablet
computer. Data logging from the eye tracker was done at a sampling rate of 40 Hz.
After the simulator drive, the participants carried out a trail-making test. The test
was performed on a 23-inch touch screen, where participants pressed target circle shapes
with a width of 2.74 cm.
Driving task and in-vehicle tasks
The primary task was to drive on a motorway for approximately 30 minutes. The
participants were instructed to drive as they normally would under similar circumstances
and keep the speed limit (90 km/h). There was oncoming traffic at an average rate of three
vehicles per minute and other cars overtook the participants on once a minute on average.
They also caught up with slower vehicles which they had to overtake on average once
every two minutes.
During the drive participants also executed three in-vehicle tasks on the tablet
computer. The first task was to dial their own phone number. By pressing buttons on the
display, participants first opened the phone feature and then the keypad, on which they
dialled their phone number and pressed a call button. They then hung up by pressing
another button. The participants were informed that the system was a mock-up and that
no signal was sent to the receiving number.
The second task was to manually tune to a specified radio frequency. By pressing
buttons on the display, the participants first opened the radio feature and then chose
manual tuning. They tuned the frequency either by pressing a marker on a frequency band
and then swiping it to the specified frequency or by pressing arrow buttons on each side
of the frequency band.
The third task was to change the bass and treble levels in the sound settings. The
sound settings display was opened by pressing buttons on the display. Bass and treble
levels where then swiped into position.
Each task was initiated by a pre-recorded voice message instructing the driver task
what to do and the details of the tasks, i.e. which radio frequency to tune in. After each
in-vehicle task the participants were instructed to press a home button, so each task started
from the same interaction point on the tablet computer.

PROCEEDINGS of the 3rd international Conference on Driver Distraction and Inattention, September 4-6, 2013, Gothenburg, Sweden (No. 08-P)
6
The Trail Making Test
The Trail Making Test measures processing speed, sequencing, mental flexibility and
visual-motor skills (Bowie and Harvey 2006). Traditionally it has two parts. In part A,
participant connects a series of encircled numbers in numerical order by drawing a line
between them. In part B, participants connects both encircled numbers and letters in order,
alternating between numbers and letters (1-A-2-B-3-C and so on) (Bowie and Harvey
2006). In this study, a computerized version of the Trail Making Test was used (Summala,
Etholén, Leino, Niskakangas, Laine & Saarinen, 2008). It was carried out on a touch
screen where participants pressed the target circles, see figure 2.
Figure 2
The screens for the trail-making test part A (left) and part B (right). All targets had black circles and the first target (1) was highlighted with a blue circle.
The test included part A and part B, where part A contained targets with fixed
positions and part B targets which randomly changed positions after every press. Each
round consisted of 20 targets and was carried out two times according to the order in
Table 2.
Table 2: Task order in trail-making test
Order Round Targets Positions
1 Part A fixed Numerical fixed
2 Part A random Numerical random
3 Part B fixed numerical and alphabetical fixed
4 Part B random numerical and alphabetical random
5 Part B random numerical and alphabetical random
6 Part B fixed numerical and alphabetical fixed
7 Part A random Numerical random
8 Part A fixed Numerical fixed

PROCEEDINGS of the 3rd international Conference on Driver Distraction and Inattention, September 4-6, 2013, Gothenburg, Sweden (No. 08-P)
7
Procedure
On arrival, participants were given written and verbal information about the study and
asked to sign an informed consent form. They were then given written instructions for the
in-vehicle system tasks, and were instructed to try them out. They performed each task
until they were comfortable performing them in parking mode. Next a 10-minute training
drive followed, after which the actual test drive commenced. After the drive, participants
read trail-making test instructions and made four practice rounds with 12 circles per
condition. Next they performed the real test of eight rounds with 20 circles. The mean
time between pressing two successive, correct targets was calculated for each of the four
rounds.
Glance data reduction
In this study, off-road glance durations were defined as starting when the driver’s gaze
leaves the forward roadway and ending when gaze returns there. This does not follow the
ISO 15007-1 standard (ISO), since it incorporates both the saccade to and away from the
display, whereas the ISO-standard only includes the first.
Each task was defined as starting when a voice message announcing it was played
and ending either when a new task started or 60 seconds after start of the task, whichever
came first. Task length therefore varied between 23 and 60 seconds.
The eye-tracker data quality varied quite much between participants. To handle
this issue, first, participants with a data loss exceeding 20 per cent were excluded from
the study. The remaining 16 participants had data loss between 3.0 and 19.1 per cent (M
= 12.8, SD =5.3).
In the current set-up, gaze direction is automatically calculated in reference to a
set of 2D planes (i.e. dashboard, windshield, etc.) in a 3D model of the car compartment.
Thus, the next step was to merge all off-road planes into one big off-road area. Next the
raw data was smoothed using the text string equivalent of an 11-frame moving average
filter, and off-road glance durations during task performance were calculated.
According to Rayner (Rayner 1998), fixation times when reading (which form a
substantial part of in-vehicle system interactions) average around 225 ms. In Land (2007),
while fixation times vary greatly between task types, the shortest fixations observed
averaged 150 ms. Since off-road glances in this study include both the saccade to and
away from the forward roadway, glance duration values less than 200 ms were judged
physiologically implausible and hence removed. Also, glances longer than 3000 ms were
removed to avoid inflating eyes-off-road glance durations due to measurement error.
Finally, 85th percentile off-road glance duration values for each participant and task
repetition were calculated.
Results The 85th percentile off-road glance duration values for each participant and task is
presented in Table 4.
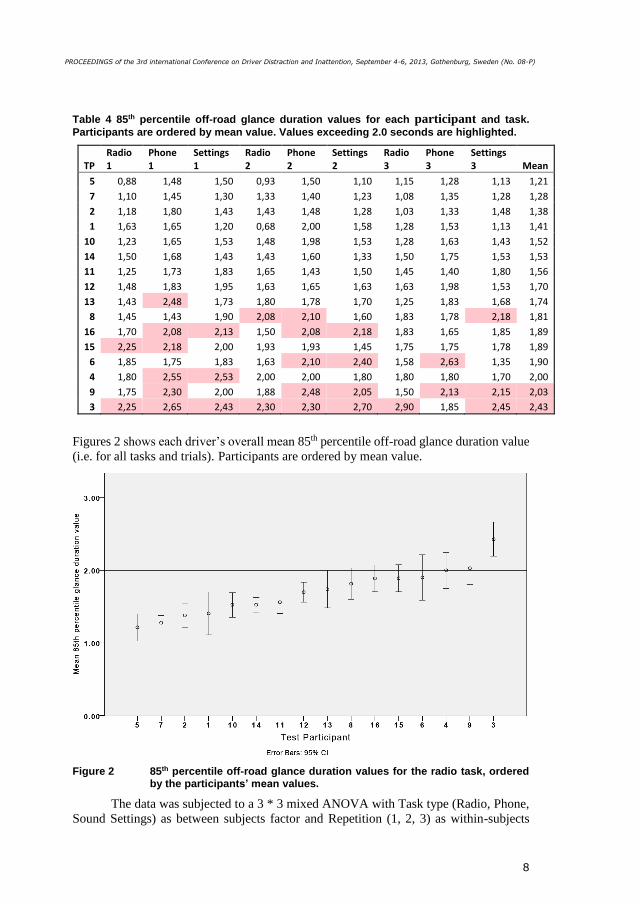
PROCEEDINGS of the 3rd international Conference on Driver Distraction and Inattention, September 4-6, 2013, Gothenburg, Sweden (No. 08-P)
8
Table 4 85th percentile off-road glance duration values for each participant and task.
Participants are ordered by mean value. Values exceeding 2.0 seconds are highlighted.
TP Radio 1
Phone 1
Settings 1
Radio 2
Phone 2
Settings 2
Radio 3
Phone 3
Settings 3 Mean
5 0,88 1,48 1,50 0,93 1,50 1,10 1,15 1,28 1,13 1,21
7 1,10 1,45 1,30 1,33 1,40 1,23 1,08 1,35 1,28 1,28
2 1,18 1,80 1,43 1,43 1,48 1,28 1,03 1,33 1,48 1,38
1 1,63 1,65 1,20 0,68 2,00 1,58 1,28 1,53 1,13 1,41
10 1,23 1,65 1,53 1,48 1,98 1,53 1,28 1,63 1,43 1,52
14 1,50 1,68 1,43 1,43 1,60 1,33 1,50 1,75 1,53 1,53
11 1,25 1,73 1,83 1,65 1,43 1,50 1,45 1,40 1,80 1,56
12 1,48 1,83 1,95 1,63 1,65 1,63 1,63 1,98 1,53 1,70
13 1,43 2,48 1,73 1,80 1,78 1,70 1,25 1,83 1,68 1,74
8 1,45 1,43 1,90 2,08 2,10 1,60 1,83 1,78 2,18 1,81
16 1,70 2,08 2,13 1,50 2,08 2,18 1,83 1,65 1,85 1,89
15 2,25 2,18 2,00 1,93 1,93 1,45 1,75 1,75 1,78 1,89
6 1,85 1,75 1,83 1,63 2,10 2,40 1,58 2,63 1,35 1,90
4 1,80 2,55 2,53 2,00 2,00 1,80 1,80 1,80 1,70 2,00
9 1,75 2,30 2,00 1,88 2,48 2,05 1,50 2,13 2,15 2,03
3 2,25 2,65 2,43 2,30 2,30 2,70 2,90 1,85 2,45 2,43
Figures 2 shows each driver’s overall mean 85th percentile off-road glance duration value
(i.e. for all tasks and trials). Participants are ordered by mean value.
Figure 2 85th percentile off-road glance duration values for the radio task, ordered by the participants’ mean values.
The data was subjected to a 3 * 3 mixed ANOVA with Task type (Radio, Phone,
Sound Settings) as between subjects factor and Repetition (1, 2, 3) as within-subjects

PROCEEDINGS of the 3rd international Conference on Driver Distraction and Inattention, September 4-6, 2013, Gothenburg, Sweden (No. 08-P)
9
factor. To test for correlation between the mean response times in each round of the trail-
making test and 85th percentile off-road glance durations, a two-tailed Pearson correlation
test was performed. The ANOVA showed no main effect of Task type or Repetition,
though the p-value for the latter was comparatively low (p = 0.088).
The pattern for repetition can be seen in Figure 3, where values for the Phone and
Settings tasks seem to decrease over repetitions, while the values for the Radio task are
more stable. In a follow up analysis where the radio task was excluded, there was indeed
a main effect of repetition (F (2,60) = 3.61, p = .033), see figure 3.
In terms of drivers’ performance on the trail-making test, there were no significant
correlations between the mean response times in either part A and B of the Trail Making
Test and the 85th percentile off-road glance durations for the three in-vehicle system
tasks.
Figure 3 Mean 85th percentile off-road glance duration for each task and occasion
Discussion
One goal of this study was to investigate the prevalence of “long glancers” among
randomly recruited test participants. In relation to the test criterion proposed by NHTSA,
the current study show that seven out of sixteen participants had 85th percentile off-road
glance duration values exceeding 2.0 seconds for one or more tasks. Moreover, the limit

PROCEEDINGS of the 3rd international Conference on Driver Distraction and Inattention, September 4-6, 2013, Gothenburg, Sweden (No. 08-P)
10
was often repeatedly exceeded by the same participant (see table 4). In Ljung Aust et al.
(2013), 1 in 6 test participants were labelled “long glancers”. The current study suggests
similar numbers, i.e. slightly more than 1 in 6.
Some failures to stay below 2.0 seconds are surely attributable to poor interaction
design in the infotainment mock-up. However, the fact that “long glancers” seem to be
quite prevalent both in road and simulator testing gives pause for thought. For example,
assume that two identical in-vehicle tasks were to be tested. If the sampling is random,
then one test group might get five “long glancers” while another group gets none. In that
case, the task being tested is likely to pass the 85th percentile criterion in one group but
fail in the other. Such an outcome would defeat the purpose of similar compliance testing.
The 85th percentile criterion thus seems to need revision to better allow for this natural
variability.
The second goal of the study was to assess whether drivers’ visual performance
capacity or limited task practice might explain this between driver variability. Here,
previous studies found correlation between drivers’ performance on the Trail Making
Test and off-road glance durations (Wikman and Summala, 2005), however, no such
effects were present in this study. An explanation for this might be that those previous
correlations were found on measures of central tendency (Wikman and Summala, 2005),
while this study focused on the longer driver glances, i.e. the 85th percentile off-road
glance duration values. This result also suggests that those longer glances might not
depend on drivers’ performance capacity for visual search speed and flexibility. Instead,
other underlying individual factors such as risk taking propensity (Donmez, Boyle and
Lee, 2010) or sensitivity to forward view uncertainty build-up (Wierwille, 1993) might
be at play.
As can be seen in figure 2, the individual differences in average 85th percentile
glance duration values are quite large, with the longest average being twice as long as the
shortest. This corroborates the findings of Ljung Aust et al. (2013), where the variation
also was small within drivers compared to between drivers.
When it comes to task repetition, the learning process seems to influence the
longer glance durations for some tasks. In this study 85th percentile glance durations
shortened with repetition of the Phone and Settings tasks. This occurred even if drivers
had practiced until they were comfortable performing the tasks prior to the trial. Hence,
task practice while driving seems more efficient than practice while standing still. This
was acknowledged in the amendment of the NHTSA guideline (NHTSA, 2013), where
pre-trial practice was extended to include also practice while driving before the actual
data collection trial.
While the values in Figure 3 keep decreasing for the Phone and Settings tasks,
they seem rather stable for the Radio task. This is an interesting result. One might
hypothesize that if test participants had been given further trials, values for Phone and
Settings would level out rather than decrease further. If and when this levelling out occurs,
and whether any difference between the tasks remain at that point, are all very interesting
topics for future studies, and again stresses the fact that compliance test outcome might
depend on how much pre-trial practice participants get.
As for the possible explanations for between driver off road glance duration
variability, individual strategy differences seem more viable than underlying performance
capacity or learning effects over repeated trials, especially given the lack of correlation

PROCEEDINGS of the 3rd international Conference on Driver Distraction and Inattention, September 4-6, 2013, Gothenburg, Sweden (No. 08-P)
11
with the Trail Making Test. Moreover, the type of task does not seem to substantially
affect this strategy. If corroborated in further studies, this is also the most troubling result.
Controlling for performance capacity or pre-trial practice seems quite feasible, but
controlling for individual strategies such as risk taking propensity seems more difficult.
Identifying and controlling for individual behavioural strategies thus seems to be a key
issue to achieve robust and precise compliance testing in the future.
Limitations
The largest limitation of this study is the loss of test participants due to poor eye-tracking
quality. However, the most likely explanation for this loss is that the eye-tracker software
has difficulties recognizing distinguishing features in some people’s faces. This means
that the data loss can be viewed as random as long as the facial features of a participant
does not correlate with his/her visual attention sharing strategy. Another limitation is the
filtering of the eye-tracker data. The current filter did make assumptions about where
participants were most likely to look while performing in-vehicle system tasks. For
example, when there were small gaps in gazes directed toward the tablet computer, it was
assumed that the participants did look at the tablet computer. To assess this risk, the eye-
tracker data was compared to drivers glance behaviour as recorded on the videos from the
tests. These comparisons indicate that the filter was set up correctly.
Conclusion
The current study looked at 85th percentile glance duration values for drivers performing
typical in-vehicle infotainment tasks. These were found to be more varied between drivers
than within drivers. Moreover, the prevalence of drivers with long off-road glance
durations suggest that tasks tested according to the proposed NHTSA manual-visual
design guidelines may fail to meet the proposed 85th percentile glance duration criterion,
simply due to normal variability in the driver population rather than poor HMI design.
This is contrary to the guideline purpose and suggests that the criterion need to be
reformulated. Furthermore, compared to underlying driver performance capacity or test
procedure artefacts, differences in individual strategies seem a more likely explanation
for the large between driver variability. Finding ways of identifying and controlling for
individual behavioural strategies during compliance testing might thus be essential to
robustness and precision in future compliance testing of multitasking drivers.
References
Bowie, C. R., Harvey, P. D. (2006). Administration and interpretation of the Trail Making
Test. Nature Protocols, 1(5), 2277-2281.
Broström, R., Bengtsson, P., & Axelsson, J. (2011). Correlation between safety
assessments in the driver–car interaction design process. Applied Ergonomics,
42(4), 575-582.
Broström, R., & Davidsson, S. (2012). Towards a model to interpret driver behaviour in
terms of mismatch between real world complexity and invested effort. Work: A
Journal of Prevention, Assessment and Rehabilitation, 41, 5068-5074.

PROCEEDINGS of the 3rd international Conference on Driver Distraction and Inattention, September 4-6, 2013, Gothenburg, Sweden (No. 08-P)
12
Crowe, S. F. (1998). The differential contribution of mental tracking, cognitive flexibility,
visual search, and motor speed to performance on Parts A and B of the Trail
Making Test. Journal of Clinical Psychology, 54(5), 585-591.
Dingus, T.A., Klauer, S.G., Neale, V. L., Petersen, A. et al. 2006. “The 100-Car
Naturalistic Driving Study, Phase II – Results of the 100-Car Field Experiment.”
Cambridge: U.S. Department of Transportation, John A. Volpe National
Transportation Systems Center.
Alliance of Automobile Manufacturers. 2006. “Statement of Principles, Criteria and
Verification Procedures on Driver-Interactions with Advanced In-Vehicle
Information and Communication Systems”, Driver Focus-Telematics Working
Group, Washington, DC., June 26, 2006 update.
Emerson, J. L., Johnson, A. M., Dawson, J. D., Uc, E. Y., Anderson, S. W., Rizzo, M.
(2012). Predictors of driving outcomes in advancing age. Psychology and Aging,
27(3), 550-559.
European Commission. 2008. “Commission Recommendation of 26 May 2008 on Safe
and Efficient In-Vehicle Information and Communication Systems; Update of the
European Statement of Principles on Human-Machine Interfaces”.
Hargrave, D. D., Nupp, J. M., Erickson, R. J. (2012). Two brief measures of executive
function in the prediction of driving ability after acquired brain injury.
Neuropsychological Rehabilitation, 22(4), 489-500.
ISO standard 15007-1:2002. “Road vehicles – Measurement of driver visual behavior
with respect to transport information and control systems Part 1: Definitions and
parameters”.
JAMA. 2004. Guideline for In-Vehicle Display Systems, Version 3.0. Japan Automobile
Manufacturers Association, Tokyo, Japan, August 2004.
Klauer, S. G., Dingus, T. A., Neale, V. L., Sudweeks, J., & Ramsey, D. J. 2006. “The
impact of driver inattention on near-crash/crash risk: An analysis using the 100-
Car Naturalistic Driving Study data.” Blacksburg, VA: Virginia Tech
Transportation Institute, 2006.
Land, M. F. “Eye movements and the control of actions in everyday life. Progress in
Retinal and Eye Research, 25(3), 296-324, 2006.
Liang, Y., Lee, J.D., Yekhshatyan, L. 2012. “How dangerous is looking away from the
road? Algorithms predict crash risk from glance patterns in naturalistic driving”.
Published online before print, Human Factors: The Journal of the Human Factors
and Ergonomics Society, June 15, 2012.
Ljung Aust, M., Dombrovskis, S., Kovaceva, J., Svanberg, B. & Ivarsson, J. (2013) “An
Empirically Based Suggestion for Reformulating the Glance Duration Criteria in
NHTSA's Visual-Manual Interaction Guidelines”, in the proceedings of SAE
2013 World Congress, 15-18 April, Detroit, USA. Paper no 2013-01-0444.
NCSA (2012) "Distracted Driving 2010." In Traffic Safety Facts - Research Note.
National Center for Statistics and Analysis of the National Traffic Highway Safety
Administration, Washington D.C.

PROCEEDINGS of the 3rd international Conference on Driver Distraction and Inattention, September 4-6, 2013, Gothenburg, Sweden (No. 08-P)
13
NHTSA (2012) Visual-Manual NHTSA Driver Distraction Guidelines for In-Vehicle
Electronic Devices, Federal Register, / Vol. 77, No. 37 / Notices / Docket No.
NHTSA–2010–0053, Department of Transportation. Available at
http://www.gpo.gov/fdsys/pkg/FR-2012-02-24/pdf/2012-4017.pdf
NHTSA. 2012. "Visual-Manual NHTSA Driver Distraction Guidelines for in-Vehicle
Electronic Devices." National Traffic Highway Safety Administration,
Department of Transportation, Washington, D.C. Federal Register, Vol. 77, No.
37, February 24, 2012. Accessed 120226 at http://www.gpo.gov/fdsys/pkg/FR-
2012-02-24/pdf/2012- 4017.pdf
Rayner, K. 1998. “Eye movements in reading and information processing: 20 years of
research”. Psychological Bulletin 124, 372–422.
Smart Eye. 2013. Smart Eye Pro 2-8 cameras. Retrieved 20130715 from http://www.
smarteye.se/productseye-trackerssimulators/smart-eye-pro-2-6-cameras.
Summala, H., Etholén, T., Leino, N., Niskakangas, M., Laine, M. & Saarinen, S. 2008.
FR-TMT: Visuospatial (working) memory in a computerized Trail-Making test.
Poster presented at the Psykologia 2008 Congress, August 20-22, Helsinki.
Victor, T. and Dozza, M. “Timing matters: Visual behavior and crash risk in the 100-Car
online data”. Presentation given at the 2nd International Conference on Driver
Distraction and Inattention, Gothenburg, Sweden, Sept 5-7, 2011. Accessed
120125 at http://www.chalmers.se/safer/ddi2011-en/
Wierwille, W. W. (1993). Visual and manual demands of in-car controls and displays. In
B. Peacock & W. Karwowski (Eds.), Automotive ergonomics (pp. 299–320).
Philadelphia, PA: Taylor & Francis.
Wikman, A. S., & Summala, H. (2005). Aging and time-sharing in highway driving.
Optometry & Vision Science, 82(8), 716-723.


Paper IV Broström, R., Bengtsson, P., & Ljung Aust, M. (2015). Individual glance strategies and their effect on the NHTSA Visual Manual Distraction test. Re-submitted to Transportation research part F: traffic psychology and behaviour, after proposal for minor revisions from reviewers.


Broström,)R.,)Bengtsson,)P.,)&)Ljung)Aust,)M.)(2015).)Individual)glance)strategies)and)their)effect)on)the)NHTSA)Visual)Manual)Distraction)test.)ReKsubmitted)to)Transportation*research*part*F:*traffic*psychology*and*behavior.)
) 1)
Individual)glance)strategies)and)their)effect)on)the)NHTSA)
Visual)Manual)Distraction)test)
)
)Authors:)Robert)Broströma,)b,)*
),)Peter)Bengtssonb,)1
,)Mikael)Ljung)Austa,)2
)
)
a
)Volvo)Car)Corporation,)SEH40531)Göteborg,)Sweden)b
)Luleå!University*of*Technology*SEH971$87$Luleå,$Sweden))
)
)

Broström,)R.,)Bengtsson,)P.,)&)Ljung)Aust,)M.)(2015).)Individual)glance)strategies)and)their)effect)on)the)NHTSA)Visual)Manual)Distraction)test.)ReKsubmitted)to)Transportation*research*part*F:*traffic*psychology*and*behavior.)
) 2)
1)Introduction)
)It)has)long)been)common)sense)to)assume)that)it)is)risky)to)look)away)from)the)forward)roadway)while)driving.)More)recently,)this)assumption)has)been)confirmed)by)several)naturalistic)driving)studies,)which)empirically) show) that) looking)away) from) the) forward) roadway) for)more) than)a)certain)period)of) time) is)a)key)crash)contributing) factor)(Dingus)et)al.)2006,)Klauer)et)al.)2006,)Victor)and)Dozza,)2011,)Liang)et)al.,)2012).)))Since)the)assumption)that)not)looking)at)the)road)while)driving)has)been)around)for)a)long)time,)there) are) many) initiatives) to) reduce) glance) times) for) inKvehicle) interfaces.) One) way) in) which)these) efforts) have) taken) shape) is) through) the) formulation) of) guidelines) for) how) to) design) inKvehicle) interfaces) that) might) compete) with) the) driver’s) attention) to) the) forward) roadway.) A)problem)with)most)of)these)is)that,)while)they)often)propose)criteria)that)interfaces)need)to)meet,)they)rarely)propose)a)method)for)testing)and)analysing)whether)the)interface)is)compliant)with)those)criteria.)For)example,) (Zwahlen,)1988))suggested)that)more)than)three)glances) inside)the)vehicle)during)a)relatively)short)period)of)time)would)become)uncomfortable)for)the)driver)but)did) not) specify) how) this) should) be) tested.) The) Alliance) of) Automobile) Manufacturers) has)suggested)two)"best)practice")performance)rules)for)visualKmanual)tasks)(AAM,)2006))consisting)of) a) twoKsecond) mean) offKroad) glance) duration) limit) and) a) maximum) of) 20) seconds) offKroad)glance) time) per) task) but) without) a) detailed) description) of) the) analysis) method.) Similarly,) the)Japan)Automobile)Manufacturers)Association)has)issued)a)guideline)which)states)that:)"operation*of*display*monitors*while*a*vehicle* is* in*motion*shall*comply*with*the* following*criteria*or*else*be*
prohibited":*1.*The*total*time*of*the*driver's*looking*at*the*screen*between*the*start*and*completion*
of* operation* task* shall* not* exceed* 8* seconds* ) (JAMA,) 2004).* In) the) same) fashion,) the) European)statement) of) principles) (EsOP,) 2008)) describes) a) number) of) design) guidelines) that) should) be)adhered)to,)but)no)performance)metrics)or)test)procedure)is)proposed.)))Recently,) the) National) Highway) Traffic) Safety) Administration) (NHTSA,) 2013)) proposed) their)visualKmanual) driver) distraction) guidelines.) These) guidelines) provide) an) interesting) departure)from)the)previous)tradition.)The)guidelines)approach)visual)distraction)in)a)twoKstep)procedure.)First,) they) list) certain) tasks) that) on) principle) should) never) be) available) to) the) driver) while)driving,)such)as)Internet)and)social)media)browsing,)because)they)are)considered)impossible)to)perform)without) repeatedly) taking) the)eyes)off) the) road) for) long)periods)of) time.)For)all) other)tasks,) however,) the) NHTSA) guidelines) specify) three) things.) First,) they) specify) a) number) of)interaction) design) principles,) all) aimed) at) making) interfaces) designed) according) to) these)principles) compliant) with) the) performance) metrics.) These) include) limiting) the) number) of)keyboard) inputs) in) a) textKrelated) task) to) six) characters,) limiting) the) number) of) characters) on)display) etc.) Second,) they) specify) three) particular) acceptance) criteria) against) which) driver)performance)on) inKvehicle) tasks) should)be)evaluated.)Third,) they)specify) test)methods) for)how)the)criteria)evaluation)should)be)carried)out.)In)addition)to)previous)guidelines,)it)also)proposes)how) the) test) data) should) be) analysed.) The) evaluation)methods) consist) of) a) driving) simulatorKbased)method) and) an) occlusionKbased)method.)As) the) former) is) recommended)over) the) latter,)this)paper)will)focus)on)the)simulatorKbased)evaluation)method.))))) )

Broström,)R.,)Bengtsson,)P.,)&)Ljung)Aust,)M.)(2015).)Individual)glance)strategies)and)their)effect)on)the)NHTSA)Visual)Manual)Distraction)test.)ReKsubmitted)to)Transportation*research*part*F:*traffic*psychology*and*behavior.)
) 3)
The)performance)criteria) that)acceptable) tasks)should) fulfil)during)simulated)driving)are)based)on)previous)guidelines)(JAMA,)2004;)AAM,)2006),)studies)on)visual)performance)for)various)radio)tuning)tasks)(Rockwell,)1988),)and)the)100Kcar)study)(Klauer,)2006),)consisting)of)the)following:)))A*testable*task*should*be*locked*out*from*performance*by*drivers*while*driving*unless*the*following*
three*criteria*are*all*met:*
a. For*at*least*21*of*the*24*test*participants1,*no*more*than*15*percent*(rounded*up*to*the*
next*whole*number2)*of*each*participant’s*total*number*of*eye*glances*away*from*the*
forward* road* scene*have*durations* of* greater* than*2.0* seconds*while* performing* the*
testable*task*one*time.*
b. For*at*least*21*of*the*24*test*participants,*the*mean*duration*of*each*participant’s*eye*
glances* away* from* the* forward* road* scene* is* less* than* or* equal* to* 2.0* seconds*while*
performing*the*testable*task*one*time.*
c. For*at* least*21*of*the*24*test*participants,* the*sum*of*the*durations*of*each*individual*
participant’s*eye*glances*away*from*the*forward*road*scene*is*less*than*or*equal*to*12.0*
seconds*while*performing*the*testable*task*one*time.*
*
These)test)criteria)are)clear)and)easy)to)apply)in)the)test)analysis)phase.)However,)in)one)aspect,)these) criteria) differ) from) how) human) subject) test) criteria) often) are) formulated.) Rather) than)studying)for)example)the)group)mean)value)and)its)associated)variability,)each)participant)is)first)assessed)individually,)and)a)frequency)count)is)then)made)to)see)if)sufficiently)many)pass.))This)aspect)is)cause)for)concern.)It)is)well)known)that)human)behaviour)is)inherently)varied)and)adaptive,) both) in) normal) life) and) in) test) situations.) It) can) change) depending) on) the) test)participant’s)goals,)needs,)and)motivation)(Näätänen)&)Summala,)1976).)One)example)of)this) in)the) domain) of) inKvehicle) interface) evaluation) is) where) test) participants) compensate) for) new)demands)by)changing)strategy)when)solving) inKvehicle) tasks) (Hockey,)1997).) In) fact,) strategies)can) even) be) significantly) different) among) participants)within) one) test) sample) (Donmez,) Boyle)and)Lee,)2010).)))Since)the)performance)criteria) in) the)NHTSA)test)are)assessed)on)an) individual) level,) there) is)a)clear) risk) that) behavioural) variability) among) test) participants) could) affect) test) outcome.) In)principle,) two)randomly)recruited)groups)could)well)have)different) test)outcomes)when)testing)the) same) inKvehicle) interface,) if) participants) in) one) group) happened) to) employ) one) glance)strategy)and)participants) in) the)other)group)another.) )There) is) thus)a)clear)need) to) investigate)this) issue) further,) to) understand) whether) the) proposed) way) to) calculate) performance) in) the)NHTSA)guidelines)is)compatible)with)normal)human)behavioural)variability.)))
1.1)Purpose)
The)purpose)of)this)study)was)to)investigate)how)individual)differences)could)impact)the)NHTSA)visual)manual)distraction)test.))
)
1)This)translates)to)a)threshold)of)>87.5%)for)small)samples.))2)One) glance) can)be) longer) than) two) seconds) if) the)number)of) glances) is)more) than)one) and) less) than) seven,) and) two)glances)can)be)longer)than)two)seconds)if)the)number)of)glances)is)more)than)six)and)less)than)14)(NHTSA,)2014).))
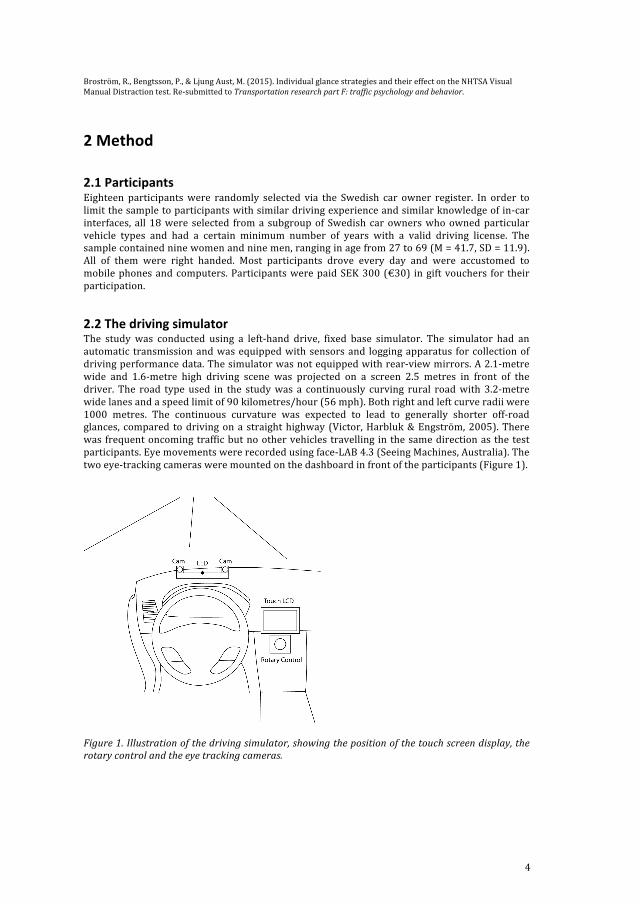
Broström,)R.,)Bengtsson,)P.,)&)Ljung)Aust,)M.)(2015).)Individual)glance)strategies)and)their)effect)on)the)NHTSA)Visual)Manual)Distraction)test.)ReKsubmitted)to)Transportation*research*part*F:*traffic*psychology*and*behavior.)
) 4)
2)Method)
)
2.1)Participants)
Eighteen) participants)were) randomly) selected) via) the) Swedish) car) owner) register.) In) order) to)limit)the)sample)to)participants)with)similar)driving)experience)and)similar)knowledge)of)inKcar)interfaces,) all)18)were) selected) from)a) subgroup)of) Swedish) car)owners)who)owned)particular)vehicle) types) and) had) a) certain) minimum) number) of) years) with) a) valid) driving) license.) The)sample)contained)nine)women)and)nine)men,)ranging)in)age)from)27)to)69)(M)=)41.7,)SD)=)11.9).)All) of) them) were) right) handed.) Most) participants) drove) every) day) and) were) accustomed) to)mobile)phones)and)computers.)Participants)were)paid)SEK)300)(€30)) in)gift)vouchers) for) their)participation.))
2.2)The)driving)simulator)
The) study) was) conducted) using) a) leftKhand) drive,) fixed) base) simulator.) The) simulator) had) an)automatic) transmission)and)was)equipped)with)sensors)and) logging)apparatus) for)collection)of)driving)performance)data.)The)simulator)was)not)equipped)with)rearKview)mirrors.)A)2.1Kmetre)wide) and) 1.6Kmetre) high) driving) scene) was) projected) on) a) screen) 2.5) metres) in) front) of) the)driver.) The) road) type) used) in) the) study)was) a) continuously) curving) rural) road)with) 3.2Kmetre)wide)lanes)and)a)speed)limit)of)90)kilometres/hour)(56)mph).)Both)right)and)left)curve)radii)were)1000) metres.) The) continuous) curvature) was) expected) to) lead) to) generally) shorter) offKroad)glances,) compared) to)driving)on)a)straight)highway)(Victor,)Harbluk)&)Engström,)2005).)There)was) frequent)oncoming)traffic)but)no)other)vehicles) travelling) in)the)same)direction)as)the)test)participants.)Eye)movements)were)recorded)using)faceKLAB)4.3)(Seeing)Machines,)Australia).)The)two)eyeKtracking)cameras)were)mounted)on)the)dashboard)in)front)of)the)participants)(Figure)1).))))
))Figure*1.*Illustration*of*the*driving*simulator,*showing*the*position*of*the*touch*screen*display,*the*
rotary*control*and*the*eye*tracking*cameras.*
*
*
)
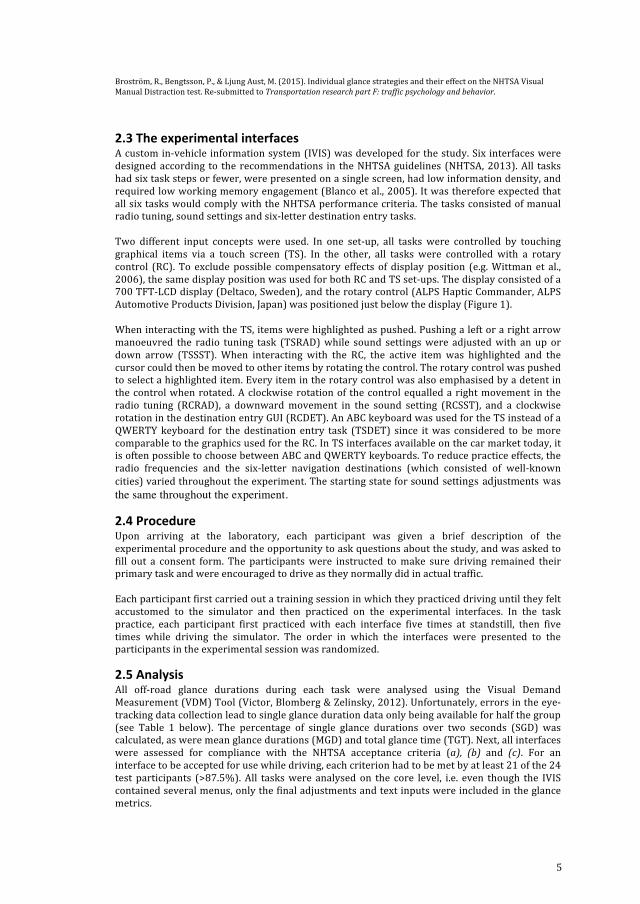
Broström,)R.,)Bengtsson,)P.,)&)Ljung)Aust,)M.)(2015).)Individual)glance)strategies)and)their)effect)on)the)NHTSA)Visual)Manual)Distraction)test.)ReKsubmitted)to)Transportation*research*part*F:*traffic*psychology*and*behavior.)
) 5)
2.3)The)experimental)interfaces)
A)custom)inKvehicle)information)system)(IVIS))was)developed)for)the)study.)Six)interfaces)were)designed)according) to) the)recommendations) in) the)NHTSA)guidelines) (NHTSA,)2013).)All) tasks)had)six)task)steps)or)fewer,)were)presented)on)a)single)screen,)had)low)information)density,)and)required)low)working)memory)engagement)(Blanco)et)al.,)2005).)It)was)therefore)expected)that)all)six)tasks)would)comply)with)the)NHTSA)performance)criteria.)The)tasks)consisted)of)manual)radio)tuning,)sound)settings)and)sixKletter)destination)entry)tasks.)))Two) different) input) concepts) were) used.) In) one) setKup,) all) tasks) were) controlled) by) touching)graphical) items) via) a) touch) screen) (TS).) In) the) other,) all) tasks) were) controlled) with) a) rotary)control) (RC).) To) exclude)possible) compensatory) effects) of) display)position) (e.g.)Wittman) et) al.,)2006),)the)same)display)position)was)used)for)both)RC)and)TS)setKups.)The)display)consisted)of)a)700)TFTKLCD)display)(Deltaco,)Sweden),)and)the)rotary)control)(ALPS)Haptic)Commander,)ALPS)Automotive)Products)Division,)Japan))was)positioned)just)below)the)display)(Figure)1).)))When)interacting)with)the)TS,)items)were)highlighted)as)pushed.)Pushing)a)left)or)a)right)arrow)manoeuvred) the) radio) tuning) task) (TSRAD))while) sound) settings)were) adjusted)with) an) up) or)down) arrow) (TSSST).) When) interacting) with) the) RC,) the) active) item) was) highlighted) and) the)cursor)could)then)be)moved)to)other)items)by)rotating)the)control.)The)rotary)control)was)pushed)to)select)a)highlighted)item.)Every)item)in)the)rotary)control)was)also)emphasised)by)a)detent)in)the)control)when)rotated.)A)clockwise)rotation)of) the)control)equalled)a)right)movement) in) the)radio) tuning) (RCRAD),) a) downward)movement) in) the) sound) setting) (RCSST),) and) a) clockwise)rotation)in)the)destination)entry)GUI)(RCDET).)An)ABC)keyboard)was)used)for)the)TS)instead)of)a)QWERTY)keyboard) for) the)destination) entry) task) (TSDET)) since) it)was) considered) to) be)more)comparable)to)the)graphics)used)for)the)RC.)In)TS)interfaces)available)on)the)car)market)today,)it)is)often)possible)to)choose)between)ABC)and)QWERTY)keyboards.)To)reduce)practice)effects,)the)radio) frequencies) and) the) sixKletter) navigation) destinations) (which) consisted) of) wellKknown)cities))varied)throughout)the)experiment.)The)starting)state)for)sound settings adjustments was the same throughout the experiment.)
2.4)Procedure)
Upon) arriving) at) the) laboratory,) each) participant) was) given) a) brief) description) of) the)experimental)procedure)and)the)opportunity)to)ask)questions)about)the)study,)and)was)asked)to)fill) out) a) consent) form.) The) participants)were) instructed) to)make) sure) driving) remained) their)primary)task)and)were)encouraged)to)drive)as)they)normally)did)in)actual)traffic.)))Each)participant)first)carried)out)a)training)session)in)which)they)practiced)driving)until)they)felt)accustomed) to) the) simulator) and) then) practiced) on) the) experimental) interfaces.) In) the) task)practice,) each) participant) first) practiced) with) each) interface) five) times) at) standstill,) then) five)times) while) driving) the) simulator.) The) order) in) which) the) interfaces) were) presented) to) the)participants)in)the)experimental)session)was)randomized.))
2.5)Analysis)
All) offKroad) glance) durations) during) each) task) were) analysed) using) the) Visual) Demand)Measurement)(VDM))Tool)(Victor,)Blomberg)&)Zelinsky,)2012).)Unfortunately,)errors)in)the)eyeKtracking)data)collection)lead)to)single)glance)duration)data)only)being)available)for)half)the)group)(see) Table) 1) below).) The) percentage) of) single) glance) durations) over) two) seconds) (SGD)) was)calculated,)as)were)mean)glance)durations)(MGD))and)total)glance)time)(TGT).)Next,)all)interfaces)were) assessed) for) compliance) with) the) NHTSA) acceptance) criteria) (a),* (b)* and* (c).) For) an)interface)to)be)accepted)for)use)while)driving,)each)criterion)had)to)be)met)by)at)least)21)of)the)24)test) participants) (>87.5%).)All) tasks)were) analysed)on) the) core) level,) i.e.) even) though) the) IVIS)contained)several)menus,)only)the)final)adjustments)and)text)inputs)were)included)in)the)glance)metrics.)
)

Broström,)R.,)Bengtsson,)P.,)&)Ljung)Aust,)M.)(2015).)Individual)glance)strategies)and)their)effect)on)the)NHTSA)Visual)Manual)Distraction)test.)ReKsubmitted)to)Transportation*research*part*F:*traffic*psychology*and*behavior.)
) 6)
3)Results)&)Discussion)
)The)purpose)of)this)study)was)to)investigate)how)individual)differences)could)impact)the)NHTSA)visual)manual)distraction)test)(NHTSA,)2013).)))Table* 1.* Results* of* NHTSA* test* criteria* for* the* tested* interfaces.* Test* participant* IDs* are* ordered* by* the* total* number* of*
glances.*Red/italicised*font*shows*a*nonRcompliant*value.*Shaded*cells*show*statistical*outliers,*cells*that*contain*one*or*two*
asterisks*have*been*subject*to*the*“rounded*up*rule”*that*allows*one**glance*to*be*longer*than*two*s*if*the*number*of*glances*
is*more*than*one*and*less*than*seven*(*),*two**glances*to*be*longer*than*two*s*if*the*number*of*glances*is*more*than*six**and*
less* than*14* (**).* For* each* interface,*87.5*percent*of* the* test*participants*have* to*meet* every* criterion* to* comply.*For* the*
single*glance*duration* criterion* (SGD),* this*means* fewer* than*15*percent*of* the*glances* longer* than* two* seconds,*and* for*
MGD*less*than*two*seconds*means*glance*duration,*and*for*TGT*less*than*12*seconds*of*total*glance*time.**
)
))For)a)participant)to)meet)the)acceptance)criterion)(a))above,)no)more)than)15)percent)of)his/her)eye)glances)away)from)the)forward)road)scene)could)exceed)2.0)seconds)while)performing)a)task.)In)Table)1,)it)can)be)seen)that,)for)two)interfaces,)TSSST)and)TSDET,)some)participants)exceeded)this) limit.)However,) according) to) the) rounding) up) rule) (NHTSA,) 2014),) one) glance) longer) than)two)seconds)is)acceptable)if)the)total)number)of)glances)is)more)than)one)but)less)than)seven,)and)two)are)acceptable)if)the)total)number)of)glances)is)between)seven)and)14.)When)this)flexibility)is)taken)into)account,)all)participants)who)exceeded)the)limit)in)absolute)numbers)still)passed)the)criteria.)Hence,)no)interface)failed)on)acceptance)criterion)(a).)To)meet)acceptance)criterion)(b),)participants) needed) to) have) mean) glance) durations) (MGD)) of) less) than) 2.0) seconds) per) task.)Nearly) all) test) participants) fulfilled) this,) and) thus) all) interfaces) were) compliant.) To) meet)acceptance) criterion) (c),) test) participants) needed) to) have) less) than)12.0) seconds) total) offKroad)glance) time) per) task.) In) total,) four) interfaces—TSRAD,) TSSST,) RCDET) and) TSDET—failed) to)comply)with) this)criterion,)since) fewer) than)87.5%)of)participants)were)below)the)12.0Ksecond)limit.) For) the)other) two) interfaces) (RCRAD)and)RCSST),)more) than)87.5%)of)participants)were)below)the)limit,)so)these)interfaces)were)compliant)with)acceptance)criterion)(c).))To)fully)comply)with)NHTSA’s)performance)test,)all)three)acceptance)criteria)have)to)be)met)for)each)interface.)In)this)regard,)interfaces)TSRAD,)TSSST,)RCDET)and)TSDET)failed)to)comply)on)the)overall) level,)while) interfaces)RCRAD)and)RCSST)complied.)Hence,)the)results)showed)that)only)two)out)of)six)interfaces)were)fully)compliant)(see)Table)2).))Table* 2.* Compliance* test* results.* An* interface* needs* more* than* 87.5%* participants* to* fulfil* all* three* criteria* for* full*
compliance.**
*
) Interface) ) ) ) ) )Criterion) RCRAD) TSRAD) RCSST) TSSST) RCDET) TSDET)SGD*(%)* 100) 89) 100) 89) 89) 89)MGD*(%)* 100) 94) 94) 100) 100) 94)TGT*(%)* 100) 83) 94) 78) 33) 83)Compliance) OK) NOK) OK) NOK) NOK) NOK)
*
)

Broström,)R.,)Bengtsson,)P.,)&)Ljung)Aust,)M.)(2015).)Individual)glance)strategies)and)their)effect)on)the)NHTSA)Visual)Manual)Distraction)test.)ReKsubmitted)to)Transportation*research*part*F:*traffic*psychology*and*behavior.)
) 7)
3.1)Individual)glance)behaviour)
The)current)set)of)tasks)was)designed)according)to)the)NHTSA)recommended)interaction)design)principles.) They) all) had) six) task) steps) or) fewer,) were) presented) on) a) single) screen,) had) low)information)density,)and)required) low)working)memory)engagement.)Yet,)only) two)of) six)were)fully) compliant.)The)question) that) follows)given) the) result) is) of) course)why) so)many) failed.)To)gain)a)more)thorough)understanding)of)this)issue,)it)is)important)to)recognize)that)the)guidelines)specify) that) any) test) group) used) to) test) criteria) compliance) should) consist) of) 24) randomly)sampled)drivers,) stratified) in) five) age) groups.)The)key)word)here) is) random.) In) this) context,) it)means) that) the)evaluation)procedure)rests)on) the)underlying)assumption) that,)when)testing)an)inKvehicle) task,) any) random) group) of) 24) eligible) drivers) should) come) to) the) same) conclusion)about)whether)a)particular)task)ought)to)be)allowed)while)driving.)))This)random)selection)approach)carries)with)it)a)particular)property.)If)one)assumes)that)a)test)result)will)be) the)same)regardless)of) the)group)of) test)participants,)one)also) implicitly)assumes)that) the)performance)metrics)used) in) the) test)will)not)be)affected)by)any)variability) that)might)exist) in) the)sampled)population.)Thus,) the)authors)of) the)NHTSA)guidelines)seem)not) to)expect)any) type)of) betweenKdriver)behavioural) variability) for) offKroad) glances) that) could) compromise)performance)testing.)))When) looking) at) previous) studies,) however,) evidence) of) such) behavioural) variability) is) quite)common.)For)example,)according)to)Wierwille)(1993),)drivers)normally)prefer)not)to)glance)away)from)the)road)for)more)than)about)one)second)when)doing)inKvehicle)tasks,)but)can)glance)away)for)up)to)1.6)seconds)if)they)really)have)to.)Donmez,)Boyle)and)Lee)(2010))found)that)there)are)individual)variations)of)where)this)upper)limit)lies,)and,)more)importantly,)variation)in)the)upper)limit)varies)depending)on)drivers’)risk*taking*strategies)when)solving)inKvehicle)tasks.)Donmez)et)al.’s) study) identified) three) behaviourally) based) strata,) where) participants) with) mean) glance)durations)longer)than)1.2)seconds)were)deemed)to)have)a)highKrisk)strategy,)while)those)below)1.2)seconds)were)considered)to)have)a)moderate)or)a)lowKrisk)strategy.)))To)put)these)numbers)into)context,) it)has)been)well)established)that)vision)is)a)crucial)resource)for)many) tasks,)which) is)why)people)often)use)vision)as)efficiently)as)possible) to) support)each)action) (Land,) 2006).) In) the) driving) context,) lateral) control) of) a) car) on) curvy) roads) requires)continuous)glances)towards)cues)in)the)roadway)at)an)average)of)0.8)seconds,)a)time)between)eye)movements)and)actions)that) is)equivalent)to)many)other)tasks)for)which)vision)controls)action,)for) example) reading,)walking)or)preparing)a)pot)of) tea) (Land,)2006).)Hence,) if) drivers)were) to)limit) their) offKroad) glance) durations) to) about) 0.8) seconds) when) solving) inKvehicle) tasks,) they)could) be) considered) to) be) using) an) efficient) glance) strategy,) while) longer) durations) would)indicate)strategies)that)are)not)intended)to)be)optimally)effective.))Other)simulator)and)onKroad)studies)of)drivers)interacting)with)inKvehicle)tasks)have)also)found)taskKindependent,)offKroad)glance)duration)variation)among)test)participants.)For)example,)Aust)et)al.)(2013))found)that)one)of)every)five)participants)in)their)study)had)more)than)15)percent)offKroad) glance) durations) over) two) seconds,) independent) of) the) task) being) performed.) Similarly,)(Broström)et)al.,)2013))showed) in)a) simulator) study) that)about)oneKfifth)of) the)participants)on)average)had)more) than)15)percent) glances) longer) than) two) seconds) for) the) tested) tasks.) They)also) found) that) these) individual) variations) in) offKroad) glance) durations) did) not) correlate)with)variations) in) capacity.) Rather,) they)were) attributable) to) different) glance) strategies) among) the)participants)(Broström)et)al.,)2013).)In)a)similar)manner,)a)study)that)assessed)various)types)of)IVIS)tasks)found)that)the)variation)in)the)number)of)glances)ranged)from)one)to)three)glances)per)task)step,)independent)of)the)type)of)task)and)the)total)number)of)task)steps)(Blanco)et)al.,)2005).)))These) studies) of) behavioural) variability) related) to) inKvehicle) glances) open) the) door) to) an)interesting)approach)to)further)understanding)the)present)results.)If)participants)have)different)task) solving) strategies) that) are) reflected) in) their) offKroad) glance) duration) values,) the)NHTSA’s)assumption)above,)i.e.)that)the)sampled)group)will)not)contain)any)variability)that)can)influence)

Broström,)R.,)Bengtsson,)P.,)&)Ljung)Aust,)M.)(2015).)Individual)glance)strategies)and)their)effect)on)the)NHTSA)Visual)Manual)Distraction)test.)ReKsubmitted)to)Transportation*research*part*F:*traffic*psychology*and*behavior.)
) 8)
results,)becomes)questionable.)Put)differently,)one)explanation)for)the)interface)failures)above)is)that)there)is)a)mismatch)between)expected)and)actual)population)variability.)))To) analyse)whether) any) glance) strategies)were) present) among) the) participants) in) the) current)study,) the) glance) metrics) for) each) participant) were) averaged) across) all) of) the) six) interfaces)assessed)(Table)3).)))*Table* 3.* Glance* data* on* a* test* participant* level.*Metrics* are* calculated* as* average* values* for* all* six* interfaces* on* a* perR
participant*basis.*Participants*are*sorted*on*an*ascending*scale*of* the*number*of*glances.*The*mean*number*of* task*steps*
used*to*calculate*the*NGTS*column*is*four**((7+4+1)/3).*
*
*
TP)Total)no.)of)glances)
SGD)(%)) MGD)(s)) NGTS)(n)) TGT)(s))
1) 27) 0) 0.6) 1.1) 2.5)2) 27) K) 0.5) 1.1) 2.3)3) 30) 20) 2.0) 1.3) 9.7)4) 42) K) 0.76) 1.8) 5.2)5) 42) 2) 0.9) 1.8) 6.2)6) 44) 6) 1.0) 1.8) 7.7)7) 44) 20) 1.3) 1.8) 10.4)8) 48) 2) 1.0) 2.0) 7.0)9) 50) 0) 0.9) 2.1) 8.1)10) 53) K) 0.7) 2.2) 6.0)11) 54) K) 0.7) 2.3) 7.8)12) 54) K) 0.7) 2.3) 6.2)13) 54) K) 1.0) 2.3) 9.2)14) 61) K) 0.8) 2.5) 7.7)15) 65) K) 0.6) 2.7) 6.9)16) 68) 1) 1.0) 2.8) 10.9)17) 81) K) 0.5) 3.4) 6.7)18) 139) 1) 0.9) 5.8) 20.6)
*
))When)the)data)in)Table)3)are)compared)to)the)results)of)the)studies)cited)above,)certain)patterns)emerge.)))Similar)to)the)results)in)Broström)et)al.)(2013))and)Aust)et)al.)(2013),)most)participants)preferred)short)glances)to)the)IVIS)display,)while)a)few)drivers)repeatedly)dwelled)on)the)display)for)longer)than)two)seconds)at)a)time.)To)size)up)the)variability)magnitude,)it)can)be)noted)that)TP1)had)no)glances)above)two)seconds)towards)the)display,)while)TP3)and)TP7)had)more)than)15%)glances)longer)than)two)seconds)to)the)display.)These)latter)two,)with)many)glances)above)two)seconds,)correspond)well)to)those)classified)as)showing)long)glancing)behaviour)in)Broström)et)al.)(2013))and)Aust)et)al.)(2013).)))There)were) also) different) patterns)with) regard) to)mean) glance) duration.) TP1) and) TP2) had) an)MGD)of)0.6)and)0.5,)respectively.)This)is)well)below)what)was)proposed)by)Land)(2006),)i.e.)that)driving)has)to)be)supported)by)continuous)glances)towards)cues)in)the)roadway)with)an)average)of)0.8)seconds.)Participants)TP3)and)TP7,)on)the)other)hand,)had)MGDs)longer)than)1.2)seconds)and,)as)a)consequence,)would)belong)to)a)riskKtaking)category)according)to)Donmez)et)al.)(2010).)Furthermore,) TP3) had) an) MGD) longer) than) 1.6) seconds,) the) normal) upper) limit) proposed) by)Wierwille)(1993).)Summing)up)these)results,)it)can)be)concluded)that)long*glancers)and)highRrisk*glancers)are)actually)the)same)test)participants)(TP3)and)TP7).))There)were)also)interesting)variations)regarding)the)number)of)glances)per)task)step)(NGTS).)On)average,) participants) in) simulator) studies) use) between) one) and) three) glances) per) task) step)(Blanco)et)al.,)2005).)In)the)present)study,)TP1,)2)and)3)had)the)fewest)number)of)glances)and)a)mean)NGTS)near)one,)which) is) close) to) the) lower) level) in)Blanco)et) al.)At) the)other) end)of) the)spectrum,)TP17)and)TP18)had)more)than)three)NGTS)in)the)tasks,)which)is)above)the)upper)level)defined)by)Blanco)et)al.)(2005).)))It) is) also) interesting) to) note) that) the) variation) between) individuals) seems) to) be) based) on)
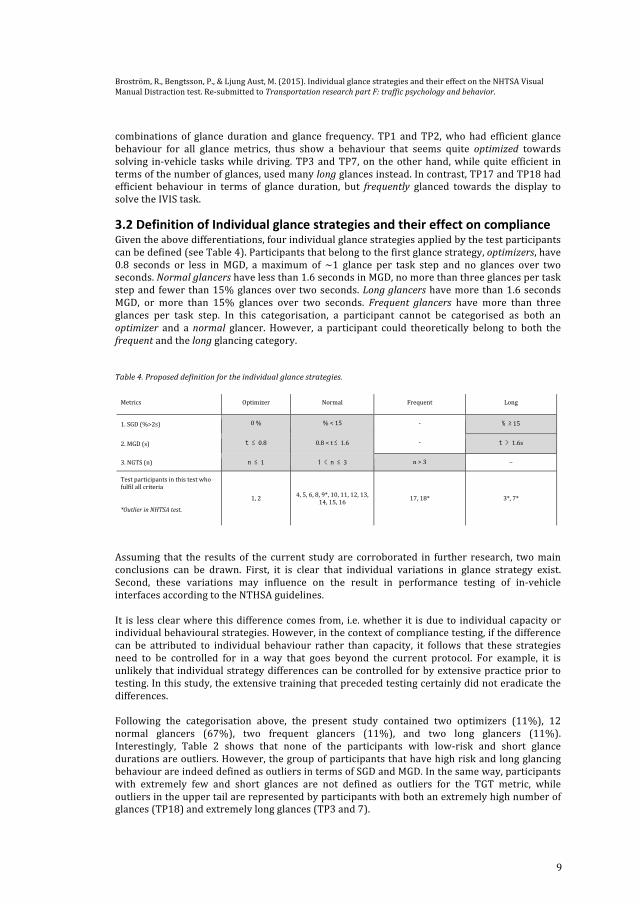
Broström,)R.,)Bengtsson,)P.,)&)Ljung)Aust,)M.)(2015).)Individual)glance)strategies)and)their)effect)on)the)NHTSA)Visual)Manual)Distraction)test.)ReKsubmitted)to)Transportation*research*part*F:*traffic*psychology*and*behavior.)
) 9)
combinations) of) glance) duration) and) glance) frequency.) TP1) and)TP2,)who) had) efficient) glance)behaviour) for) all) glance) metrics,) thus) show) a) behaviour) that) seems) quite) optimized) towards)solving) inKvehicle) tasks)while)driving.)TP3)and)TP7,) on) the)other)hand,)while)quite) efficient) in)terms)of)the)number)of)glances,)used)many)long)glances)instead.)In)contrast,)TP17)and)TP18)had)efficient) behaviour) in) terms) of) glance) duration,) but) frequently) glanced) towards) the) display) to)solve)the)IVIS)task.)
3.2)Definition)of)Individual)glance)strategies)and)their)effect)on)compliance)
Given)the)above)differentiations,)four)individual)glance)strategies)applied)by)the)test)participants)can)be)defined)(see)Table)4).)Participants)that)belong)to)the)first)glance)strategy,)optimizers,)have)0.8) seconds) or) less) in) MGD,) a) maximum) of) ~1) glance) per) task) step) and) no) glances) over) two)seconds.)Normal*glancers)have)less)than)1.6)seconds)in)MGD,)no)more)than)three)glances)per)task)step)and) fewer)than)15%)glances)over)two)seconds.)Long*glancers)have)more)than)1.6)seconds)MGD,) or) more) than) 15%) glances) over) two) seconds.) Frequent* glancers) have) more) than) three)glances) per) task) step.) In) this) categorisation,) a) participant) cannot) be) categorised) as) both) an)optimizer) and) a)normal) glancer.) However,) a) participant) could) theoretically) belong) to) both) the)frequent)and)the)long)glancing)category.)))Table*4.*Proposed*definition*for*the*individual*glance*strategies.*
)Metrics) Optimizer) Normal) Frequent) Long)
1.)SGD)(%>2s)) 0)%) %)<)15) K) ��)15)
2.)MGD)(s)) ���0.8) 0.8)<)t)�1.6) K) ����1.6s)
3.)NGTS)(n)) ���1) �������3) n)>)3) �)
Test)participants)in)this)test)who)fulfil)all)criteria)))*Outlier*in*NHTSA*test.*
)
1,)2) 4,)5,)6,)8,)9*,)10,)11,)12,)13,)14,)15,)16)
17,)18*) 3*,)7*)
))Assuming) that) the) results) of) the) current) study) are) corroborated) in) further) research,) two)main)conclusions) can) be) drawn.) First,) it) is) clear) that) individual) variations) in) glance) strategy) exist.)Second,) these) variations) may) influence) on) the) result) in) performance) testing) of) inKvehicle)interfaces)according)to)the)NTHSA)guidelines.)))It) is) less)clear)where) this)difference)comes) from,) i.e.)whether) it) is)due)to) individual)capacity)or)individual)behavioural)strategies.)However,)in)the)context)of)compliance)testing,)if)the)difference)can) be) attributed) to) individual) behaviour) rather) than) capacity,) it) follows) that) these) strategies)need) to) be) controlled) for) in) a) way) that) goes) beyond) the) current) protocol.) For) example,) it) is)unlikely)that) individual)strategy)differences)can)be)controlled)for)by)extensive)practice)prior)to)testing.)In)this)study,)the)extensive)training)that)preceded)testing)certainly)did)not)eradicate)the)differences.)))Following) the) categorisation) above,) the) present) study) contained) two) optimizers) (11%),) 12)normal) glancers) (67%),) two) frequent) glancers) (11%),) and) two) long) glancers) (11%).)Interestingly,) Table) 2) shows) that) none) of) the) participants) with) lowKrisk) and) short) glance)durations)are)outliers.)However,)the)group)of)participants)that)have)high)risk)and)long)glancing)behaviour)are)indeed)defined)as)outliers)in)terms)of)SGD)and)MGD.)In)the)same)way,)participants)with) extremely) few) and) short) glances) are) not) defined) as) outliers) for) the) TGT) metric,) while)outliers)in)the)upper)tail)are)represented)by)participants)with)both)an)extremely)high)number)of)glances)(TP18))and)extremely)long)glances)(TP3)and)7).)))
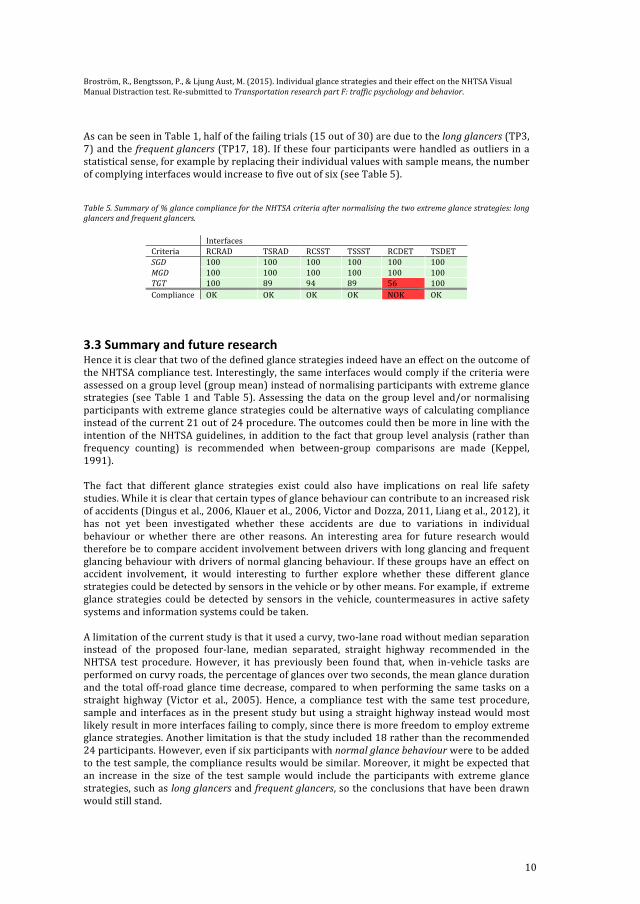
Broström,)R.,)Bengtsson,)P.,)&)Ljung)Aust,)M.)(2015).)Individual)glance)strategies)and)their)effect)on)the)NHTSA)Visual)Manual)Distraction)test.)ReKsubmitted)to)Transportation*research*part*F:*traffic*psychology*and*behavior.)
) 10)
As)can)be)seen)in)Table)1,)half)of)the)failing)trials)(15)out)of)30))are)due)to)the)long*glancers)(TP3,)7))and)the) frequent*glancers) (TP17,)18).) If) these)four)participants)were)handled)as)outliers) in)a)statistical)sense,)for)example)by)replacing)their)individual)values)with)sample)means,)the)number)of)complying)interfaces)would)increase)to)five)out)of)six)(see)Table)5).)))*
Table*5.*Summary*of*%*glance*compliance*for*the*NHTSA*criteria*after*normalising*the*two*extreme*glance*strategies:*long*
glancers*and*frequent*glancers.**
*) Interfaces) ) ) ) ) )Criteria) RCRAD) TSRAD) RCSST) TSSST) RCDET) TSDET)SGD* 100) 100) 100) 100) 100) 100)MGD* 100) 100) 100) 100) 100) 100)TGT* 100) 89) 94) 89) 56) 100)Compliance) OK) OK) OK) OK) NOK) OK)
))
3.3)Summary)and)future)research)
Hence)it)is)clear)that)two)of)the)defined)glance)strategies)indeed)have)an)effect)on)the)outcome)of)the)NHTSA)compliance)test.)Interestingly,)the)same)interfaces)would)comply)if)the)criteria)were)assessed)on)a)group)level)(group)mean))instead)of)normalising)participants)with)extreme)glance)strategies) (see)Table)1)and)Table)5).)Assessing) the)data)on) the)group) level)and/or)normalising)participants)with)extreme)glance)strategies)could)be)alternative)ways)of)calculating)compliance)instead)of)the)current)21)out)of)24)procedure.)The)outcomes)could)then)be)more)in)line)with)the)intention)of) the)NHTSA)guidelines,) in)addition)to)the) fact) that)group) level)analysis)(rather)than)frequency) counting)) is) recommended) when) betweenKgroup) comparisons) are) made) (Keppel,)1991).))The) fact) that) different) glance) strategies) exist) could) also) have) implications) on) real) life) safety)studies.)While)it)is)clear)that)certain)types)of)glance)behaviour)can)contribute)to)an)increased)risk)of)accidents)(Dingus)et)al.,)2006,)Klauer)et)al.,)2006,)Victor)and)Dozza,)2011,)Liang)et)al.,)2012),)it)has) not) yet) been) investigated) whether) these) accidents) are) due) to) variations) in) individual)behaviour) or) whether) there) are) other) reasons.) An) interesting) area) for) future) research) would)therefore)be)to)compare)accident)involvement)between)drivers)with)long)glancing)and)frequent)glancing)behaviour)with)drivers)of)normal)glancing)behaviour.)If)these)groups)have)an)effect)on)accident) involvement,) it) would) interesting) to) further) explore) whether) these) different) glance)strategies)could)be)detected)by)sensors)in)the)vehicle)or)by)other)means.)For)example,)if))extreme)glance) strategies) could)be)detected)by) sensors) in) the)vehicle,) countermeasures) in)active) safety)systems)and)information)systems)could)be)taken.))A)limitation)of)the)current)study)is)that)it)used)a)curvy,)twoKlane)road)without)median)separation)instead) of) the) proposed) fourKlane,) median) separated,) straight) highway) recommended) in) the)NHTSA) test) procedure.) However,) it) has) previously) been) found) that,) when) inKvehicle) tasks) are)performed)on)curvy)roads,)the)percentage)of)glances)over)two)seconds,)the)mean)glance)duration)and)the)total)offKroad)glance)time)decrease,)compared)to)when)performing)the)same)tasks)on)a)straight) highway) (Victor) et) al.,) 2005).) Hence,) a) compliance) test)with) the) same) test) procedure,)sample)and)interfaces)as) in)the)present)study)but)using)a)straight)highway)instead)would)most)likely)result)in)more)interfaces)failing)to)comply,)since)there)is)more)freedom)to)employ)extreme)glance)strategies.)Another)limitation)is)that)the)study)included)18)rather)than)the)recommended)24)participants.)However,)even)if)six)participants)with)normal*glance*behaviour)were)to)be)added)to)the)test)sample,)the)compliance)results)would)be)similar.)Moreover,)it)might)be)expected)that)an) increase) in) the) size) of) the) test) sample)would) include) the) participants)with) extreme) glance)strategies,)such)as)long*glancers)and)frequent*glancers,)so)the)conclusions)that)have)been)drawn)would)still)stand.)

Broström,)R.,)Bengtsson,)P.,)&)Ljung)Aust,)M.)(2015).)Individual)glance)strategies)and)their)effect)on)the)NHTSA)Visual)Manual)Distraction)test.)ReKsubmitted)to)Transportation*research*part*F:*traffic*psychology*and*behavior.)
) 11)
Acknowledgements)
The study was carried out within the research project SICS and was financed by the FFI research foundation. )

Broström,)R.,)Bengtsson,)P.,)&)Ljung)Aust,)M.)(2015).)Individual)glance)strategies)and)their)effect)on)the)NHTSA)Visual)Manual)Distraction)test.)ReKsubmitted)to)Transportation*research*part*F:*traffic*psychology*and*behavior.)
) 12)
References)
)Alliance)of)Automobile)Manufacturers.)2006.)“Statement)of)Principles,)Criteria)and)Verification)Procedures)on)DriverKInteractions)with)Advanced)InKVehicle)Information)and)Communication)Systems”,)Driver)FocusKTelematics)Working)Group,)Washington,)DC.,)June)26,)2006)update.)))Aust,)M.)L.,)Dombrovskis,)S.,)Kovaceva,)J.,)&)Svanberg,)B.)(2013).)An*empirically*based*suggestion*for*reformulating*the*glance*duration*criteria*in*NHTSA's*visualRmanual*interaction*guidelines)(No.)2013K01K0444).)SAE)Technical)Paper.))Aust,)M.)L.,)Rydström,)A.,)Broström,)R.,)&)Victor,)T.)(2015).)Reliability)Improvement)Needed)in)the)Eye) Glance) Measurement) Using) Driving) Simulator) Test.) In) 24th) International) Technical)Conference)on)the)Enhanced)Safety)of)Vehicles)(ESV))(No.)15K0398).))Blanco,) M.,) Hankey,) J.) M.,) &) Chestnut,) J.) A.) (2005,) September).) A) taxonomy) for) secondary) inKvehicle)tasks)based)on)eye)glance)and)task)completion)time.)In)Proceedings*of*the*Human*Factors*and*Ergonomics*Society*Annual*Meeting)(Vol.)49,)No.)22,)pp.)1975K1979).)SAGE)Publications.))Broström,)R.,)Ljung)Aust,)M.,)Wahlberg,)L.,)&)Källgren,)L.)(2013).)What)drives)offKroad)glance)durations)during)multitasking)–)capacity,)practice)or)strategy?)In)3rd*International*Conference*on*Driver*Distraction*and*Inattention.)Gothenburg,)Sweden.))Dingus,)T.A.,)Klauer,)S.G.,)Neale,)V.)L.,)Petersen,)A.)et)al.)2006.)“The)100KCar)Naturalistic)Driving)Study,) Phase) II) –) Results) of) the) 100KCar) Field) Experiment.”) Cambridge:) U.S.) Department) of)Transportation,)John)A.)Volpe)National)Transportation)Systems)Center.))Donmez,)B.,)Boyle,)L.)N.,)&)Lee,)J.)(2010).)Differences)in)offKroad)glances:)effects)on)young)drivers')performance.)Journal*of*transportation*engineering,)136(5),)403K409.))EsOP.)European)Commission.)2008.)“Commission)Recommendation)of)26)May)2008)on)Safe)and)Efficient)InKVehicle)Information)and)Communication)Systems;)Update)of)the)European)Statement)of)Principles)on)HumanKMachine)Interfaces.”))Hockey,)G.R.J.,)1997.)Compensatory)control)in)the)regulation)of)human)performance)under)stress)and)high)workload:)a)cognitive)energetical)framework.)Biological)Psychology,)45,)73–)93.))JAMA.)2004.)“Guideline)for)InKVehicle)Display)Systems,)Version)3.0”.)Japan)Automobile)Manufacturers)Association,)Tokyo,)Japan,)August)2004.))Keppel,)G.)(1991).)Design*and*Analysis:*A*Researcher's*Handbook*.)PrenticeKHall,)Inc.))Klauer,)S.)G.,)Dingus,)T.)A.,)Neale,)V.)L.,)Sudweeks,)J.,)&)Ramsey,)D.)J.)2006.)“The)impact)of)driver)inattention) on) nearKcrash/crash) risk:) An) analysis) using) the) 100KCar)Naturalistic)Driving) Study)data.”)Blacksburg,)VA:)Virginia)Tech)Transportation)Institute,)2006.)))Land,)M.)F.)(2006).)Eye)movements)and)the)control)of)actions)in)everyday)life.)Progress*in*retinal*and*eye*research,)25(3),)296K324.))Liang,) Y.,) Lee,) J.) D.,) &) Yekhshatyan,) L.) (2012).) How) dangerous) is) looking) away) from) the) road?)Algorithms) predict) crash) risk) from) glance) patterns) in) naturalistic) driving.)Human*Factors:*The*Journal*of*the*Human*Factors*and*Ergonomics*Society,)54(6),)1104K1116.))Näätänen,) R.,) Summala,) H.,) 1976.) Road) User) Behaviour) and) Traffic) Accidents.) NorthKHolland/American)Elsevier,)Amsterdam,)New)York.))

Broström,)R.,)Bengtsson,)P.,)&)Ljung)Aust,)M.)(2015).)Individual)glance)strategies)and)their)effect)on)the)NHTSA)Visual)Manual)Distraction)test.)ReKsubmitted)to)Transportation*research*part*F:*traffic*psychology*and*behavior.)
) 13)
Rockwell,)T)H.)(1988)):)Spare)visual)capacity)in)drivingKrevisited:)new)empirical)results)for)an)old)idea.)In)a.)G.)Gale)et)al.)(eds.),)Vision*in*vehicles*II*(pp.)317K324).)Amsterdam:)Elsevier.))Rogers,)W.) A.,) Fisk,) A.) D.,) McLaughlin,) A.) C.,) &) Pak,) R.) (2005).) Touch) a) screen) or) turn) a) knob:)Choosing) the) best) device) for) the) job.) Human* Factors:* The* Journal* of* the* Human* Factors* and*Ergonomics*Society,)47(2),)271K288.))Rydström,)A.,)Broström,)R.,)&)Bengtsson,)P.)(2012).)A)comparison)of)two)contemporary)types)of)inKcar)multifunctional)interfaces.)Applied*Ergonomics,)43(3),)507–514.))Victor,)T.)W.,)Harbluk,)J.)L.,)&)Engström,)J.)A.)(2005).)Sensitivity)of)eyeKmovement)measures)to)inKvehicle)task)difficulty.)Transportation*Research*Part*F:*Traffic*Psychology*and*Behaviour,)8(2),)167K190.))Victor,)T.,)&)Dozza,)M.)(2011).)Timing)Matters:)Visual)behaviour)and)crash)risk)in)the)100Kcar)onKline) data.) In) proceedings* of* the* Driver* Distraction* and* Inattention* International* Conference,*Göteborg,*5R7*September,*2011.))Victor,)T.,)Blomberg,)O.,)&)Zelinsky,)A.)(2012).)Automating)driver)visual)behavior)measurement.)In)Vision*in*Vehicles*IX:*Proceedings*of*9th*International*Conference*on*Vision*in*Vehicles.))VisualKmanual)NHTSA)Driver)Distraction)Guidelines)for)inKVehicle)Electronic)Devices)(2013).)Docket)no.)NHTSAK2010K0053,)National)Highway)Traffic)Safety)Administration,)April)2013.))VisualKmanual)NHTSA)Driver)Distraction)Guidelines)for)inKVehicle)Electronic)Devices)(2014).)Docket)no.)NHTSAK2014K0088,)National)Highway)Traffic)Safety)Administration,)September)2014.))Wierwille,)W.)W.) (1993).)An) initial)model)of) visual) sampling)of) inKcar)displays)and)controls.) In)A.G.*Gale,*I.*D.*Brown,*C.*M.*Haslegrave,*H.*W.*Kruysse,*and*S.*P.*Taylor,*(Eds.),*Vision*in*Vehicles*IV.)(pp.)271–279).))Wittmann,)M.,)Kiss,)M.,)Gugg,)P.,)Steffen,)A.,)Fink,)M.,)Pöppel,)E.,)&)Kamiya,)H.)(2006).)Effects)of)display)position)of)a)visual)inKvehicle)task)on)simulated)driving.)Applied*Ergonomics,)37(2),)187K199.))Zwahlen,)H.)T.,)Adams,)C.)C.,)&)DeBals,)D.)P.)(1988).)Safety)aspects)of)CRT)touch)panel)controls)in)automobiles.)In)Vision*in*Vehicles*II.*Second*International*Conference*on*Vision*in*Vehicles.)


