design considerations of a two-pressure humidity · pdf filedesign considerations of a...
TRANSCRIPT
Design Considerations of a Two-Pressure Humidity Generator
Pipette Calibration: The Gravimetric Method and Balance Resolution
Performance Measurements and Design Optimization of a Cooling Fin Array
2013OCTOBER
NOVEMBERDECEMBER
Spectrum Analyzers
Oscilloscopes
DC Power Supplies
Network Analyzers
Arbitrary Waveform GeneratorsSignal Generators
Bio-Medical Test
Pulse Generators
VXI
Frequency Counters
RFI/EMI/EMC Synthesizers
Hipot TestersModulation Analyzers
Digital Multimeters
AmplifiersNoise Measuring
PXI
Calibrators
Aviation TestCommunication AnalyzersFunction Generators
AC Power Sources Power Meters
Megohmmeters
Electronic Loads
LCR Meters
Audio Analyzers
Curve Tracers
Sweep GeneratorsData Aquisition
Semiconductor Testers
VNALogic Analyzers
Transient Generators
Service Monitors
Lightwave
Pattern GeneratorsTracking Generators
Cable LocatorsImpedance Analyzers
Vector Signal Generators
ESD Test
Ground Bond
Repair Support For More Than 10,000 Different Test Equipment Products
Legacy & Current Product Repair Support
Fast, Simple Online Order Creation (RMA)
Account Historical Data & Reporting Tools
End-Of-Support (EOS) Repair Programs
ISO 17025:2005 Accredited Calibration
Single–Incident Repair Support
Multi-Year Repair Agreements
Post-Repair Calibration Available
Test Equipment Repair Corporation – Industry’s Source For Repair
5965 Shiloh Rd E.Alpharetta, GA 30005
Toll Free: (866) [email protected]
1Oct • Nov • Dec 2013 Cal Lab: The International Journal of Metrology
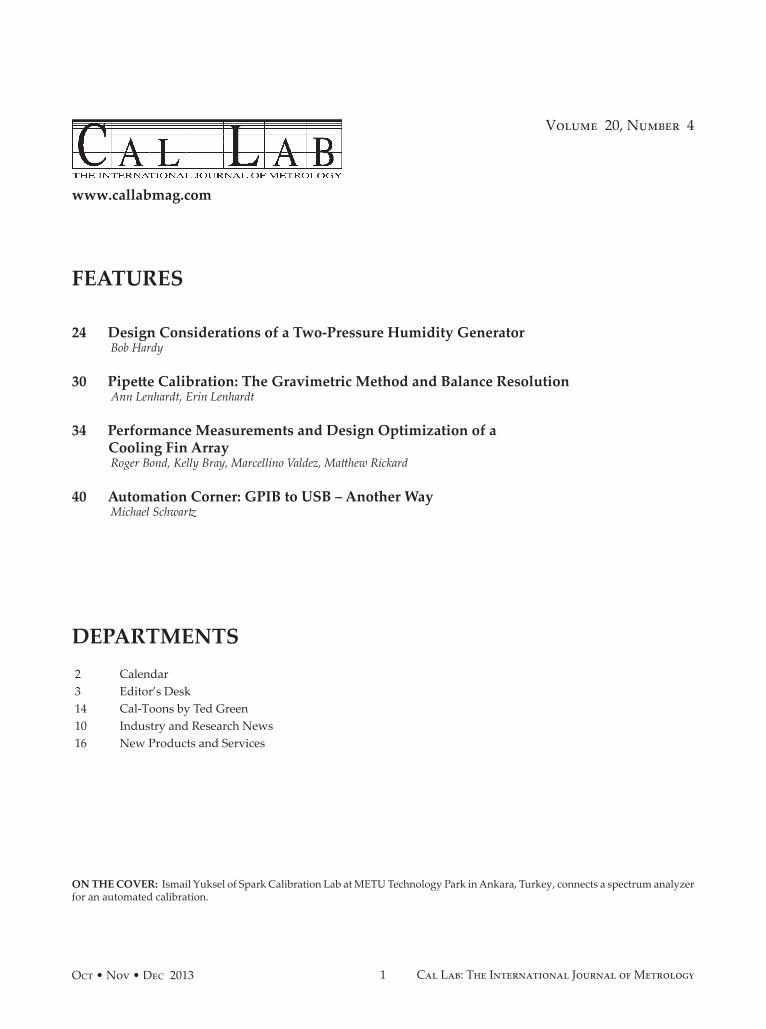
Volume 20, Number 4
www.callabmag.com
FEATURES
24 Design Considerations of a Two-Pressure Humidity GeneratorBob Hardy
30 Pipette Calibration: The Gravimetric Method and Balance ResolutionAnn Lenhardt, Erin Lenhardt
34 Performance Measurements and Design Optimization of a Cooling Fin Array
Roger Bond, Kelly Bray, Marcellino Valdez, Matthew Rickard
40 Automation Corner: GPIB to USB – Another WayMichael Schwartz
DEPARTMENTS 2 Calendar 3 Editor’s Desk 14 Cal-Toons by Ted Green 10 Industry and Research News 16 New Products and Services
ON THE COVER: Ismail Yuksel of Spark Calibration Lab at METU Technology Park in Ankara, Turkey, connects a spectrum analyzer for an automated calibration.
2 Oct • Nov • Dec 2013Cal Lab: The International Journal of Metrology
CALENDAR
Nov 20-22 Asia-Pacific Symposium on Measurement of Mass, Force & Torque (APMF) 2013. Taipei, Taiwan. http://www.apmf2013.itri.org.tw/.
Feb 3-5 IMEKO International TC3, TC5, TC22 Conference 2014. Cape Town, South Africa. http://conferences.imeko.org/index.php/tc3-5-22/2014
Feb 11-14 SSD14 Multiconference. Castelldefels-Barcelona, Spain. The 11th International Multiconference on Systems, Signals & Devices. Visit http://www.ssd-conf.org for details about scope and keywords of each session.
Mar 3-5 South East Asia Flow Measurement Conference. Kuala Lumpur, Malaysia. www.tuvnel.com.
Mar 11-13 International Conference on Surface Metrology (ICSM). Hamburg, Germany. http://www.biologie.uni-hamburg.de/zim/icsm2014/.
Mar 12-14 Measurement Science Conference (MSC). Long Beach, CA. Global Economic Challenges Drive Operational Change In Metrology. www.msc-conf.com.
Mar 24-26 Mathematics and Statistics for Metrology 2014. Berlin, Germany. http://www.ptb.de/cms/fachabteilungen/abt8/fb-84/mathmet-2014.html
Mar 27-28 Metromeet 2014. Bilbao, Spain. The 10th International Conference on Industrial Dimensional Metrology. http://www.metromeet.org/en/index.php
Mar 31-Apr 2 FORUMESURE. Pretoria, South Africa. FORUMESURE will takes place at the same time and same location as the conference CAFMET 2014. The African Committee of Metrology (CAFMET) organizes FORUMESURE, a new annual trade show. http://www.forumesure.com/.
Mar 31-Apr 3 CAFMET 2014. Pretoria, South Africa. The 5th International Metrology Conference. http://www.cafmet2014.com/.
May 12-15 IEEE I&M International Instrumentation and Measurement Technology Conference (I2MTC 2014). Montevideo, Uruguay. http://imtc.ieee-ims.org/
May 13-16 ESTECH 2014. San Antonio, TX. “Launching Into the Future.” http://www.iest.org.
May 29-30 IEEE Workshop on Metrology for Aerospace (MetroAeroSpace). Benevento, Italy. http://www.metroaerospace.org.
Jun 26-27 ASPE/ASPEN Summer Topical Meeting. Kohala Coast, HI. Manufacture and Metrology of Freeform and Off-Axis Axisymmetric Surfaces. http://aspe.net.
CONFERENCES & MEETINGS 2013-2014
3Oct • Nov • Dec 2013 Cal Lab: The International Journal of Metrology
EDITOR’S DESK
PUBLISHERMICHAEL L. SCHWARTZ
EDITORSITA P. SCHWARTZ
CAL LAB PO Box 111113
Aurora, CO 80042TEL 303-317-6670 • FAX 303-317-5295
EDITORIAL ADVISORS
CAROL L. SINGERJAY BUCHER
BUCHERVIEW METROLOGY
CHRISTOPHER L. GRACHANENHEWLETT-PACKARD
MIKE SURACILEAD ASSESSOR, ACLASS
MARTIN DE GROOTMARTINDEGROOT CONSULTANCY
Subscription fees for 1 year (4 issues) $50 for USA, $55 Mexico/Canada,
$65 all other countries.Visit www.callabmag.com
to subscribe.
Printed in the USA. © Copyright 2013 CAL LAB.
ISSN No. 1095-4791
CORRECTION
The Metrology 101 article from the Jul-Sep 2013 issue, “Testing Linearity on the Agilent E441xA Power Sensors,” has been updated online. The upper and lower readings are incorrect in the printed version.
An Excel spreadsheet of the linearity table, with updated calculations, can be downloaded from our web site (www.callabmag.com) by searching for "testing linearity" and clicking on the METROLOGY 101 Article Correction posting in the search results. From this posting and the original article posting, there is link for downloading the spreadsheet.
The Absence of Women
The past year and a half for this editor has been marked by the passing of a number of women in her life. This Editor’s Desk is inspired by those women.
We might know a woman or two or three in the Science, Technology, Engineering, and Math (STEM) fields—you may be one of those women!— but the discrepancy of women to men in the STEMS fields is striking, particularly when equal access to education has been available for several generations in the United States. The numbers for African-Americans in the STEM fields is even more dismal, but that’s a whole other topic! In more developed nations, women in general fall behind in their careers due to caring for children and aging family members, while taking on the lion’s share of household duties. While, in developing nations, women’s access to formal employment is hindered by early childbirth and/or lack of access to education. In either case, a woman’s potential to have a successful career, in any field, is best cultivated before she’s ready to enter secondary education.
How that is accomplished in the STEM fields brings up a lot of ideas and actions, but one in particular I kept seeing/hearing in studies and podcasts is the most elegant: visible and accessible women role models. Between middle school and the end of high school, girls tend to lose interest in math and the sciences. Even if a young woman finds her aptitude in math or in an after school program tinkering with nuts, bolts, and memory boards, it’s another leap to translate those aptitudes to career choices. The career field becomes a whole other reality if she can relate to a role model in that particular field.
A quick point on aptitude for those Archie Bunkers of the world: International statistics do not confirm the stereotype that girls just aren’t as apt at math and science as the boys. A recent, world-wide compilation of test scores compiled by the Organization for Economic Cooperation and Development found that boys outperformed girls in science in the Americas and Western Europe, while the opposite was true in Eastern and Southern Europe, Asia, and the Middle East. (Glean from that what you will.)
The absence of women in the calibration laboratory is a reflection of the lack of women in STEM fields. The more young women go through math and sciences training, the more young women will trickle into the metrology fields.
BTW: Cal Lab Magazine is always accepting submissions of photography for cover art. We know our readers want to see more women visibly represented on our covers. We know this because of feedback we’ve received from young women! If your company would like to submit some photos of their lab, with a female—or male—technician striking a pose, please contact us at [email protected].
Happy Measuring,
Sita P. SchwartzEditor
4 Oct • Nov • Dec 2013Cal Lab: The International Journal of Metrology
CALENDAR
IAS Laboratory Accreditation to ISO/IEC Standard 17025The International Accreditation Service (IAS) offers laboratories Accreditation Service Plus+
+ Quick scheduling and efficient assessments
+ On demand responsiveness
+ True affordability
+ Global recognition by ILAC
+ Proof of compliance with ISO/IEC 17025
Learn about the Benefits of IAS Accreditationwww.iasonline.org/ca 866-427-4422
11-05610
ASQ CCT (Certified Calibration Technician) Exam Preparation Program. Learning Measure. http://www.learningmeasure.com/.
AC-DC Metrology– Self-Paced Online Training. Fluke Training. http://us.flukecal.com/training/courses.
Basic Measurement Concepts Program. Learning Measure. http://www.learningmeasure.com/.
Basic Measuring Tools – Self Directed Learning. The QC Group, http://www.qcgroup.com/sdl/.
Basic RF and Microwave Program. Learning Measure. http://www.learningmeasure.com/.
Certified Calibration Technician – Self-study Course. J&G Technology. http://www.jg-technology.com/selfstudy.html.
Introduction to Measurement and Calibration – Online Training. The QC Group, http://www.qcgroup.com/online/.
Intro to Measurement and Calibration – Self-Paced Online Training. Fluke Training. http://us.flukecal.com/training/courses.
ISO/IEC 17025 Accreditation Courses. WorkPlace Training, tel (612) 308-2202, [email protected], http://www.wptraining.com/.
Measurement Uncertainty – Self-Paced Online Training. Fluke Training. http://us.flukecal.com/training/courses.
Measurement Uncertainty Analysis – Online Training. The QC Group, http://www.qcgroup.com/online/.
Metrology for Cal Lab Personnel– Self-Paced Online Training. Fluke Training. http://us.flukecal.com/training/courses.
Metrology Concepts. QUAMETEC Institute of Measurement Technology. http://www.QIMTonline.com.
Precision Dimensional Measurement – Online Training. The QC Group, http://www.qcgroup.com/online/.
Precision Measurement Series Level 1 & 2. WorkPlace Training, http://www.wptraining.com/.
Vibration and Shock Testing. Equipment Reliability Institute, http://www.equipment-reliability.com/distance_learning.html.
SEMINARS: Online & Independent Study

Electric Voltage & Current
GMW Associates • www.gmw.com
Closed-Loop Hall Current Transducers
Voltage TransducersProvide an Analog Output Signal Magnetically Isolated from the Primary Voltage Circuit
• Full-scale Primary Voltages from ±500V to ±8,000V• Amplitude Accuracy to ±0.2% at dc• Amplitude Frequency Response dc to 500kHz (-3dB)
Signals that can be Used for Accurate and Safe TestTT Measurements
Provide an Analog Output Signal Isolated from the Primary Current Circuit
• Full-scale Primary Currents from ±100A to ±15,000A• Amplitude Accuracy to ±0.3% at dc• Amplitude Frequency Response dc to 300kHz (-3dB)• Common Mode Primary Voltage Isolation• Split Core Versions Available (±2% at dc)Suitable for Production Line TestingTT where Long-term Stability andReliability are Critical
Closed-Loop Fluxgate Current Measurement Systems
Generate a Very High-Accuracy Output Signalwith Electrical Isolation from the Primary Circuit
• Full-scale Primary Currents from ±60A to ±1,000A• Amplitude Linearity to ±0.3ppm at dc• Amplitude Frequency Response dc to 300kHz (-3dB)• Very Low Noise to <5ppm rms (dc to 50kHz) gives
Wide Dynamic Range• Very Low Sensitivity to External Current ConductorsFor High-accuracy Power Measurements over an ExtendedFrequency Range
Very High-Accuracy Current or Voltage Output Signal with Electrical Isolation from the Primary Circuit
Optional Heads, fs Current 600A* 2,000A* 2,000A 5,000A 10,000A 16,000A 24,000Aurrent40A 125A — — — — —Lowest fs Current
fs Current Range Increment 20A 125A ement — — — — —
* The 600A and 2,000A fs Heads are programmable by a pre-wired plug.Very High-accuracy Calibration and Power Measurements
LEM ITZ Ultrastab
LEMLEM ITIT UltrastabUltrast
EMLE LF
LEM CV4CConvert High Voltage Levels in Power Converters to Low Level, Low Impedancee
Closed-Loop Fluxgate Current Transducers
GMW_Ad_CalLab-V&I_8x10.75_October2012.ai 1 10/2/2012 5:44:16 PM
6 Oct • Nov • Dec 2013Cal Lab: The International Journal of Metrology
CALENDAR
SEMINARS: Dimensional
Dec 5-6 Hands-On Gage Calibration and Repair Workshop. Bloomington, MN. http://www.consultinginstitute.net/.
Dec 9-10 Hands-On Gage Calibration and Repair Workshop. Oshkosh, WI. http://www.consultinginstitute.net/.
Dec 12-13 Hands-On Gage Calibration and Repair Workshop. Chippewa Falls/Eau Claire, WI. http://www.consultinginstitute.net/.
Jan 7-8 Hands-On Gage Calibration and Repair Workshop. Schaumburg, IL. http://www.consultinginstitute.net/.
Jan 9-10 Hands-On Gage Calibration and Repair Workshop. Milwaukee, WI. http://www.consultinginstitute.net/.
Jan 21-22 Hands-On Gage Calibration and Repair Workshop. Kansas City, KS. http://www.consultinginstitute.net/.
Jan 23-24 Hands-On Gage Calibration and Repair Workshop. Des Moines, IA. http://www.consultinginstitute.net/.
Feb 4-5 Hands-On Gage Calibration and Repair Workshop. Detroit, MI. http://www.consultinginstitute.net/.
SEMINARS: Electrical
Feb 3-6 MET-101 Basic Hands-on Metrology. Everett, WA. Fluke Calibration. http://us.flukecal.com/training/courses/MET-101.
Apr 7-10 MET-301 Advanced Hands-on Metrology. Seattle, WA. Fluke Calibration. http://us.flukecal.com/training/courses/MET-301.
May 13-15 MET-302 Introduction to Measurement Uncertainty. Everett, WA. Fluke Calibration. http://us.flukecal.com/training/courses/MET-302.
Jun 2-5 MET-101 Basic Hands-on Metrology. Everett, WA. Fluke Calibration. http://us.flukecal.com/training/courses/MET-101.
Jun 9-12 MET-301 Advanced Hands-on Metrology. Seattle, WA. Fluke Calibration. http://us.flukecal.com/training/courses/MET-301.
Sep 8-11 MET-101 Basic Hands-on Metrology. Everett, WA. Fluke Calibration. http://us.flukecal.com/training/courses/MET-101.
Oct 21-23 MET-302 Introduction to Measurement Uncertainty. Everett, WA. http://us.flukecal.com/training/courses/MET-302.
22865 Savi Ranch Parkway Ste F
Yorba Linda, CA 92887, USA
Tel:714-998-6899 [email protected] www.additel.com
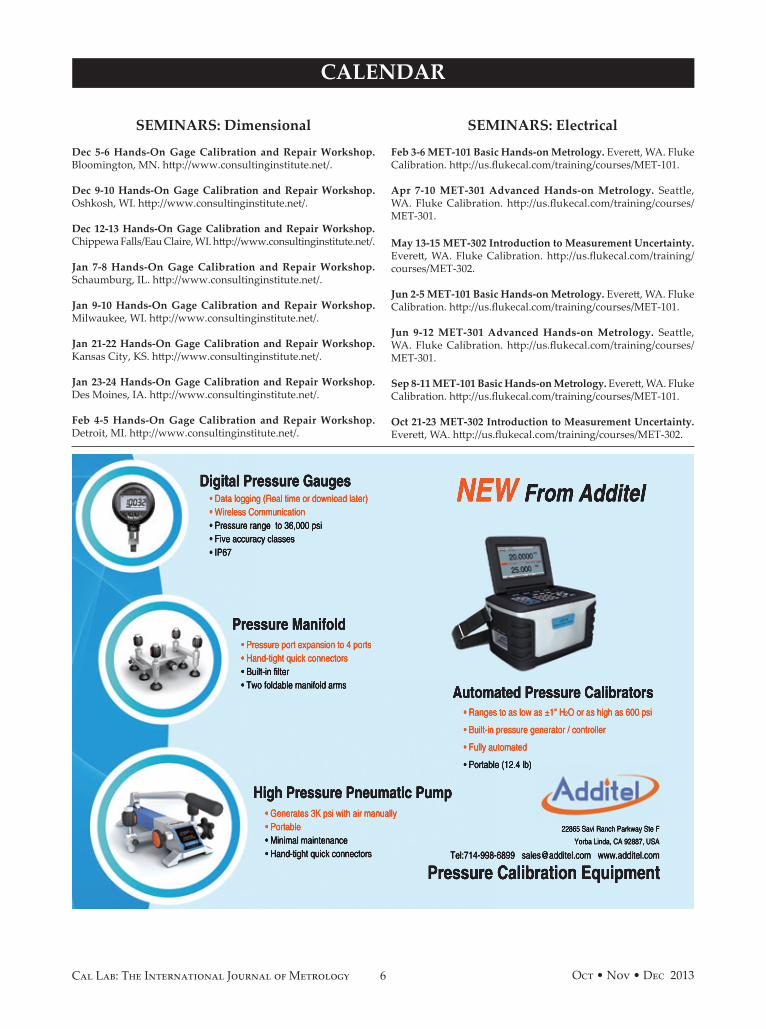
• Pressure port expansion to 4 ports• Hand-tight quick connectors• Built-in filter• Two foldable manifold arms
• Ranges to as low as ±1" H2O or as high as 600 psi
• Built-in pressure generator / controller
• Fully automated
• Portable (12.4 lb)
• Generates 3K psi with air manually • Portable• Minimal maintenance• Hand-tight quick connectors
• Data logging (Real time or download later)• Wireless Communication• Pressure range to 36,000 psi• Five accuracy classes• IP67
Pressure Calibration Equipment
High Pressure Pneumatic Pump
Pressure Manifold
Automated Pressure Calibrators
Digital Pressure Gauges NEW From Additel
7Oct • Nov • Dec 2013 Cal Lab: The International Journal of Metrology
CALENDAR
SEMINARS: Flow & Pressure
Jan 27-31 Principles of Pressure Calibration. Phoenix, AZ. Fluke Calibration. http://us.flukecal.com/Principles-of-Pressure.
Mar 25-27 European Flow Measurement Workshop: Ultrasonic & Coriolis Metering. Lisbon, Portugal. Colorado Engineering Experiment Station Inc. http://www.ceesi.com.
Apr 7-11 Principles of Pressure Calibration. Phoenix, AZ. Fluke Calibration. http://us.flukecal.com/Principles-of-Pressure.
Sep 22-26 Principles of Pressure Calibration. Phoenix, AZ. Fluke Calibration. http://us.flukecal.com/Principles-of-Pressure.
Sep 24-26 Flow Measurement and Calibration. Munich, Germany. TrigasFI GmbH. http://www.trigasfi.de/html/en_seminars.htm.
Nov 17-21 Principles of Pressure Calibration. Phoenix, AZ. Fluke Calibration. http://us.flukecal.com/Principles-of-Pressure.
SEMINARS: General & Management
Jan 13-17 Fundamentals of Metrology. Gaithersburg, MD. NIST / Office of Weights and Measures. http://www.nist.gov/pml/wmd/labmetrology/training.cfm.
Feb 6 Conducting an Effective Management Review. Webinar. NIST / Office of Weights and Measures. http://www.nist.gov/pml/wmd/labmetrology/training.cfm.
Feb 25-27 Cal Lab Manager Training; Beyond 17025. Boca Raton, FL. WorkPlace Training. http://www.wptraining.com.
Mar 31-Apr 4 Fundamentals of Metrology. Gaithersburg, MD. NIST / Office of Weights and Measures. http://www.nist.gov/pml/wmd/labmetrology/training.cfm.
SEMINARS: Industry Standards
Feb 20 Internal Auditing Best Practices. Webinar. NIST / Office of Weights and Measures. http://www.nist.gov/pml/wmd/calendar.cfm.
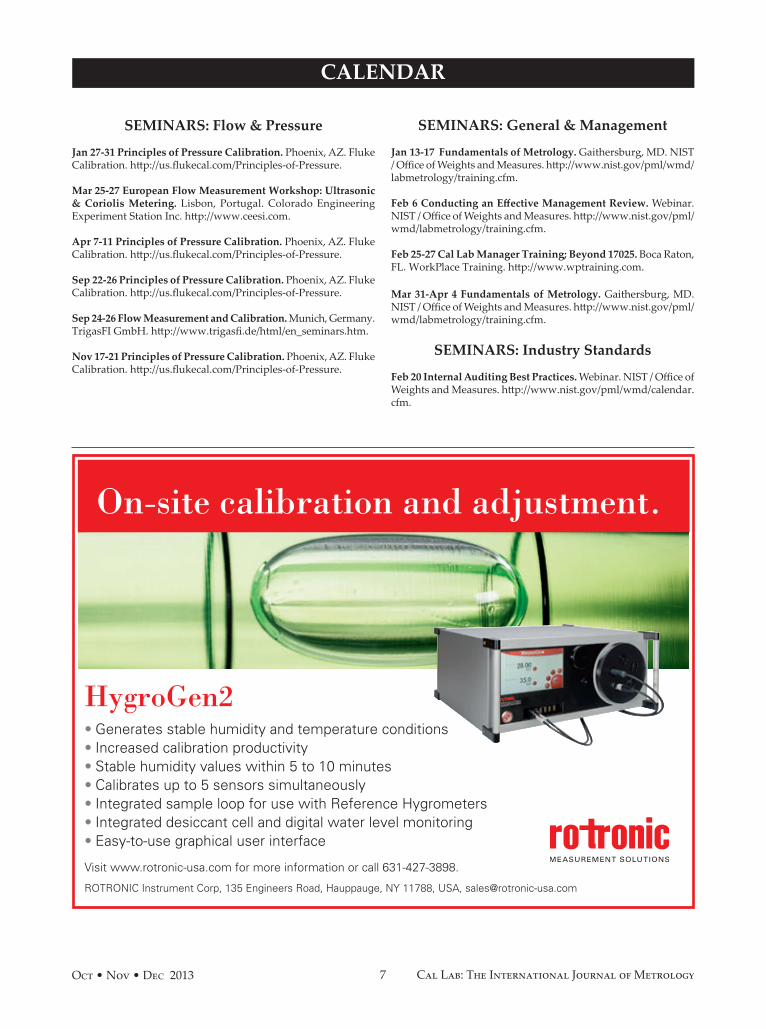
HygroGen2• Generates stable humidity and temperature conditions• Increased calibration productivity• Stable humidity values within 5 to 10 minutes• Calibrates up to 5 sensors simultaneously• Integrated sample loop for use with Reference Hygrometers • Integrated desiccant cell and digital water level monitoring• Easy-to-use graphical user interface
Visit www.rotronic-usa.com for more information or call 631-427-3898.
ROTRONIC Instrument Corp, 135 Engineers Road, Hauppauge, NY 11788, USA, [email protected]
On-site calibration and adjustment.
Cal Lab Mag 6.5x4.75_2012 5/23/12 2:36 PM Page 1
8 Oct • Nov • Dec 2013Cal Lab: The International Journal of Metrology
CALENDAR
INSTRUMENT COMPANY, INC. 1742 Sixth Avenue ¥ York, PA USA
Force and Torque Calibration Service Lower your test uncertainty ratios by having instruments
calibrated at a more precise level of measurement certainty:
MOREHOUSE FORCE & TORQUE CALIBRATION LABORATORIESPhone: 717-843-0081 / Fax: 717-846-4193 / www.mhforce.com / e-mail: [email protected]
� Primary Force and Torque standards accurate to 0.002% of applied for most capacities
� Hassle-Free Calibration Service - Morehouse does not require RMAʼs and works extensively to ensure calibrations are performed in a manner that replicates how the instruments are used
� Force Calibration performed in our laboratory to 2,250,000 lbf in compression and 1,200,000 lbf in tension and equivalent SI units
� Torque Calibration performed in our laboratory to 1475 ft - lbf and equivalent SI units
� Calibrations performed in accordance with customer specifications, ASTM E74, ISO 376, ASTM E 2428 and BS 7882
ISO 17025 AccreditedAmerican Association of Laboratory Accreditation Calibration Cert 1398.01
Prompt Delivery of 5-7 Days on Most Items. Expedited Service Available
SEMINARS: Mass
Feb 24-Mar 7 Mass Metrology Seminar. Gaithersburg, MD. NIST / Office of Weights and Measures. http://www.nist.gov/pml/wmd/labmetrology/training.cfm.
Apr 28-May 8 Mass Metrology Seminar. Gaithersburg, MD. NIST / Office of Weights and Measures. http://www.nist.gov/pml/wmd/labmetrology/training.cfm.
SEMINARS: Measurement Uncertainty
Dec 5 Introduction to Measurement Uncertainty Training Course. Aberdeen, UK. TUV SUD Ltd. http://www.tuvnel.com/tuvnel/courses_workshops_seminars/.
* For more uncertainty, see SEMINARS: Electrical.
SEMINARS: Temperature
Jun 10-12 Principles of Temperature Metrology. American Fork, UT. Fluke Calibration. http://us.flukecal.com/training/courses/Principles-Temperature-Metrology.
Sep 9-11 Advanced Topics in Temperature Metrology. American Fork, UT. Fluke Calibration. http://us.flukecal.com/training/courses/Principles-Temperature-Metrology.
SEMINARS: Vibration
Nov 13-15 Fundamentals of Random Vibration and Shock Testing, HALT, ESS, HASS (...). Lynchburg, VA. http://www.equipment-reliability.com.
Feb 18-20 Fundamentals of Random Vibration and Shock Testing, HALT, ESS, HASS (...). Lynchburg, VA. http://www.equipment-reliability.com.
SEMINARS: Volume
Dec 9-13 Volume Metrology Seminar. Gaithersburg, MD. NIST / Office of Weights and Measures. http://www.nist.gov/pml/wmd/labmetrology/training.cfm.
8Visit www.callabmag.com
for upcoming and future events!

Understand more about calibration. Scan or visithttp://qrs.ly/2y2kkcofor videos.
Not all calibrations are created equal,see why “the work” matters:www.agilent.com/fi nd/SeeTheWork
Since elementary school, you’ve had to show your work. Make sure your
calibration provider does too.When it comes to calibration, a simple pass/fail answer isn’t enough. You need a full report of tests conducted — including accuracy. And if the test results were out of spec, how far? A certifi cate alone is not the answer to calibration. Ask to see the work.
© Agilent Technologies, Inc. 2013 u.s. 1-800-829-4444 canada: 1-877-894-4414
10 Oct • Nov • Dec 2013Cal Lab: The International Journal of Metrology
INDUSTRY AND RESEARCH NEWS
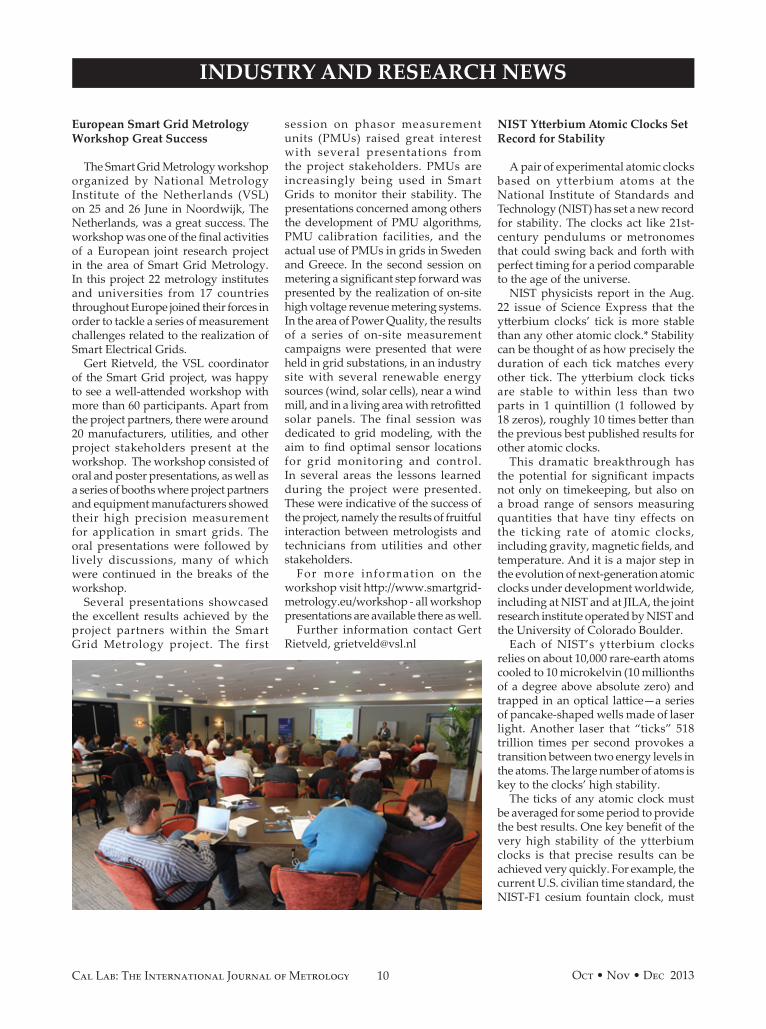
European Smart Grid Metrology Workshop Great Success
The Smart Grid Metrology workshop organized by National Metrology Institute of the Netherlands (VSL) on 25 and 26 June in Noordwijk, The Netherlands, was a great success. The workshop was one of the final activities of a European joint research project in the area of Smart Grid Metrology. In this project 22 metrology institutes and universities from 17 countries throughout Europe joined their forces in order to tackle a series of measurement challenges related to the realization of Smart Electrical Grids.
Gert Rietveld, the VSL coordinator of the Smart Grid project, was happy to see a well-attended workshop with more than 60 participants. Apart from the project partners, there were around 20 manufacturers, utilities, and other project stakeholders present at the workshop. The workshop consisted of oral and poster presentations, as well as a series of booths where project partners and equipment manufacturers showed their high precision measurement for application in smart grids. The oral presentations were followed by lively discussions, many of which were continued in the breaks of the workshop.
Several presentations showcased the excellent results achieved by the project partners within the Smart Grid Metrology project. The first
session on phasor measurement units (PMUs) raised great interest with several presentations from the project stakeholders. PMUs are increasingly being used in Smart Grids to monitor their stability. The presentations concerned among others the development of PMU algorithms, PMU calibration facilities, and the actual use of PMUs in grids in Sweden and Greece. In the second session on metering a significant step forward was presented by the realization of on-site high voltage revenue metering systems. In the area of Power Quality, the results of a series of on-site measurement campaigns were presented that were held in grid substations, in an industry site with several renewable energy sources (wind, solar cells), near a wind mill, and in a living area with retrofitted solar panels. The final session was dedicated to grid modeling, with the aim to find optimal sensor locations for grid monitoring and control. In several areas the lessons learned during the project were presented. These were indicative of the success of the project, namely the results of fruitful interaction between metrologists and technicians from utilities and other stakeholders.
For more information on the workshop visit http://www.smartgrid-metrology.eu/workshop - all workshop presentations are available there as well.
Further information contact Gert Rietveld, [email protected]
NIST Ytterbium Atomic Clocks Set Record for Stability
A pair of experimental atomic clocks based on ytterbium atoms at the National Institute of Standards and Technology (NIST) has set a new record for stability. The clocks act like 21st-century pendulums or metronomes that could swing back and forth with perfect timing for a period comparable to the age of the universe.
NIST physicists report in the Aug. 22 issue of Science Express that the ytterbium clocks’ tick is more stable than any other atomic clock.* Stability can be thought of as how precisely the duration of each tick matches every other tick. The ytterbium clock ticks are stable to within less than two parts in 1 quintillion (1 followed by 18 zeros), roughly 10 times better than the previous best published results for other atomic clocks.
This dramatic breakthrough has the potential for significant impacts not only on timekeeping, but also on a broad range of sensors measuring quantities that have tiny effects on the ticking rate of atomic clocks, including gravity, magnetic fields, and temperature. And it is a major step in the evolution of next-generation atomic clocks under development worldwide, including at NIST and at JILA, the joint research institute operated by NIST and the University of Colorado Boulder.
Each of NIST’s ytterbium clocks relies on about 10,000 rare-earth atoms cooled to 10 microkelvin (10 millionths of a degree above absolute zero) and trapped in an optical lattice—a series of pancake-shaped wells made of laser light. Another laser that “ticks” 518 trillion times per second provokes a transition between two energy levels in the atoms. The large number of atoms is key to the clocks’ high stability.
The ticks of any atomic clock must be averaged for some period to provide the best results. One key benefit of the very high stability of the ytterbium clocks is that precise results can be achieved very quickly. For example, the current U.S. civilian time standard, the NIST-F1 cesium fountain clock, must
11Oct • Nov • Dec 2013 Cal Lab: The International Journal of Metrology
INDUSTRY AND RESEARCH NEWS
ENGINEERING CORPORATIONOSSR 540 Westchester Dr. Campbell, CA 95008www.rossengineeringcorp.com
4 0 8 - 3 7 7 - 4 6 2 1
ISO/IEC 17025:2005CALIBRATION CERT #2746.01
ISO 9001:2008 QMS CERTIFIED
Custom Design is our Specialty!
High Voltage Dividers & Probes
DESIGN, MANUFACTURE, TEST &CALIBRATE:
• HV VOLTAGE DIVIDERS• HV PROBES• HV RELAYS• HV AC & DC HIPOTS• HV DIGITAL VOLTMETERS• HV CONTACTORS• HV CIRCUIT BREAKERS• HV RESISTIVE LOADS• SPARK GAPS• FIBER OPTIC SYSTEMS
HV LAB CALIBRATION CAPABILITIES:• UP TO 450kV PEAK 60Hz• UP TO 400kV DC• UP TO 400kV 1.2x50μS
LIGHTNING IMPULSE
HV LAB CALIBRATION STANDARDSISO/IEC 17025:2005 ACCREDITEDISO 9001:2008 QMS CERTIFIEDN.I.S.T. TRACEABILITYN.R.C. TRACEABILITY
HIGH VOLTAGECALIBRATION LAB
±
be averaged for about 400,000 seconds (about five days) to achieve its best performance. The new ytterbium clocks achieve that same result in about one second of averaging time.
Given this high level of stability the ytterbium clocks can make measurements extremely rapidly—in real time in many cases—which could be important in rapidly changing application settings, such as the factory floor and the natural environment.
A key advance enabl ing the milestone performance of the ytterbium clocks was the recent construction of a second version of the clock to measure and improve the performance of the original, developed since 2003. Along the way, NIST scientists have made several improvements to both clocks, including the development of an ultra-low-noise laser used to excite the
atoms, and the discovery of a method to cancel disruptive effects caused by collisions between atoms.
The ytterbium clocks’ stability record is different from the performance levels previously publicized for NIST-F1, which is traceable to the international system of units, and NIST experimental optical clocks based on single ions, such as the aluminum quantum logic clock or the mercury ion clock.** NIST-F1 and the ion clocks were evaluated based on systematic uncertainty, another important metric for standard atomic clocks. NIST-F1’s performance is described in terms of accuracy, which refers to how closely the clock realizes the cesium atom’s known frequency, or natural vibration rate. Accuracy is crucial for time measurements that must be traced to a primary standard.
NIST scientists plan to measure the
accuracy of the ytterbium clocks in the near future, and the accuracy of other high performance optical atomic clocks is under study at NIST and JILA. The research is funded in part by the Defense Advanced Research Projects Agency and the National Aeronautics and Space Administration (NASA).
*N. Hinkley, J.A. Sherman, N.B. Phillips, M. Schioppo, N.D. Lemke, K. Beloy, M. Pizzocaro, C.W. Oates, A.D. Ludlow. An atomic clock with 10-18 instability. Science Express, Aug. 22, 2013.
**See 2010 NIST press release, “NIST’s Second ‘Quantum Logic Clock’ Based on Aluminum Ion is Now World’s Most Precise Clock,” at www.nist.gov/pml/div688/logicclock_020410.cfm.
Source: NIST Tech Beat, September 3, 2013, http://www.nist.gov/public_affairs/tech-beat/tb20130903.cfm#clock.
12 Oct • Nov • Dec 2013Cal Lab: The International Journal of Metrology
INDUSTRY AND RESEARCH NEWS
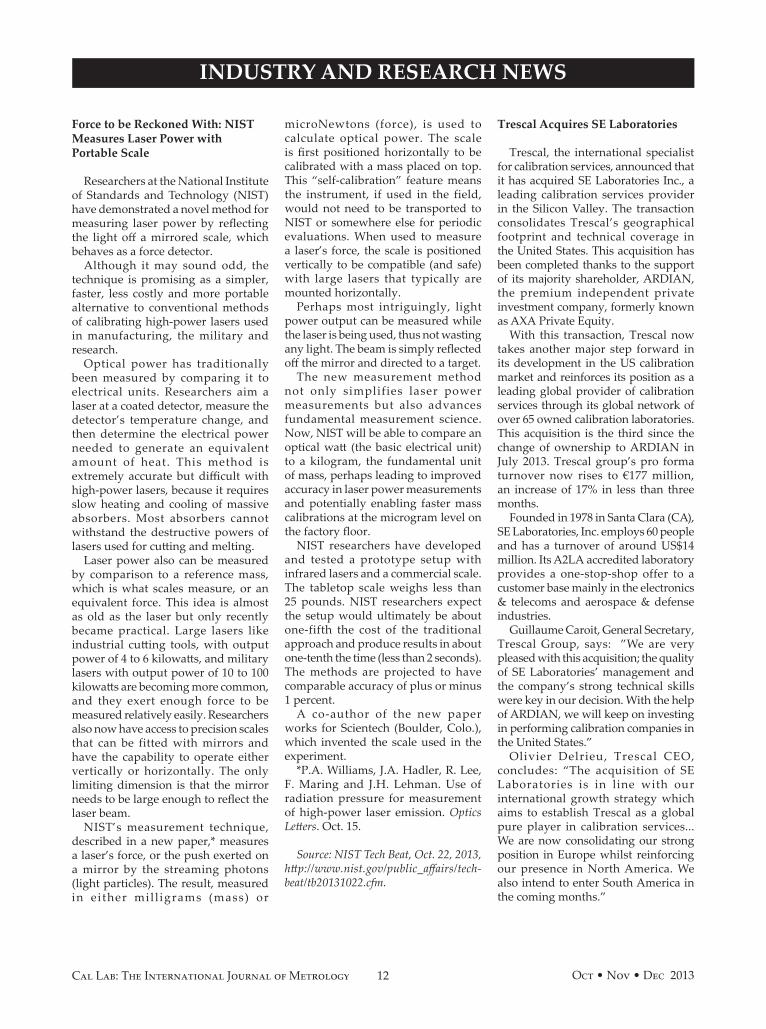
Force to be Reckoned With: NIST Measures Laser Power with Portable Scale
Researchers at the National Institute of Standards and Technology (NIST) have demonstrated a novel method for measuring laser power by reflecting the light off a mirrored scale, which behaves as a force detector.
Although it may sound odd, the technique is promising as a simpler, faster, less costly and more portable alternative to conventional methods of calibrating high-power lasers used in manufacturing, the military and research.
Optical power has traditionally been measured by comparing it to electrical units. Researchers aim a laser at a coated detector, measure the detector’s temperature change, and then determine the electrical power needed to generate an equivalent amount of heat. This method is extremely accurate but difficult with high-power lasers, because it requires slow heating and cooling of massive absorbers. Most absorbers cannot withstand the destructive powers of lasers used for cutting and melting.
Laser power also can be measured by comparison to a reference mass, which is what scales measure, or an equivalent force. This idea is almost as old as the laser but only recently became practical. Large lasers like industrial cutting tools, with output power of 4 to 6 kilowatts, and military lasers with output power of 10 to 100 kilowatts are becoming more common, and they exert enough force to be measured relatively easily. Researchers also now have access to precision scales that can be fitted with mirrors and have the capability to operate either vertically or horizontally. The only limiting dimension is that the mirror needs to be large enough to reflect the laser beam.
NIST’s measurement technique, described in a new paper,* measures a laser’s force, or the push exerted on a mirror by the streaming photons (light particles). The result, measured in either mil l igrams (mass) or
microNewtons (force), is used to calculate optical power. The scale is first positioned horizontally to be calibrated with a mass placed on top. This “self-calibration” feature means the instrument, if used in the field, would not need to be transported to NIST or somewhere else for periodic evaluations. When used to measure a laser’s force, the scale is positioned vertically to be compatible (and safe) with large lasers that typically are mounted horizontally.
Perhaps most intriguingly, light power output can be measured while the laser is being used, thus not wasting any light. The beam is simply reflected off the mirror and directed to a target.
The new measurement method not only simplifies laser power measurements but also advances fundamental measurement science. Now, NIST will be able to compare an optical watt (the basic electrical unit) to a kilogram, the fundamental unit of mass, perhaps leading to improved accuracy in laser power measurements and potentially enabling faster mass calibrations at the microgram level on the factory floor.
NIST researchers have developed and tested a prototype setup with infrared lasers and a commercial scale. The tabletop scale weighs less than 25 pounds. NIST researchers expect the setup would ultimately be about one-fifth the cost of the traditional approach and produce results in about one-tenth the time (less than 2 seconds). The methods are projected to have comparable accuracy of plus or minus 1 percent.
A co-author of the new paper works for Scientech (Boulder, Colo.), which invented the scale used in the experiment.
*P.A. Williams, J.A. Hadler, R. Lee, F. Maring and J.H. Lehman. Use of radiation pressure for measurement of high-power laser emission. Optics Letters. Oct. 15.
Source: NIST Tech Beat, Oct. 22, 2013, http://www.nist.gov/public_affairs/tech-beat/tb20131022.cfm.
Trescal Acquires SE Laboratories
Trescal, the international specialist for calibration services, announced that it has acquired SE Laboratories Inc., a leading calibration services provider in the Silicon Valley. The transaction consolidates Trescal’s geographical footprint and technical coverage in the United States. This acquisition has been completed thanks to the support of its majority shareholder, ARDIAN, the premium independent private investment company, formerly known as AXA Private Equity.
With this transaction, Trescal now takes another major step forward in its development in the US calibration market and reinforces its position as a leading global provider of calibration services through its global network of over 65 owned calibration laboratories. This acquisition is the third since the change of ownership to ARDIAN in July 2013. Trescal group’s pro forma turnover now rises to €177 million, an increase of 17% in less than three months.
Founded in 1978 in Santa Clara (CA), SE Laboratories, Inc. employs 60 people and has a turnover of around US$14 million. Its A2LA accredited laboratory provides a one-stop-shop offer to a customer base mainly in the electronics & telecoms and aerospace & defense industries.
Guillaume Caroit, General Secretary, Trescal Group, says: ”We are very pleased with this acquisition; the quality of SE Laboratories’ management and the company’s strong technical skills were key in our decision. With the help of ARDIAN, we will keep on investing in performing calibration companies in the United States.”
Olivier Delrieu, Trescal CEO, concludes: “The acquisition of SE Laboratories is in line with our international growth strategy which aims to establish Trescal as a global pure player in calibration services... We are now consolidating our strong position in Europe whilst reinforcing our presence in North America. We also intend to enter South America in the coming months.”
14 Oct • Nov • Dec 2013Cal Lab: The International Journal of Metrology
INDUSTRY AND RESEARCH NEWS
…and a X10 Probe and an adapter kit and a 1 GHz timebase and an honest-to-gosh scope cart and an automated cal and …
CAL-TOONS by Ted Green [email protected] Dynamic Calibration of Forces Now Possible
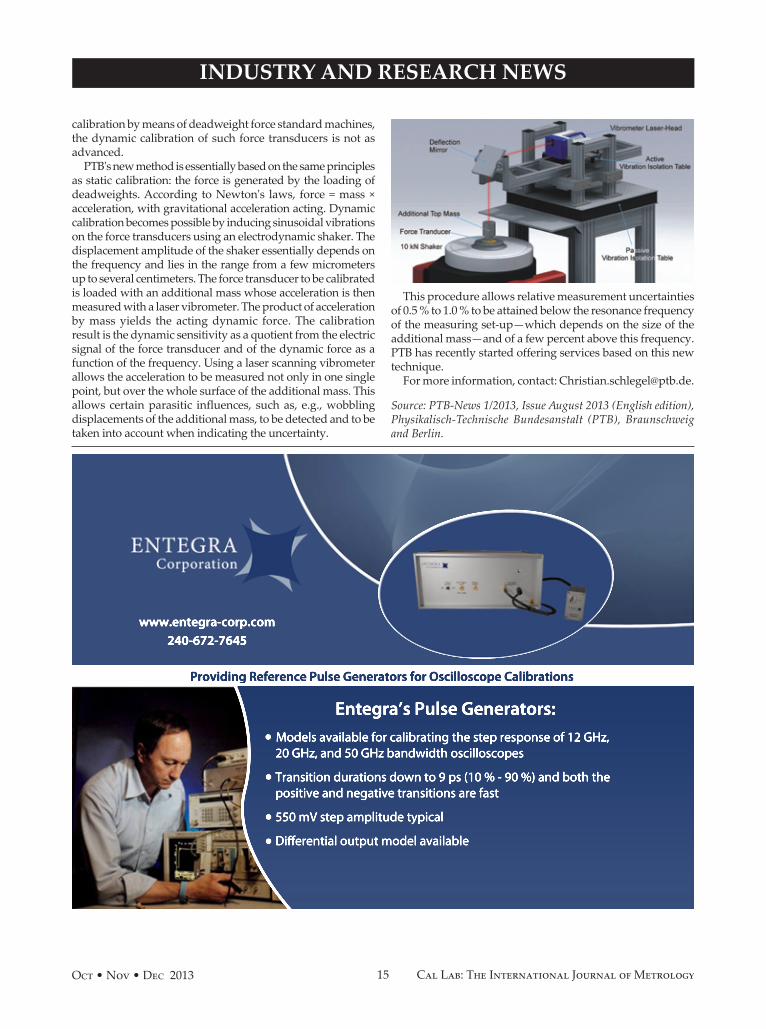
Dynamic forces, such as those occurring in dynamic tests performed with material-testing machines, could previously be measured only with insufficient accuracy. A procedure developed at the Physikalisch-Technische Bundesanstalt (PTB), in now allows traceable calibration of dynamic (i.e. time- and frequency-dependent measurements) to be carried out in a frequency range from 40 Hz up to 2 kHz with forces up to 2 kN.
Industrial applications require dynamic force calibrations, e.g. for material-testing machines or test benches in the automotive and aviation industries. Whereas high-precision procedures have been available for several decades for the static calibration of force transducers allowing traceable
New METDaemon 2.0 Suite Releasedfrom On Time Support®
Expanding the capabilities of Metrology Database systems. On TimeSupport has released our new METDaemon 2.0. This newMETDaemon supports the following databases:
Sybase ASASybase ASEPostgreSQLMySQLOracleMS SQL ServerFirebirdSQLite
Enhance your system with one or more of the following:
* updated BC Mobile for Met/Track®* new Metrology Xplorer 2 language features for Met/Track* updated METDaemon Report Viewer for all databases* updated METDaemon Responder for Met/Track* updated Email Notification for all databases
Need help with reports or combining data from other databases? Wecan help. Contact the database experts at On Time Support, Inc.
Automate email reportswith Email Notification oradd SQL/Crystal Reportsusing Report Viewer.
Add to printlabels for your database.
15Oct • Nov • Dec 2013 Cal Lab: The International Journal of Metrology
INDUSTRY AND RESEARCH NEWS
Providing Reference Pulse Generators for Oscilloscope Calibrations
www.entegra-corp.com240-672-7645
Entegra’s Pulse Generators: Models available for calibrating the step response of 12 GHz, 20 GHz, and 50 GHz bandwidth oscilloscopes
Transition durations down to 9 ps (10 % - 90 %) and both the positive and negative transitions are fast
550 mV step amplitude typical
Differential output model available
calibration by means of deadweight force standard machines, the dynamic calibration of such force transducers is not as advanced.
PTB's new method is essentially based on the same principles as static calibration: the force is generated by the loading of deadweights. According to Newton's laws, force = mass × acceleration, with gravitational acceleration acting. Dynamic calibration becomes possible by inducing sinusoidal vibrations on the force transducers using an electrodynamic shaker. The displacement amplitude of the shaker essentially depends on the frequency and lies in the range from a few micrometers up to several centimeters. The force transducer to be calibrated is loaded with an additional mass whose acceleration is then measured with a laser vibrometer. The product of acceleration by mass yields the acting dynamic force. The calibration result is the dynamic sensitivity as a quotient from the electric signal of the force transducer and of the dynamic force as a function of the frequency. Using a laser scanning vibrometer allows the acceleration to be measured not only in one single point, but over the whole surface of the additional mass. This allows certain parasitic influences, such as, e.g., wobbling displacements of the additional mass, to be detected and to be taken into account when indicating the uncertainty.
This procedure allows relative measurement uncertainties of 0.5 % to 1.0 % to be attained below the resonance frequency of the measuring set-up—which depends on the size of the additional mass—and of a few percent above this frequency. PTB has recently started offering services based on this new technique.
For more information, contact: [email protected].
Source: PTB-News 1/2013, Issue August 2013 (English edition), Physikalisch-Technische Bundesanstalt (PTB), Braunschweig and Berlin.
16 Oct • Nov • Dec 2013Cal Lab: The International Journal of Metrology
NEW PRODUCTS AND SERVICES
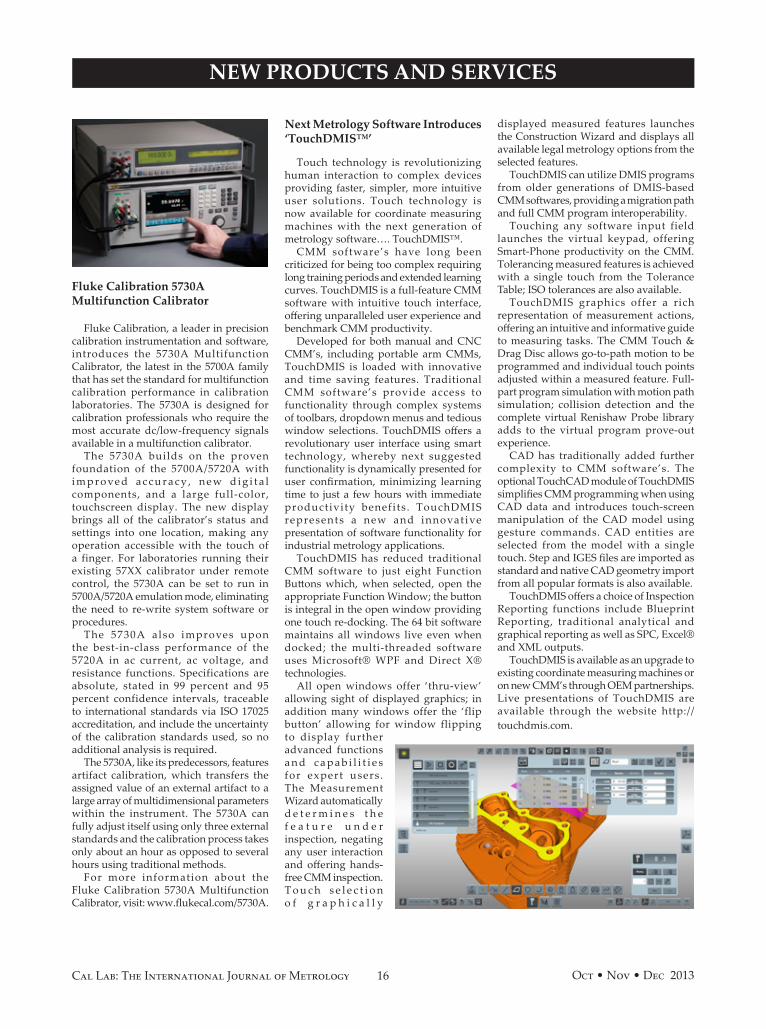
Fluke Calibration 5730A Multifunction Calibrator
Fluke Calibration, a leader in precision calibration instrumentation and software, introduces the 5730A Multifunction Calibrator, the latest in the 5700A family that has set the standard for multifunction calibration performance in calibration laboratories. The 5730A is designed for calibration professionals who require the most accurate dc/low-frequency signals available in a multifunction calibrator.
The 5730A builds on the proven foundation of the 5700A/5720A with i m p r o ve d a c c u r a c y , n e w d i g i t a l components, and a large full-color, touchscreen display. The new display brings all of the calibrator’s status and settings into one location, making any operation accessible with the touch of a finger. For laboratories running their existing 57XX calibrator under remote control, the 5730A can be set to run in 5700A/5720A emulation mode, eliminating the need to re-write system software or procedures.
The 5730A also improves upon the best-in-class performance of the 5720A in ac current, ac voltage, and resistance functions. Specifications are absolute, stated in 99 percent and 95 percent confidence intervals, traceable to international standards via ISO 17025 accreditation, and include the uncertainty of the calibration standards used, so no additional analysis is required.
The 5730A, like its predecessors, features artifact calibration, which transfers the assigned value of an external artifact to a large array of multidimensional parameters within the instrument. The 5730A can fully adjust itself using only three external standards and the calibration process takes only about an hour as opposed to several hours using traditional methods.
For more information about the Fluke Calibration 5730A Multifunction Calibrator, visit: www.flukecal.com/5730A.
Next Metrology Software Introduces ‘TouchDMIS™’
Touch technology is revolutionizing human interaction to complex devices providing faster, simpler, more intuitive user solutions. Touch technology is now available for coordinate measuring machines with the next generation of metrology software…. TouchDMIS™.
CMM software’s have long been criticized for being too complex requiring long training periods and extended learning curves. TouchDMIS is a full-feature CMM software with intuitive touch interface, offering unparalleled user experience and benchmark CMM productivity.
Developed for both manual and CNC CMM’s, including portable arm CMMs, TouchDMIS is loaded with innovative and time saving features. Traditional CMM software’s provide access to functionality through complex systems of toolbars, dropdown menus and tedious window selections. TouchDMIS offers a revolutionary user interface using smart technology, whereby next suggested functionality is dynamically presented for user confirmation, minimizing learning time to just a few hours with immediate productivity benefits . TouchDMIS represents a new and innovat ive presentation of software functionality for industrial metrology applications.
TouchDMIS has reduced traditional CMM software to just eight Function Buttons which, when selected, open the appropriate Function Window; the button is integral in the open window providing one touch re-docking. The 64 bit software maintains all windows live even when docked; the multi-threaded software uses Microsoft® WPF and Direct X® technologies.
All open windows offer ‘thru-view’ allowing sight of displayed graphics; in addition many windows offer the ‘flip button’ allowing for window flipping to display further advanced functions a n d c a p a b i l i t i e s for expert users . The Measurement Wizard automatically d e t e r m i n e s t h e f e a t u r e u n d e r inspection, negating any user interaction and offering hands-free CMM inspection. T o u c h s e l e c t i o n o f g r a p h i c a l l y
displayed measured features launches the Construction Wizard and displays all available legal metrology options from the selected features.
TouchDMIS can utilize DMIS programs from older generations of DMIS-based CMM softwares, providing a migration path and full CMM program interoperability.
Touching any software input field launches the virtual keypad, offering Smart-Phone productivity on the CMM. Tolerancing measured features is achieved with a single touch from the Tolerance Table; ISO tolerances are also available.
TouchDMIS graphics offer a rich representation of measurement actions, offering an intuitive and informative guide to measuring tasks. The CMM Touch & Drag Disc allows go-to-path motion to be programmed and individual touch points adjusted within a measured feature. Full-part program simulation with motion path simulation; collision detection and the complete virtual Renishaw Probe library adds to the virtual program prove-out experience.
CAD has traditionally added further complexity to CMM software’s. The optional TouchCAD module of TouchDMIS simplifies CMM programming when using CAD data and introduces touch-screen manipulation of the CAD model using gesture commands. CAD entities are selected from the model with a single touch. Step and IGES files are imported as standard and native CAD geometry import from all popular formats is also available.
TouchDMIS offers a choice of Inspection Reporting functions include Blueprint Reporting, traditional analytical and graphical reporting as well as SPC, Excel® and XML outputs.
TouchDMIS is available as an upgrade to existing coordinate measuring machines or on new CMM’s through OEM partnerships. Live presentations of TouchDMIS are available through the website http://touchdmis.com.
MISSION SUCCESSIS OFTEN MEASURED IN PARTS-PER-MILLION
Lockheed Martin Calibration Services. Comprehensive, affordable, highly accurate calibration support. Delivered by our experts with precision and care for 30 years.
ISO/IEC 17025:2005 Accreditation, A2LA 2258.011-800-275-3488
www.lockheedmartin.com/calibration
© 2
012
Lock
heed
Mar
tin C
orpo
ratio
n
312-63925_CalibrationServices_dev.indd 1 6/14/12 1:57 PM
18 Oct • Nov • Dec 2013Cal Lab: The International Journal of Metrology
NEW PRODUCTS AND SERVICES
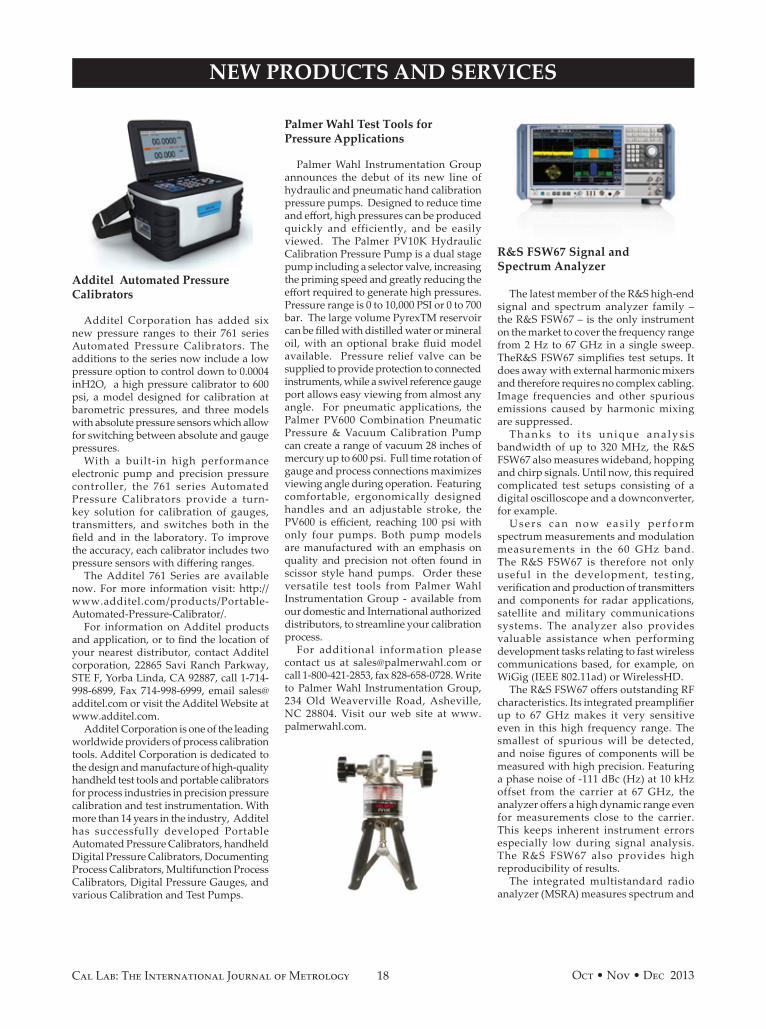
Additel Automated Pressure Calibrators
Additel Corporation has added six new pressure ranges to their 761 series Automated Pressure Calibrators. The additions to the series now include a low pressure option to control down to 0.0004 inH2O, a high pressure calibrator to 600 psi, a model designed for calibration at barometric pressures, and three models with absolute pressure sensors which allow for switching between absolute and gauge pressures.
With a built-in high performance electronic pump and precision pressure controller, the 761 series Automated Pressure Calibrators provide a turn-key solution for calibration of gauges, transmitters, and switches both in the field and in the laboratory. To improve the accuracy, each calibrator includes two pressure sensors with differing ranges.
The Additel 761 Series are available now. For more information visit: http://www.additel.com/products/Portable-Automated-Pressure-Calibrator/.
For information on Additel products and application, or to find the location of your nearest distributor, contact Additel corporation, 22865 Savi Ranch Parkway, STE F, Yorba Linda, CA 92887, call 1-714-998-6899, Fax 714-998-6999, email [email protected] or visit the Additel Website at www.additel.com.
Additel Corporation is one of the leading worldwide providers of process calibration tools. Additel Corporation is dedicated to the design and manufacture of high-quality handheld test tools and portable calibrators for process industries in precision pressure calibration and test instrumentation. With more than 14 years in the industry, Additel has successfully developed Portable Automated Pressure Calibrators, handheld Digital Pressure Calibrators, Documenting Process Calibrators, Multifunction Process Calibrators, Digital Pressure Gauges, and various Calibration and Test Pumps.
Palmer Wahl Test Tools for Pressure Applications
Palmer Wahl Instrumentation Group announces the debut of its new line of hydraulic and pneumatic hand calibration pressure pumps. Designed to reduce time and effort, high pressures can be produced quickly and efficiently, and be easily viewed. The Palmer PV10K Hydraulic Calibration Pressure Pump is a dual stage pump including a selector valve, increasing the priming speed and greatly reducing the effort required to generate high pressures. Pressure range is 0 to 10,000 PSI or 0 to 700 bar. The large volume PyrexTM reservoir can be filled with distilled water or mineral oil, with an optional brake fluid model available. Pressure relief valve can be supplied to provide protection to connected instruments, while a swivel reference gauge port allows easy viewing from almost any angle. For pneumatic applications, the Palmer PV600 Combination Pneumatic Pressure & Vacuum Calibration Pump can create a range of vacuum 28 inches of mercury up to 600 psi. Full time rotation of gauge and process connections maximizes viewing angle during operation. Featuring comfortable, ergonomically designed handles and an adjustable stroke, the PV600 is efficient, reaching 100 psi with only four pumps. Both pump models are manufactured with an emphasis on quality and precision not often found in scissor style hand pumps. Order these versatile test tools from Palmer Wahl Instrumentation Group - available from our domestic and International authorized distributors, to streamline your calibration process.
For additional information please contact us at [email protected] or call 1-800-421-2853, fax 828-658-0728. Write to Palmer Wahl Instrumentation Group, 234 Old Weaverville Road, Asheville, NC 28804. Visit our web site at www.palmerwahl.com.
R&S FSW67 Signal and Spectrum Analyzer
The latest member of the R&S high-end signal and spectrum analyzer family ‒ the R&S FSW67 ‒ is the only instrument on the market to cover the frequency range from 2 Hz to 67 GHz in a single sweep. TheR&S FSW67 simplifies test setups. It does away with external harmonic mixers and therefore requires no complex cabling. Image frequencies and other spurious emissions caused by harmonic mixing are suppressed.
T h a n k s t o i t s u n i q u e a n a l y s i s bandwidth of up to 320 MHz, the R&S FSW67 also measures wideband, hopping and chirp signals. Until now, this required complicated test setups consisting of a digital oscilloscope and a downconverter, for example.
Users can now eas i ly per form spectrum measurements and modulation measurements in the 60 GHz band. The R&S FSW67 is therefore not only useful in the development, testing, verification and production of transmitters and components for radar applications, satellite and military communications systems. The analyzer also provides valuable assistance when performing development tasks relating to fast wireless communications based, for example, on WiGig (IEEE 802.11ad) or WirelessHD.
The R&S FSW67 offers outstanding RF characteristics. Its integrated preamplifier up to 67 GHz makes it very sensitive even in this high frequency range. The smallest of spurious will be detected, and noise figures of components will be measured with high precision. Featuring a phase noise of -111 dBc (Hz) at 10 kHz offset from the carrier at 67 GHz, the analyzer offers a high dynamic range even for measurements close to the carrier. This keeps inherent instrument errors especially low during signal analysis. The R&S FSW67 also provides high reproducibility of results.
The integrated multistandard radio analyzer (MSRA) measures spectrum and
19Oct • Nov • Dec 2013 Cal Lab: The International Journal of Metrology
NEW PRODUCTS AND SERVICES
modulation parameters of signals with different modulations simultaneously, and also correlates these signals in time. With the MSRA function, users can efficiently analyze how and why different signals affect each other. The 12.1» (31 cm) touchscreen interface makes operation very convenient, especially for complex measurement tasks. The MultiView function allows users to simultaneously display multiple measurements and applications.
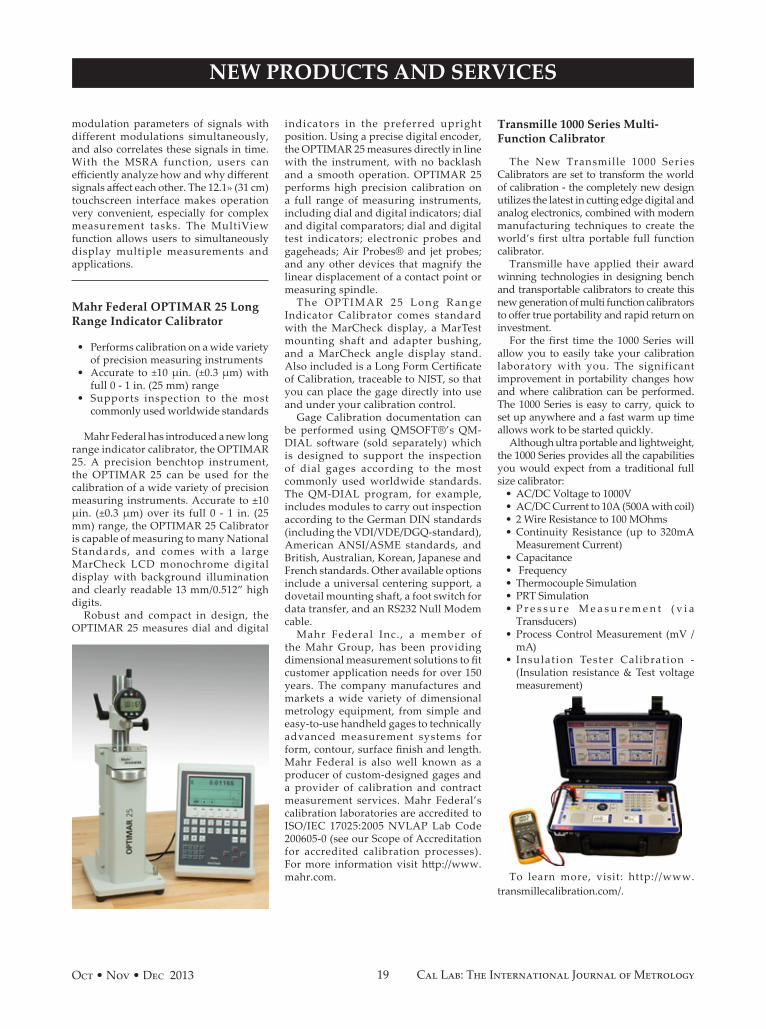
Mahr Federal OPTIMAR 25 Long Range Indicator Calibrator
• Performs calibration on a wide variety of precision measuring instruments
• Accurate to ±10 µin. (±0.3 µm) with full 0 - 1 in. (25 mm) range
• Supports inspection to the most commonly used worldwide standards
Mahr Federal has introduced a new long range indicator calibrator, the OPTIMAR 25. A precision benchtop instrument, the OPTIMAR 25 can be used for the calibration of a wide variety of precision measuring instruments. Accurate to ±10 µin. (±0.3 µm) over its full 0 - 1 in. (25 mm) range, the OPTIMAR 25 Calibrator is capable of measuring to many National Standards, and comes with a large MarCheck LCD monochrome digital display with background illumination and clearly readable 13 mm/0.512” high digits.
Robust and compact in design, the OPTIMAR 25 measures dial and digital
indicators in the preferred upright position. Using a precise digital encoder, the OPTIMAR 25 measures directly in line with the instrument, with no backlash and a smooth operation. OPTIMAR 25 performs high precision calibration on a full range of measuring instruments, including dial and digital indicators; dial and digital comparators; dial and digital test indicators; electronic probes and gageheads; Air Probes® and jet probes; and any other devices that magnify the linear displacement of a contact point or measuring spindle.
The OPTIMAR 25 Long Range Indicator Calibrator comes standard with the MarCheck display, a MarTest mounting shaft and adapter bushing, and a MarCheck angle display stand. Also included is a Long Form Certificate of Calibration, traceable to NIST, so that you can place the gage directly into use and under your calibration control.
Gage Calibration documentation can be performed using QMSOFT®’s QM-DIAL software (sold separately) which is designed to support the inspection of dial gages according to the most commonly used worldwide standards. The QM-DIAL program, for example, includes modules to carry out inspection according to the German DIN standards (including the VDI/VDE/DGQ-standard), American ANSI/ASME standards, and British, Australian, Korean, Japanese and French standards. Other available options include a universal centering support, a dovetail mounting shaft, a foot switch for data transfer, and an RS232 Null Modem cable.
Mahr Federal Inc. , a member of the Mahr Group, has been providing dimensional measurement solutions to fit customer application needs for over 150 years. The company manufactures and markets a wide variety of dimensional metrology equipment, from simple and easy-to-use handheld gages to technically advanced measurement systems for form, contour, surface finish and length. Mahr Federal is also well known as a producer of custom-designed gages and a provider of calibration and contract measurement services. Mahr Federal’s calibration laboratories are accredited to ISO/IEC 17025:2005 NVLAP Lab Code 200605-0 (see our Scope of Accreditation for accredited calibration processes). For more information visit http://www.mahr.com.
Transmille 1000 Series Multi- Function Calibrator
The New Transmille 1000 Series Calibrators are set to transform the world of calibration - the completely new design utilizes the latest in cutting edge digital and analog electronics, combined with modern manufacturing techniques to create the world’s first ultra portable full function calibrator.
Transmille have applied their award winning technologies in designing bench and transportable calibrators to create this new generation of multi function calibrators to offer true portability and rapid return on investment.
For the first time the 1000 Series will allow you to easily take your calibration laboratory with you. The significant improvement in portability changes how and where calibration can be performed. The 1000 Series is easy to carry, quick to set up anywhere and a fast warm up time allows work to be started quickly.
Although ultra portable and lightweight, the 1000 Series provides all the capabilities you would expect from a traditional full size calibrator:
• AC/DC Voltage to 1000V • AC/DC Current to 10A (500A with coil) • 2 Wire Resistance to 100 MOhms • Continuity Resistance (up to 320mA
Measurement Current)• Capacitance • Frequency • Thermocouple Simulation• PRT Simulation • P r e s s u r e M e a s u r e m e n t ( v i a
Transducers)• Process Control Measurement (mV /
mA)• Insulation Tester Calibration -
(Insulation resistance & Test voltage measurement)
To learn more, visit: http://www.transmillecalibration.com/.
20 Oct • Nov • Dec 2013Cal Lab: The International Journal of Metrology
©2013 Fluke Calibration. 6000509A_EN
Fluke Calibration. Precision, performance, confidence.™
Electrical Temperature Pressure SoftwareFlowRF
Now discover the new gold standard.
Find out how easily the new 5730A can help you improve your lab’s performance. Check out this introductory video. www.fl ukecal.com/5730AVideo
Introducing the new 5730A: the next generation of the world’s most accurate electrical multifunction calibrator.
You’ve trusted this gold standard in calibration for the last 25 years...
• Improved accuracy to reduce the need for guardbanding
• A new color touch screen that reduces setup and calibration time
• Visual Connection Management™ output terminals for safe and reliable test-lead connections
6000509A_double_truck.indd 1-2 7/29/13 3:32 PM
NEW PRODUCTS AND SERVICES
Crystal Engineering Pressure Gauges
Responding to the need for high-pressure products, Crystal Engineering, a leader in high-end portable pressure calibrators and digital test gauges, has introduced a 15,000 psi version of its popular XP2i test gauge. The ultra-rugged, intrinsically safe, easy-to-use test gauge joins the recently released GaugeCalHP Pressure Comparator and nVision Reference Recorder among the high-pressure instruments offered by Crystal Engineering.
The one-year XP2i accuracy specification is 0.1% of reading with digital temperature compensation from -10 to 50°C. Each gauge includes an ISO 17025, NIST-traceable, calibration certificate with test data at 5 temperatures.
Key features include an IP-67 rated, marine-grade enclosure (submersible up to 1 meter), a fast pressure safety valve (PSV) mode, custom engineering units, and the leak-free Crystal pressure fitting
connection. The dual display version adds additional features, including leak rate, t a r e m o d e , a n d differential pressure (when connected to a second XP2i).
With the optional DataLoggerXP upgrade, users can record up to 32,000 data points and export the data into an easy-to-read Excel document. A new battery-optimizing, Ultra-Low Power (ULP) mode, allows more than an entire year of continuous recording on one set of AA batteries.
The new CrystalCalHP “Calibration Lab in a Box” now includes the new range and offers 0.1% of reading accuracy from 200 - 15,000 psi.
For more information, contact Crystal Engineering, 708 Fiero Lane, Suite 9, San Luis Obispo, CA 93401, USA. Telephone: 1-(800)-444-1850. Fax: 1-(805) 595-5466. Or visit crystalengineering.net/xp2i.
Agilent Technologies PNA Metrology Option
Agilent Technologies Inc. introduces a metrology option for its PNA family of network analyzers that offers national metrology institutes and calibration laboratories around the world the ultimate in S-parameter measurement accuracy.
Stability and measurement accuracy are key characteristics metrology laboratories look for in a network analyzer. Most solution providers, however, fail to characterize the thermal stability of their instruments. With no specific data on stability, laboratories are unable to determine its impact on resulting measurements.
Agilent’s new metrology option employs a unique technique for accurately characterizing the thermal stability of its network analyzers, independent of the effects from cables and adapters. The technique provides 48 hours of stabilization data that accurately characterizes instrument drift stored on the analyzer’s
21Oct • Nov • Dec 2013 Cal Lab: The International Journal of Metrology
©2013 Fluke Calibration. 6000509A_EN
Fluke Calibration. Precision, performance, confidence.™
Electrical Temperature Pressure SoftwareFlowRF
Now discover the new gold standard.
Find out how easily the new 5730A can help you improve your lab’s performance. Check out this introductory video. www.fl ukecal.com/5730AVideo
Introducing the new 5730A: the next generation of the world’s most accurate electrical multifunction calibrator.
You’ve trusted this gold standard in calibration for the last 25 years...
• Improved accuracy to reduce the need for guardbanding
• A new color touch screen that reduces setup and calibration time
• Visual Connection Management™ output terminals for safe and reliable test-lead connections
6000509A_double_truck.indd 1-2 7/29/13 3:32 PM
NEW PRODUCTS AND SERVICES
hard drive. This data can be used to calculate measurement uncertainty.
In addition, the new metrology option has optimized the raw performance of the PNA family to address the specific measurement needs of metrology laboratories. For example, all front-panel loops were removed to improve stability. The PNA’s raw source match and load match were also optimized. Breakthrough receiver linearity was realized by specialized hardware techniques based on Agilent’s in-house semiconductor processes.
Agilent’s PNA family of network analyzers includes the PNA-L, PNA and PNA-X Series, covering frequencies from 300 kHz to 1.05 THz. The PNA family’s CPU and operating system can be upgraded as technologies evolve.Agilent’s new metrology option is now available on both two-port and four-port versions of all PNA frequency models up to 67 GHz. More information on the PNA metrology option is available at www.agilent.com/find/pna.
Beamex PGL & PGPH Calibration Pumps
Beamex has expanded its pump range with two new pumps: PGL and PGPH. The PGL pump is a low-pressure calibration pump with excellent possibilities for very fine adjustments. The pump is ideal in industries where accurate, low-pressure generation is needed, such as the pharmaceutical industry. The PGHP pump is a pneumatic, high-pressure generator with air as the pressure medium. This pump is a practical, high-quality solution in calibrations where using liquids is forbidden, such as the gas industry.
The PGPH is a hand-operated, pneumatic, (uses air as the pressure medium) high-pressure calibration pump for table-top use. The pump is extremely efficient in generating pressure up to 140 bar (2,000 psi) quickly and effortlessly. It takes far less than a minute to reach the maximum pressure. The PGPH is also able to generate vacuum. It is equipped with a
fine-adjustment control providing excellent fine-tuning of generated pressure, and two hand-tightened connectors allowing fast and easy connections without the need for any tools.
The PGL is a hand-operated calibration pump for low pressure using air as its pressure medium. The pressure range of the PGL is ±400 mbar / ±160 iwc.
The pump is equipped with an isothermal bellows chamber for reducing possible environmental temperature changes during the calibration process. With the screw-operated volume control and fine adjustment, an extremely accurate and stable pressure adjustment is possible, enabling attunement to 0.1 Pa.
For more info, visit: www.beamex.com.

22 Oct • Nov • Dec 2013Cal Lab: The International Journal of Metrology
NEW PRODUCTS AND SERVICES
Agilent Technologies Engineers Author X-Parameters Book
A g i l e n t T e c h n o l o g i e s I n c . a n n o u n c e d t h e r e l e a s e o f “ X - P a r a m e t e r s : Characterization, M o d e l i n g , a n d Design of Nonlinear RF and Microwave C o m p o n e n t s , ” a b o o k o n t h e c o m p a n y ’ s
breakthrough nonlinear X-parameters measurement, modeling and simulation technology. Published by Cambridge University Press, the book offers readers the definitive guide to X-parameters theory, including real-world examples.
The book was written by Agilent scientists and engineers David E. Root, Jan Verspecht, Jason Horn and Mihai Marcu, four of the original inventors and deve lopers o f th i s powerfu l new paradigm for nonlinear RF and microwave components and systems. The authors are recognized across industry and academia as leading experts in modeling, simulation and measurement science.
The book lays the foundations for X-parameter technology and provides practical cases that give readers useful approximations. These approximations can be used to greatly reduce the complexity of measuring, modeling and designing for nonlinear regimes of operation. The book also teaches readers how to use X-parameters to overcome intricate problems in nonlinear RF and microwave engineering.
The book also contains real-world case studies, definitions of standard symbols and notation, detailed derivations within the appendices, and exercises with solutions. With such an array of content, it is the definitive stand-alone reference for researchers, engineers, scientists and students who want to remain on the cutting edge of RF and microwave engineering.
“X-Parameters: Characterization, Modeling, and Design of Nonlinear RF and Microwave Components” can be ordered from Amazon or Cambridge University Press. For more information on X-parameters go to www.agilent.com/find/x-parameters.
Thyracont Smartline Vacuum Transmitter
The Smartline family presents itself completely redesigned. Packed in stable, fail-safe full metal housing, they combine modern design with intelligent technology in an elegant way. As a new member of the family, the vacuum Smartline Transmitter VSR aims at applications in the load lock, analysis technology, coating and process engineering.
T h e s e n s o r c o m b i n a t i o n o f piezoresistive sensor and Pirani filament, used in the VSR, measures from 1200 hPa (900 Torr) to 1e-4 hPa (Torr) with optimal resolution and high accuracy. High process reliability is ensured by outstanding long-term stability, excellent re pr odu c i b i l i t y an d t e mp era t u re compensation—achieved by Thyracont’s 4-point calibration.
All transmitters of the new Smart Line generation offer an analog output as well as a digital RS485 interface. Optionally, the transmitters are available with EtherCAT. Due to the integrated, large LCD display (optional) with backlight, the pressure can be read directly at the test site. The measuring heads of the combination sensors are easily interchangeable.
A b o u t T h y r a c o n t V a c u u m Instruments GmbH Thyracont Vacuum Instruments GmbH (www.thyracont.com) manufactures high quality vacuum measurement and control instruments for the whole measuring range from rough to ultra high vacuum. Customers include manufacturers of vacuum pumps and vacuum systems, process and equipment engineers in industry, laboratories, universities and research institutes.
Giga-tronics Ultra-Wideband Microwave Power Amplifiers
Giga-tronics has introduced the GT-1000B option 06 and the GT-1050B/GT-1051B Solid-State Ultra-Wideband Microwave Power Amplifiers which cover 100 MHz to 20 GHz and 10 MHz/2 GHz to 50 GHz respectively, with high output power, low noise figure and low harmonics in a single amplifier. Designed using Broadband MMIC technology, the GT-1000B option 06 provides 5 Watts from 100 MHz to 18 GHz and the GT-1050B/GT-1051B provides ½ Watt (+27 dBm) at 40 GHz and ¼ Watt (+24 dBm) at 50 GHz with high gain and low noise figure. This ultra-wideband capability eliminates the need to switch between multiple narrow band amplifiers resulting in improved performance and savings in time and expense.
These ultra-wideband amplifiers provider higher power from microwave signal generators and are easily placed closer to the device under test or integrated into automated test systems to overcome cable and signal switching losses. The low noise figure makes them excellent preamps for spectrum analyzers and EMC receivers.
The +/- 3.5 dB typical gain flatness performance outperforms multiple narrow band ampl i f iers , and the amplifiers feature high reverse isolation, excellent input and output match and the long life and high reliability of solid-state technology.
Datasheets, app notes, white papers and video clips are available on the Giga-tronics website at www.gigatronics.com. Delivery is 6 to 8 weeks ARO. Please contact your Giga-tronics sales representative for pricing.
23Oct • Nov • Dec 2013 Cal Lab: The International Journal of Metrology
NEW PRODUCTS AND SERVICES
Sorensen Lab DC Power Supply
AMETEK Programmable Power (www.programmablepower.com), the global leader in programmable AC and DC power test solutions, has expanded its Sorensen XPF60-20 Series line of DC laboratory power supplies.
The new XPF60-20S unit is a single output version of the dual output XPF60-20D. It provides up to 60V and 20A within its 420W power envelope, all in a one quarter rack width x 3U height that uses the minimum possible space for either bench or rack mounting. Since the XPF60-20S has manual control, it will most often find use in conventional bench-top use. The Series, which offers both analog and digital control, features easier-to-use analog controls without sacrificing digital stability.
The Sorensen XPF60-20S and 20D outperform competitive units due to Sorensen’s PowerFlex switch mode technology design. PowerFlex switch-mode technology generates higher currents at lower voltages within an overall power limit envelope. This is an advantage over traditional power supplies that have a fixed current limit for a power capability that reduces directly with the output voltage.
Al l XPF60-20 Ser ies units of fer connectivity via GPIB, RS-232, USB, LAN and LXI Class C.
The line’s XPF60-20D model is a dual output DC power supply with two completely independent and isolated outputs. The outputs can be wired in series or parallel to achieve up to 120V or 40A within a total power envelope of 840W. Users can set voltages with coarse and fine controls and set currents by a single logarithmic control. An S-Lock (Settings Lock) switches between voltage and current settings and locks them in with a press of the button. This ensures that settings don’t drift over time or are accidently changed.
To learn more about any of the AMETEK’s programmable power supplies and programmable loads, contact AMETEK Programmable Power Sales toll free at 800-733-5427, or 858-458-0223, or by email at [email protected]. Users also can contact an authorized AMETEK Programmable Power sales representative, who can be located by visiting http://www.programmablepower.com/contact/.
Ultra Flexible Low PIM Test Cable
MegaPhase is pleased to announce the release of its new ultra flexible low PIM T&M cable to help protect against signal distortion. Featuring our crush-resistant
GrooveTube® Technology for precision testing, offering high reliability with repeatable measurements. The PIM Series includes non-ferrous connectors with tri-metal plating available in Type N, 7/16 DIN and SMA.
The PIM Series product line was developed for our customers’ designing and manufacturing the next generation of mobile communications platforms. Our low PIM cables offer IM performance of -165 dBc, all products are tested for PIM and s-parameters (10-8000 MHz).
MegaPhase offers the FASTEST LEAD TIMES in the industry. Check out the NEW Low PIM Test Cable available now only from MegaPhase.
To receive a quote please contact [email protected] or call us direct at 570-424-8400.
Krohn-Hite 8 Channel Differential Preamplifier
The new Krohn-Hite Model 7008 Multichannel Differential Preamplifier provides up to 8 channels of low noise (7nV√Hz), high gain amplification to 1MHz. Fixed gains of x1 (0dB), x10 (20dB), x100 (40dB) and x1000 (60dB) are available with a common mode rejection >100dB.
A 2-line, 20-character display indicates each channels setup and is used as a monitor when in remote operation. Pushbutton switches control coupling, bandwidth, gain, filtering, shunt resistor selection, input configuration, remote/local operation, and channel on/off. All input and output connections are BNC. Optional USB or LAN remote control are available.
The Model 7008 is ideal for a wide variety of applications: temperature measurements, audio engineering, radio astronomy, optical detection, process control, and a general purpose signal amplifier.
Prices start at $1925 for one channel to $5950 for 8 channels. Web: www.krohn-hite.com.
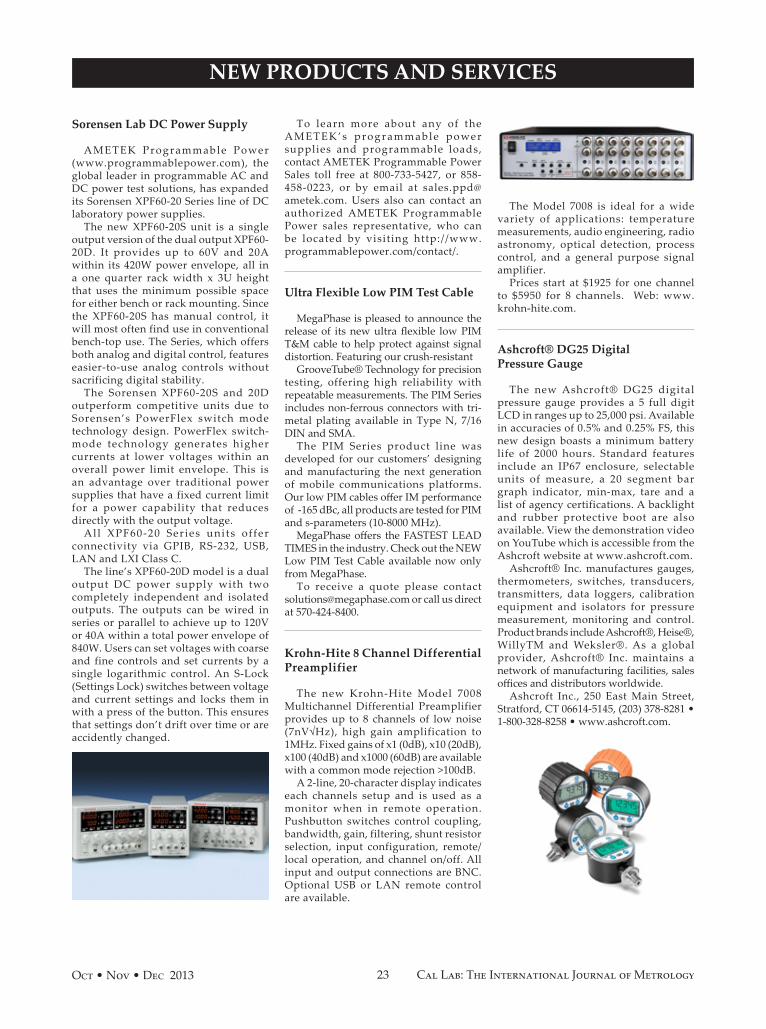
Ashcroft® DG25 Digital Pressure Gauge
The new Ashcroft® DG25 digital pressure gauge provides a 5 full digit LCD in ranges up to 25,000 psi. Available in accuracies of 0.5% and 0.25% FS, this new design boasts a minimum battery life of 2000 hours. Standard features include an IP67 enclosure, selectable units of measure, a 20 segment bar graph indicator, min-max, tare and a list of agency certifications. A backlight and rubber protective boot are also available. View the demonstration video on YouTube which is accessible from the Ashcroft website at www.ashcroft.com.
Ashcroft® Inc. manufactures gauges, thermometers, switches, transducers, transmitters, data loggers, calibration equipment and isolators for pressure measurement, monitoring and control. Product brands include Ashcroft®, Heise®, WillyTM and Weksler®. As a global provider, Ashcroft® Inc. maintains a network of manufacturing facilities, sales offices and distributors worldwide.
Ashcroft Inc., 250 East Main Street, Stratford, CT 06614-5145, (203) 378-8281 • 1-800-328-8258 • www.ashcroft.com.
24 Oct • Nov • Dec 2013Cal Lab: The International Journal of Metrology
Origins of Two-Pressure
In 1948 at the U.S. National Bureau of Standards (now the National Institute of Standards and Technology), E.R. Weaver and R. Riley developed a “pressure method” for the generation and control of humidity. Their method, termed the two-pressure principle, was derived from measurements of temperature and pressure rather than requiring measurements of water vapor.
Using their technique, air or some other gas was saturated with water vapor at high pressure and then expanded to a lower pressure. When saturation and expansion were performed under constant-temperature conditions, the resulting relative humidity of the gas was simply the ratio of the lower pressure to the higher pressure (or at least very nearly).
Their equipment was designed for low rates of gas flow and was used under ambient temperature conditions. Their saturator was a small cylinder containing water and filled with fragments of pumice or stream-washed gravel through which the gas could be bubbled under pressure. This device was developed primarily for the calibration of electrically conductive hygroscopic films used in the measurement of water vapor in gases.
In 1951, also at the National Bureau of Standards, the two-pressure principle was the foundation on which A. Wexler [1] and R.D. Daniels developed a new “pressure–humidity apparatus” with higher air-flow capability. Another significant improvement was the incorporation of temperature control. Developed primarily for hygrometer research and calibration, it was capable of producing atmospheres of known relative humidity from 10 %RH to 98 %RH over a temperature range –40 °C to +40 °C.
After about twenty-five years of service, this pressure-humidity apparatus was replaced by a newer model, the Mark 2 (which was later referred to as Mark II). This Mark II generator [2] allowed for a wider range of temperature and humidity with improved uncertainty in the generated output.
The Two-Pressure Principle
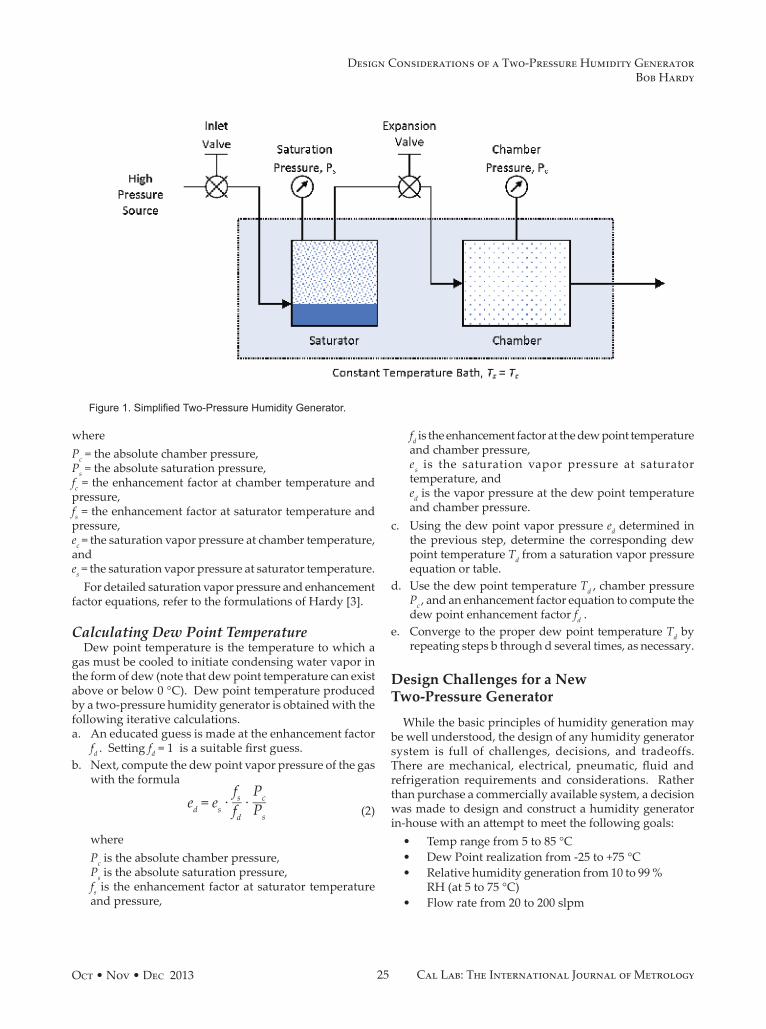
In an ideal two-pressure system, a stream of gas at an elevated pressure is saturated with respect to the liquid or solid phase of water and then expanded isothermally to a lower pressure. Measurements of the pressure and temperature of the gas stream, both at saturation and after expansion, are all that is required to determine the resulting humidity content of the expanded gas stream. The basic two-pressure system is shown in Figure 1.
A two-pressure generator is commonly used in the generation of a range of relative humidity values at various temperatures and for realization of the dew point temperature.
Calculating Relative HumidityPercent relative humidity is the ratio of the amount of
water vapor in a gas to the maximum amount possible at the same temperature and pressure. The relative humidity produced by a two-pressure system is obtained using the following formula.
(1)
Design Considerations of a Two-Pressure Humidity Generator
Bob HardyRH Systems, LLC
The two-pressure humidity generation technique is a well-known, highly documented method used for precise control of humidity values. This straight-forward method is in practice world-wide in a large number of standards and calibration laboratories, and is most common in the generation of %RH in the range of 10% to 98%, and for realization of the dew point temperature. While there are systems commercially available, it is commonplace in National Metrology Institutes (NMI) to design and construct the system locally with a goal to build a generator better than those used by their foreign colleagues. Generators that are designed, constructed, and offered commercially are also commonly used in NMIs and other calibration laboratories. While the humidity generating technique remains the same, it is often size, cost, and user-interface that distinguish commercially produced systems from their locally constructed cousins. Regardless of whether a system is commercially available or locally constructed, some areas of two-pressure generator design warrant consideration. Some common problems and potential solutions will be discussed.
RH = P c ___ P s
∙ f s __ f c
∙ e s __ e c
∙ 100
25Oct • Nov • Dec 2013 Cal Lab: The International Journal of Metrology
wherePc = the absolute chamber pressure, Ps = the absolute saturation pressure,fc = the enhancement factor at chamber temperature and pressure,fs = the enhancement factor at saturator temperature and pressure,ec = the saturation vapor pressure at chamber temperature, and es = the saturation vapor pressure at saturator temperature.
For detailed saturation vapor pressure and enhancement factor equations, refer to the formulations of Hardy [3].
Calculating Dew Point TemperatureDew point temperature is the temperature to which a
gas must be cooled to initiate condensing water vapor in the form of dew (note that dew point temperature can exist above or below 0 °C). Dew point temperature produced by a two-pressure humidity generator is obtained with the following iterative calculations. a. An educated guess is made at the enhancement factor
fd . Setting fd = 1 is a suitable first guess. b. Next, compute the dew point vapor pressure of the gas
with the formula
(2)
wherePc is the absolute chamber pressure, Ps is the absolute saturation pressure,fs is the enhancement factor at saturator temperature and pressure,
fd is the enhancement factor at the dew point temperature and chamber pressure,es is the saturation vapor pressure at saturator temperature, and ed is the vapor pressure at the dew point temperature and chamber pressure.
c. Using the dew point vapor pressure ed determined in the previous step, determine the corresponding dew point temperature Td from a saturation vapor pressure equation or table.
d. Use the dew point temperature Td , chamber pressure Pc , and an enhancement factor equation to compute the dew point enhancement factor fd .
e. Converge to the proper dew point temperature Td by repeating steps b through d several times, as necessary.
Design Challenges for a New Two-Pressure Generator
While the basic principles of humidity generation may be well understood, the design of any humidity generator system is full of challenges, decisions, and tradeoffs. There are mechanical, electrical, pneumatic, fluid and refrigeration requirements and considerations. Rather than purchase a commercially available system, a decision was made to design and construct a humidity generator in-house with an attempt to meet the following goals:
• Temp range from 5 to 85 °C• Dew Point realization from -25 to +75 °C• Relative humidity generation from 10 to 99 %
RH (at 5 to 75 °C)• Flow rate from 20 to 200 slpm
Figure 1. Simplified Two-Pressure Humidity Generator.
e d = e s ∙ f s __ f d
∙ P c ___ P s
Design Considerations of a Two-Pressure Humidity GeneratorBob Hardy
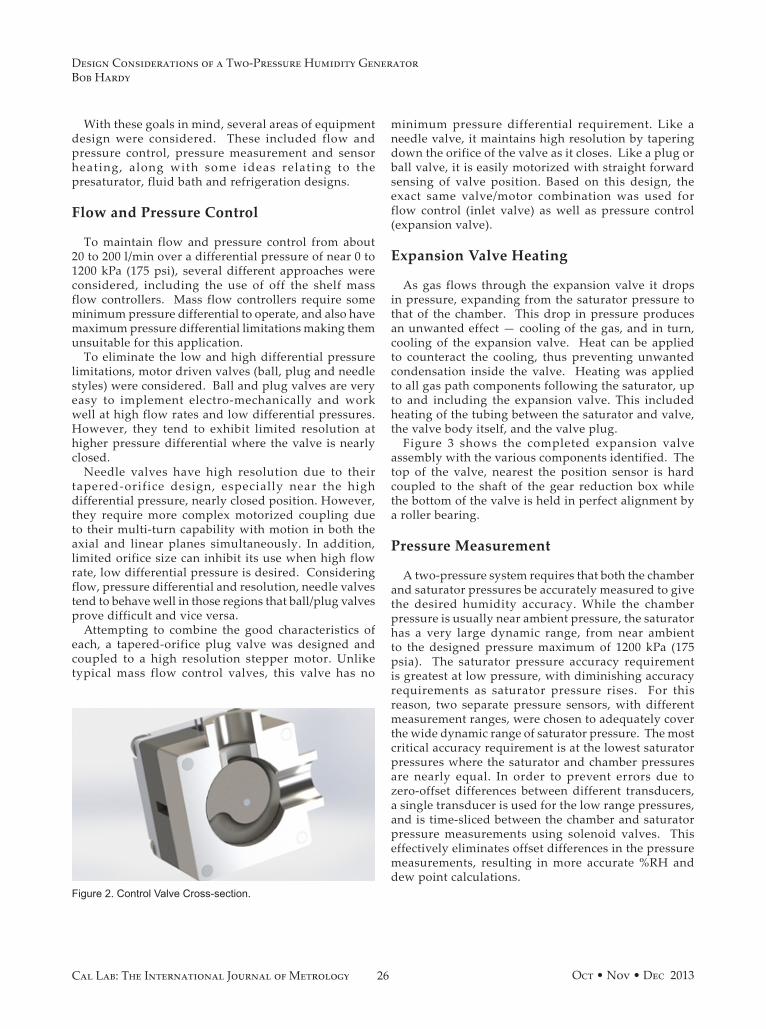
26 Oct • Nov • Dec 2013Cal Lab: The International Journal of Metrology
Figure 2. Control Valve Cross-section.
minimum pressure differential requirement. Like a needle valve, it maintains high resolution by tapering down the orifice of the valve as it closes. Like a plug or ball valve, it is easily motorized with straight forward sensing of valve position. Based on this design, the exact same valve/motor combination was used for flow control (inlet valve) as well as pressure control (expansion valve).
Expansion Valve Heating
As gas flows through the expansion valve it drops in pressure, expanding from the saturator pressure to that of the chamber. This drop in pressure produces an unwanted effect — cooling of the gas, and in turn, cooling of the expansion valve. Heat can be applied to counteract the cooling, thus preventing unwanted condensation inside the valve. Heating was applied to all gas path components following the saturator, up to and including the expansion valve. This included heating of the tubing between the saturator and valve, the valve body itself, and the valve plug.
Figure 3 shows the completed expansion valve assembly with the various components identified. The top of the valve, nearest the position sensor is hard coupled to the shaft of the gear reduction box while the bottom of the valve is held in perfect alignment by a roller bearing.
Pressure Measurement
A two-pressure system requires that both the chamber and saturator pressures be accurately measured to give the desired humidity accuracy. While the chamber pressure is usually near ambient pressure, the saturator has a very large dynamic range, from near ambient to the designed pressure maximum of 1200 kPa (175 psia). The saturator pressure accuracy requirement is greatest at low pressure, with diminishing accuracy requirements as saturator pressure rises. For this reason, two separate pressure sensors, with different measurement ranges, were chosen to adequately cover the wide dynamic range of saturator pressure. The most critical accuracy requirement is at the lowest saturator pressures where the saturator and chamber pressures are nearly equal. In order to prevent errors due to zero-offset differences between different transducers, a single transducer is used for the low range pressures, and is time-sliced between the chamber and saturator pressure measurements using solenoid valves. This effectively eliminates offset differences in the pressure measurements, resulting in more accurate %RH and dew point calculations.
With these goals in mind, several areas of equipment design were considered. These included flow and pressure control, pressure measurement and sensor heating, along with some ideas relating to the presaturator, fluid bath and refrigeration designs.
Flow and Pressure Control
To maintain flow and pressure control from about 20 to 200 l/min over a differential pressure of near 0 to 1200 kPa (175 psi), several different approaches were considered, including the use of off the shelf mass flow controllers. Mass flow controllers require some minimum pressure differential to operate, and also have maximum pressure differential limitations making them unsuitable for this application.
To eliminate the low and high differential pressure limitations, motor driven valves (ball, plug and needle styles) were considered. Ball and plug valves are very easy to implement electro-mechanically and work well at high flow rates and low differential pressures. However, they tend to exhibit limited resolution at higher pressure differential where the valve is nearly closed.
Needle valves have high resolution due to their tapered-orifice design, especially near the high differential pressure, nearly closed position. However, they require more complex motorized coupling due to their multi-turn capability with motion in both the axial and linear planes simultaneously. In addition, limited orifice size can inhibit its use when high flow rate, low differential pressure is desired. Considering flow, pressure differential and resolution, needle valves tend to behave well in those regions that ball/plug valves prove difficult and vice versa.
Attempting to combine the good characteristics of each, a tapered-orifice plug valve was designed and coupled to a high resolution stepper motor. Unlike typical mass flow control valves, this valve has no
Design Considerations of a Two-Pressure Humidity GeneratorBob Hardy
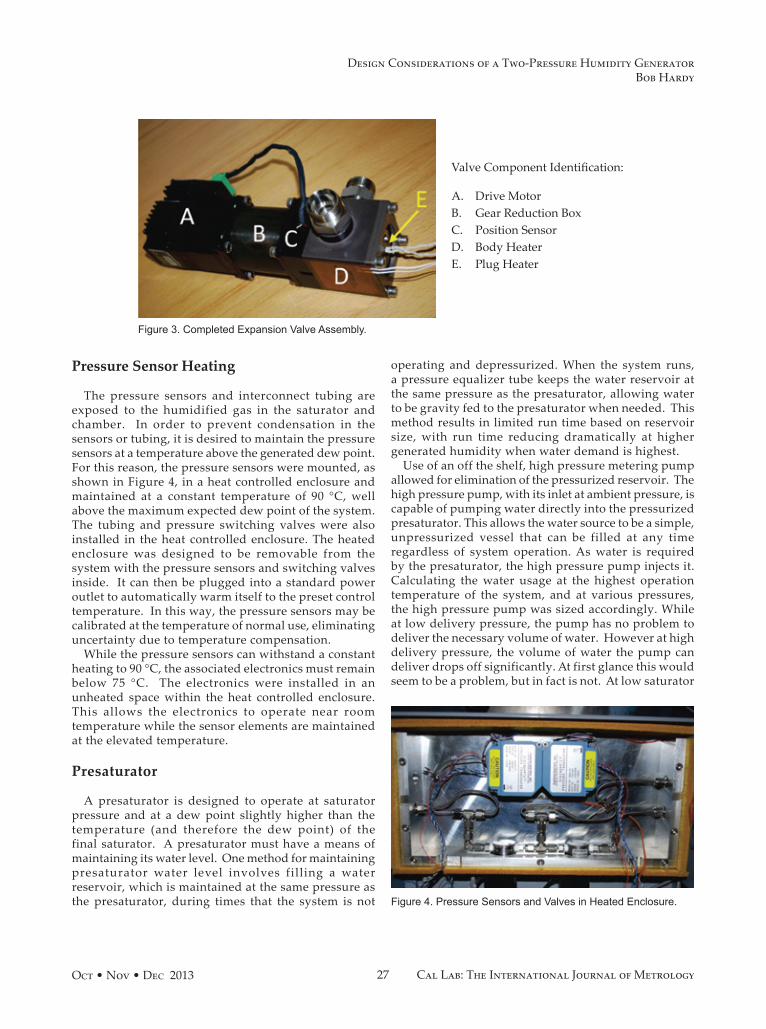
27Oct • Nov • Dec 2013 Cal Lab: The International Journal of Metrology
Pressure Sensor Heating
The pressure sensors and interconnect tubing are exposed to the humidified gas in the saturator and chamber. In order to prevent condensation in the sensors or tubing, it is desired to maintain the pressure sensors at a temperature above the generated dew point. For this reason, the pressure sensors were mounted, as shown in Figure 4, in a heat controlled enclosure and maintained at a constant temperature of 90 °C, well above the maximum expected dew point of the system. The tubing and pressure switching valves were also installed in the heat controlled enclosure. The heated enclosure was designed to be removable from the system with the pressure sensors and switching valves inside. It can then be plugged into a standard power outlet to automatically warm itself to the preset control temperature. In this way, the pressure sensors may be calibrated at the temperature of normal use, eliminating uncertainty due to temperature compensation.
While the pressure sensors can withstand a constant heating to 90 °C, the associated electronics must remain below 75 °C. The electronics were installed in an unheated space within the heat controlled enclosure. This allows the electronics to operate near room temperature while the sensor elements are maintained at the elevated temperature.
Presaturator
A presaturator is designed to operate at saturator pressure and at a dew point slightly higher than the temperature (and therefore the dew point) of the final saturator. A presaturator must have a means of maintaining its water level. One method for maintaining presaturator water level involves filling a water reservoir, which is maintained at the same pressure as the presaturator, during times that the system is not
operating and depressurized. When the system runs, a pressure equalizer tube keeps the water reservoir at the same pressure as the presaturator, allowing water to be gravity fed to the presaturator when needed. This method results in limited run time based on reservoir size, with run time reducing dramatically at higher generated humidity when water demand is highest.
Use of an off the shelf, high pressure metering pump allowed for elimination of the pressurized reservoir. The high pressure pump, with its inlet at ambient pressure, is capable of pumping water directly into the pressurized presaturator. This allows the water source to be a simple, unpressurized vessel that can be filled at any time regardless of system operation. As water is required by the presaturator, the high pressure pump injects it. Calculating the water usage at the highest operation temperature of the system, and at various pressures, the high pressure pump was sized accordingly. While at low delivery pressure, the pump has no problem to deliver the necessary volume of water. However at high delivery pressure, the volume of water the pump can deliver drops off significantly. At first glance this would seem to be a problem, but in fact is not. At low saturator
Valve Component Identification:
A. Drive MotorB. Gear Reduction BoxC. Position SensorD. Body HeaterE. Plug Heater
Figure 3. Completed Expansion Valve Assembly.
Figure 4. Pressure Sensors and Valves in Heated Enclosure.
Design Considerations of a Two-Pressure Humidity GeneratorBob Hardy
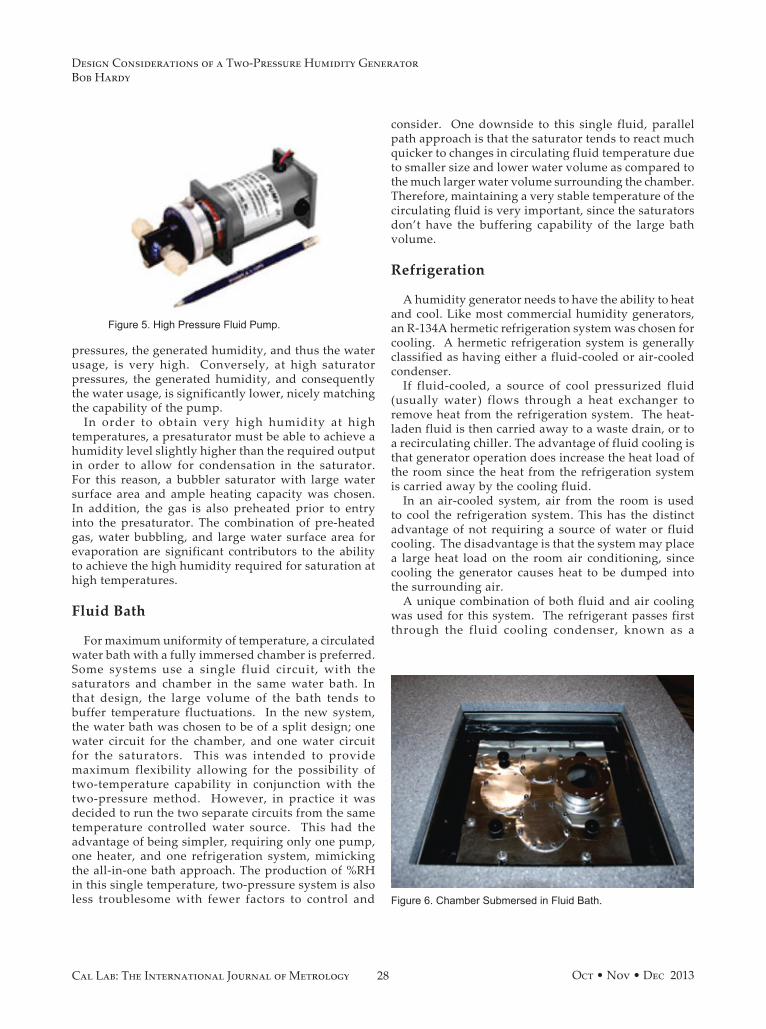
28 Oct • Nov • Dec 2013Cal Lab: The International Journal of Metrology
consider. One downside to this single fluid, parallel path approach is that the saturator tends to react much quicker to changes in circulating fluid temperature due to smaller size and lower water volume as compared to the much larger water volume surrounding the chamber. Therefore, maintaining a very stable temperature of the circulating fluid is very important, since the saturators don’t have the buffering capability of the large bath volume.
Refrigeration
A humidity generator needs to have the ability to heat and cool. Like most commercial humidity generators, an R-134A hermetic refrigeration system was chosen for cooling. A hermetic refrigeration system is generally classified as having either a fluid-cooled or air-cooled condenser.
If fluid-cooled, a source of cool pressurized fluid (usually water) flows through a heat exchanger to remove heat from the refrigeration system. The heat-laden fluid is then carried away to a waste drain, or to a recirculating chiller. The advantage of fluid cooling is that generator operation does increase the heat load of the room since the heat from the refrigeration system is carried away by the cooling fluid.
In an air-cooled system, air from the room is used to cool the refrigeration system. This has the distinct advantage of not requiring a source of water or fluid cooling. The disadvantage is that the system may place a large heat load on the room air conditioning, since cooling the generator causes heat to be dumped into the surrounding air.
A unique combination of both fluid and air cooling was used for this system. The refrigerant passes first through the fluid cooling condenser, known as a
pressures, the generated humidity, and thus the water usage, is very high. Conversely, at high saturator pressures, the generated humidity, and consequently the water usage, is significantly lower, nicely matching the capability of the pump.
In order to obtain very high humidity at high temperatures, a presaturator must be able to achieve a humidity level slightly higher than the required output in order to allow for condensation in the saturator. For this reason, a bubbler saturator with large water surface area and ample heating capacity was chosen. In addition, the gas is also preheated prior to entry into the presaturator. The combination of pre-heated gas, water bubbling, and large water surface area for evaporation are significant contributors to the ability to achieve the high humidity required for saturation at high temperatures.
Fluid Bath
For maximum uniformity of temperature, a circulated water bath with a fully immersed chamber is preferred. Some systems use a single fluid circuit, with the saturators and chamber in the same water bath. In that design, the large volume of the bath tends to buffer temperature fluctuations. In the new system, the water bath was chosen to be of a split design; one water circuit for the chamber, and one water circuit for the saturators. This was intended to provide maximum flexibility allowing for the possibility of two-temperature capability in conjunction with the two-pressure method. However, in practice it was decided to run the two separate circuits from the same temperature controlled water source. This had the advantage of being simpler, requiring only one pump, one heater, and one refrigeration system, mimicking the all-in-one bath approach. The production of %RH in this single temperature, two-pressure system is also less troublesome with fewer factors to control and
Figure 5. High Pressure Fluid Pump.
Figure 6. Chamber Submersed in Fluid Bath.
Design Considerations of a Two-Pressure Humidity GeneratorBob Hardy
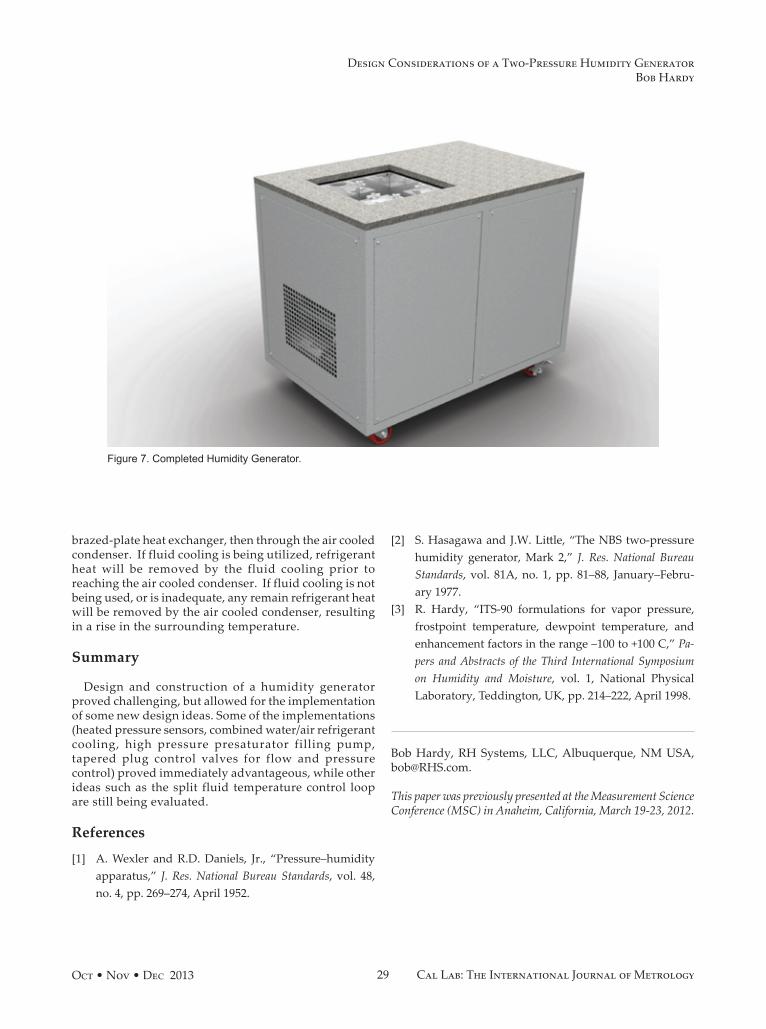
29Oct • Nov • Dec 2013 Cal Lab: The International Journal of Metrology
brazed-plate heat exchanger, then through the air cooled condenser. If fluid cooling is being utilized, refrigerant heat will be removed by the fluid cooling prior to reaching the air cooled condenser. If fluid cooling is not being used, or is inadequate, any remain refrigerant heat will be removed by the air cooled condenser, resulting in a rise in the surrounding temperature.
Summary
Design and construction of a humidity generator proved challenging, but allowed for the implementation of some new design ideas. Some of the implementations (heated pressure sensors, combined water/air refrigerant cooling, high pressure presaturator filling pump, tapered plug control valves for flow and pressure control) proved immediately advantageous, while other ideas such as the split fluid temperature control loop are still being evaluated.
References
[1] A. Wexler and R.D. Daniels, Jr., “Pressure–humidity apparatus,” J. Res. National Bureau Standards, vol. 48, no. 4, pp. 269–274, April 1952.
[2] S. Hasagawa and J.W. Little, “The NBS two-pressure humidity generator, Mark 2,” J. Res. National Bureau Standards, vol. 81A, no. 1, pp. 81–88, January–Febru-ary 1977.
[3] R. Hardy, “ITS-90 formulations for vapor pressure, frostpoint temperature, dewpoint temperature, and enhancement factors in the range –100 to +100 C,” Pa-pers and Abstracts of the Third International Symposium on Humidity and Moisture, vol. 1, National Physical Laboratory, Teddington, UK, pp. 214–222, April 1998.
Bob Hardy, RH Systems, LLC, Albuquerque, NM USA, [email protected].
This paper was previously presented at the Measurement Science Conference (MSC) in Anaheim, California, March 19-23, 2012.
Figure 7. Completed Humidity Generator.
Design Considerations of a Two-Pressure Humidity GeneratorBob Hardy
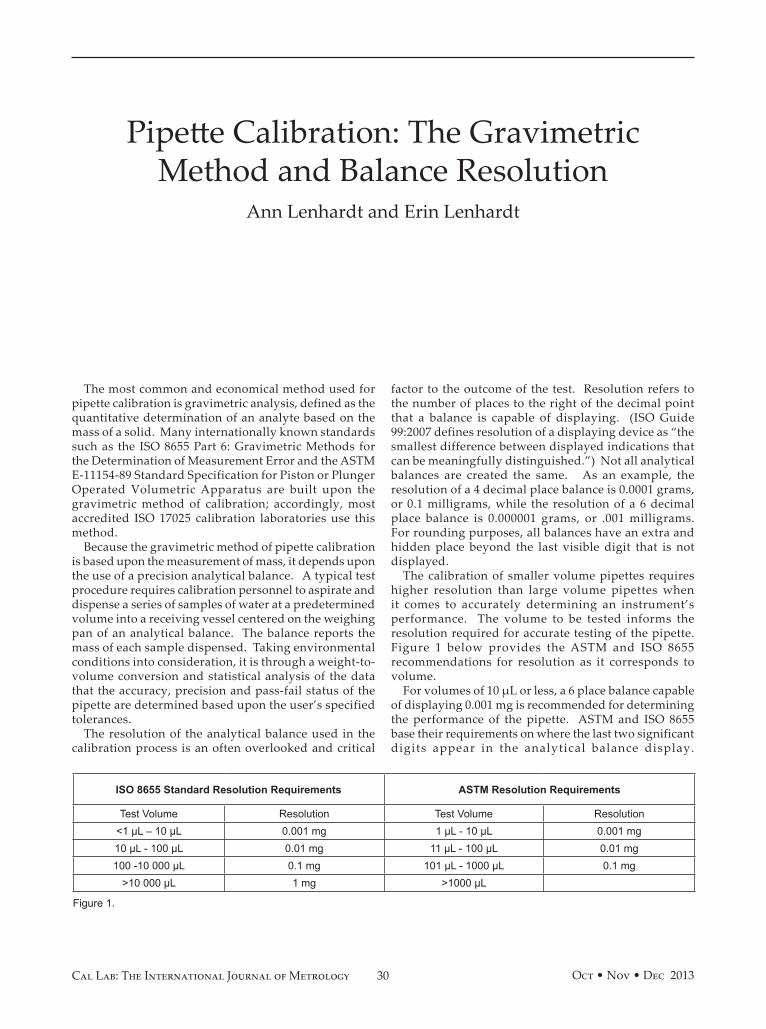
30 Oct • Nov • Dec 2013Cal Lab: The International Journal of Metrology
The most common and economical method used for pipette calibration is gravimetric analysis, defined as the quantitative determination of an analyte based on the mass of a solid. Many internationally known standards such as the ISO 8655 Part 6: Gravimetric Methods for the Determination of Measurement Error and the ASTM E-11154-89 Standard Specification for Piston or Plunger Operated Volumetric Apparatus are built upon the gravimetric method of calibration; accordingly, most accredited ISO 17025 calibration laboratories use this method.
Because the gravimetric method of pipette calibration is based upon the measurement of mass, it depends upon the use of a precision analytical balance. A typical test procedure requires calibration personnel to aspirate and dispense a series of samples of water at a predetermined volume into a receiving vessel centered on the weighing pan of an analytical balance. The balance reports the mass of each sample dispensed. Taking environmental conditions into consideration, it is through a weight-to-volume conversion and statistical analysis of the data that the accuracy, precision and pass-fail status of the pipette are determined based upon the user’s specified tolerances.
The resolution of the analytical balance used in the calibration process is an often overlooked and critical
factor to the outcome of the test. Resolution refers to the number of places to the right of the decimal point that a balance is capable of displaying. (ISO Guide 99:2007 defines resolution of a displaying device as “the smallest difference between displayed indications that can be meaningfully distinguished.”) Not all analytical balances are created the same. As an example, the resolution of a 4 decimal place balance is 0.0001 grams, or 0.1 milligrams, while the resolution of a 6 decimal place balance is 0.000001 grams, or .001 milligrams. For rounding purposes, all balances have an extra and hidden place beyond the last visible digit that is not displayed.
The calibration of smaller volume pipettes requires higher resolution than large volume pipettes when it comes to accurately determining an instrument’s performance. The volume to be tested informs the resolution required for accurate testing of the pipette. Figure 1 below provides the ASTM and ISO 8655 recommendations for resolution as it corresponds to volume.
For volumes of 10 µL or less, a 6 place balance capable of displaying 0.001 mg is recommended for determining the performance of the pipette. ASTM and ISO 8655 base their requirements on where the last two significant digits appear in the analytical balance display.
Pipette Calibration: The Gravimetric Method and Balance Resolution
Ann Lenhardt and Erin Lenhardt
ISO 8655 Standard Resolution Requirements ASTM Resolution Requirements
Test Volume Resolution Test Volume Resolution<1 µL – 10 µL 0.001 mg 1 µL - 10 µL 0.001 mg10 µL - 100 µL 0.01 mg 11 µL - 100 µL 0.01 mg100 -10 000 µL 0.1 mg 101 µL - 1000 µL 0.1 mg
>10 000 µL 1 mg >1000 µL
Figure 1.
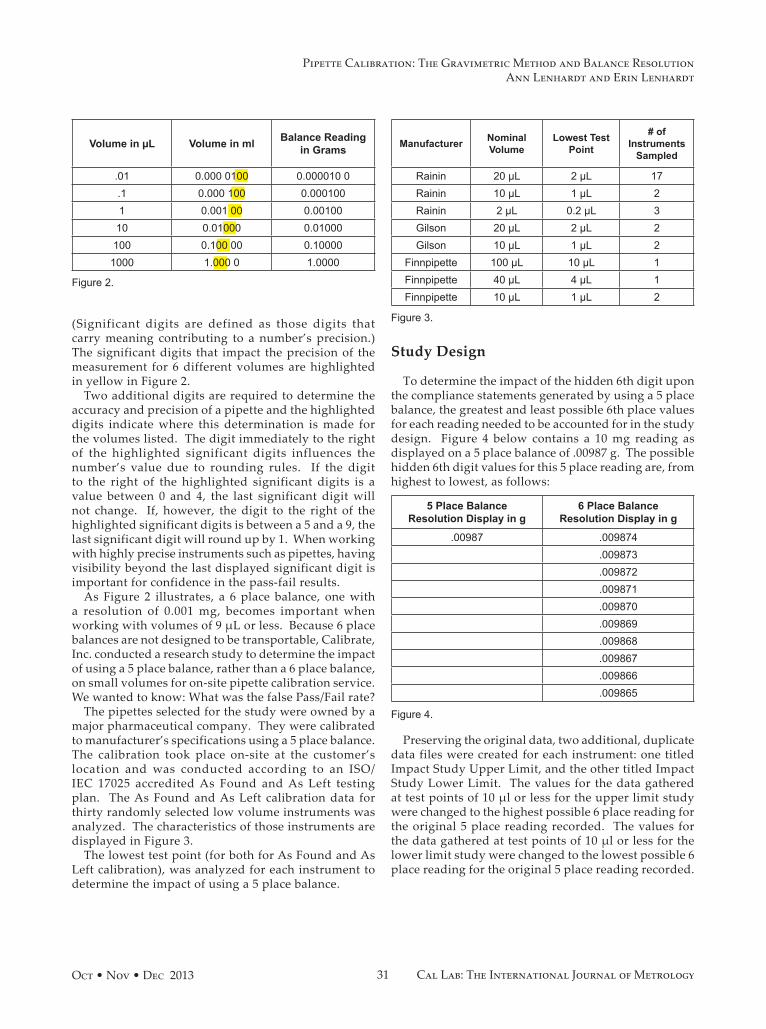
31Oct • Nov • Dec 2013 Cal Lab: The International Journal of Metrology
(Significant digits are defined as those digits that carry meaning contributing to a number’s precision.) The significant digits that impact the precision of the measurement for 6 different volumes are highlighted in yellow in Figure 2.
Two additional digits are required to determine the accuracy and precision of a pipette and the highlighted digits indicate where this determination is made for the volumes listed. The digit immediately to the right of the highlighted significant digits influences the number’s value due to rounding rules. If the digit to the right of the highlighted significant digits is a value between 0 and 4, the last significant digit will not change. If, however, the digit to the right of the highlighted significant digits is between a 5 and a 9, the last significant digit will round up by 1. When working with highly precise instruments such as pipettes, having visibility beyond the last displayed significant digit is important for confidence in the pass-fail results.
As Figure 2 illustrates, a 6 place balance, one with a resolution of 0.001 mg, becomes important when working with volumes of 9 µL or less. Because 6 place balances are not designed to be transportable, Calibrate, Inc. conducted a research study to determine the impact of using a 5 place balance, rather than a 6 place balance, on small volumes for on-site pipette calibration service. We wanted to know: What was the false Pass/Fail rate?
The pipettes selected for the study were owned by a major pharmaceutical company. They were calibrated to manufacturer’s specifications using a 5 place balance. The calibration took place on-site at the customer’s location and was conducted according to an ISO/IEC 17025 accredited As Found and As Left testing plan. The As Found and As Left calibration data for thirty randomly selected low volume instruments was analyzed. The characteristics of those instruments are displayed in Figure 3.
The lowest test point (for both for As Found and As Left calibration), was analyzed for each instrument to determine the impact of using a 5 place balance.
Study Design
To determine the impact of the hidden 6th digit upon the compliance statements generated by using a 5 place balance, the greatest and least possible 6th place values for each reading needed to be accounted for in the study design. Figure 4 below contains a 10 mg reading as displayed on a 5 place balance of .00987 g. The possible hidden 6th digit values for this 5 place reading are, from highest to lowest, as follows:
Preserving the original data, two additional, duplicate data files were created for each instrument: one titled Impact Study Upper Limit, and the other titled Impact Study Lower Limit. The values for the data gathered at test points of 10 µl or less for the upper limit study were changed to the highest possible 6 place reading for the original 5 place reading recorded. The values for the data gathered at test points of 10 µl or less for the lower limit study were changed to the lowest possible 6 place reading for the original 5 place reading recorded.
Volume in µL Volume in ml Balance Reading in Grams
.01 0.000 0100 0.000010 0.1 0.000 100 0.0001001 0.001 00 0.00100
10 0.01000 0.01000100 0.100 00 0.10000
1000 1.000 0 1.0000
Figure 2.
Manufacturer Nominal Volume
Lowest Test Point
# of Instruments
Sampled
Rainin 20 µL 2 µL 17Rainin 10 µL 1 µL 2Rainin 2 µL 0.2 µL 3Gilson 20 µL 2 µL 2Gilson 10 µL 1 µL 2
Finnpipette 100 µL 10 µL 1Finnpipette 40 µL 4 µL 1Finnpipette 10 µL 1 µL 2
Figure 3.
5 Place Balance Resolution Display in g
6 Place Balance Resolution Display in g
.00987 .009874.009873.009872.009871.009870.009869.009868.009867.009866.009865
Figure 4.
Pipette Calibration: The Gravimetric Method and Balance ResolutionAnn Lenhardt and Erin Lenhardt
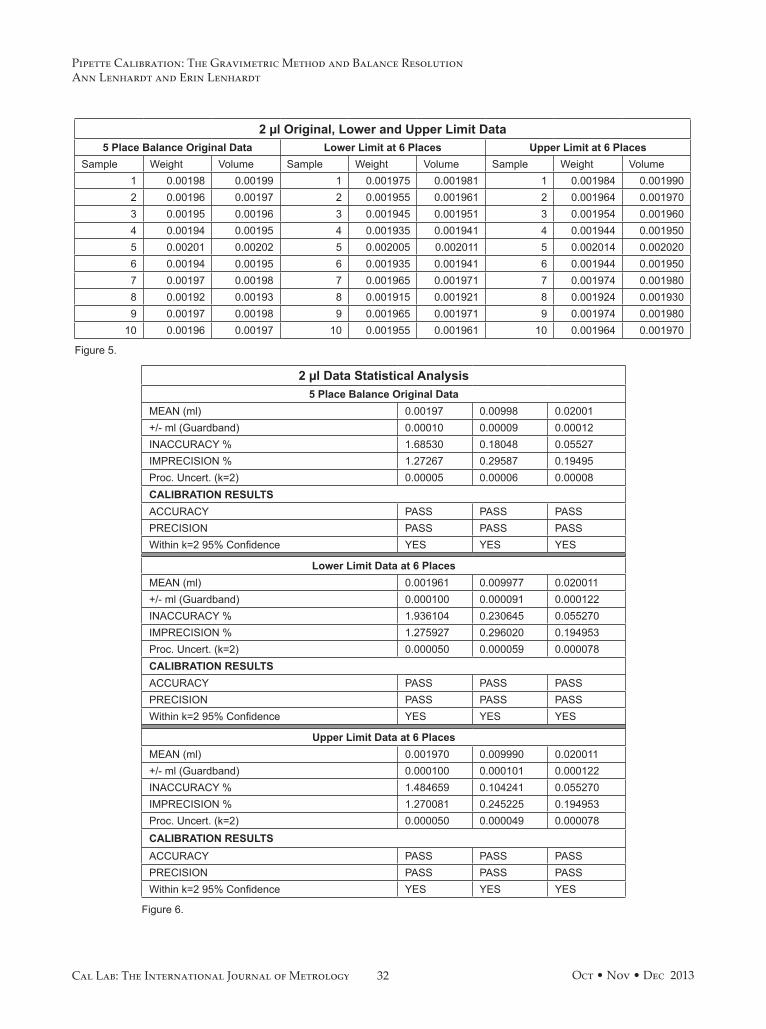
32 Oct • Nov • Dec 2013Cal Lab: The International Journal of Metrology
Figure 5.
2 µl Original, Lower and Upper Limit Data5 Place Balance Original Data Lower Limit at 6 Places Upper Limit at 6 Places
Sample Weight Volume Sample Weight Volume Sample Weight Volume1 0.00198 0.00199 1 0.001975 0.001981 1 0.001984 0.0019902 0.00196 0.00197 2 0.001955 0.001961 2 0.001964 0.0019703 0.00195 0.00196 3 0.001945 0.001951 3 0.001954 0.0019604 0.00194 0.00195 4 0.001935 0.001941 4 0.001944 0.0019505 0.00201 0.00202 5 0.002005 0.002011 5 0.002014 0.0020206 0.00194 0.00195 6 0.001935 0.001941 6 0.001944 0.0019507 0.00197 0.00198 7 0.001965 0.001971 7 0.001974 0.0019808 0.00192 0.00193 8 0.001915 0.001921 8 0.001924 0.0019309 0.00197 0.00198 9 0.001965 0.001971 9 0.001974 0.001980
10 0.00196 0.00197 10 0.001955 0.001961 10 0.001964 0.001970
Figure 6.
2 µl Data Statistical Analysis5 Place Balance Original Data
MEAN (ml) 0.00197 0.00998 0.02001+/- ml (Guardband) 0.00010 0.00009 0.00012INACCURACY % 1.68530 0.18048 0.05527IMPRECISION % 1.27267 0.29587 0.19495Proc. Uncert. (k=2) 0.00005 0.00006 0.00008CALIBRATION RESULTSACCURACY PASS PASS PASSPRECISION PASS PASS PASSWithin k=2 95% Confidence YES YES YES
Lower Limit Data at 6 PlacesMEAN (ml) 0.001961 0.009977 0.020011+/- ml (Guardband) 0.000100 0.000091 0.000122INACCURACY % 1.936104 0.230645 0.055270IMPRECISION % 1.275927 0.296020 0.194953Proc. Uncert. (k=2) 0.000050 0.000059 0.000078CALIBRATION RESULTSACCURACY PASS PASS PASSPRECISION PASS PASS PASSWithin k=2 95% Confidence YES YES YES
Upper Limit Data at 6 PlacesMEAN (ml) 0.001970 0.009990 0.020011+/- ml (Guardband) 0.000100 0.000101 0.000122INACCURACY % 1.484659 0.104241 0.055270IMPRECISION % 1.270081 0.245225 0.194953Proc. Uncert. (k=2) 0.000050 0.000049 0.000078CALIBRATION RESULTSACCURACY PASS PASS PASSPRECISION PASS PASS PASSWithin k=2 95% Confidence YES YES YES
Pipette Calibration: The Gravimetric Method and Balance ResolutionAnn Lenhardt and Erin Lenhardt
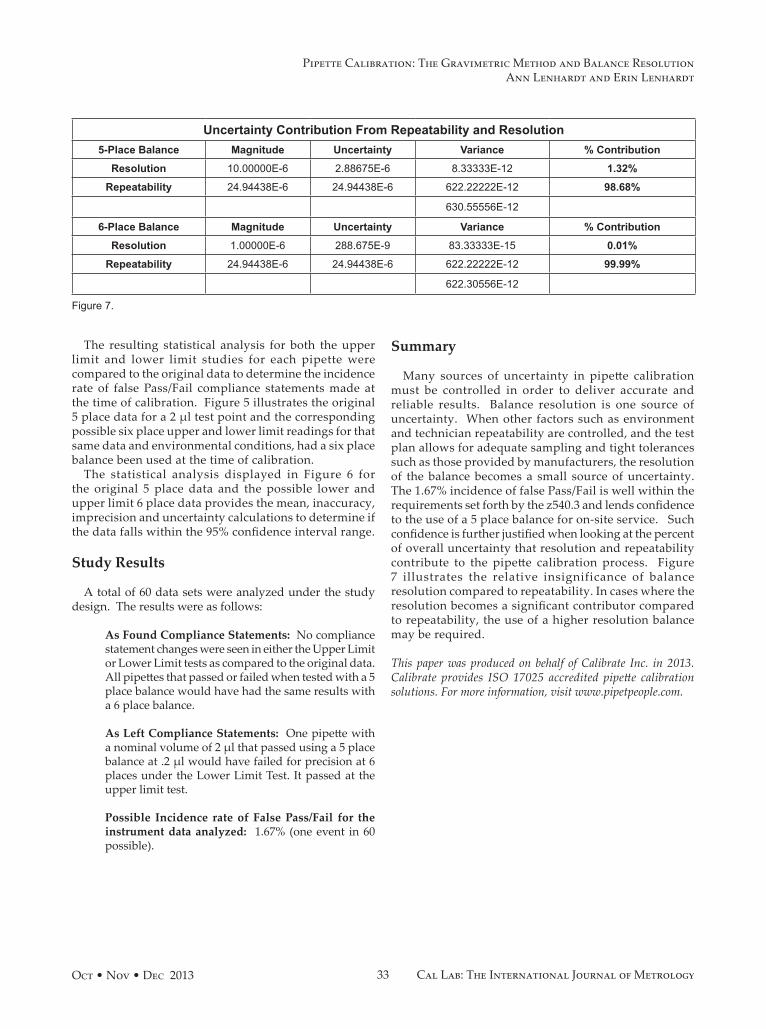
33Oct • Nov • Dec 2013 Cal Lab: The International Journal of Metrology
The resulting statistical analysis for both the upper limit and lower limit studies for each pipette were compared to the original data to determine the incidence rate of false Pass/Fail compliance statements made at the time of calibration. Figure 5 illustrates the original 5 place data for a 2 µl test point and the corresponding possible six place upper and lower limit readings for that same data and environmental conditions, had a six place balance been used at the time of calibration.
The statistical analysis displayed in Figure 6 for the original 5 place data and the possible lower and upper limit 6 place data provides the mean, inaccuracy, imprecision and uncertainty calculations to determine if the data falls within the 95% confidence interval range.
Study Results
A total of 60 data sets were analyzed under the study design. The results were as follows:
As Found Compliance Statements: No compliance statement changes were seen in either the Upper Limit or Lower Limit tests as compared to the original data. All pipettes that passed or failed when tested with a 5 place balance would have had the same results with a 6 place balance.
As Left Compliance Statements: One pipette with a nominal volume of 2 µl that passed using a 5 place balance at .2 µl would have failed for precision at 6 places under the Lower Limit Test. It passed at the upper limit test.
Possible Incidence rate of False Pass/Fail for the instrument data analyzed: 1.67% (one event in 60 possible).
Summary
Many sources of uncertainty in pipette calibration must be controlled in order to deliver accurate and reliable results. Balance resolution is one source of uncertainty. When other factors such as environment and technician repeatability are controlled, and the test plan allows for adequate sampling and tight tolerances such as those provided by manufacturers, the resolution of the balance becomes a small source of uncertainty. The 1.67% incidence of false Pass/Fail is well within the requirements set forth by the z540.3 and lends confidence to the use of a 5 place balance for on-site service. Such confidence is further justified when looking at the percent of overall uncertainty that resolution and repeatability contribute to the pipette calibration process. Figure 7 illustrates the relative insignificance of balance resolution compared to repeatability. In cases where the resolution becomes a significant contributor compared to repeatability, the use of a higher resolution balance may be required.
This paper was produced on behalf of Calibrate Inc. in 2013. Calibrate provides ISO 17025 accredited pipette calibration solutions. For more information, visit www.pipetpeople.com.
Uncertainty Contribution From Repeatability and Resolution5-Place Balance Magnitude Uncertainty Variance % Contribution
Resolution 10.00000E-6 2.88675E-6 8.33333E-12 1.32%
Repeatability 24.94438E-6 24.94438E-6 622.22222E-12 98.68%
630.55556E-12
6-Place Balance Magnitude Uncertainty Variance % Contribution
Resolution 1.00000E-6 288.675E-9 83.33333E-15 0.01%
Repeatability 24.94438E-6 24.94438E-6 622.22222E-12 99.99%
622.30556E-12
Figure 7.
Pipette Calibration: The Gravimetric Method and Balance ResolutionAnn Lenhardt and Erin Lenhardt
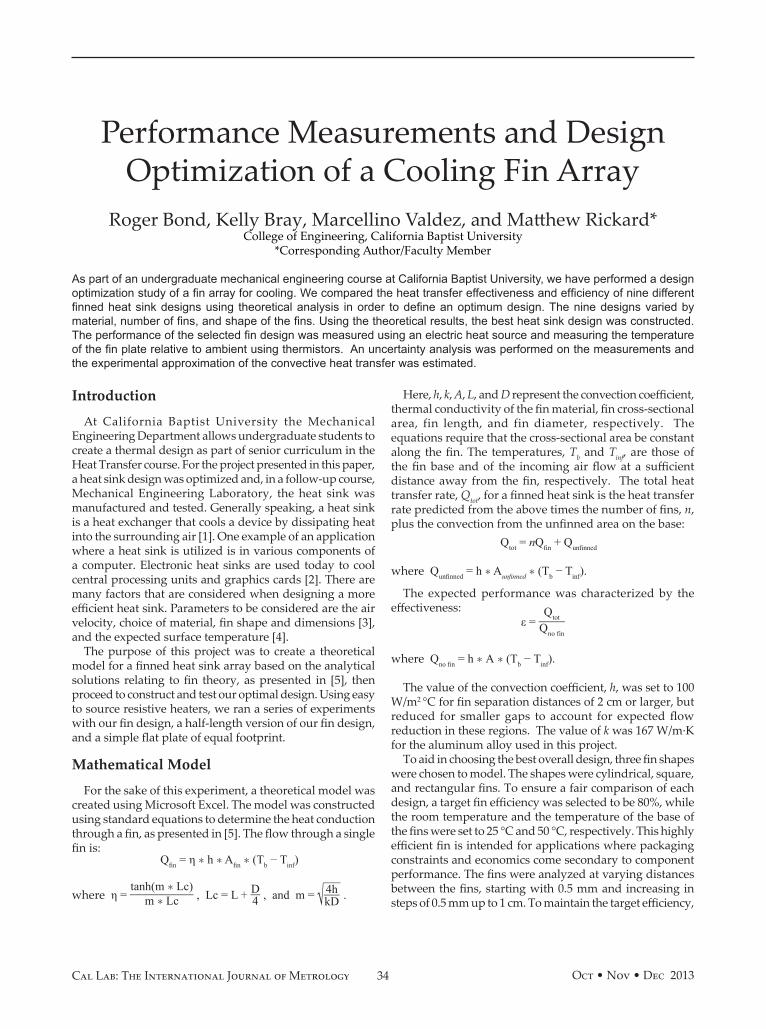
34 Oct • Nov • Dec 2013Cal Lab: The International Journal of Metrology
Introduction
At California Baptist University the Mechanical Engineering Department allows undergraduate students to create a thermal design as part of senior curriculum in the Heat Transfer course. For the project presented in this paper, a heat sink design was optimized and, in a follow-up course, Mechanical Engineering Laboratory, the heat sink was manufactured and tested. Generally speaking, a heat sink is a heat exchanger that cools a device by dissipating heat into the surrounding air [1]. One example of an application where a heat sink is utilized is in various components of a computer. Electronic heat sinks are used today to cool central processing units and graphics cards [2]. There are many factors that are considered when designing a more efficient heat sink. Parameters to be considered are the air velocity, choice of material, fin shape and dimensions [3], and the expected surface temperature [4].
The purpose of this project was to create a theoretical model for a finned heat sink array based on the analytical solutions relating to fin theory, as presented in [5], then proceed to construct and test our optimal design. Using easy to source resistive heaters, we ran a series of experiments with our fin design, a half-length version of our fin design, and a simple flat plate of equal footprint.
Mathematical Model
For the sake of this experiment, a theoretical model was created using Microsoft Excel. The model was constructed using standard equations to determine the heat conduction through a fin, as presented in [5]. The flow through a single fin is:
Qfin = η ⁎ h ⁎ Afin ⁎ (Tb − Tinf)
where η = tanh(m ⁎ Lc)
___________ m ⁎ Lc , Lc = L + D __ 4 , and m = √___
4h ___ kD .
Here, h, k, A, L, and D represent the convection coefficient, thermal conductivity of the fin material, fin cross-sectional area, fin length, and fin diameter, respectively. The equations require that the cross-sectional area be constant along the fin. The temperatures, Tb and Tinf, are those of the fin base and of the incoming air flow at a sufficient distance away from the fin, respectively. The total heat transfer rate, Qtot, for a finned heat sink is the heat transfer rate predicted from the above times the number of fins, n, plus the convection from the unfinned area on the base:
Qtot = nQfin + Qunfinned
where Qunfinned = h ⁎ Aunfinned ⁎ (Tb − Tinf).
The expected performance was characterized by the effectiveness:
ε = Qtot _____ Qno fin
where Qno fin = h ⁎ A ⁎ (Tb − Tinf).
The value of the convection coefficient, h, was set to 100 W/m2 °C for fin separation distances of 2 cm or larger, but reduced for smaller gaps to account for expected flow reduction in these regions. The value of k was 167 W/m∙K for the aluminum alloy used in this project.
To aid in choosing the best overall design, three fin shapes were chosen to model. The shapes were cylindrical, square, and rectangular fins. To ensure a fair comparison of each design, a target fin efficiency was selected to be 80%, while the room temperature and the temperature of the base of the fins were set to 25 °C and 50 °C, respectively. This highly efficient fin is intended for applications where packaging constraints and economics come secondary to component performance. The fins were analyzed at varying distances between the fins, starting with 0.5 mm and increasing in steps of 0.5 mm up to 1 cm. To maintain the target efficiency,
Performance Measurements and Design Optimization of a Cooling Fin Array
Roger Bond, Kelly Bray, Marcellino Valdez, and Matthew Rickard*College of Engineering, California Baptist University
*Corresponding Author/Faculty Member
As part of an undergraduate mechanical engineering course at California Baptist University, we have performed a design optimization study of a fin array for cooling. We compared the heat transfer effectiveness and efficiency of nine different finned heat sink designs using theoretical analysis in order to define an optimum design. The nine designs varied by material, number of fins, and shape of the fins. Using the theoretical results, the best heat sink design was constructed. The performance of the selected fin design was measured using an electric heat source and measuring the temperature of the fin plate relative to ambient using thermistors. An uncertainty analysis was performed on the measurements and the experimental approximation of the convective heat transfer was estimated.
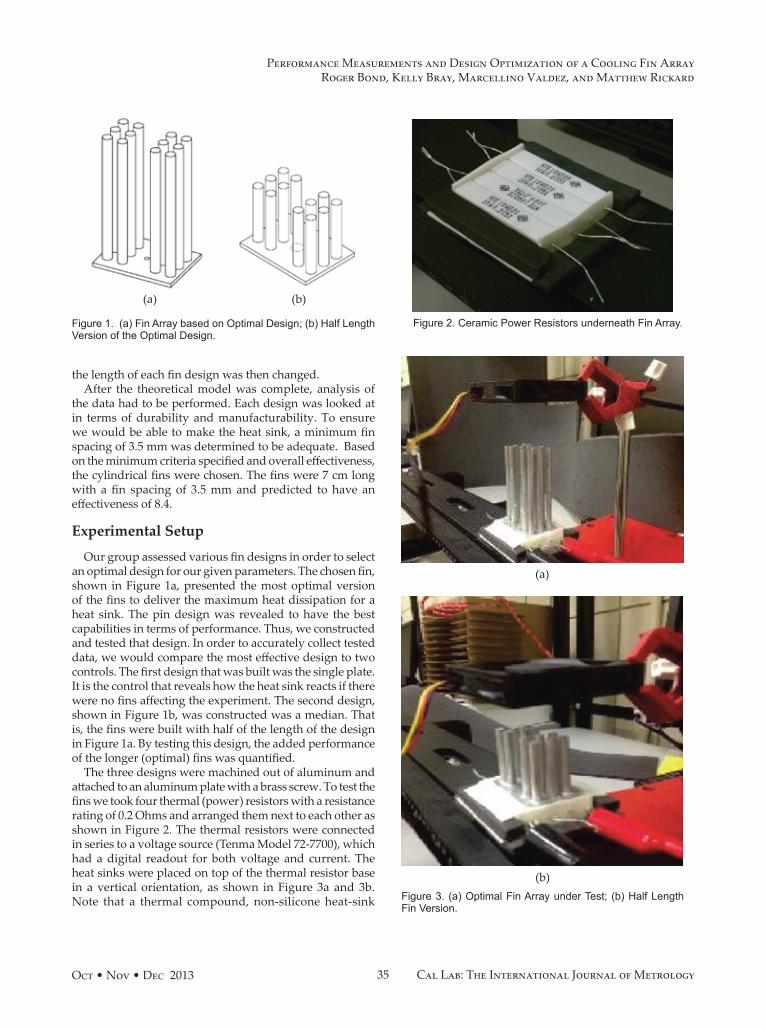
35Oct • Nov • Dec 2013 Cal Lab: The International Journal of Metrology
the length of each fin design was then changed.After the theoretical model was complete, analysis of
the data had to be performed. Each design was looked at in terms of durability and manufacturability. To ensure we would be able to make the heat sink, a minimum fin spacing of 3.5 mm was determined to be adequate. Based on the minimum criteria specified and overall effectiveness, the cylindrical fins were chosen. The fins were 7 cm long with a fin spacing of 3.5 mm and predicted to have an effectiveness of 8.4.
Experimental Setup
Our group assessed various fin designs in order to select an optimal design for our given parameters. The chosen fin, shown in Figure 1a, presented the most optimal version of the fins to deliver the maximum heat dissipation for a heat sink. The pin design was revealed to have the best capabilities in terms of performance. Thus, we constructed and tested that design. In order to accurately collect tested data, we would compare the most effective design to two controls. The first design that was built was the single plate. It is the control that reveals how the heat sink reacts if there were no fins affecting the experiment. The second design, shown in Figure 1b, was constructed was a median. That is, the fins were built with half of the length of the design in Figure 1a. By testing this design, the added performance of the longer (optimal) fins was quantified.
The three designs were machined out of aluminum and attached to an aluminum plate with a brass screw. To test the fins we took four thermal (power) resistors with a resistance rating of 0.2 Ohms and arranged them next to each other as shown in Figure 2. The thermal resistors were connected in series to a voltage source (Tenma Model 72-7700), which had a digital readout for both voltage and current. The heat sinks were placed on top of the thermal resistor base in a vertical orientation, as shown in Figure 3a and 3b. Note that a thermal compound, non-silicone heat-sink
Figure 1. (a) Fin Array based on Optimal Design; (b) Half Length Version of the Optimal Design.
(a) (b)
Figure 2. Ceramic Power Resistors underneath Fin Array.
Figure 3. (a) Optimal Fin Array under Test; (b) Half Length Fin Version.
(b)
(a)
Performance Measurements and Design Optimization of a Cooling Fin ArrayRoger Bond, Kelly Bray, Marcellino Valdez, and Matthew Rickard
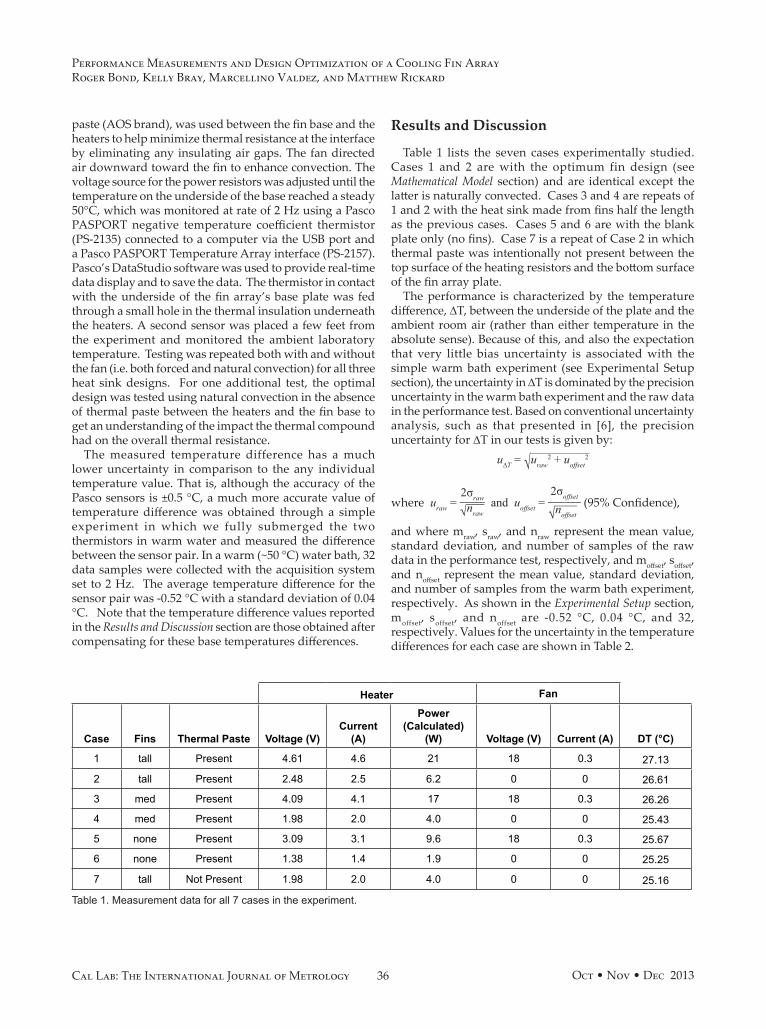
36 Oct • Nov • Dec 2013Cal Lab: The International Journal of Metrology
Results and Discussion
Table 1 lists the seven cases experimentally studied. Cases 1 and 2 are with the optimum fin design (see Mathematical Model section) and are identical except the latter is naturally convected. Cases 3 and 4 are repeats of 1 and 2 with the heat sink made from fins half the length as the previous cases. Cases 5 and 6 are with the blank plate only (no fins). Case 7 is a repeat of Case 2 in which thermal paste was intentionally not present between the top surface of the heating resistors and the bottom surface of the fin array plate.
The performance is characterized by the temperature difference, ∆T, between the underside of the plate and the ambient room air (rather than either temperature in the absolute sense). Because of this, and also the expectation that very little bias uncertainty is associated with the simple warm bath experiment (see Experimental Setup section), the uncertainty in ∆T is dominated by the precision uncertainty in the warm bath experiment and the raw data in the performance test. Based on conventional uncertainty analysis, such as that presented in [6], the precision uncertainty for ∆T in our tests is given by:
u∆T = √__________
u raw 2 + u offset 2
where uraw = 2σ raw
_____ √____
n raw and uoffset = 2σ offset ______ √____
n offset (95% Confidence),
and where mraw, sraw, and nraw represent the mean value, standard deviation, and number of samples of the raw data in the performance test, respectively, and moffset, soffset, and noffset represent the mean value, standard deviation, and number of samples from the warm bath experiment, respectively. As shown in the Experimental Setup section, moffset, soffset, and noffset are -0.52 °C, 0.04 °C, and 32, respectively. Values for the uncertainty in the temperature differences for each case are shown in Table 2.
Heater Fan
Case Fins Thermal Paste Voltage (V)Current
(A)
Power (Calculated)
(W) Voltage (V) Current (A) DT (°C)
1 tall Present 4.61 4.6 21 18 0.3 27.13
2 tall Present 2.48 2.5 6.2 0 0 26.61
3 med Present 4.09 4.1 17 18 0.3 26.26
4 med Present 1.98 2.0 4.0 0 0 25.43
5 none Present 3.09 3.1 9.6 18 0.3 25.67
6 none Present 1.38 1.4 1.9 0 0 25.25
7 tall Not Present 1.98 2.0 4.0 0 0 25.16
Table 1. Measurement data for all 7 cases in the experiment.
paste (AOS brand), was used between the fin base and the heaters to help minimize thermal resistance at the interface by eliminating any insulating air gaps. The fan directed air downward toward the fin to enhance convection. The voltage source for the power resistors was adjusted until the temperature on the underside of the base reached a steady 50°C, which was monitored at rate of 2 Hz using a Pasco PASPORT negative temperature coefficient thermistor (PS-2135) connected to a computer via the USB port and a Pasco PASPORT Temperature Array interface (PS-2157). Pasco’s DataStudio software was used to provide real-time data display and to save the data. The thermistor in contact with the underside of the fin array’s base plate was fed through a small hole in the thermal insulation underneath the heaters. A second sensor was placed a few feet from the experiment and monitored the ambient laboratory temperature. Testing was repeated both with and without the fan (i.e. both forced and natural convection) for all three heat sink designs. For one additional test, the optimal design was tested using natural convection in the absence of thermal paste between the heaters and the fin base to get an understanding of the impact the thermal compound had on the overall thermal resistance.
The measured temperature difference has a much lower uncertainty in comparison to the any individual temperature value. That is, although the accuracy of the Pasco sensors is ±0.5 °C, a much more accurate value of temperature difference was obtained through a simple experiment in which we fully submerged the two thermistors in warm water and measured the difference between the sensor pair. In a warm (~50 °C) water bath, 32 data samples were collected with the acquisition system set to 2 Hz. The average temperature difference for the sensor pair was -0.52 °C with a standard deviation of 0.04 °C. Note that the temperature difference values reported in the Results and Discussion section are those obtained after compensating for these base temperatures differences.
Performance Measurements and Design Optimization of a Cooling Fin ArrayRoger Bond, Kelly Bray, Marcellino Valdez, and Matthew Rickard
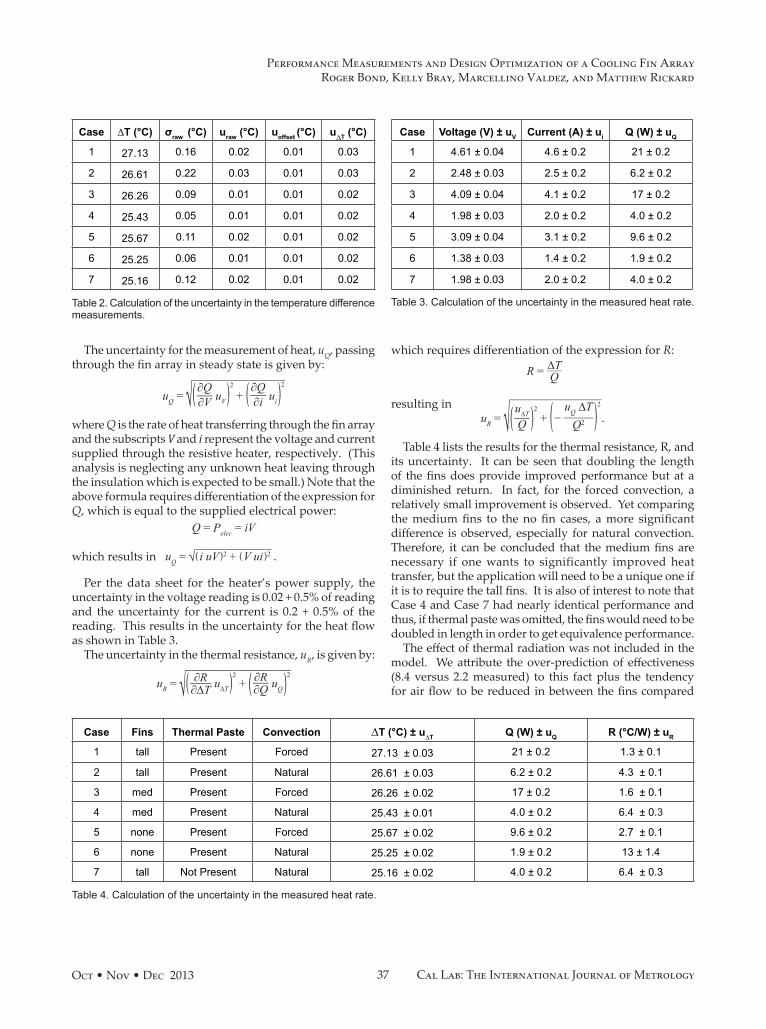
37Oct • Nov • Dec 2013 Cal Lab: The International Journal of Metrology
Table 2. Calculation of the uncertainty in the temperature difference measurements.
Case ∆T (°C) σraw (°C) uraw (°C) uoffset (°C) u∆T (°C)
1 27.13 0.16 0.02 0.01 0.03
2 26.61 0.22 0.03 0.01 0.03
3 26.26 0.09 0.01 0.01 0.02
4 25.43 0.05 0.01 0.01 0.02
5 25.67 0.11 0.02 0.01 0.02
6 25.25 0.06 0.01 0.01 0.02
7 25.16 0.12 0.02 0.01 0.02
Case Voltage (V) ± uV Current (A) ± ui Q (W) ± uQ
1 4.61 ± 0.04 4.6 ± 0.2 21 ± 0.2
2 2.48 ± 0.03 2.5 ± 0.2 6.2 ± 0.2
3 4.09 ± 0.04 4.1 ± 0.2 17 ± 0.2
4 1.98 ± 0.03 2.0 ± 0.2 4.0 ± 0.2
5 3.09 ± 0.04 3.1 ± 0.2 9.6 ± 0.2
6 1.38 ± 0.03 1.4 ± 0.2 1.9 ± 0.2
7 1.98 ± 0.03 2.0 ± 0.2 4.0 ± 0.2
Table 3. Calculation of the uncertainty in the measured heat rate.
Case Fins Thermal Paste Convection ∆T (°C) ± u∆T Q (W) ± uQ R (°C/W) ± uR
1 tall Present Forced 27.13 ± 0.03 21 ± 0.2 1.3 ± 0.1
2 tall Present Natural 26.61 ± 0.03 6.2 ± 0.2 4.3 ± 0.1
3 med Present Forced 26.26 ± 0.02 17 ± 0.2 1.6 ± 0.1
4 med Present Natural 25.43 ± 0.01 4.0 ± 0.2 6.4 ± 0.3
5 none Present Forced 25.67 ± 0.02 9.6 ± 0.2 2.7 ± 0.1
6 none Present Natural 25.25 ± 0.02 1.9 ± 0.2 13 ± 1.4
7 tall Not Present Natural 25.16 ± 0.02 4.0 ± 0.2 6.4 ± 0.3
Table 4. Calculation of the uncertainty in the measured heat rate.
The uncertainty for the measurement of heat, uQ, passing
through the fin array in steady state is given by:
uQ = √________________
( ∂Q ___ ∂V u V ) 2 + ( ∂Q
___ ∂i u i ) 2 where Q is the rate of heat transferring through the fin array and the subscripts V and i represent the voltage and current supplied through the resistive heater, respectively. (This analysis is neglecting any unknown heat leaving through the insulation which is expected to be small.) Note that the above formula requires differentiation of the expression for Q, which is equal to the supplied electrical power:
Q = Pelec = iV
which results in uQ = √_____________
( i uV ) 2 + ( V ui ) 2 .
Per the data sheet for the heater’s power supply, the uncertainty in the voltage reading is 0.02 + 0.5% of reading and the uncertainty for the current is 0.2 + 0.5% of the reading. This results in the uncertainty for the heat flow as shown in Table 3.
The uncertainty in the thermal resistance, uR, is given by:
uR = √__________________
( ∂R ____ ∂∆T u ∆T ) 2 + ( ∂R ___ ∂Q u Q ) 2
which requires differentiation of the expression for R:
R = ∆T ___ Q
resulting in uR = √
________________
( u ∆T ___ Q ) 2 + ( − uQ ∆T
_____ Q 2 ) 2 .Table 4 lists the results for the thermal resistance, R, and
its uncertainty. It can be seen that doubling the length of the fins does provide improved performance but at a diminished return. In fact, for the forced convection, a relatively small improvement is observed. Yet comparing the medium fins to the no fin cases, a more significant difference is observed, especially for natural convection. Therefore, it can be concluded that the medium fins are necessary if one wants to significantly improved heat transfer, but the application will need to be a unique one if it is to require the tall fins. It is also of interest to note that Case 4 and Case 7 had nearly identical performance and thus, if thermal paste was omitted, the fins would need to be doubled in length in order to get equivalence performance.
The effect of thermal radiation was not included in the model. We attribute the over-prediction of effectiveness (8.4 versus 2.2 measured) to this fact plus the tendency for air flow to be reduced in between the fins compared
Performance Measurements and Design Optimization of a Cooling Fin ArrayRoger Bond, Kelly Bray, Marcellino Valdez, and Matthew Rickard
38 Oct • Nov • Dec 2013Cal Lab: The International Journal of Metrology
References
[1] Taylor, C. “Measurement of Finned-Tube Heat Exchanger Performance.” Georgia Institute of Technology. Dec 2004. Web. 11 Nov 2012 <http://smartech.gatech.edu/jspui/bitstream/1853/4890/1/Tay-lor_Creed_200412_MAST.pdf>.
[2] Shuja, S.Z. “Optimal Fin Geometry Based on Exer-goeconomic Analysis for a Pin-Fin Array with Ap-plication to Electronics Cooling.” Exergy, An Interna-tional Journal. 2.4 (2002): 248-258. Web. 10 Nov 2012 <http://www.sciencedirect.com/science/article/pii/S116402350200081X>.
[3] Li, J., Peterson, G.P and Cheng, P. “Three-dimensional Analysis of Heat Transfer in a Micro-heat Sink with Single Phase Flow.” International Journal of Heat and Mass Transfer. 47.19-20 (2004): 4215-4231. Web. 12 Nov 2012 <http://www.sciencedirect.com/science/article/pii/S001793100400170X>.
[4] Khan, W.A., Culham, J.R. and Yovanovich, M.M.. “The Role of Fin Geometry in Heat Sink Performance.” Jour-nal of Electronic Packaging. 128. (2006): 324-330. Web. 11 Nov 2012 <http://www.mhtl.uwaterloo.ca/pdf_pa-pers/mhtl06-21.pdf>.
[5] Cengel, Y. A., “Introduction to Thermodynamics and Heat Transfer,” Chapter 3: Steady Heat Conduction, Radiation and Heat Transfer, McGraw Hill, 1997, pp. 625 – 700.
[6] Beckwith, T. G., Marangoni, R. D., and Leinard, J. H., Mechanical Measurements, Ch 3: Assessing and Pre-senting Experimental Data, Pearson/Prentice Hall, 2007, pp. 34 - 97.
Roger Bond, Kelly Bray, Marcellino Valdez, and Matthew Rickard*, College of Engineering, California Baptist University, 8432 Magnolia Avenue, Riverside, CA, 92504.*Corresponding Author/Faculty Member. Email: [email protected].
This paper was previously presented and awarded Best College Paper as part of the Student Program at the Measurement Science Conference (MSC), in Anaheim, California, March 22, 2013.
to the no fin case. Future work can include an improved mathematic model that accounts for radiation effects and airflow reductions in small gaps. In addition, the surface finish on the experimental model can be improved (i.e. blackened) and this improvement can be characterized in a similar manner to that shown in this paper. Performance can also be improved by using a more thermally conductive aluminum or other high conductivity material. Note that the thermal resistance values provided in Table 4 include all mechanism of heat flow, which include radiation. It is of interest to note that, if the value of the convection coefficient, h, is adjusted until the measured values for Q and DT are predicted by the model, the forced and free convection cases suggest a coefficient near 90 W/m2 °C and 20 W/m2 °C, respectively for either fin array. This is comparable to the published ranges. However, we expect the real coefficients were actually somewhat lower than these estimates when one considers that the measured heat through the heat sinks included radiation, which is likely a significant portion of the observed heat flow.
Conclusion
We compared the heat transfer effectiveness and efficiency of nine different finned heat sink designs using theoretical analysis in order to define an optimum design. The nine designs varied by material, number of fins, and shape of the fins. Using the theoretical results, the best heat sink design was determined to be were 7 cm long fins with a fin spacing of 3.5 mm. A heat sink with a fin array based on these dimensions was constructed and tested using an electric heat source and by measuring the temperature of the fin plate relative to ambient using thermistors. An uncertainty analysis was performed on the measurements and the experimental approximation of the convective heat transfer was estimated. We discovered that doubling the length of the fins does provide improved performance but at a diminished return. In fact, for the forced convection case, a relatively small improvement is observed. Yet comparing the half-length fins to the no fin cases, a more significant difference was observed, especially for natural convection. When the 7 cm long fins were tested with no thermal paste, we observed nearly identical performance to the case of 3.5 cm long fins (with thermal paste). Future work can include an improved mathematical model that accounts for radiation effects and airflow reductions in between fins.
Acknowledgements
The work described in this paper was conducted in the Bourns Laboratories at CBU, made possible by a generous naming gift from Gordon and Jill Bourns in honor of the first name of Marlan and Rosemary Bourns’ business. The authors would also like to acknowledge Dr. Anthony Donaldson and Dr. Ziliang Zhou for review of this paper.
Performance Measurements and Design Optimization of a Cooling Fin ArrayRoger Bond, Kelly Bray, Marcellino Valdez, and Matthew Rickard

Calibration and Compliance ServicesTRANSCAT.COM • 800.828.1470
Have Confidence in your Measurements…
…So Your Customers Can Have Confidence in You.- NVLAP accredited - ISO 17025 Requirements*- Largest dedicated Quality and Technical Research Team in the industry- Uniform data taken across the full range and functionality of instruments- Extensive reference level calibration capabilities- North American coverage through multiple lab network- Compliance services: Analytical qualification, Validation, Remediation- Calibration and validation consulting services: instrument specification, calibration interval optimization and more
*Access each location’s lab code and scope at transcat.com/locations
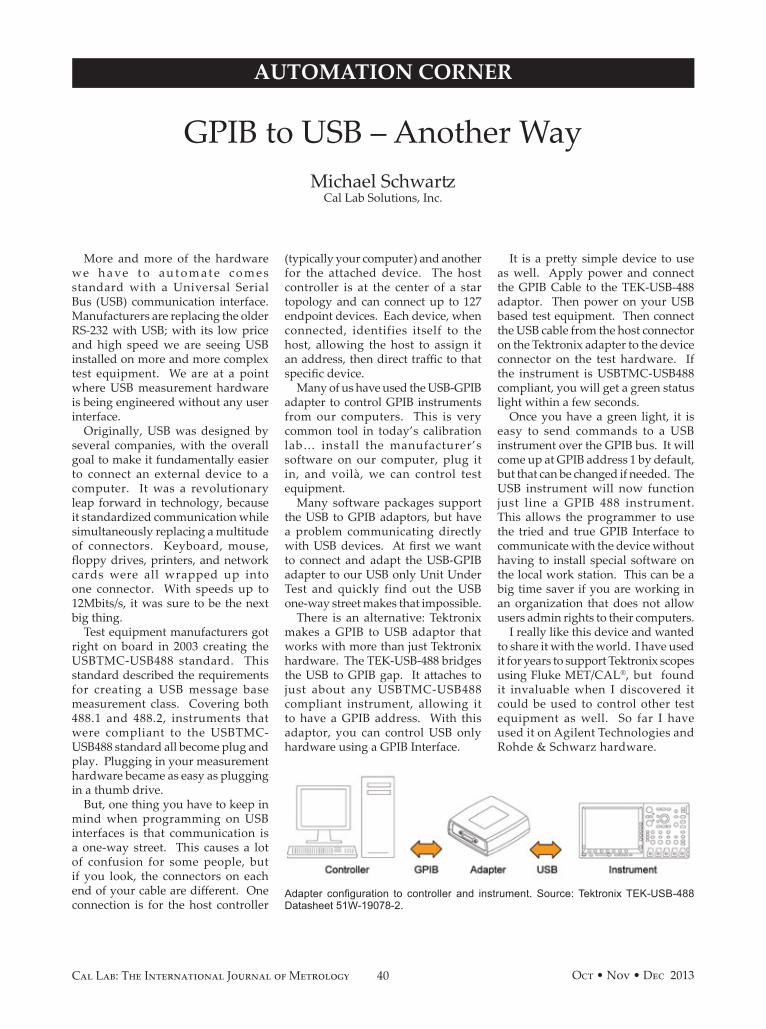
40 Oct • Nov • Dec 2013Cal Lab: The International Journal of Metrology
AUTOMATION CORNER
More and more of the hardware we h a ve t o a u t o m a t e c o m e s standard with a Universal Serial Bus (USB) communication interface. Manufacturers are replacing the older RS-232 with USB; with its low price and high speed we are seeing USB installed on more and more complex test equipment. We are at a point where USB measurement hardware is being engineered without any user interface.
Originally, USB was designed by several companies, with the overall goal to make it fundamentally easier to connect an external device to a computer. It was a revolutionary leap forward in technology, because it standardized communication while simultaneously replacing a multitude of connectors. Keyboard, mouse, floppy drives, printers, and network cards were all wrapped up into one connector. With speeds up to 12Mbits/s, it was sure to be the next big thing.
Test equipment manufacturers got right on board in 2003 creating the USBTMC-USB488 standard. This standard described the requirements for creating a USB message base measurement class. Covering both 488.1 and 488.2, instruments that were compliant to the USBTMC-USB488 standard all become plug and play. Plugging in your measurement hardware became as easy as plugging in a thumb drive.
But, one thing you have to keep in mind when programming on USB interfaces is that communication is a one-way street. This causes a lot of confusion for some people, but if you look, the connectors on each end of your cable are different. One connection is for the host controller
(typically your computer) and another for the attached device. The host controller is at the center of a star topology and can connect up to 127 endpoint devices. Each device, when connected, identifies itself to the host, allowing the host to assign it an address, then direct traffic to that specific device.
Many of us have used the USB-GPIB adapter to control GPIB instruments from our computers. This is very common tool in today’s calibration lab… install the manufacturer’s software on our computer, plug it in, and voilà, we can control test equipment.
Many software packages support the USB to GPIB adaptors, but have a problem communicating directly with USB devices. At first we want to connect and adapt the USB-GPIB adapter to our USB only Unit Under Test and quickly find out the USB one-way street makes that impossible.
There is an alternative: Tektronix makes a GPIB to USB adaptor that works with more than just Tektronix hardware. The TEK-USB-488 bridges the USB to GPIB gap. It attaches to just about any USBTMC-USB488 compliant instrument, allowing it to have a GPIB address. With this adaptor, you can control USB only hardware using a GPIB Interface.
It is a pretty simple device to use as well. Apply power and connect the GPIB Cable to the TEK-USB-488 adaptor. Then power on your USB based test equipment. Then connect the USB cable from the host connector on the Tektronix adapter to the device connector on the test hardware. If the instrument is USBTMC-USB488 compliant, you will get a green status light within a few seconds.
Once you have a green light, it is easy to send commands to a USB instrument over the GPIB bus. It will come up at GPIB address 1 by default, but that can be changed if needed. The USB instrument will now function just line a GPIB 488 instrument. This allows the programmer to use the tried and true GPIB Interface to communicate with the device without having to install special software on the local work station. This can be a big time saver if you are working in an organization that does not allow users admin rights to their computers.
I really like this device and wanted to share it with the world. I have used it for years to support Tektronix scopes using Fluke MET/CAL®, but found it invaluable when I discovered it could be used to control other test equipment as well. So far I have used it on Agilent Technologies and Rohde & Schwarz hardware.
GPIB to USB – Another WayMichael Schwartz
Cal Lab Solutions, Inc.
Adapter configuration to controller and instrument. Source: Tektronix TEK-USB-488 Datasheet 51W-19078-2.

www.msc-conf.com PHONE: (866) 672-6327 FAX: (951) 273-5175 15642 Sand Canyon Ave. #51147, Irvine, CA. 92619
MARCH 10-14, 2014 - LONG BEACH, CALIFORNIAMEASUREMENT SCIENCE CONFERENCE
“Achieving Competitive Advantage through Measurement Innovation”2014
Offer ends February 28, 2014
Call Toll Free (866) 672-6327or email [email protected]
Register
online
NOW!
A great investment for YOUR future
JOIN MSC 2014 TODAY!
FREE
*To receive this complimentary o�er you need to register for any of the following classes:
• NIST Seminars• Preparation for ASQ Cert Cal Tech Exam • Tutorial Workshops (2 days)
*MSC CONFERENCE
REGISTRATION
www.msc-conf.com/free
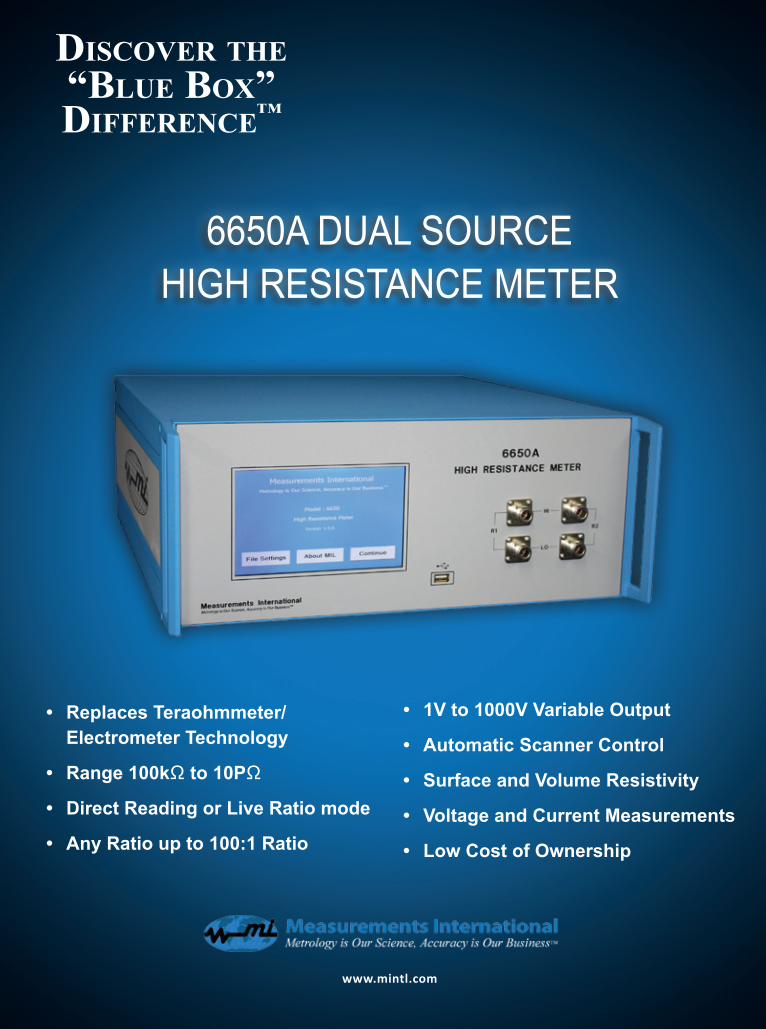
Discover the“Blue Box” Difference™
www.mintl.com
6650A DuAl Source HigH reSiStAnce Meter
• Replaces Teraohmmeter/Electrometer Technology
• Range 100kΩ to 10PΩ
• Direct Reading or Live Ratio mode
• Any Ratio up to 100:1 Ratio
• 1V to 1000V Variable Output
• Automatic Scanner Control
• Surface and Volume Resistivity
• Voltage and Current Measurements
• Low Cost of Ownership