design and performance of lift-offset rotorcraft for short ... · 3 isolated rotor. an elastic...
TRANSCRIPT

1
Design and Performance of Lift-Offset Rotorcraft for Short-Haul Missions
Wayne Johnson Aeromechanics Branch
National Aeronautics and Space Administration Ames Research Center, Moffett Field, California
Alex M. Moodie and Hyeonsoo Yeo Aeroflightdynamics Directorate (AMRDEC)
U.S. Army Research, Development, and Engineering Command Ames Research Center, Moffett Field, California
[email protected], [email protected]
ABSTRACT
The design and performance of compound helicopters utilizing lift-offset rotors are examined, in the context of short-haul, medium-size civil and military missions. The analysis tools used are the comprehensive analysis CAMRAD II and the sizing code NDARC. Following correlation of the comprehensive analysis with existing lift-offset aircraft flight test data, the rotor performance model for the sizing code was developed, and an initial estimate was made of the rotor size and key hover and cruise flight conditions. The rotor planform and twist were optimized for those conditions, and the sizing code rotor performance model updated. Two models for estimating the blade and hub weight of lift-offset rotors are discussed. The civil and military missions are described, along with the aircraft design assumptions. The aircraft are sized for 30 passengers or 6600 lb payload, with a range of 300 nm. Civil and military aircraft designs are described for each of the rotor weight models. Disk loading and blade loading were varied to optimize the designs, based on gross weight and fuel burn. The influence of technology is shown, in terms of rotor hub drag and rotor weight.
INTRODUCTION. By operating a rotor in edgewise flight with lift offset — more lift on the advancing side than on the retreating side of the rotor disk — it is possible to attain good performance at high forward speed. A conventional rotor with an articulated hub is constrained to operate with small hub moments. In forward flight, the retreating side of the disk is not able to generate much lift because of low dynamic pressure and stall, so for roll moment balance the advancing side is not allowed to generate much lift either. The resulting load distribution over the rotor disk is far from optimum for either induced or profile power losses, .Presented at the American Helicopter Society Future Vertical Lift Aircraft Design Conference, San Francisco, CA, January 18-20, 2012. This is a work of the U.S. Government and is not subject to copyright protection.
and the rotor efficiency and lift capability steadily decrease with forward speed. Even hingeless and bearingless rotors are generally not designed for the blades and hubs to carry significant roll moment, and thus encounter similar aerodynamic performance limitations. However, a very stiff hingeless rotor can be designed that will permit operation with significant roll moment, typically rotor lift offsets of 20%. Roll moment balance of the entire aircraft requires either twin main rotors or perhaps a wing. The lift offset concept was demonstrated for the coaxial configuration (Advancing Blade Concept, or ABC) by the XH-59A flight demonstration program of the 1970s (Ref. 1, Fig. 1). While confirming the basic viability of the concept, the aerodynamic performance of the XH-59A was compromised by the choice of airfoils, planform, and twist, as well as by high hub drag. In addition, the stiff hingeless rotors led to a heavy hub
https://ntrs.nasa.gov/search.jsp?R=20120011711 2018-07-17T09:12:10+00:00Z

2
design and high vibration in flight. Recent interest in high-speed rotorcraft makes it appropriate to re-examine the capability of lift-offset rotors, including the impact of current and advanced technology. Sikorsky Aircraft is exploring the ABC in the context of modern technology, including the X2 TechnologyTM Demonstrator (Refs. 2–5, Fig. 2).
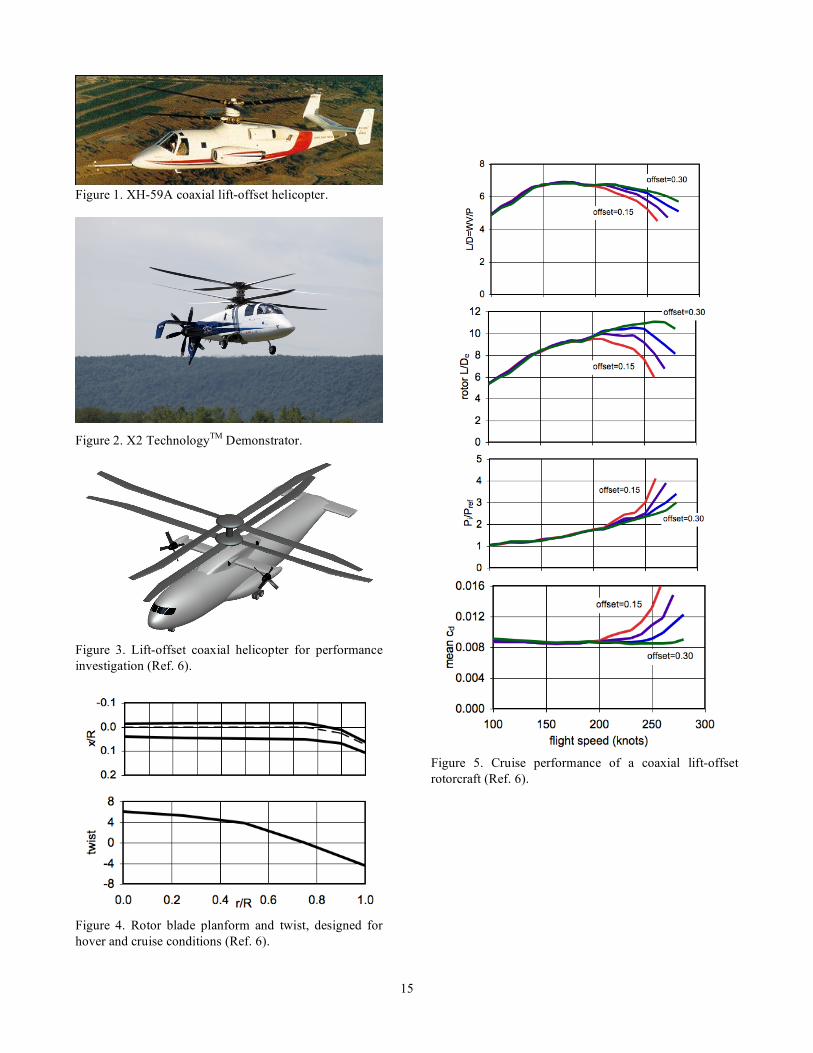
In previous work, the performance potential of lift-offset rotors was examined (Ref. 6). The aircraft for that work (Fig. 3) was not designed for a particular mission, rather the rotor size was derived by assuming a gross weight of 150,000 lb, disk loading
!
W /A = 15 lb/ft2, and cruise blade loading
!
CT/" = 0.10 (thrust-weighted). The design
operating conditions were takeoff (hover) at atmospheric conditions of 5k/ISA+20°C, and cruise at 250 knots and 5k/ISA+20°C. The blade chord and twist distributions were optimized for these conditions (Fig. 4), and the rotor and aircraft cruise performance was calculated (Fig. 5). Based on comprehensive analysis results, it was concluded that lift offset about
!
O = "Mx/LR = 0.25 (hub roll
moment due to lift acting on the advancing side,
!
0.25R from the hub) is effective in reducing the rotor induced power and minimizing the rotor profile power, resulting in a rotor effective lift-to-drag ratio of about 10. Also in Ref. 6, the aerodynamic modeling requirements for performance calculations were evaluated, including rotor wake and drag models for the high speed flight condition.
In the present paper, the design and performance of compound helicopters utilizing lift-offset rotors is examined, in the context of short-haul, medium-size civil and military missions. The aircraft are sized for 30 passengers or 6600 lb payload, with a range of 300 nm. The objective is to understand the impact of key technologies, including rotor performance and weight and aircraft aerodynamics, on the design of rotorcraft with lift-offset rotors.
DESIGN APPROACH The designs were synthesized using the aircraft sizing code NDARC (Refs. 7–9), supported by the comprehensive analysis CAMRAD II (Refs. 10–11). The capability of the comprehensive analysis to calculate performance was established by correlation with data from flight tests of lift-offset rotors. Then a rotor performance model for the sizing code was developed, and an initial estimate was made of the rotor size and key hover and cruise flight conditions. The rotor planform and twist were optimized for those conditions, and the performance model of the sizing code was updated. Models for the rotor weight and airframe aerodynamics were identified,
and the technology level established. Aircraft were synthesized for civil and military missions, for each of the two rotor weight models identified. Disk loading and blade loading were varied to optimize the designs, based on gross weight and fuel burn.
COMPUTATIONAL METHODS
Comprehensive Analysis CAMRAD II Performance analyses were conducted with the comprehensive rotorcraft analysis CAMRAD II (Ref. 11). CAMRAD II is an aeromechanics analysis of rotorcraft that incorporates a combination of advanced technologies, including multibody dynamics, nonlinear finite elements, and rotorcraft aerodynamics. The trim task finds the equilibrium solution for a steady state operating condition, and produces the solution for performance, loads, and vibration. The aerodynamic model includes a wake analysis to calculate the rotor nonuniform induced-velocities, using rigid, prescribed, or free wake geometry. CAMRAD II has undergone extensive correlation of performance and loads measurements on helicopters (Refs. 6, 11–17).
The CAMRAD II aerodynamic model for the rotor blade is based on lifting-line theory, using steady two-dimensional airfoil characteristics and a vortex wake model. The wing modeling problem of lifting-line theory is unsteady, compressible, viscous flow about an infinite aspect-ratio wing, in a uniform flow consisting of the yawed free stream and the wake-induced velocity. This problem is modeled as two-dimensional, steady, compressible, viscous flow (airfoil tables), plus corrections. The corrections in particular account for swept and yawed flow, spanwise drag, and attached flow unsteady loads. Other corrections available, such as for static stall delay and dynamic stall, were not important for the operating conditions considered here. The wake problem of lifting-line theory is an incompressible vortex wake behind the lifting line, with distorted geometry and rollup. The wake analysis calculates the rotor nonuniform induced velocity using either rigid or free wake geometry. The concentrated tip vortices are the key features of the rotor wake, important for performance, airloads, structural loads, vibration, and noise calculations. The formation of the tip vortices is modeled in CAMRAD II, not calculated from first principles.
A rotor aeroelastic model was developed for the analysis of the lift-offset rotorcraft. Performance optimization considered just the coaxial rotors, and the calculations for calibration of the NDARC rotor models considered an

3
isolated rotor. An elastic blade model was used, scaled from the compound blade design of Ref. 18. The hingeless blade was very stiff, with a Lock number of 5.3. The blade was modeled using 6 elastic beam elements, and the solution procedures used 10 blade modes and 2 harmonics. Rotor performance was calculated using nonuniform inflow with rigid wake geometry in high speed cruise and free wake geometry in hover. The blade was modeled using 16 aerodynamic panels, with a root cutout of 16%
!
R ; the ONERA EDLIN unsteady aerodynamic model was used, but no dynamic stall model. Airfoil characteristics were obtained from tables representing advanced technology airfoils, with thickness-to-chord ratio varying from almost 40% at the root, to 12-10% on the outer half of the blade, to 9% at the tip.
For optimization of the rotor geometry, the two rotors in hover were trimmed to zero total torque and total thrust equal to the target, using the collective pitch of the two rotors. In forward flight, the total thrust was trimmed to the target using the pilot collective (equal upper and lower rotor collective pitch) at fixed shaft angle; the hub moment of each rotor was trimmed using the rotor cyclic pitch, with targets of zero pitch moment and a lift offset for roll moment.
To generate the rotor performance information needed to calibrate NDARC, a single rotor was analyzed. In cruise the rotor was trimmed to a target
!
CL/" , hub pitch
moment equal zero, and hub roll moment equal
!
"Mx
=O(LR) (offset times thrust); using rotor collective and cyclic at fixed shaft angle. Hover performance was calculated for a collective sweep.
Rotorcraft Sizing Code NDARC NDARC is a conceptual or preliminary design and analysis code for rapidly sizing and conducting performance analysis of new rotorcraft concepts, with frameworks for introducing multiple levels of fidelity (Refs 7–9, 19). NDARC has a modular code base, facilitating its extension to new concepts and the implementation of new computational procedures.
A typical NDARC run consists of a sizing task, followed by off-design performance analysis. During the sizing process, point condition and mission performance are calculated and the aircraft is resized both geometrically and mechanically until the convergence criteria are met.
The NDARC rotor performance model represents the rotor power as the sum of induced, profile, and propulsive terms:
!
P = Pi + Po + Pp . The propulsive power (including climb/descent power for the aircraft) is obtained from the
wind axis drag force and rotor velocity:
!
Pp = "XV . The induced power is calculated from the ideal power and the induced power factor
!
" :
!
Pi="P
ideal, where
!
Pideal
is the ideal, momentum theory induced power. The profile power is calculated from a mean blade drag coefficient
!
cd mean
:
!
CPo
= (" /8)cd meanFP , where the function
!
FP(µ)
accounts for the increase of the blade section velocity with rotor edgewise and axial speed. The induced and profile power can not be measured separately in a wind tunnel or flight test, only the sum is available from
!
Pi+ P
o= P + XV
(if the rotor wind-axis drag force
!
X is measured or estimated). Therefore analysis is used to separate induced and profile power. The steps in the approach are: correlate performance calculations from a comprehensive analysis with wind tunnel or flight test data; calculate rotor performance for the full range of expected flight and operating conditions; and develop the parameters of the NDARC rotor performance model based on calculated
!
" and
!
cd mean
.
NDARC provides default configurations and trim strategies for several common rotary wing configurations, including a coaxial helicopter but not compound rotorcraft, providing a starting point for a design study. Here the configuration is a coaxial rotor with a propeller for auxiliary propulsion. Tail aerodynamic surfaces (elevator and rudder) are not used for trim. The commanded “collective” is rotor thrust (
!
CT/" ), and the
commanded “cyclic” is rotor hub moment (as lateral and longitudinal lift offset). Rotor collective and cyclic pitch angles are calculated from thrust and hub moment (flapping) using blade element theory (Refs. 7–8).
For low speed flight, the aircraft is trimmed as usual for a helicopter: net zero force and moment on the aircraft are achieved with pilot's collective stick, cyclic stick, and pedal, and aircraft pitch and roll attitude. For the coaxial configuration, collective stick is mean rotor collective and pedal is differential rotor collective. Cyclic stick goes to both rotors, with no differential hub moment. For low speed flight, the propeller is declutched and operated at low tip speed and zero pitch, hence very low power.
For cruise, the aircraft is trimmed as a compound: net zero force and moment on the aircraft are achieved with pilot's collective stick, cyclic stick, and pedal, propeller collective, and aircraft roll attitude. The aircraft pitch angle and the rotor lift offset (hub roll moment) are specified.

4
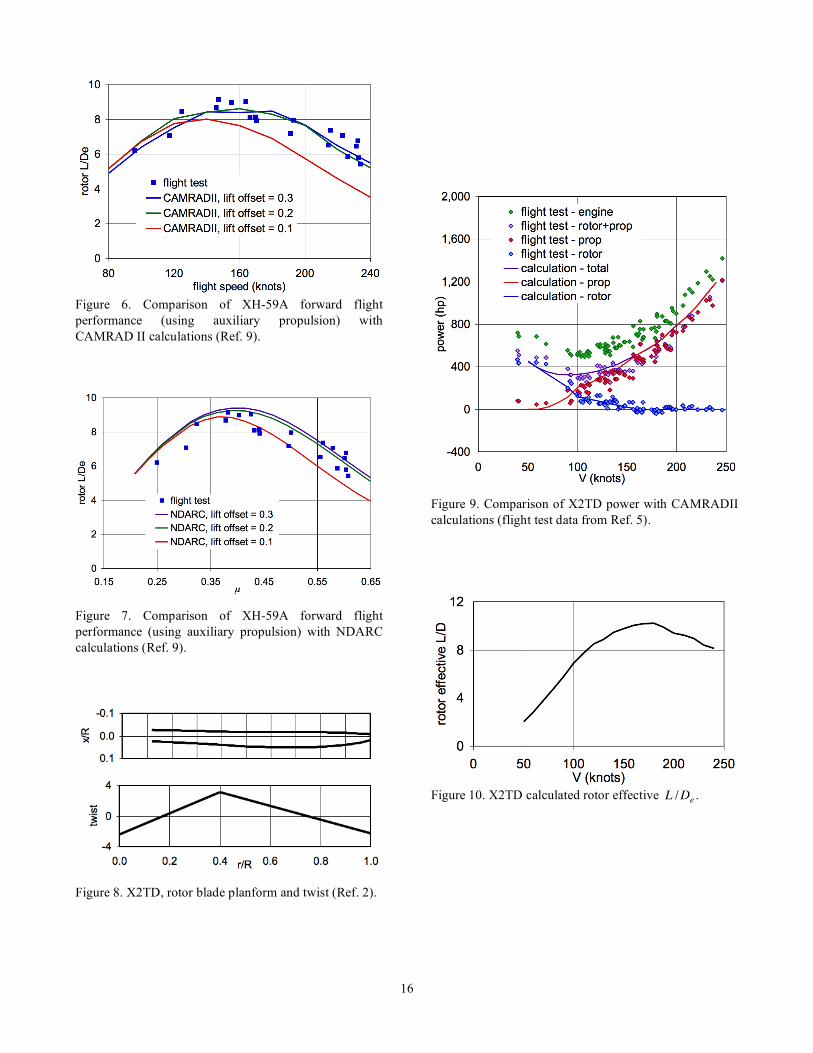
PERFORMANCE CORRELATION Reference 6 presents correlation of CAMRAD II rotor performance calculations with the hover data for the two Harrington rotors (Ref. 20); wind tunnel data for Harrington rotor #1 (Ref. 21); XH-59A hover performance data (Ref. 22); and XH-59A forward flight performance, without and with auxiliary propulsion (Ref. 23). In Ref. 9, XH-59A performance was calculated using CAMRAD II (Fig. 6), and the results were used to develop a rotor performance model for NDARC (Fig. 7).
The X2 TechnologyTM Demonstrator (X2TD) is described in Refs. 2–5. Figure 8 shows the blade planform and twist. The design of the X2TD blade emphasized minimizing retreating blade drag losses (Ref. 2). Hence the reduced chord inboard (limited by structural considerations). The blades use modern airfoil sections, with thickness ratio varying from 38% at 0.14
!
R , to 26% at 0.33
!
R (double-ended section), to 12% at 0.57
!
R , to 9% at the tip (Ref. 2).
Reference 5 gives the rotor, propeller, and engine power as a function of flight speed from flight tests of the X2TD. Correlation of the flight test power data with CAMRAD II calculations is shown in Fig. 9, and the corresponding calculated rotor effective
!
L /De in Fig. 10. The
performance is normalized to 4000 ft/ISA conditions, at nominal gross weight of 5950 lb. The measured lift offset varied from about 10% at 125 knots to about 20% at 225 knots (Ref. 5). Based on photographs and drawings of the airframe, the body and tail are assumed to carry significant lift, up to 15% at 250 knots (
!
L /q " 6.0 lb/ft2). To calculate the performance, the rotor thrust was trimmed to the weight less body/tail lift, the hub pitch moment of each rotor trimmed to zero, and the hub roll moment of each rotor trimmed to the lift offset; using pilot’s collective and the cyclic pitch of each rotor. The rotor power was trimmed to the measured rotor shaft power (near zero above 150 knots) using shaft pitch angle. The airframe drag was estimated to be
!
D /q = 1.4(GW /1000)2 / 3
= 4.6 ft2 (including hub drag). Adding the calculated rotor drag to this airframe drag gives the propeller power
!
Pprop = DtotalV /" , assuming a propulsive efficiency of
!
" = 0.85. Measurements of rotor lift and drag would be needed to draw strong conclusions from the correlation exhibited in Fig. 9.
ROTOR WEIGHT MODELS Two models for estimating the blade and hub weight of lift-offset rotors are considered: a model based on scaling and a model based on regression.
Scaled Model The scaled model is based on structural concepts that dominate the blade, hub, and upper shaft weight (Refs. 7 and 24). Let
!
Nrotor
be the number of rotors;
!
Nblade
the number of blades;
!
R the rotor radius (ft);
!
Vtip the hover tip speed (ft/sec);
!
WSD
the structural design gross weight (lb);
!
nz the design ultimate load factor at
!
WSD
(g);
!
O the lift offset;
!
t = "c the blade thickness (ft), in terms of thickness ratio and chord;
!
t.2
the blade thickness at 20%
!
R ;
!
h the vertical separation of the rotor hubs (ft); and
!
s the blade tip separation criterion (ft).
The blade weight is estimated based on the beam stiffness required to maintain the clearance
!
s when the blade is loaded by the lift offset. The blade tip deflection is proportional to
!
" # PR3 /EI , where
!
EI is the bending stiffness. The beam loading is
!
P" nzWSDO /N blade . With
!
Asxn
the blade cross-section area, the moment of inertia
!
I " Asxnt2 . The criterion is
!
" = h # s. Hence the blade weight is
!
Wblade "#N bladeRAsxn " (# /E)nzWSDOR4/(t2(h $ s))
with
!
E the elastic modulus, and here
!
" is the material density. The hub weight is estimated based on the structure in upper and lower hub plates required to react a tensile force
!
F = Ccent +M bend /(x / 2) due to combined centrifugal force and bending moment at the root; where the hub plate separation
!
x scales with the blade thickness
!
t . The centrifugal force
!
Ccent " (Wblade /N blade)Vtip2 /R .
The bending moment
!
Mbend
" nzWSDR . The limit tensile stress
!
" # F /Asxn
gives a criterion for the total hub arm area
!
Asxn
. The radius of the hub
!
l scales with the blade thickness
!
t . Hence the hub weight is
!
Whub "#N bladelAsxn
" (# /$ )(WbladeVtip2t /R + KnzWSDRN blade)
The distribution factor
!
K is determined from the XH-59A weights.
The inter-rotor shaft weight is estimated based on the structure to react the hub moment caused by lift offset. The hub moment
!
M " nzWSDOR . The shaft diameter
!
d scales with the blade thickness
!
t . The shaft length
!
l scales with the rotor separation
!
h . The ultimate bending stress
!
" = M /(I /c) gives a criterion for the area moment
!
I /c" d2w , hence for the shaft wall thickness
!
w . Hence the shaft weight is
!
Wshaft "#ldw" (# /$ )nzWSDORh / t
Calibrating these relations using the XH-59A weights gives

5
!
Wblade = "blade N rotor 0.000041885wOR3 /(t.2
2 (h # s) / 2R)
Whub = "hub N rotor (0.17153wRN blade
+ 0.000010543(Wblade /N rotor )Vtip2t.2 /R)
Wshaft = " shaft N rotor 0.162608wOR2 (h / 2R) / t.2
where
!
w = nzWSD /1000 . The factors
!
" include the material factors (
!
" /E and
!
" /# ).
Regression Model The regression model relates blade and hub weight to key design parameters, based on a least-squared-error fit of weight data for a number of rotorcraft (Ref. 7). The weight equations are:
!
Wblade = "blade 0.0024419N rotorN blade0.53479
# R1.74231c 0.77291Vtip0.87562$ 2.51048
Whub = "hub 0.0061182N rotorN blade0.20373
# R0.60406Vtip0.52803$1.00218 (Wblade /N rotor )
0.87127
where
!
Nrotor
is the number of rotors;
!
Nblade
the number of blades;
!
R the rotor radius (ft);
!
c the mean geometric blade chord (ft);
!
Vtip the hover tip speed (ft/sec);
!
" the blade flap natural frequency (per-rev); and the weight is in lb. Based on 51 rotorcraft, the average error is 7.9% for the blade equation, and 12.2% for the hub equation. For calibration to the XH-59A rotor weights, the factors are
!
"blade
= 0.784 for blade weight and
!
"hub
= 0.996 for hub weight. In addition, the inter-rotor shaft weight of the scaled model is used with the regression model.
Technology Factors Both weight models are calibrated to the XH-59A, which had metal spars and hubs. Significant reductions in rotor weight should be possible utilizing advanced composite materials. For the present investigation, it is assumed that materials and design practice can reduce the weight by factors of 0.77 for the blades, 0.72 for the upper rotor shaft, and 0.85 for the hub. Substantiating hub weight reductions is difficult, but as the XH-59A utilized metal, advanced materials and design should provide reduced weight.
For the regression model, a flap frequency of
!
" = 1.4 /rev is used. Combining the calibration and material factors, the technology factors for the regression model are
!
"blade
= 0.78# 0.77 = 0.60 and
!
"hub
= 1.00# 0.85= 0.85. With such substantial reductions in blade weight, a flap frequency of
!
" = 1.7 or so would be more consistent for a stiffness design criteria, but such high flap frequencies are well beyond the regression model data base.
For the scaled model, it is assumed that the flight control system can manage the hub moments generated at high load factor. The XH-59A was designed for ultimate load factor
!
nz = 4.0 and lift offset
!
O = 0.33. For the present investigation, the aircraft are designed for
!
nz = 5.25 , but the rotor is designed for loads corresponding to
!
nz = 4.0 (a factor of 4.0/5.25 = 0.76) and lift offset
!
O = 0.2. The blade tip separation criterion is the XH-59A value,
!
s = 0.83 ft. Combining the load control and material factors, the technology factors for the scaled model are
!
"blade
= 0.76# 0.77 = 0.59 ,
!
"shaft
= 0.76# 0.72 = 0.55 , and
!
"hub
= 0.85. This inter-rotor shaft weight is used with the regression model also.
OTHER TECHNOLOGY ASSUMPTIONS The technology level assumed in this investigation is based on the Phase II goals of the Rotary Wing Vehicle Technology Development Approach (RWV-TDA). The weights of the aircraft components are estimated using the NDARC models (Ref. 7). Table 1 gives the weight technology factors used for the major components of the weight empty. The vibration weight allowance is 1.2% of empty weight, based on TDA goals. A contingency weight equal to 5% of empty weight is included.
Table 1. Weight technology factors.
weight factor basis fuselage 0.76 materials horizontal tail 0.67 materials landing gear 0.95 TDA goals propeller 0.60 materials and design fuel tank 0.75 RAH-66
!
" 90% transmission 0.67 RAH-66
!
" 75%
The rotor performance model is based on calculations using advanced rotor airfoils. Rotor induced and profile power are significantly reduced by operating at 0.25 lift offset in cruise conditions.
The airframe drag build-up assumes a clean helicopter design. The civil aircraft drag approaches that of a turboprop aircraft. The drag of the faired hubs is 62.5% that of low-drag, unfaired hubs. A drag increment of 0.5 ft2 is used for the faired inter-rotor shaft.
The NDARC Referred Parameter Turboshaft Engine Model (RPTEM) used for this investigation is a scalable model that represents an advanced turboshaft engine. For each design, the RPTEM model is scaled based on the
6
power required, giving corresponding values of the specific fuel consumption and power/weight ratio. The engine technology levels for thermodynamic efficiency and power-to-weight ratio are based on the Advanced Affordable Turbine Engine (AATE) program goals. The AATE program goals for 2015 are to reduce specific fuel consumption by 25%, increase the power-to-weight ratio by as much as 65%, improve design life by 20%, while also reducing development, production, and maintenance costs. While the AATE program is focused on engines in the 3000 shaft horsepower class, these technology assumptions are retained for the larger engines of the current designs.
ROTOR OPTIMIZATION The starting point for the present investigation was the comprehensive analysis model of the X2TD, based on the flight test performance exhibited and the correlation achieved (Fig. 9). The rotor performance was calculated using CAMRAD II for a range of conditions:
a) Hover:
!
CT/" = 0.05 to 0.20
b) Forward flight:
!
µ = 0 to 0.8,
!
CT/" = 0.08 , 0.10, 0.12,
0.14, and lift offset
!
O = 0.2 c) Forward flight:
!
µ = 0 to 0.8,
!
CT/" = 0.10 , and lift
offset
!
O = 0 , 0.1, 0.2, 0.3 d) Flight test speed sweep
NDARC rotor performance models were developed based on these results, in terms of the induced power factor
!
" and mean drag coefficient
!
cd mean
as functions of thrust, speed, and lift offset.
With this rotor performance model, NDARC was used to synthesize a lift-offset, compound helicopter for a military mission similar to that described in the following section. For minimum design gross weight, the disk loading was 16 lb/ft2 and the rotor solidity
!
" = 0.1068 . The key operating conditions were:
a) Hover:
!
CW/" = 0.113, 6k/95°F,
!
M tip = 0.63
b) Cruise:
!
CW/" = 0.111, 14k/ISA,
!
M tip = 0.61,
!
Mat
= 0.89 ,
!
µ = 0.45, shaft angle –2° (forward), and lift offset
!
O = 0.25
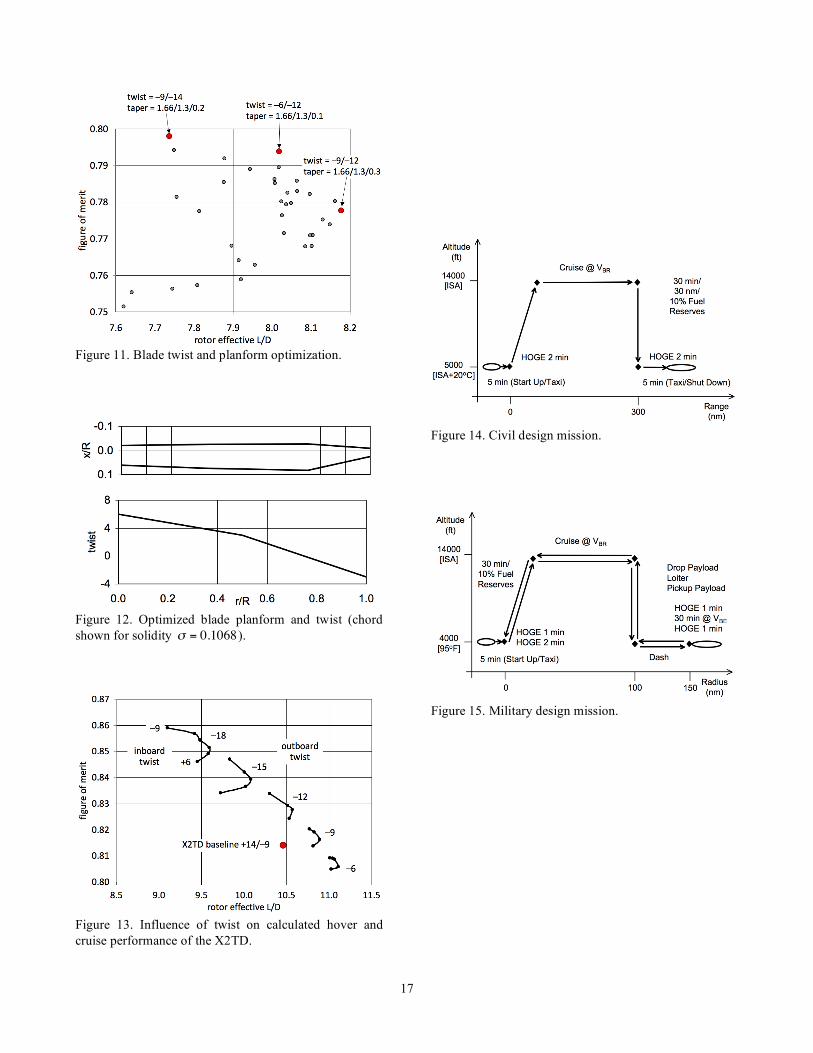
CAMRAD II calculations showed that the small forward shaft tilt, at which the rotors had a small drag force, produced the best aircraft performance. The rotor planform and twist were optimized for those conditions.
A two-parameter twist distribution was considered: linear twist inboard and outboard of
!
0.5R . A three-parameter taper distribution was considered: linear taper from 0 to
!
0.35R , from
!
0.35R to
!
0.75R , and from
!
0.75R to the tip. Here taper ratio is defined as the ratio of tip chord to root chord. The inboard taper ratio was fixed at 1.66, based on structural considerations. The hover and cruise performance was calculated using CAMRAD II for a range of twist and taper parameters. Figure 11 shows the results in terms of hover figure of merit and cruise rotor effective
!
L /De, and identifies three cases on the
boundary. NDARC was used to resize the aircraft for these three cases, using the
!
" and
!
cd mean
calculated by CAMRAD II for the hover and cruise conditions. Table 2 shows the design gross weight, installed engine power, and mission fuel for the three cases identified in Fig. 11 (the values are relative the best case). The optimum rotor geometry is a trade between hover and cruise efficiency: linear twist rate = –6° inboard and –12° outboard; linear taper ratio = 1.66 inboard, 1.3 midspan, and 0.1 outboard. Figure 12 shows the geometry. The taper ratio is kept fixed at these values as the designs evolve and the solidity changes. The chord variation was not smoothed (as for the X2TD, Ref. 2), since neither CAMRAD II nor NDARC results would be significantly affected by such changes.
Table 2. Aircraft design characteristics for rotor twist and taper cases identified in performance optimization (Fig. 11); values relative best case (middle column).
twist –9/–14 –6/–12 –9/–12 taper 1.66/1.3/0.2 1.66/1.3/0.1 1.66/1.3/0.3 gross weight 1.011 1.000 1.005 engine power 1.000 1.000 1.020 mission fuel 1.035 1.000 1.007 Now with the optimized rotor planform and twist, the rotor performance was calculated using CAMRAD II for a range of conditions:
a) Hover:
!
CT/" = 0.05 to 0.20
b) Forward flight:
!
µ = 0 to 0.8,
!
CT/" = 0.06 , 0.08, 0.10,
0.12, 0.14, and lift offset
!
O = 0.2 c) Forward flight:
!
µ = 0 to 0.8,
!
CT/" = 0.08 and 0.10,
and lift offset
!
O = 0 , 0.1, 0.2, 0.3
The NDARC rotor performance model was updated based on these results.
The optimum twist (Fig. 12) is different from that of the X2TD (Fig. 8), which was designed using a relatively simple aerodynamic analysis (Ref. 2). Figure 13 shows the influence of twist on the X2TD hover figure of merit and rotor effective
!
L /De at 200 knots, calculated using
7
CAMRAD II. These results imply that somewhat better performance could be obtained with a different twist distribution.
MISSIONS AND REQUIREMENTS Civil and military designs are presented, all with payload of 6600 lb and range of 300 nm. A single mission (different for civil and military) sizes design gross weight, engine installed power, and fuel tank capacity. Structural design gross weight equals the design gross weight. The engine model has IRP, MRP, and CRP ratings, respectively 115%, 118%, and 120% of MCP.
Cruise segments are flown at a lift offset of
!
O = 0.25; the fuselage level and a shaft angle-of-attack of –1° forward (at which the rotors have drag force of around 400 lb, approximately zero compared to the lift); and a tip speed of
!
Vtip = 650 ft/sec (so the advancing tip Mach number
!
Mat" 0.9 ). The hover tip speed is 650 ft/sec for the civil
aircraft (reflecting design of the rotor for low noise, as discussed in Ref. 18), and 725 ft/sec for the military aircraft. The propeller tip speed is 900 ft/sec, giving a helical tip Mach number of 0.90 at cruise conditions.
Cruise performance depends somewhat on altitude. Based on initial sizing investigations, a cruise altitude of 14000 ft (ISA) was chosen for both civil and military missions.
The civil aircraft has fuselage length of 55 ft, width of 7 ft, and height of 8 ft. The military aircraft has fuselage length of 56–59 ft (depending on scale), width of 8 ft, and height of 8 ft.
The horizontal tail volume is 0.03 (based on rotor radius), resulting in a tail lift-curve slope
!
L" /q # 300 ft2/rad. The tail incidence is 5°, so the tail carries some lift (approximately 2000 lb) in cruise. The vertical tail volume is 0.03 (based on rotor radius). The horizontal tail has an aspect ratio of 5 and span of about 20 ft. The vertical tail has a span of 15 ft and aspect ratio of about 3.
The rotor disk loading and design blade loading are optimized, based on aircraft weight and mission fuel burn. The main rotors each have 4 blades. The rotor vertical separation is
!
z /D = 0.07 .
The propeller has 6 blades, a disk loading of 25 lb/ft2, and a blade loading
!
CT/" = 0.09 , based on the maximum
thrust required for the design missions and conditions.
Table 3 gives the aircraft fixed weights. Both civil and military aircraft are designed for ultimate load factor
!
nz = 5.25 g, with crashworthy body, flight controls, and fuel tank. Military aircraft have weight for body
marinization, a rear ramp, and fold of the rotors and tail; the civil aircraft designs do not. The military designs have increased flight control and fuel tank weight for survivability; the civil designs have comparable weight for enhanced crashworthiness. It is assumed that 80% of the fold weight is in a kit, which can be removed from the aircraft.
Table 3. Aircraft fixed weights (lb).
civil military SYSTEMS AND EQUIPMENT flight controls group cockpit controls 85 85 automatic flight control system 135 135 system controls, non-boosted 170 170 auxiliary power group 275 275 instruments group 221 221 hydraulic group, equipment 50 50 electrical group, aircraft 750 370 avionics group (mission equip) 1000 1000 armament group 0 825 furnishings & equipment group 1800 1107 environmental control group 420 146 load & handling group 300 526 FIXED USEFUL LOAD crew 690 1000 fluids (oil, unusable fuel) 120 120 armament 0 310
Civil Aircraft The design mission and design conditions for the civil aircraft are described in Table 4 and Figure 14. Thirty passengers at 220 lb each (including 30 lb baggage) gives a payload of 6600 lb. The cabin layout is 10 rows of 3 seats, with a 32 inch pitch. Crew consists of 2 flight (240 lb each) and 1 cabin (210 lb).
The range is 300 nm. Distance flown during climb segments is credited to the cruise segment. Takeoff, landing, and maximum takeoff weight conditions are 5000 ft altitude and ISA+20°C temperature; cruise is at 14000 ft ISA. One-engine inoperative (OEI) hover capability is required, for zero field length. The OEI condition is evaluated at 20 knots, to account for some reduction in power required during the landing maneuver. Because of the OEI requirement, the civil aircraft has 3 engines.
Military Aircraft The design mission and design conditions for the military aircraft are described in Table 5 and Figure 15. The

8
payload is 6600 lb, plus 310 lb armament. Crew consists of 2 flight and 2 in the cabin (250 lb each). Missions and conditions are flown without the fold kit.
The mission radius is 150 nm, 100 nm flown at altitude and speed for efficiency and the last 50 nm flown at dash speed. Distance flown during climb segments is credited to the cruise segment. At the midpoint, the payload is dropped, the aircraft loiters for 30 min, and then the payload is picked up again. Takeoff, landing, dash, and maximum takeoff weight conditions are 4000 ft altitude and 95°F temperature; cruise is at 14000 ft ISA. The military aircraft has 2 engines.
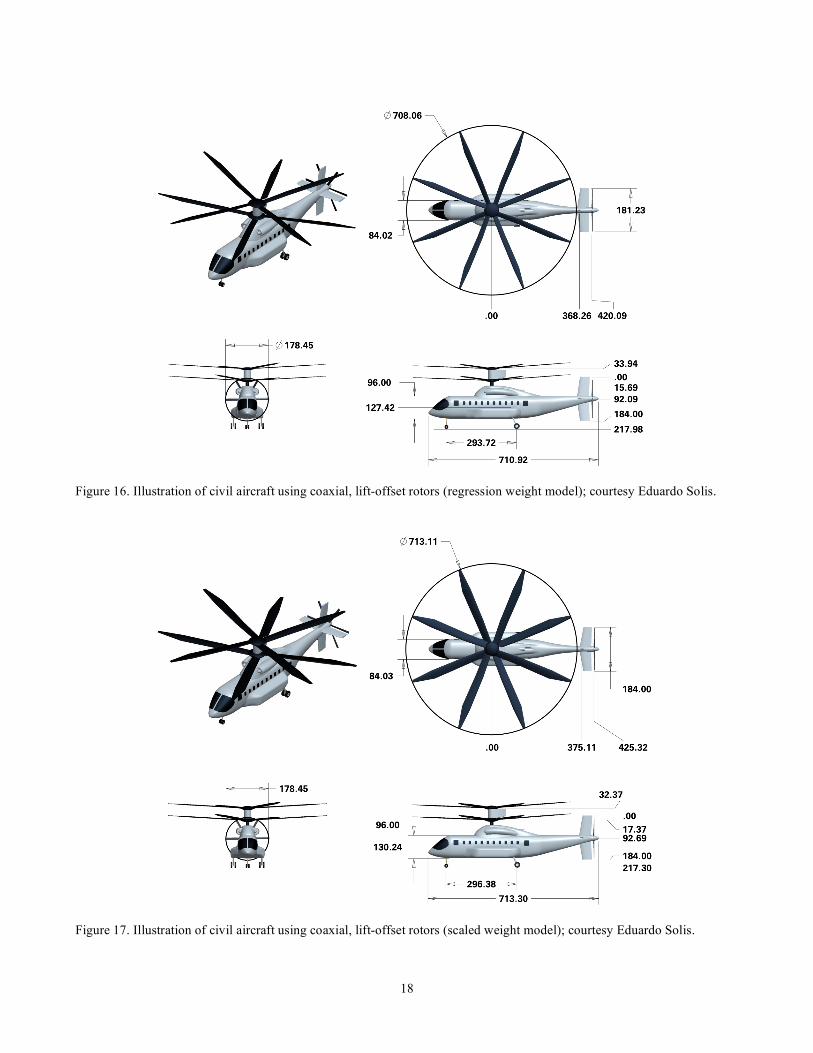
AIRCRAFT DESIGNS Designs were synthesized using NDARC for aircraft meeting the civil and military requirements, and using the scaled and regression rotor weight models. The four designs are shown in Figs. 16–19, and characteristics are given in Tables 6–8.
Disk loading (
!
W /A , where
!
A is area of one rotor) and design blade loading (
!
CW/" , based on takeoff conditions
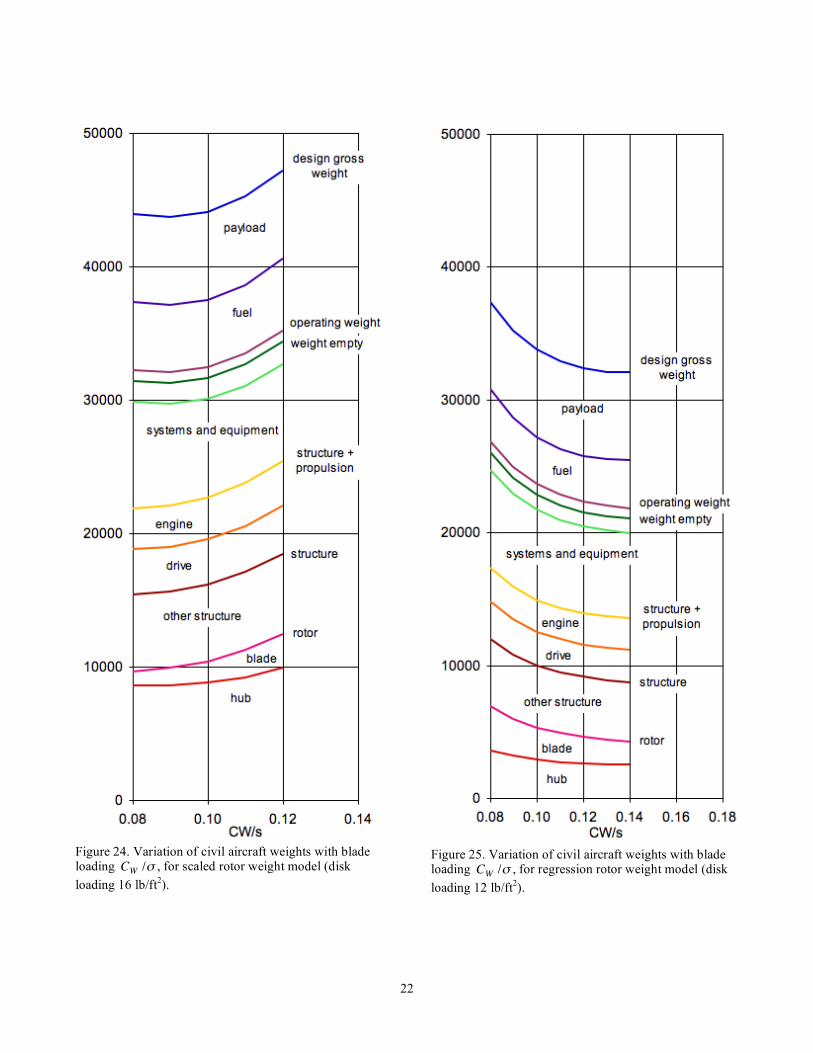
and hover tip speed) were varied. The variation of the performance and weights are shown in Figs. 20–25. Table 9 summarizes the values chosen, based on design gross weight and mission fuel.
Table 9. Optimum disk loading and blade loading.
civil military weight model
scaled regression scaled regression
design
!
W /A (lb/ft2)
16 12 16 12
design
!
CW/"
0.10 0.11 0.08 0.10
cruise
!
CT/"
0.11 0.12 0.12 0.14
The rotor weight increases and the fuel and engine weight decrease as disk loading is reduced. With the scaled rotor weight model, the rotor weight change dominates, and the optimum is at higher disk loading. With the regression weight model, the rotor weight variation is less, and the optimum is at lower disk loading. The optimum
!
CW/" is
higher with the regression model, but the rotor solidity is still much smaller. The rotor radius is about 30 ft for all four designs.
Figures 26–35 show the performance of the optimized designs. The aircraft and rotor lift-to-drag ratio are shown in Figs. 26–27, for takeoff and cruise conditions.
The power required and power available as a function of flight speed are shown in Figs. 28–31 for the four designs, at design gross weight and takeoff conditions. Helicopter trim is used for low speed, and compound trim (propulsive force from propeller with level fuselage) is used above 50 knots. The “parasite” power plotted is the sum of the propeller power, the rotor propulsive power, and the power associated with the engine net jet thrust (
!
T jetV ). The rotor profile power is added to get the “parasite+profile” power, and the rotor induced power added to get the “rotor+prop” power. Adding transmission and accessory power gives the power required. The propeller shaft power is also shown, for comparison with the “parasite” power, the latter lower since the rotor propulsive power is negative (drag not propulsive force from the rotors). Because of the OEI requirement, the civil aircraft can hover at MCP.
The altitude and speed envelope for the four designs are shown in Figs. 32–33, for design gross weight and MCP; hover altitude at MRP is also shown. The civil designs have more installed power because of the OEI requirement, hence higher altitude and maximum speed. At low altitude, the maximum speed is at the transmission torque limit, not the engine power limit. Figures 34–35 show the aircraft payload-range capability.
The influence of technology is shown in Figs. 36–39, in terms of rotor hub drag and rotor weight. The civil designs have clean airframes and faired hubs, resulting in low drag:
!
D /q " 20 ft2 and
!
(D /q) /(W /1000)2 / 3
" 1.5. The impact on the design of an increase in the total aircraft drag is shown in Figs. 36–37. Mission fuel increases and maximum speed decreases as the drag increases, but the aircraft size does not change much.
The rotor weight as a fraction of design gross weight is high with both weight models. The impact of reducing the rotor weight fraction is shown in Figs. 38–39, produced by reducing the blade and hub weight technology factors to half the baseline values. Materials or design technology that reduces the rotor weight has a strong influence on the aircraft size and performance.
CONCLUSIONS The objective of this investigation has been to understand the impact of key technologies, including rotor performance and weight and aircraft aerodynamics, on rotorcraft with lift-offset rotors.
9
The analysis shows that the lift-offset rotor can achieve good performance at speeds of 200–250 knots. Confidence in these results is based on correlation of the performance analysis with helicopter test data. The XH-59A had profile power too high to allow substantiation of predictions of good performance, and the rotor lift and drag were not measured in the X2 TechnologyTM Demonstrator flight test. Wind tunnel tests of advanced lift-offset rotors are needed in order to confirm the calculated performance and continue development of the analytical models.
For the short-haul, medium-size civil and military aircraft examined, low weight of the rotor system is the key requirement for effective and competitive designs. The two rotor weight models used gave very different results, in terms of aircraft design parameters and weight. Only the weights of the XH-59A are available to calibrate these rotor weight models. Rotor blade and hub designs for a range of aircraft size are needed, to support development of better weight estimation methods. The designs shown, based on technology reflecting advanced concepts, have high rotor weight fractions. Additional work on the impact of advanced materials, innovative design approaches, load and deflection requirements, and load control is needed to substantiate further the reductions in estimated rotor weights.
Future work planned includes further development of rotor weight models, and design of rotorcraft utilizing lift-offset rotors for the spectrum of Joint Multi-Role Rotorcraft (JMR) sizes and requirements.
ACKNOWLEDGEMENTS The aircraft drawings were prepared by Eduardo Solis and Alexander Amy of NASA Ames Research Center. Jeffrey D. Sinsay of the Aeroflightdynamics Directorate (AMRDEC) prepared the engine model.
REFERENCES 1) Ruddell, A.J., and Macrino, J.A. “Advancing Blade Concept (ABC) High Speed Development.” American Helicopter Society 36th Annual Forum, Washington, D.C., May 1980.
2) Bagai, A. “Aerodynamic Design of the X2 Technology DemonstratorTM.” American Helicopter Society 64th Annual Forum, Montreal, Canada, April 2008.
3) Blackwell, R., and Millott, T.A. “Dynamics Design Characteristics of the Sikorsky X2 TechnologyTM Demonstrator Aircraft.” American Helicopter Society 64th Annual Forum, Montreal, Canada, April 2008.
4) Walsh, D.; Weiner, S.; Arifian, K.; Bagai, A.; Lawrence, T.; and Blackwell, R. “Development Testing of the Sikorsky X2 TechnologyTM Demonstrator.” American Helicopter Society 65th Annual Forum, Grapevine, TX, May 2009.
5) Walsh, D.; Weiner, S.; Arifian, K.; Lawrence, T.; Wilson, M.; Millott, W.; and Blackwell, R. “High Airspeed Testing of the Sikorsky X2 TechnologyTM Demonstrator.” American Helicopter Society 67th Annual Forum, Virginia Beach, VA, May 2011.
6) Johnson, W. “Influence of Lift Offset on Rotorcraft Performance.” NASA TP 2009-215404, November 2009.
7) Johnson, W. “NDARC. NASA Design and Analysis of Rotorcraft.” NASA TP 2009-215402, December 2009.
8) Johnson, W. “NDARC — NASA Design and Analysis of Rotorcraft. Theoretical Basis and Architecture.” American Helicopter Society Specialists' Conference on Aeromechanics, San Francisco, CA, January 2010.
9) Johnson, W. “NDARC — NASA Design and Analysis of Rotorcraft. Validation and Demonstration.” American Helicopter Society Specialists' Conference on Aeromechanics, San Francisco, CA, January 2010.
10) Johnson, W. “Technology Drivers in the Development of CAMRAD II.” American Helicopter Society Aeromechanics Specialists Conference, San Francisco, CA, January 1994.
11) Johnson, W. “Rotorcraft Aeromechanics Applications of a Comprehensive Analysis.” HeliJapan 1998: AHS International Meeting on Rotorcraft Technology and Disaster Relief, Gifu, Japan, April 1998. 12) Johnson, W. “Rotorcraft Aerodynamic Models for a Comprehensive Analysis.” American Helicopter Society 54th Annual Forum, Washington, D.C., May 1998. 13) Johnson, W. “Calculation of Tilt Rotor Aeroacoustic Model (TRAM DNW) Performance, Airloads, and Structural Loads.” American Helicopter Society Aeromechanics Specialists' Meeting, Atlanta, GA, November 2000.
14) Yeo, H. “Calculation of Rotor Performance and Loads Under Stalled Conditions.” American Helicopter Society 59th Annual Forum, Phoenix, AZ, May 2003.
15) Yeo, H., Bousman, W. G., and Johnson, W., “Performance Analysis of a Utility Helicopter with Standard and Advanced Rotor,” Journal of the American Helicopter Society, Vol. 49, No. 3, July 2004.
16) Yeo, H., and Johnson, W., “Assessment of Comprehensive Analysis Calculation of Airloads on

10
Helicopter Rotors,” Journal of Aircraft, Vol. 42, No. 5, Sept.–Oct. 2005.
17) Harris, F.D. “Rotor Performance at High Advance Ratio; Theory versus Test.” NASA CR 2008-215370, October 2008.
18) Johnson, W.; Yamauchi, G.K.; and Watts, M.E. “NASA Heavy Lift Rotorcraft Systems Investigation.” NASA TP 2005-213467, December 2005.
19) Silva, C.; Yeo, H.; and Johnson, W. “Design of a Slowed-Rotor Compound Helicopter for Future Joint Service Missions.” American Helicopter Society Specialists' Conference on Aeromechanics, San Francisco, CA, January 2010. 20) Harrington, R.D. “Full-Scale-Tunnel Investigation of the Static-Thrust Performance of a Coaxial Helicopter Rotor.” NACA TN 2318, March 1951. 21) Dingeldein, R.C. “Wind-Tunnel Studies of the Performance of Multirotor Configurations.” NACA TN 3236, August 1954. 22) Arents, D.N. “An Assessment of the Hover Performance of the XH-59A Advancing Blade Concept Demonstration Helicopter.” USAAMRDL TN-25, May 1977.
23) Ruddell, A.J. “Advancing Blade Concept (ABC) Technology Demonstrator.” USAAVRADCOM TR 81-D-5, April 1981.
24) “Weight Trend Estimation for the Rotor Blade Group, Rotor Hub Group, and Upper Rotor Shaft of the ABC Aircraft.” ASRO-PDT-83-2, 1983.
NOMENCLATURE
!
A disk area (one rotor)
!
Ab
blade area
!
c blade chord
!
cd
mean drag coefficient,
!
8(CPo/" ) /F
P(µ)
!
CP
power coefficient,
!
P /("AVtip3)
!
CP/" power coefficient divided by solidity,
!
P /("AbVtip3)
!
CT
rotor thrust coefficient,
!
T /("AVtip2 )
!
CT/" thrust coefficient divided by solidity,
!
T /("AbVtip2)
!
CW
weight coefficient,
!
W /("AVtip2)
!
CW/" weight coefficient divided by solidity,
!
W /("AbVtip2)
!
D /q airframe drag divided by dynamic pressure
!
FP(µ) factor in profile power accounting for increase
of rotor blade mean dynamic pressure with advance ratio
!
FM rotor hover figure of merit,
!
T T / 2"A( ) /P
!
L /D aircraft effective lift-to-drag ratio,
!
WV /P
!
L /De rotor effective lift-to-drag ratio,
!
TV /(Pi+ P
o)
(based on rotor induced and profile power)
!
Mat
advancing tip Mach number
!
M tip tip Mach number (tip speed divided by speed of sound)
!
O lift offset
!
"Mx/LR (differential rotor roll
moment, as fraction of rotor lift times radius)
!
N number of blades
!
P aircraft power
!
Pi induced power
!
Pideal
ideal, momentum theory induced power
!
Po profile power
!
r blade radius
!
R rotor radius
!
T rotor thrust
!
V flight speed
!
Vbe
best endurance speed (minimum fuel flow)
!
Vbr
best range speed (99% of maximum specific range, high side)
!
Vdash
dash speed
!
Vtip rotor tip speed
!
W gross weight
!
Wblade
blade weight
!
Whub
hub weight
!
W /A disk loading
!
" propeller propulsive efficiency,
!
TV /P
!
" induced power factor,
!
Pi="P
ideal
!
µ advance ratio,
!
V /Vtip
!
" blade flap frequency (per-rev)
!
" air density
!
" rotor solidity,
!
Nc /"R
!
" technology factor in weight estimation CRP engine rating, contingency rated power DGW design gross weight HOGE hover out-of-ground effect IRP engine rating, intermediate rated power ISA International Standard Atmosphere MCP engine rating, maximum continuous power

11
MRP engine rating, maximum rated power MTOW maximum takeoff weight OEI one engine inoperative sfc specific fuel consumption SLS Sea Level Standard
TAS true airspeed
VROC vertical rate of climb (no horizontal component of velocity)
X2TD X2 TechnologyTM Demonstrator
Table 4. Design mission and conditions for civil aircraft.
Mission Segment
Atmosphere
Time (min)
Distance (nm)
Speed (KTAS)
Lift Offset
Engine Rating
1 Taxi 5k +20°C 5 — — 0 = 100% IRP 2 Hover 5k +20°C 2 — HOGE 0 ≤ 95% MRP 3 Climb — ISA — Credit Best 0.25 = 100% IRP 4 Cruise 14k ISA — 300
!
Vbr
0.25 ≤ 100% MCP
5 Hover 5k +20°C 2 — HOGE 0 ≤ 95% MRP 6 Taxi 5k +20°C 5 — — 0 = 100% ICP 7 Reserve 30 min /
30 nm / 10% 5k +20°C 30 30
!
Vbr
0.25 ≤ 100% MCP
Conditions A MTOW 5k +20°C — — HOGE 0 = 95% MRP B OEI at DGW 5k +20°C — — 20 0 = 100% CRP
Table 5. Design mission and condition for military aircraft.
Mission Segment
Atmosphere
Time (min)
Distance (nm)
Speed (KTAS)
Lift Offset
Engine Rating
1 Taxi 4k 95°F 5 — — 0 = 100% IRP 2 Hover 4k 95°F 2 — HOGE 0 ≤ 95% MRP 3 Climb — ISA — Credit Best 0.25 = 100% IRP 4 Cruise 14k ISA — 100
!
Vbr
0.25 ≤ 100% MCP 5 Dash 4k 95°F — 50
!
Vdash
0.25 = 90% MCP 6 Hover 4k 95°F 1 — HOGE 0 ≤ 95% MRP 7 Loiter 4k 95°F 30 —
!
Vbe
0 ≤ 100% MCP 8 Hover 4k 95°F 1 — HOGE 0 ≤ 95% MRP 9 Dash 4k 95°F — 50
!
Vdash
0.25 = 90% MCP 10 Climb — ISA — Credit Best 0.25 = 100% IRP 11 Cruise 14k ISA — 100
!
Vbr
0.25 ≤ 100% MCP 12 Hover 4k 95°F 1 — HOGE 0 ≤ 95% MRP 13 Reserve 30 min /
10% 4k 95°F 30 —
!
Vbr
0.25 ≤ 100% MCP
Condition
A MTOW 4k 95°F — — VROC 500 fpm
0 =95% MRP

12
Table 6. Characteristics of the aircraft designs. Civil Military Weight Model scaled regression scaled regression
design disk loading
!
W /A lb/ft2 16 12 16 12 design
!
CW/" 0.10 0.11 0.08 0.10
rotor radius ft 29.76 29.54 29.07 30.55 solidity
!
" (thrust-weighted) 2 x 0.0991 2 x 0.0676 2 x 0.0991 2 x 0.0595 chord (thrust-weighted) ft 2.32 1.57 2.26 1.43 propeller radius ft 7.44 6.64 6.95 6.60 propeller solidity
!
" 0.1795 0.1795 0.1786 0.1786 installed power, MRP hp 3 x 4158 3 x 2677 2 x 5454 2 x 4034 drive system limit hp 9162 5897 7541 5586 MCP SLS sfc lb/hp-hr 0.343 0.351 0.336 0.344 engine weight/power lb/hp 0.136 0.154 0.128 0.137 fuel tank capacity lb 5079 3428 5121 3900 design gross weight lb 44504 32907 42491 35185 structural design gross weight lb 44504 32907 42491 35185 maximum takeoff weight lb 53771 39026 42491 35185 weight empty %DGW 71.9 67.0 69.1 66.1 growth factor 3.57 2.64 3.51 3.02 cruise drag
!
D /q ft2 20.70 17.81 24.21 22.51 fuselage ft2 4.83 4.83 8.70 8.70 rotor ft2 11.21 9.00 9.67 8.51 propeller ft2 0.84 0.66 0.75 0.66 tail ft2 1.24 1.23 1.13 1.24 nacelle ft2 2.58 2.09 3.96 3.39
cruise
!
(D /q) /(W /1000)2 / 3 1.45 1.55 2.00 2.10
DGW Envelope HOGE ceiling (MRP) ft 13048 12563 11635 11480 absolute ceiling (MCP) ft 21612 21335 20302 19281 maximum speed (MCP) knots 250 241 219 213 SLS maximum speed (MCP) knots 243 231 210 206 cruise best range speed
!
Vbr
knots 195 188 195 181
Mission fuel burn lb 3810 2590 4226 3247 air distance nm 300 300 350 347 block time min 107 111 135 140 block speed knots 168 162 133 129

13
Table 7. Weights of the aircraft designs. Civil Military Weight Model scaled regression scaled regression
WEIGHT EMPTY lb 32007 22061 29343 23247 STRUCTURE lb 16378 9487 14839 10910 rotor group lb 10556 4899 9094 5857 blade lb 1638 2184 1381 2368 hub lb 8918 2715 7714 3488 empennage group lb 326 323 305 328 fuselage group lb 3619 2907 3999 3546 alighting gear lb 1379 1001 1083 899 engine section lb 436 314 313 245 air induction lb 62 43 45 35 PROPULSION GROUP lb 6578 4802 5774 4770 engine system lb 1817 1329 1501 1190 propeller lb 245 193 213 190 fuel system lb 1079 810 1078 885 drive system lb 3439 2470 2982 2506 SYSTEMS AND EQUIPMENT lb 7066 6404 6910 6126 flight controls lb 1225 901 1342 928 auxiliary power lb 275 275 275 275 instruments group lb 221 221 221 221 hydraulic group lb 399 276 455 294 electrical group lb 1188 1045 788 648 avionics (MEQ) lb 1000 1000 1000 1000 armament group lb 0 0 825 825 furnishings & equipment lb 1800 1800 1107 1107 environment control lb 420 420 146 146 anti-icing group lb 238 166 225 157 load & handling lb 300 300 526 526 VIBRATION lb 384 265 352 279 CONTINGENCY lb 1600 1103 1467 1162 FIXED USEFUL LOAD lb 810 810 1793 2251 crew lb 690 690 1000 1000 fluids lb 120 120 120 120 folding kit lb 0 0 673 1131 OPERATING WEIGHT lb 32817 22871 31135 25498

14
Table 8. Mission performance of the aircraft designs. Civil Military Weight Model scaled regression scaled regression
Mission Segment takeoff cruise takeoff cruise takeoff cruise takeoff cruise
power required 71%MRP 71%MCP 72%MRP 71%MCP 92%MRP 83%MCP 92%MRP 82%MCP
power required hp 6806 5432 4487 3476 7292 5464 5379 3944 rotors + prop hp 6387 5049 4195 3210 6924 5132 5092 3684 lower rotor hp 3193 1736 2097 978 3462 1724 2546 1133 upper rotor hp 3193 1731 2097 975 3462 1719 2546 1129 propeller hp 0 1581 0 1257 0 1690 0 1422 trans+acc loss hp 419 383 292 266 367 331 288 259 net jet thrust lb 482 135 330 97 604 257 463 202 sfc lb/hp-hr 0.374 0.360 0.381 0.369 0.365 0.353 0.372 0.362 drag
!
D /q ft2 24.99 21.31 28.15 26.06
!
L /D =WV /P 4.695 5.236 4.545 4.851 rotor
!
L /De 6.543 7.846 6.465 7.050
specific range nm/lb 0.100 0.146 0.101 0.127 range (1% GW) nm 42.66 46.43 42.14 43.87 hover figure of merit 0.761 0.740 0.678 0.659 rotor
!
V /Vtip 0 0.508 0 0.488 0 0.506 0 0.470
lower rotor,
!
CT/" 0.0825 0.1124 0.0914 0.1224 0.0718 0.1153 0.0902 0.1432
propulsive power hp 0 –126 0 –115 0 –118 0 –153
!
" = Pi/Pideal
1.194 2.498 1.209 2.373 1.176 2.486 1.207 2.282
mean
!
cd
0.0080 0.0119 0.0083 0.0124 0.0078 0.0121 0.0082 0.0170
upper rotor,
!
CT/" 0.1161 0.1110 0.1272 0.1210 0.1015 0.1140 0.1256 0.1413
propulsive power hp 0 –104 0 –103 0 –95 0 –145
!
" = Pi/Pideal
1.249 2.560 1.266 2.421 1.226 2.548 1.263 2.320
mean
!
cd
0.0092 0.0119 0.0105 0.0123 0.0085 0.0120 0.0102 0.0171
propeller,
!
CT/" 0 0.0603 0 0.0624 0 0.0746 0 0.0745
!
V /Vtip 0 0.367 0 0.353 0 0.365 0 0.340
!
" =TV /P 0 0.893 0 0.891 0 0.897 0 0.890
15
Figure 1. XH-59A coaxial lift-offset helicopter.
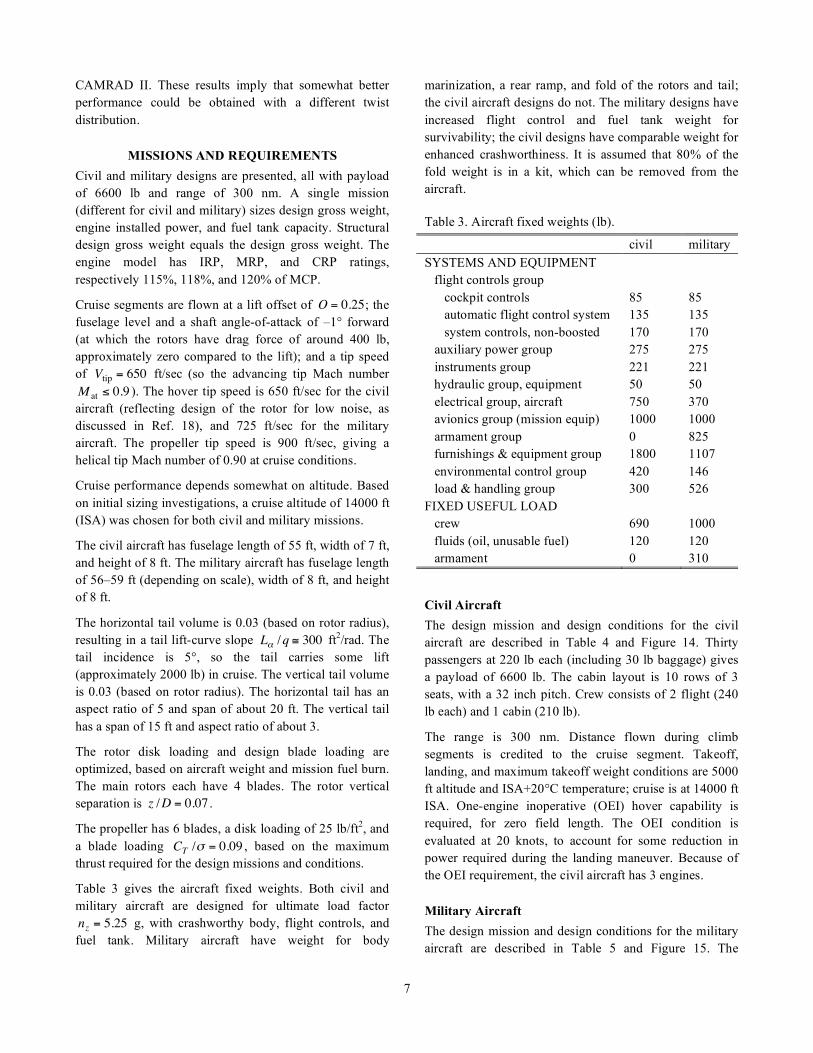
Figure 2. X2 TechnologyTM Demonstrator.
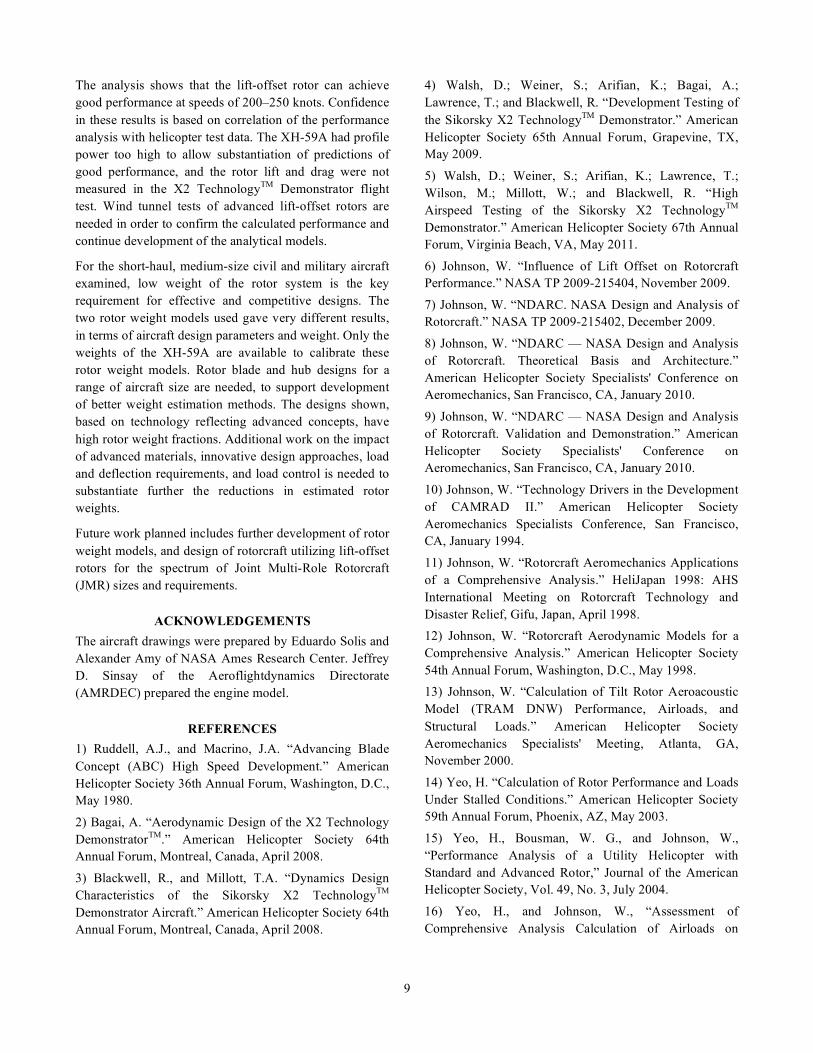
Figure 3. Lift-offset coaxial helicopter for performance investigation (Ref. 6).
Figure 4. Rotor blade planform and twist, designed for hover and cruise conditions (Ref. 6).
Figure 5. Cruise performance of a coaxial lift-offset rotorcraft (Ref. 6).
16
Figure 6. Comparison of XH-59A forward flight performance (using auxiliary propulsion) with CAMRAD II calculations (Ref. 9).
Figure 7. Comparison of XH-59A forward flight performance (using auxiliary propulsion) with NDARC calculations (Ref. 9).
Figure 8. X2TD, rotor blade planform and twist (Ref. 2).
Figure 9. Comparison of X2TD power with CAMRADII calculations (flight test data from Ref. 5).
Figure 10. X2TD calculated rotor effective
!
L /De.
17
Figure 11. Blade twist and planform optimization.
Figure 12. Optimized blade planform and twist (chord shown for solidity
!
" = 0.1068 ).
Figure 13. Influence of twist on calculated hover and cruise performance of the X2TD.
Figure 14. Civil design mission.
Figure 15. Military design mission.
18
Figure 16. Illustration of civil aircraft using coaxial, lift-offset rotors (regression weight model); courtesy Eduardo Solis.
Figure 17. Illustration of civil aircraft using coaxial, lift-offset rotors (scaled weight model); courtesy Eduardo Solis.

19
Figure 18. Illustration of military aircraft using coaxial, lift-offset rotors (regression weight model); courtesy Eduardo Solis.
Figure 19. Illustration of military aircraft using coaxial, lift-offset rotors (scaled weight model); courtesy Eduardo Solis.

20
Figure 20. Variation of civil aircraft design with disk loading (
!
CW/" = .10 for scaled rotor weight model,
!
CW/" = .11 for regression rotor weight model).
Figure 21. Variation of civil aircraft design with blade loading
!
CW/" (disk loading 16 lb/ft2 for scaled rotor
weight model, 12 lb/ft2 for regression rotor weight model).

21
Figure 22. Variation of civil aircraft weights with disk loading, for scaled rotor weight model (
!
CW/" = .10).
Figure 23. Variation of civil aircraft weights with disk loading, for regression rotor weight model (
!
CW/" = .11).
22
Figure 24. Variation of civil aircraft weights with blade loading
!
CW/" , for scaled rotor weight model (disk
loading 16 lb/ft2).
Figure 25. Variation of civil aircraft weights with blade loading
!
CW/" , for regression rotor weight model (disk
loading 12 lb/ft2).

23
Figure 26. Civil aircraft design with scaled rotor weight model: aircraft
!
L /D =WV /P and rotor effective
!
L /De;
at design gross weight.
Figure 28. Civil aircraft design with scaled rotor weight model: power required and power available; at design gross weight and takeoff atmospheric conditions. Helicopter trim at low speed (light lines), compound trim above 50 knots.
Figure 30. Military aircraft design with scaled rotor weight model: power required and power available; at design gross weight and takeoff atmospheric conditions. Helicopter trim at low speed (light lines), compound trim above 50 knots.
Figure 27. Civil aircraft design with regression rotor weight model: aircraft
!
L /D =WV /P and rotor effective
!
L /De; at design gross weight.
Figure 29. Civil aircraft design with regression rotor weight model: power required and power available; at design gross weight and takeoff atmospheric conditions. Helicopter trim at low speed (light lines), compound trim above 50 knots.
Figure 31. Military aircraft design with regression rotor weight model: power required and power available; at design gross weight and takeoff atmospheric conditions. Helicopter trim at low speed (light lines), compound trim above 50 knots.

24
Figure 32. Civil aircraft design: altitude and speed envelope, at design gross weight and MCP; solid line regression weight model, dashed line scaled weight model.
Figure 34.Civil aircraft design: payload-range, at design gross weight.
Figure 33. Military aircraft design: altitude and speed envelope, at design gross weight and MCP; solid line regression weight model, dashed line scaled weight model.
Figure 35. Military aircraft design, payload-range; at design gross weight.

25
Figure 36. Influence of aircraft drag increase (
!
"D /q , ft2) on civil aircraft with regression rotor weight model.
Figure 37. Influence of aircraft drag increase (
!
"D /q , ft2) on military aircraft with regression rotor weight model.

26
Figure 38. Influence of rotor weight technology (rotor weight fraction of design gross weight) on civil aircraft with scaled rotor weight model.
Figure 39. Influence of rotor weight technology (rotor weight fraction of design gross weight) on civil aircraft with regression rotor weight model.