design and performance of an on-satellite laser diagnostic ... · these requirements are met using...
TRANSCRIPT

ESD-TR-89-111
Technical Report 850
Design and Performance of an On-Satellite Laser Diagnostic System for a Free Space Optical
Heterodyne Frequency-Shift-Keyed Communication System
V. Jayaraman E.S. Kintzer J.G. Garcia
A.D. Pillsbury
11 July 1989
Lincoln Laboratory MASSACHUSETTS INSTITUTE OF TECHNOLOGY
LEXISGTON, MASSACHUSETTS
Prepared for the Department of the Air Force under Electronic Systems Division Contract F19628-85-C-0002.
Approved for public release; distribution is unlimited.
A0AVIW6

The work reported in this document was performed at Lincoln Laboratory, a center for research operated by Massachusetts Institute of Technology, with the support of the Department of the Air Force under Contract F19628-85-C-0002.
This report may be reproduced to satisfy needs of U.S. Government agencies.
The views and conclusions contained in this document are those of the contractor and should not be interpreted as necessarily representing the official policies, either expressed or implied, of the United States Government.
The ESD Public Affairs Office has reviewed this report, and it is releasable to the National Technical Information Service, where it will be available to the general public, including foreign nationals.
This technical report has been reviewed and is approved for publication.
FOR THE COMMANDER
/vwj/ /, SOTAUJ/
Hugh L. Southall, Lt. Col., USAF Chief, ESD Lincoln Laboratory Project Office
Non-Lincoln Recipients
PLEASE DO NOT RETURN
Permission is given to destroy this document when it is no longer needed.

MASSACHUSETTS INSTITUTE OF TECHNOLOGY LINCOLN LABORATORY
DESIGN AND PERFORMANCE OF AN ON-SATELLITE LASER DIAGNOSTIC SYSTEM FOR A FREE SPACE OPTICAL
HETERODYNE FREQUENCY-SHIFT-KEYED COMMUNICATION SYSTEM
V. JAYARAMAN J.G. GARCIA E.S. KINTZER A.D. PILLSBURY
Group 67 Group 11
TECHNICAL REPORT 850
11 JULY 1989
Approved for public release; distribution is unlimited.
LEXINGTON MASSACHUSETTS

ABSTRACT
The advent of space-based coherent diode laser communications systems requires development of space-qualified laser diagnostics to make these systems robust in face of aging laser parameters. This report describes the packaging and performance of a diagnostic system which sets the wavelength, tone spacing, and optical power of a directly modulated frequency-shift-keyed GaAlAs laser transmitter.
11

TABLE OF CONTENTS
Abstract ii
List of Illustrations iv
1. INTRODUCTION 1
2. SETTING WAVELENGTH 3
A. Interference Filter 3 B. Neon Reference 4 C. Algorithm 6
3. SETTING TONE SPACING 7
4. MECHANICAL AND THERMAL DESIGN 10
A. Introduction 10 B. Housing and Optical Layout 10 C. Subassemblies 10
5. CONCLUSION 14
in

LIST OF ILLUSTRATIONS
Figure No. Page
1 Block Diagram of the Diagnostic System 2
2 Interference Filter Transmission 3
3 Schematic of Optogalvanic Detection 4
4 (a) Signal-to-Noise Ratio in a Neon Lamp; (b) Wavelength Setting Accuracy vs SNR 5
5 4-ary Outer Tone Loss vs Tone-Spacing Error 7
6 Sideband Ratio vs Tone-Spacing Af 8
7 Tone-Spacing Error vs Linewidth 8
8 Diagnostic Module Layout and Housing 11
9 Fabry-Perot Interferometer 12
10 Beam Director Assembly 12
11 Neon Glow Lamp 13
12 Interference Filter and Detectors 13
IV

DESIGN AND PERFORMANCE OF AN ON-SATELLITE LASER DIAGNOSTIC SYSTEM FOR A FREE SPACE
OPTICAL HETERODYNE FREQUENCY-SHIFT-KEYED COMMUNICATION SYSTEM
1. INTRODUCTION
MIT Lincoln Laboratory is developing a heterodyne 4-ary frequency-shift-keyed satellite communi- cation system at 220 Mb/s using directly modulated GaAlAs laser diodes at 8630 to 8660 A.* An impor- tant part of this system is a diagnostic module, which periodically measures transmitter wavelength, spacing between transmitted FSK tones and laser power, and directs a laser controller to hold these values constant by adjusting laser bias current, temperature, and modulation current. Two facts motivate building a diagnostic module: (1) the design of the communication and tracking systems imposes strict requirements on laser diode power and spectral properties and (2) laser diodes are known to age. In order to build a robust system which can operate for several years in the presence of changes in laser diode characteristics, a diagnostic systemf must detect those changes and compensate for them. More specifically, the communication and tracking systems require the following:
(a) Laser wavelength must be within 100 MHz of a known reference. This is neces- sary to ensure that the intermediate frequency (IF) signal after mixing with the local oscillator lies within the receiver bandwidth.
(b) FSK tone spacing must be within 5 MHz of a nominal value of 220 MHz. This is necessary to ensure that the transmitted tones lie within the centers of receiver matched filters.
(c) Transmitted optical power must be held to 30 mW (full laser power) ± 1 mW. This is necessary to maintain the link margin.
These requirements are met using a neon glow lamp, an interference filter and detectors for wavelength and power, and a static Fabry-Perot interferometer and detector for tone spacing, as shown in the system block diagram of Figure 1. The rest of this report will describe in detail these components, their func- tions and performance, and how they are packaged for launch and space operation.
* V.W.S. Chan, "Space Coherent Optical Communication Systems — An Introduction." IEEE J. Light- wave Technol. LT-5, 633 (1987), DTIC AD-A189959.
t V. Jayaraman, "Autonomous Laser Diagnostics System for Optical Heterodyne Communication Systems," in Technical Digest, Optical Fiber Communications Conference, Reno, Nevada, 1987, paper THG1.

oe t y lad OT UJ O 2 « EC < "*• fc CC J Z P o o
1 II i i 1
X 1- 2 w
o o o * (- UJ Z i
i z o u z o ! i HI I _l 1 UJ 1 -s.
o UJ (- UJ 5 *- 0. i
CO i
< i UJ
I
t , z *- 1 U- o
CC UJ Q. |
>• 1
h-AAA CC CD
::Y
• IL
§!(=
,
\ k 1/ S
i ^^
Hi- EC
i S
1
i S z !
1 EC UJ r a ; z
UJ O / 1 s. (-
o UJ H UJ o
_l UJ t > 1 < i
5 : /
1
^
1
< cc Ul o Ul ' CO !
UJ 00 o z ^
i- Ul EC < I 55 z
o UJ 1- yj
EC UJ UJ K LL -1 CC [Z
O • o ; < nr
Q t K —
1
E 5 Or O
•5

2. SETTING WAVELENGTH
A. INTERFERENCE FILTER
The first step in setting wavelength is the coarse wavelength determination using a narrowband dielectric interference filter with a FWHM - 30 A spanning the diode laser operating region. The trans- mission through the filter at the unknown wavelength is measured and the transmitted power is normal- ized to the power in a reference detector. The interference filter transmission curve is stored in a lookup table which is used to determine the wavelength. An example of such a curve is shown in Figure 2. The reference detector also serves as an absolute power monitor for power-correction purposes.
i
1.0 T ' 1 l
08 / z ft s 5>o.6 s (A
I / V) Z04 ^S < ec ^^^ H
^"^ o 02 — FWHM = 36 A
- — SINGLE CAVITY STRUCTURE
00 i > i •
8630 8636 864 2 864.8 865.4 866.0 WAVELENGTH (nm)
Figure 2. Interference filler transmission.
The transmission curve of the filter shifts with temperature by an amount -0.25 A/°C. This is compensated for by monitoring the temperature of the filter mount with a thermistor and including a temperature-correction factor in the lookup table. The filter curve also can be shifted by changes in angle of incidence, but holding the angle of incidence within ±5 mrad of normal incidence limits the shift to <0.05 A.
An important limit on the accuracy of the filter curve as a measure of the diode laser wavelength is set by the side-mode ratio. The longitudinal modes of the transmitter laser are spaced 3 A apart so that typically 10 or more modes will fall within the transmission curve. The ratio of power in the main mode to power in any side mode is specified to be >25 dB . This can add as much as 0.5 percent to the trans- mission in some regions of the curve which, in rum, can lead to an error of as much as -0.3 A depending on the slope of the curve at that point. Mode ratio varies with the operating point, as well as with age, making this source of error difficult to remove. Overall, a resolution of ~1 A can be achieved for coarse tuning and detection of mode hops.
B. NEON REFERENCE
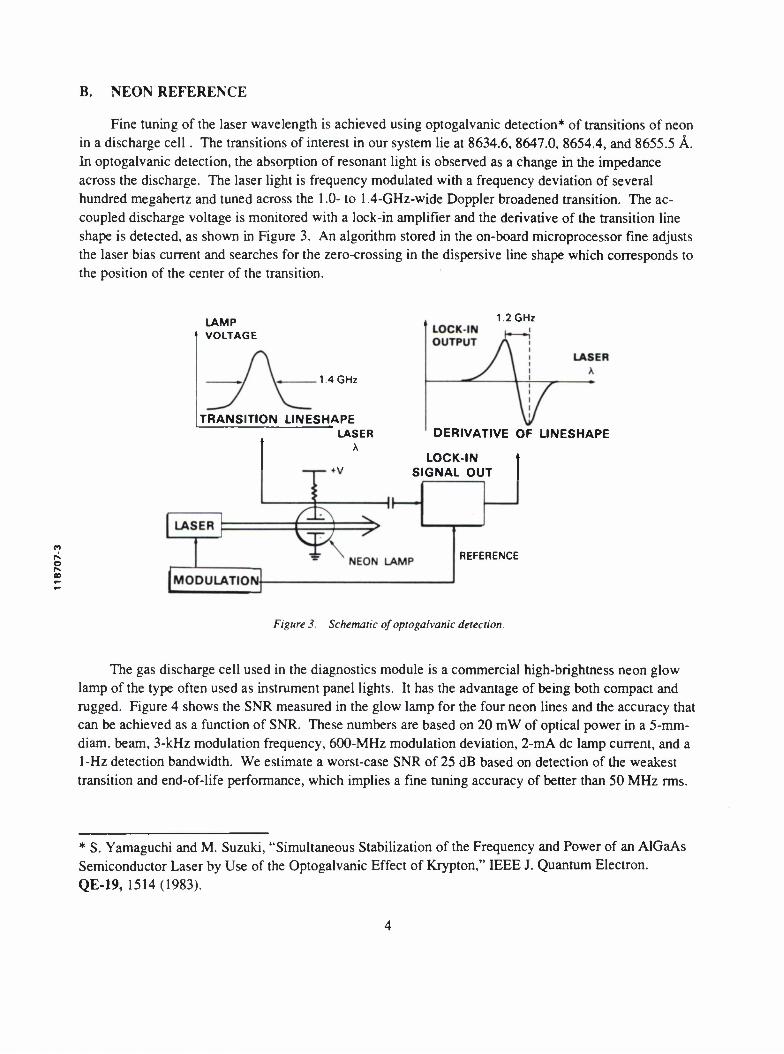
Fine tuning of the laser wavelength is achieved using optogalvanic detection* of transitions of neon in a discharge cell. The transitions of interest in our system lie at 8634.6, 8647.0, 8654.4, and 8655.5 A. In optogalvanic detection, the absorption of resonant light is observed as a change in the impedance across the discharge. The laser light is frequency modulated with a frequency deviation of several hundred megahertz and tuned across the 1.0- to 1.4-GHz-wide Doppler broadened transition. The ac- coupled discharge voltage is monitored with a lock-in amplifier and the derivative of the transition line shape is detected, as shown in Figure 3. An algorithm stored in the on-board microprocessor fine adjusts the laser bias current and searches for the zero-crossing in the dispersive line shape which corresponds to the position of the center of the transition.
i
LAMP | VOLTAGE
1.2 GHz
1.4 GHz
TRANSITION LINESHAPE LASER DERIVATIVE OF LINESHAPE
LOCK-IN SIGNAL OUT
REFERENCE
Figure 3. Schematic of optogalvanic detection.
The gas discharge cell used in the diagnostics module is a commercial high-brightness neon glow lamp of the type often used as instrument panel lights. It has the advantage of being both compact and rugged. Figure 4 shows the SNR measured in the glow lamp for the four neon lines and the accuracy that can be achieved as a function of SNR. These numbers are based on 20 mW of optical power in a 5-mm- diam. beam, 3-kHz modulation frequency, 600-MHz modulation deviation, 2-mA dc lamp current, and a 1 -Hz detection bandwidth. We estimate a worst-case SNR of 25 dB based on detection of the weakest transition and end-of-life performance, which implies a fine tuning accuracy of better than 50 MHz rms.
* S. Yamaguchi and M. Suzuki, "Simultaneous Stabilization of the Frequency and Power of an AlGaAs Semiconductor Laser by Use of the Optogalvanic Effect of Krypton," LEEE J. Quantum Electron. QE-19, 1514(1983).

CD
cr z
50 -
40 -
30 -
20 -
10 -
0 _
~ 8654.4
8634.6
8647.0
X 8630 8640 8650
WAVELENGTH (A)
8655.5" (a)
8660
< tr => o o < CO
200 -
100 -
(b)
10 20 30 40
SNR (dB)
Figure 4. (a) Signal-to-noise ratio in a neon lamp; (b) wavelength setting accuracy vs SNR.
The neon glow lamps have a rated lifetime of 15,000 h at 2 mA dc. We have performed acceler- ated life testing at 5 mA dc and have observed survival to the equivalent of 25,000 h at 2 mA dc with <2-dB loss in SNR. Beyond this length of use, the lamps begin to fail in a catastrophic fashion.
C. ALGORITHM
In the normal mode of diagnostics operation, the transmitter laser is started up at the current and temperature at which it is expected to access a neon line (usually the operating point from the last communications session). If the optogalvanic signal is not present, then the interference filter transmis- sion is checked and the laser is tuned in current or temperature until the wavelength is in the vicinity of the desired reference line within the accuracy of the filter. The laser frequency is then tuned via the bias current until the center of the neon line is found. If the laser power is altered beyond the operating specifications by the changes in current and temperature, then a power correction routine at approxi- mately constant wavelength is activated after which the wavelength is rechecked. Wavelength search and power correction routines can be iterated, if necessary, until they converge to the reference wave- length and specified optical power.

3. SETTING TONE SPACING
As stated in Section 1, tone spacing must be set to within 5 MHz of 220 MHz to prevent significant energy loss from misalignment of the transmitted spectrum with respect to the receiver filters. Figure 5 shows more precisely how tone-spacing error affects energy detected at the receiver. A 5-MHz error in spacing between adjacent tones leads to an energy loss in the outer demodulating filters in a 4-ary system that approaches 0.1 dB. Since this loss is only in the outer tones, the corresponding communication system power penalty is <0.1 dB. In other words, setting tone spacing to 5 MHz is sufficient to guarantee communication with insignificant system power penalty.
The method for setting tone spacing to 220 ± 5 MHz consists of two steps:
(a) Frequency modulate the laser at the system symbol rate with an alternating sequence of ones and zeros.
(b) Monitor the optical spectrum with a static confocal Fabry-Perot during modula- tion. The tone spacing can be deduced from the optical spectrum.
ID
i 50 100 12.5 175 225
ERROR BETWEEN ADJACENT TONES (MHz)
Figure 5. 4-ary outer tone loss vs tone-spacing error.
Figure 6 shows a typical Fabry-Perot measurement of the optical spectrum with square-wave modulation. In this system, the source spectrum is mapped out by holding the Fabry-Perot mirror spacing fixed while scanning the source spectrum. The Fabry-Perot has a free spectral range of 1.5 GHz and a finesse of 200, giving enough range to scan the whole optical spectrum and enough resolution to see individual sidebands.

< DC O z < CD HI o C/3
1.8 I 1 1 I I s.2 s2
I I
1.6
s2 + s.2 / 1.4 Si + S.! /
1.2 -
1 n I I
200 210 220
Af (MHz)
230 240
Figure 6. Sideband ratio vs tone-spacing Af.
N I 5 DC o DC DC HI O
< 0.
3 I I I I I
CALIBRATED AT LW = 15 MHz
I
2 —
1 -
0 -
-1 1 I I I I i 10 20
LINEWIDTH (MHz)
30
Figure 7. Tone-spacing error vs linewidth.

Once the optical spectrum has been recorded, tone spacing can be deduced by measuring the ratio between the second and first sidebands (averaging positive and negative frequency values). This ratio varies steeply with tone spacing in the vicinity of 220-MHz spacing (for the given symbol rate of 110 Msymbols/s), as shown in Figure 6. For example, a tone-spacing error of 5 MHz changes the sideband ratio from 1.35 to about 1.2. This change in ratio can be detected very easily with the SNR available. Tone spacing can thus be determined and set to much better than 5 MHz. It should be noted that nonzero laser linewidth will also influence the exact value of sideband ratio. The magnitude of this effect can be calculated by recognizing that both the laser and Fabry-Perot linewidths are approximately Lorentzian and therefore add together to form a new total Lorentzian linewidth. We can calculate the "spillover" of neighboring sidebands into a given sideband and arrive at adjusted values of sideband ratio. A typical value for laser linewidth is 7 MHz and the Fabry-Perot contributes 8 MHz, yielding a total system linewidth of 15 MHz. If one were to set sideband ratio for 220 MHz spacing assuming a linewidth of 15 MHz, then changes in the linewidth over laser lifetime would lead to errors in the tone spacing, ac- cording to the curve of Figure 7. As can be seen from this curve, substantial changes in linewidth lead to very small errors in tone spacing.
The static Fabry-Perot-based tone-spacing diagnostic described above works together with a companion microprocessor and algorithm. While the details of the algorithm are beyond the scope of this report, its main function is to allow autonomous setup of tone spacing from a "cold start." A "cold start" is one in which the relative positions in frequency of the laser spectrum and nearest Fabry-Perot trans- mission peak are unknown, and the "first guess" modulation current yields a tone spacing far from the nominal of 220 MHz. In short, the design of the algorithm, the sensitivity of sideband ratio to tone spacing, and the choice of a static confocal Fabry-Perot as the main measuring device all combine to make a robust autonomous tone-spacing diagnostic for space-based operation.

4. MECHANICAL AND THERMAL DESIGN
A. INTRODUCTION
One of the important features of the schemes described in Sections II and III to set wavelength and tone spacing is that the hardware associated with them can be housed in a light, space-qualifiable optomechanical module which has loose alignment tolerances, simple alignment procedures, and requires no active thermal control. This section describes the mechanical and thermal aspects of that module, which has been designed to survive -20° to +60°C thermal cycling, random vibration to 34 g's rms, and the severe radiation and contamination environment anticipated in launch and space operation.
B. HOUSING AND OPTICAL LAYOUT
Figure 8 shows the overall configuration which occupies a 2 x 5.25 X 8-in volume and weighs 3 lb. The housing consists of separate electronics and optics cavities, allowing parallel development of the two functions, as well as preventing cross-contamination of parts. The electronics cavity has more than adequate space to house the lock-in amplifier associated with the neon reference and conditioning electronics. The optical cavity has six optical subassemblies mounted directly to its interior walls. The housing is made of aluminum and is supported by kinematic flexures which mount to a lower thermal expansion beryllium surface. These flexures, combined with the weight of the diagnostic module, create a first structural resonance of 375 Hz, well above the launch spectrum peak. The beryllium surface is temperature controlled to 25° ± 2°C, with slow changes expected. This benign thermal environment, combined with <2-W power dissipation internal to the diagnostic module, causes minimal structural deformations.
Figures 8 and 10 show the beam path in the diagnostic module. The alignment tolerance on the beam at the entrance aperture is ~2-mrad radial angle and 0.25-mm radial position, which can be met by open loop pointing of the source. Beyond the entrance aperture the beam is directed by three beam- splitter cubes bonded to a common plate to the various subassemblies. Feedback from the beam splitters and the subassemblies back into the laser source is prevented by a variety of measures. These include tilting optics and inserting neutral density filters where possible, inserting a polarizer cube to reduce non- polarized backscatter, including light shrouds to contain and localize reflected and scattered light, and covering the inner surface of the housing with a low-reflectivity black paint.
C. SUBASSEMBLIES
Figure 9 shows some important features of the Fabry-Perot subassembly design. The lens barrel is made of Invar, allows adjustment of mirror spacing, and is supported in an aluminum mount. Invar limits thermal de-space to 0.6 |im for 10°C changes, allowing mirror spacing (and thus finesse) to be maintained over all operating temperatures. The mirrors used are ruggedized versions of commercially available units. To accommodate thermal coefficient differences between Invar and aluminum, the Invar barrel is located in an aluminum V-groove, in which it can slide while the aluminum expands. The
10

FLEXURE FOOT CONNECTOR
INTERFERENCE FILTER DETECTOR
OPTICAL CAVITY EAST SIDE
ELECTRONICS CAVITY WEST SIDE
I Figure 8. Diagnostic module layout and housing.
11

I
PINHOLE APERTURE
SPRING STATIONARY LENS BARREL
ADJUSTABLE LENS BARREL
MOUNTING PLATE
MIRROR RETAINING RING
Figure 9. Fabry-Perot interferometer.
I
POLARIZER
ND Fl LTER
Jf TO FPI
TO NEON
RIGHT ANGLE PRISM
INPUT ~>^ \l
TO INTERFERENCE FILTER DETECTOR
""S 0 POWER MONITOR
Figure 10. Beam director assembly.
12

pinhole aperture at the front of the Fabry-Perot improves its finesse, and desensitizes the assembly to variations in input beam position. When the Fabry-Perot is mounted into the diagnostic module, it can be adjusted in elevation angle, and the whole diagnostic module housing can be adjusted in azimuth angle and position, allowing the Fabry-Perot axis to be aligned with the incoming beam.
The neon glow lamp subassembly shown in Figure 11 houses a glow lamp which is 0.25-in diam- eter and 0.75-in long, with a maximum power dissipation of 0.25 W. The lamp is located within its housing by a V-groove and pin, and is encapsulated with a space-qualified RTV adhesive. The neon assembly can be adjusted in azimuth and elevation position to maximize optogalvanic signal strength.
BASE
£
V-GROOVE
LAMP
COVER yism \ REGISTRATION PIN
WIRE LEADS
Figure 11. Neon glow lamp.
While both the neon assembly and Fabry-Perot interferometer assembly need to be aligned when placed into the larger diagnostic module housing, the detectors and interference filter shown in Figure 12 require no active alignment. All three detectors have active areas greater than twice the beam diameter, allowing simple mechanical registration against the housing. Accurate use of the interference filter requires that the beam be normal to the filter surface to within 5 mrad. This is accomplished with standard machining tolerances.
§
FPI DETECTOR POWER MONITOR
Figure 12. Interference filler and detectors.
INTERFERENCE FILTER DETECTOR
13

5. CONCLUSION
This report has described the design and performance of a space-based diagnostic unit which is a companion to an FSK GaAlAs laser transmitter. This diagnostic unit periodically updates transmitter bias current, modulation current, and temperature to maintain constant wavelength , tone spacing, and power as the transmitter laser diode ages. Furthermore, all these functions are performed with rugged hardware that weighs 3 lb, dissipates <2 W, and has alignment tolerances on the order of milliradians and tenths of millimeters.
In addition to meeting the requirements of the 4-ary 220-Mb/s communication system described in this report, the diagnostic system can be used as a more general monitor of laser diode health over its lifetime in orbit. The interference filter, for example, can be used to measure the diode tuning curve. The known frequency spacing of the Fabry-Perot transmission peaks can be exploited in measuring diode current and frequency tuning coefficients or for offset tuning from a neon line. In summary, the combi- nation of neon lamp, interference filter, and Fabry-Perot in this diagnostic system not only aids the successful operation of a specific communication system, but also constitutes a versatile information- gathering package for diode laser space communication.
14

UNCLASSIFIED SECURITY CLASSIFICATION OF THIS PAGE
REPORT DOCUMENTATION PAGE la. REPORT SECURITY CLASSIFICATION
Unclassified
lb. RESTRICTIVE MARKINGS
2a. SECURITY CLASSIFICATION AUTHORITY
2b. DECLASSIFICATION/DOWNGRADING SCHEDULE
3. DISTRIBUTION/AVAILABILITY OF REPORT
Approved for public release; distribution is unlimited.
5. MONITORING ORGANIZATION REPORT NUMBER(S)
ESD-TR-89-111
4. PERFORMING ORGANIZATION REPORT NUMBER(S)
Technical Report 850
6a. NAME OF PERFORMING ORGANIZATION
Lincoln Laboratory, MIT
6b. OFFICE SYMBOL (If applicable)
7a. NAME OF MONITORING ORGANIZATION
Electronic Systems Division
6c. ADDRESS (City, State, and Zip Code)
P.O. Box 73 Lexington, MA 02173-0073
7b. ADDRESS (City, State, and Zip Code)
Hanscom AFB, MA 01731
9. PROCUREMENT INSTRUMENT IDENTIFICATION NUMBER
F19628-85-C-0002
8a. NAME OF FUNDING/SPONSORING ORGANIZATION
HQ AF Systems Command
8b. OFFICE SYMBOL (If applicable)
AFSC/XTKT
8c. ADDRESS (City, State, and Zip Code)
Andrews AFB Washington, DC 20334-5000
10. SOURCE OF FUNDING NUMBERS
PROGRAM ELEMENT NO.
63789F
PROJECT NO.
270
TASK NO.
WORK UNIT ACCESSION NO
11. TITLE (Include Security Classification) Design and Performance of an On-Satellite Laser Diagnostic System for a Free Space Optical Heterodyne Frequency-Shift-Keyed Communication System
12. PERSONAL AUTHOR(S) Vijaysekhar Jayaraman, Emily S. Kintzer, James G. Garcia, and Allen D. Pillsbury
13a. TYPE OF REPORT Technical Report
13b. TIME COVERED FROM TO .
14. DATE OF REPORT (Year, Month, Day) 1989, July, 11
15. PAGE COUNT 19
16. SUPPLEMENTARY NOTATION
None
17. COSATI CODES
FIELD GROUP SUB-GROUP
18. SUBJECT TERMS (Continue on reverse if necessary and identify by block number)
space communications diode lasers
laser diagnostics frequency-shift-keyed
19. ABSTRACT (Continue on reverse if necessary and identify by block number)
The advent of space-based coherent diode laser communication systems requires development of space-qualified laser diagnostics to make these systems robust in face of aging laser parameters. This report describes the packaging and performance of a diagnostic system which sets the wavelength, tone spacing, and optical power of a directly modulated frequency- shift-keyed GaAlAs laser transmitter.
20. DISTRIBUTION/AVAILABILITY OF ABSTRACT
D UNCLASSIFIED/UNLIMITED B SAME AS RPT. D DTIC USERS
21. ABSTRACT SECURITY CLASSIFICATION
Unclassified
22a. NAME OF RESPONSIBLE INDIVIDUAL
Lt. Col. Hugh L. Southall, USAF
22b. TELEPHONE (Include Area Code)
(617) 981-2330
22c. OFFICE SYMBOL ESD/TML
DD FORM 1473. 84 MAR 83 APR ftdition may b« uMd until exhausted. All other •dltioru «ra obaotat*.
UNCLASSIFIED SECURITY CLASSIFICATION OF THIS PAGE