design and manufacturing for the environmentweb.mit.edu/ebm/www/publications/gutowski mech eng...
TRANSCRIPT

Design and Manufacturing for the Environment
[email protected] Dec 6, 2004 1
Timothy G. Gutowski for the Handbook of Mechanical Engineering, Springer-Verlag
1. Introduction Human society can be envisioned as interacting with the environment in two ways: as a source for natural resources, and as a sink for emissions and wastes. The environmental problems addressed here are all related to overuse at both sources and sinks. Overuse at sources shows up as depletion and the reduced quantity and quality of resources. Overuse at sinks shows up as unbalancing the harmony of previously natural processes. Often the change in balance takes years to detect and can be influenced by a variety of factors, making isolation and identification of the problems difficult and sometimes controversial. Nevertheless, over time many of these problems have been identified. They include ozone depletion, global warming, acidification, and eutrophication, among others. Corrective action often involves changes in the types and ways we use materials and energy for the production, use, and disposal of products. Table 1 lists commonly agreed upon environmental concerns and aspects of production, consumer use, and disposal that contribute to these concerns.
Table 1. List of Environmental Concerns and linkages to Manufacturing Processes
Environmental Concerns Linkage to Manufacturing Processes 1. Global climate change Greenhouse gas (GHG) emissions from direct and
indirect energy use, land fill gases, etc. 2. Human organism damage Emission of toxins, carcinogens, etc. including use
of heavy metals, acids, solvents, coal burning… 3. Water availability and quality Water usage and discharges e.g. cooling and
cleaning use in particular 4. Depletion of fossil fuel resources Electricity and direct fossil fuel usage e.g. power
and heating requirements, reducing agents 5. Loss of biodiversity Land use, water usage, acid deposition, thermal
pollution 6. Stratospheric ozone depletion Emissions of CFCs, HCFCs, halons, nitrous oxides
e.g. cooling requirements, refrigerants, cleaning methods, use of fluorine compounds
7. Land use patterns Land appropriated for mining, growing of bio -materials, manufacturing, waste disposal
8. Depletion of non-fossil fuel resources Materials usage and waste 9. Acid disposition Sulfur and NOx emissions from smelting and fossil
fuels, acid leaching and cleaning Table 1 clearly conveys the message that many of our environmental problems are directly related to materials usage including energetic materials. In particular, note that several prominent concerns listed in Table 1 are directly related to our use of fossil fuels to generate energy. These include: CO2 and NOx emissions from the combustion of all fossil fuels, and SOx and several heavy metals including As, Cd, Cr, and Hg which are deposited to land from the combustion of coal [Nriagu 1988, Graedel 1998a]. In fact, at least four out of nine of the concerns listed above are related to fossil fuel use, including numbers 1, 2, 4, and

Design and Manufacturing for the Environment
[email protected] Dec 6, 2004 2
9. Because of this overriding importance, we will pay particular attention to tracking energy usage in the life cycle of products. 2. Life Cycle Format for Product Evaluation A very important aspect of environmental analysis simply involves “connecting the dots.” In other words, showing the interconnectivity of human activities, and in particular, material flows. Few people contemplate where resources come from, or where they go after they are used, yet this is essential for life cycle analysis. With a life cycle accounting scheme one can then properly “burden” each product or activity with its environmental load. This information, in turn, can be used to answer the question, “is the utility gained from this product or activity worth the associated environmental load?” Although conceptually simple, this task is, in fact, quite complex. The major complexities are: 1) establishing system boundaries, 2) obtaining accurate data, 3) representing the data with concise descriptors that appropriately assign responsibility, and 4) properly valuing the results.
Our approach will be to represent the product using material flow diagrams which capture the major inputs and outputs. In general, we will not attempt to relate these inputs and outputs to specific levels of environmental harm but only to identify them as “environmental loads,” known to cause harm and excellent targets for technical improvement. When specific amounts of inputs used or outputs emitted are given, this type of analysis is called a Life Cycle Inventory (LCI). The full Life Cycle Analysis (LCA) includes LCI plus a connection between the loads produced and associated harm caused and often a value ranking among the different types of harm. Some LCA methods use these value rankings to generate a single number result. This can greatly ease decision-making, but requires agreement with all of the implied value tradeoffs, something often difficult to accomplish.
Before proceeding further, it is important to more clearly establish the idea of a
product life cycle. This is generally conceived of as a materials flow process that starts with extraction of raw materials from the earth and ends with the disposal of the waste products back to the earth. The general stages of this linear “once through” cycle are: 1) material extraction, 2) primary processing and refining, 3) manufacturing, 4) product distribution, 5) use, and 6) final disposition. This sequence follows the principal product material flow, but of course there are multiple cross flows (consider the materials used by products e.g. paper in printers and gasoline in automobiles) as well as backflows, such as product reuse, component remanufacturing, and material recycling. Figure 1 illustrates these flows in a general way, indicating cross flows both from nature and society as well as the major recycling flows. Society can then be represented by a vast array of these networks, which are interconnected but ultimately all originate from and lead to ground – the earth. This thought experiment clearly suggests the complexity of our problem. In practice this task is simplified by clearly defining the system boundaries and the objectives of the life cycle study. Problems can arise when the system is drawn too large due to the interconnectivity of materials systems, and when the system is drawn too small due to truncation. Matrix inversion methods, identical to those used in economic input-output analysis [Leontief 1966], along with high level

Design and Manufacturing for the Environment
[email protected] Dec 6, 2004 3
summary statistics have been called upon to help with the first problem [Hendrickson 1998, Miller 1985], while experience, iteration and hybrid approaches are used to address the second [Joshi 2000, Suh 2004].
The most common practice among LCA practitioners is based on developing process flow diagrams similar to Figure 1 for the product and tracing the major input and output paths to earth. This requires data such as a bill of materials and lists of manufacturing processes, common use scenarios, distribution channels, and end of life characteristics for the product. The output then is a long list of material and energy inputs as well as emissions to the environment. These lists can easily include hundreds of materials, which then require some simplification and aggregation in order to interpret. In this chapter, we will use a simplified format suggested by Graedel in his book on Streamlined Life Cycle Analysis (SLCA) [Graedel 1998b]. This involves examining each stage of the life cycle and identifying major impacts and opportunities for improvement in five categories: 1) materials choice, 2) energy use, 3) solid residues, 4) liquid residues, and 5) gaseous residues. Graedel then suggests scoring each stage of the life cycle for each of the five categories with a numerical score from 0, being the worst, to 4, being the best. These scores are given relative to best practice for the product under consideration. In general, a score of 0 is reserved for a blatantly poor and/or uninformed practice that raises significant environmental concern, while a score of 4 indicates excellent environmental performance with no known serious concerns. A perfect product would thus obtain a score of 100. Graedel gives more detailed guidance on how to score each element of the 5 x 5 matrix, as shown in Table 2, which represents the product.
Table 2. The Environmentally Responsible Product Assessment Matrix [Graedel 1998b]
Environmental Stressor Life Cycle Stage Materials
Choice Energy Use Solid
Residues Liquid Residues
Gaseous Residues
Premanufacture 11 12 13 14 15 Product Manufacture 21 22 23 24 25 Product Delivery 31 32 33 34 35 Product Use 41 42 43 44 45 Refurbishment, Recycling, Disposal
51 52 53 54 55
(The numbers are the indices for the matrix element Mij ) 3. Life Cycle Stages for a Product In this section we will identify some of the major environmental issues that appear in each of the five stages for a product life cycle. The scoring of products for SLCA depends on the extent the designer and manufacturer make an effort to avoid these problems and substitute alternative materials and technology when possible.
Design and Manufacturing for the Environment
[email protected] Dec 6, 2004 4
3 a) Premanufacture: Materials extraction and primary processing Many of the environmental impacts associated with ma terials selection appear to occur in the very early stages of the material life cycle. This can be surmised by looking at United States national statistics for energy use, pollutants, and hazardous materials by various industrial sectors. For example, in Figure 2, some of the manufacturing industries are broken out by standard industrial categories (SIC codes) in terms of CO2 and toxic materials per value of shipments. The primary processing of chemicals, petroleum and coal, and primary metals, have significantly larger environmental loads than other manufacturing sectors such as plastics and rubber, fabricated metals, machinery, electronics, and transportation. While not shown in Figure 2, the metal mining industry would also show up prominently on this list. For example, toxic material releases for US metal mining in 1998 were equal to 145% of the toxic material releases from all of the manufacturing industries in the United States combined (including primary processing) [EPA/TRI 1998]. These large normalized impacts can be explained in two ways – relatively large emissions and relatively low prices. Primary processing industries handle very large quantities of materials, introducing many opportunities for economies of scale. At the same time, this high materials usage leads to large waste and emissions levels. For example, mining is very material intensive, producing ore wastes to metals ratios that range from about 3:1 for iron and aluminum, to 10,000:1 for gold. In addition, many metals exist as, or occur in companion with, metallic sulfides. Once these materials are exposed to the surface they can oxidize into sulfates and sulfuric acid runoff, which can cause significant damage by acid mine drainage. Many of the most common metals can lead to acid mine drainage including copper, iron, nickel, lead, and zinc. In addition, some of the early processes can use other hazardous materials. If these materials escape, widespread environmental damage can occur. For example, the leaching of gold employs toxic cyanide compounds.
Similarly, primary materials processing can be both materials and energy intensive. For example, the production of 1 kg of aluminum requires on the order of 12 kg of input materials and 290 MJ of energy [Smil 1999]. The ene rgy for this production plus other processing effects, in turn, leads to about 15 kg of CO2 equivalent for every kg of aluminum produced [Martchek 1998]. Table 3 gives the energy requirements for some materials. Note that aluminum is on the high range of these materials, on the order of silicon but substantially less than titanium. The substitution of recycled materials can greatly reduce this energy requirement. Conversely the requirement for ultra high purity can greatly increase this requirement. For example, the recycled energy requirement versus “virgin” material is only about 5% for aluminum and 30% for steel [Chapman 1983], while the energy requirements for wafer grade silicon used in the semiconductor industry is about 33 times commercial grade [Williams 2002]! Hence, the mere act of selecting materials can in itself define a large part of the environmental footprint for a product. Graedel and Allenby suggest several other criteria to consider when selecting materials, including toxicity and abundance [Graedel 1998a]. The ratings for some elements are given below in Tables 4 and 5.

Design and Manufacturing for the Environment
[email protected] Dec 6, 2004 5
Table 3. Typical Energy Requirements for Some Common Materials [Smil 2002] Material Energy Cost (MJ/kg) Made or extracted from Aluminum 227-342 Bauxite Copper 60-125 Sulfide ore Glass 18-35 Sand, etc. Iron 20-25 Iron ore Nickel 230-70 Ore concentrate Paper 25-50 Standing timber Polyethylene 87-115 Crude Oil Polystyrene 62-108 Crude Oil Polyvinylchloride 85-107 Crude Oil Silicon 230-235 Silica Steel 20-50 Iron Titanium 900-940 Ore concentrate Wood 3-7 Standing timber
Table 4. Toxicity Ratings for Some of the Elements [Graedel 1998a]
Toxicity Rating Example Elements high toxicity Beryllium, Arsenic, Cadmium, Mercury, Lead, moderate toxicity Lithium, Boron, Chromium, Cobalt, Nickel,
Copper, Bismuth low toxicity Aluminum, Silicon, Titanium, Iron, Zinc, Bromine,
Silver, Tin, Tungsten, Gold,
Table 5. Classes of Supply for some of the Elements [Graedel 1998a] Worldwide Supply Example Elements Infinite supply Bromine, Calcium, Chlorine, Krypton, Magnesium,
Silicon Ample supply Aluminum (Gallium), Carbon, Iron, Potassium,
Sulfur, Titanium Adequate supply Lithium, Phosphorus Potentially limited supply Cobalt*, Chromium**, Nickel*, Lead(Arsenic,
Bismuth), Platinum**, Zirconium Potentially highly limited supply Silver, Gold, Copper, Mercury, Tin,
Zinc (Cadmium) * Supply is adequate, but virtually all from South Africa and Zimbabwe. This geographical distribution makes supplies potentially subject to cartel control. ** Maintenance of supplies will require mining seafloor nodules. Note materials in parentheses are co-mined with the parent material listed in front.

Design and Manufacturing for the Environment
[email protected] Dec 6, 2004 6
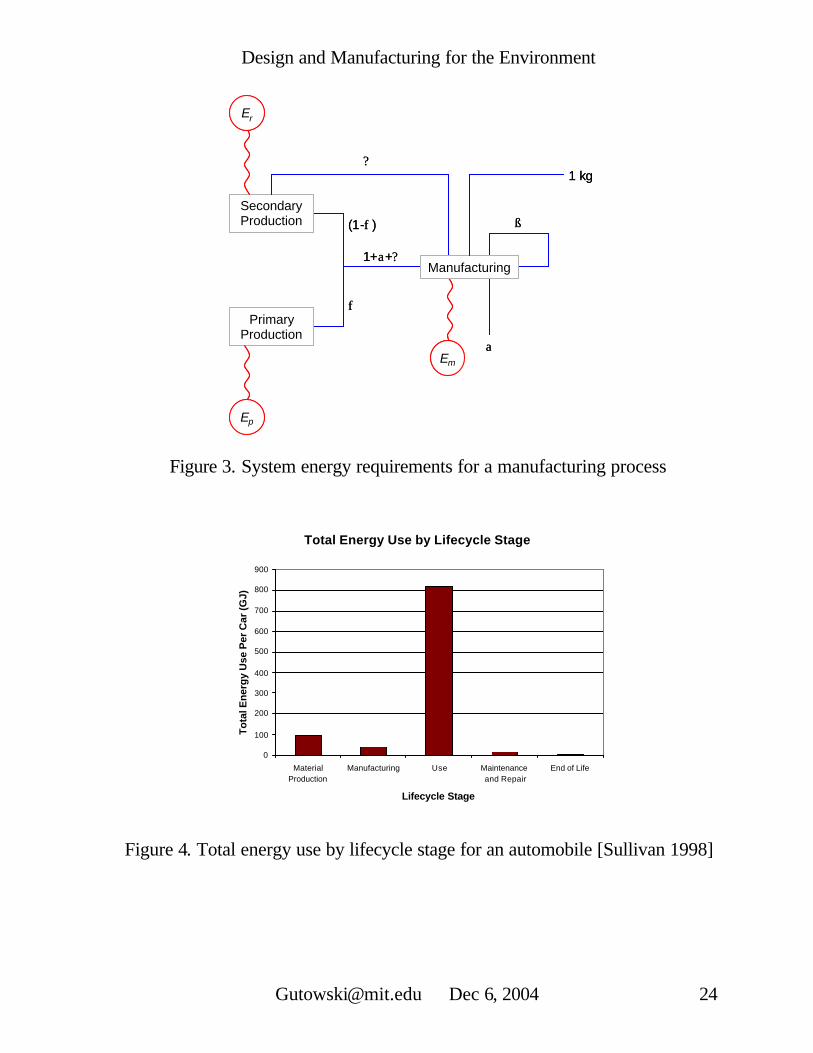
3 b) Manufacturing Processes As a group, manufacturing processes appear to be quite benign compared to materials extraction and primary processing as indicated in Figure 2. However, manufacturing processes often set many of the requirements for primary processing outputs. For example, processes with higher scrap rates require more energy in primary processing. Alternatively, processes which can use large quantities of recycled materials will have greatly reduced primary energy needs. This concept can be illustrated more rigorously by writing an equation for the embodied energy1 content for a hypothetical manufacturing process which uses Em energy per kilogram of product produced. Let the waste fractions be: α to ground, γ to recycle, and β to “prompt scrap” (recycled within the factory). This process uses the fraction φ of primary material with embodied energy Ep and fraction (1 – φ) recycled material with embodied energy Er, where in general Er ≤ Ep. From this, the sum of the energy requirement “Es”, to produce one kilogram of product is (see Figure 3).
Es = (φEp + (1 – φ)Er) (1 + α + γ) + Em(1 + α + β + γ) eqn. 1 Hence, even though it may be that Em << Ep, equation 1 illustrates the long reach of the manufacturing process and its influence both up and down the product life cycle. As an example, consider the differences between machining and casting a part. While it might be true that Em (casting) > Em (machining), generally speaking φmachining >> φcast ing. Furthermore, the waste for machining, particular α and γ, which show up in the first part of equation 1, can be quite large. In contrast, for large casting operations, most metal waste shows up in β , which does not occur in the first term. Hence in some situations, and quite counter- intuitively, casting may be a more environmentally benign process than machining! Of course, this statement is based only on embodied energy usage and ignores other possible emissions. Generally speaking however, while primary processing adds energy of order 100 MJ/kg (Ep) to any product, manufacturing adds energy of order 10 MJ/kg (Em) [Dahmus 2004, Dalquist 2004]. The real role of manufacturing is that it draws in materials and energy not directly incorporated into the product and then expels them, often as wastes or emissions to the environment. In addition to fossil fuel usage, a second environmentally important class of materials used in manufacture is cleaning fluids and coatings. Manufacturing often involves the cleaning and preparation of surfaces. Of particular concern are many of the solvents which are used to remove cutting fluids, lubricants, and other materials from the surface of the parts. In order to avoid the use of hazardous materials, many manufactures have replaced organics with water based and mechanical cleaning methods [Sherman 1998].
1 It has become common to discuss the energy “used up” in a process, but by the first law of thermodynamics we know that the energy is not actually lost. Rather, it is made unavailable. A more accurate thermodynamic quantity, “exergy” can be used up, and is more precisely what we mean in our discussion of “energy used.”

Design and Manufacturing for the Environment
[email protected] Dec 6, 2004 7
3 c) Product Delivery
Product delivery involves two important types of environmental loads: transportation and packaging. The transportation of products around the world provides jobs and opportunities for many, but at the same time constitutes a major component of energy usage and related emissions. Furthermore, the geographical separation of product use from manufacturing can create significant barriers for the recycling of some materials. Packaging waste is particularly egregious because of the large amounts of materials with only a very short intended lifetime. Furthermore, the customer gets the opportunity to experience this waste first hand.
3 d) Product Use It is probably true that the vast majority of consumer appliances, electrical products, vehicles, lawn equipment, power tools, etc. – in short anything that has a power cord or runs on gasoline – has its largest or second largest impact during the use phase. Products with power cords draw energy from the utility station, which, in the US, have an average efficiency of about 35% and still burn 50% coal. These two facts alone often completely dominate the environmental impact of some products. Furthermore, powered devices can consume still other materials, e.g. paper and ink in printers, coffee in espresso machines, water in refrigerators with electric ice makers, etc. By and large, these automated appliances are considered desirable conveniences, but automated usage often, and unintentionally, leads to automated waste too.
3 e) Disposition Most products in the United States end up in landfills, some are incinerated, and a few are recycled. In general, US landfill access has been significantly diminishing, particularly in the highly populated northeast. Many states have been closing landfills faster than they are opening new ones. Some states have moratoriums on new landfill development, and many ship their waste out of state. Furthermore, lined landfill sites for the collection of hazardous materials are highly restricted, leading to very high transportation and disposal costs for hazardous substances. While incineration is not very popular in the United States, particularly in well- to-do communities, it is very much an active option for a significant portion of the Municipal Solid Waste (MSW) generated. Incineration can be combined with an electrical generation facility to produce power. Furthermore, the emissions can be scrubbed for various emissions. Nevertheless, it is difficult to tightly control the incoming waste stream and hence a wide variety of emissions, some not anticipated, can occur. In addition, it is well known that

Design and Manufacturing for the Environment
[email protected] Dec 6, 2004 8
municipal incinerators are one of the top producers of dioxin2 in the United States and dioxin is extremely expensive to scrub [Thomas 1996, Grubler 1998]. A number of products are widely recycled in the United States. These include automobiles, tires (as a fuel to generate energy), newspapers, aluminum cans and, to a lesser extent, mixed paper and high density polyethylene (HDPE) and polyethylene terephthalate (PET) bottles. 4. Product Examples: Automobiles and Computers LCA, LCI and SLCA can all help identify where major opportunities for environmental improvement occur for a product. The results depend on product characteristics and the environmental loads of concern. Often our attention goes to those loads with the highest environmental profile. For example, in the life of a paper cup the use stage is short and the disposal can be benign, hence our attention goes immediately to the paper making process, which has a variety of issues, many associated with the pulp bleaching process for kraft paper making, and possibly to the distribution stage, if the cups are transported a long distance. Another example, the disposable diaper, focuses attention on the waste disposal problem, while the reusable cloth diaper focuses attention on the energy intensive washing cycle. Other products can be more complex, with major issues in several life cycle stages. Here we review life cycle issues for automobiles and computers. 4 a) Automobiles The automobile has been subject to numerous studies concerning its environmental load3 [Keoleian 1993, Sullivan 1998, Maclean 1998, Graedel 1998b and 1998c, DeCicco 1999, Weiss 2000]. As one can imagine, given the tens of thousands of parts, and the complexity of consumer behaviors, vehicle types, and driving conditions, this is an enormous task. Yet, in spite of all of this complexity the results have been quite consistent. By far the most important place to look for opportunities for environmental improvement is in the vehicle use stage. It is during this approximately 10 year period where the average vehicle, with a fuel efficiency of about 10 km/L (23.8 miles/gallon), burns about 14 metric tons of gasoline while traveling about 120,000 miles. Fur thermore, due to the stoichiometry of the combustion process, this fuel consumption translates into some 40 metric tons of CO2. When other aspects of the life cycle are included (the energy to make the fuel, etc.) and other greenhouse gases are converted to their CO2 equivalent, the resulting equivalent CO2 emissions over the life time of the vehicle are about 94 metric tons or 9.4 tons/year. Other emissions during the use stage are also high, including NOx, VOCs (volatile organic compounds, which contribute to ground level ozone and smog), and other hazardous materials at lower levels. Other areas of concern are painting and cleaning during
2 Dioxin is a short name for a group of chemicals which have been found to be highly persistent, toxic and carcinogenic. 3 This discussion focuses on the automobile as a product. Other issues related to the automobile, for example how it has shaped our lifestyles and land use patterns, while very important, are not included in this discussion.

Design and Manufacturing for the Environment
[email protected] Dec 6, 2004 9
manufacturing, leaks and emissions during use and maintenance, and remaining quantities of unrecyclable materials: plastics, glass, foam, rubber, etc. The total energy use by stage, shown in Figure 4, indicates that energy use during material production and manufacturing are also significant [Sullivan 1998]. A general assessment of how the environmental performance of the automobile has changed over the years can be found in Graedel, who performed an SLCA to compare a 1950s era automobile to one from the 1990s [Graedel 1998b]. The assumed characteristics of the cars are given in Table 6. Their ratings for each of the five impact categories in each of the five life cycle stages are given in Tables 7 through 11. The final matrix values are summarized in Table 12, and plotted as a target plot in Figure 5.
Table 6. Characteristics of Generic Automobiles [Graedel 1998b]
Characteristics ca. 1950s Automobile ca. 1990s Automobile Material (kg): Plastics 0 101 Aluminum 0 68 Copper 25 22 Lead 23 15 Zinc 25 10 Iron 220 207 Steels 1290 793 Glass 54 38 Rubber 85 61 Fluids 96 81 Other 83 38 Total Weight: (kg) 1901 1434 Fuel Efficiency (miles/gallon) 15 27 Exhaust Catalyst No Yes Air Conditioning CFC-12 HFC-134a
Table 7. Premanufacturing Ratings [Graedel 1998b] Element Designation
Element Value & Explanation: 1950s Auto
Element Value & Explanation: 1990s Auto
Matls. choice 1,1 2 Few hazardous materials are used, but most materials are virgin
3 Few hazardous materials are used, and much recycled material, Pb in battery in closed recycle loop
Energy use 1,2 2 Virgin material shipping is energy-intensive
3 Virgin material shipping is energy-intensive
Solid residue 1,3 3 Iron and copper ore mining generate substantial solid residues
3 Metal mining generates solid residues
Liq. Residue 1,4 3 Resource extraction generates moderate amounts of liquid residues
3 Resource extraction generates moderate amounts of liquid residues
Gas residue 1,5 2 Ore smelting generates significant amounts of gaseous residues.
3 Ore processing generates moderate amounts of gaseous residues

Design and Manufacturing for the Environment
[email protected] Dec 6, 2004 10
Table 8. Product Manufacture Ratings [Graedel 1998b] Element Designation
Element Value & Explanation: 1950s Auto
Element Value & Explanation: 1990s Auto
Matls. choice 2,1 0 Chlorinated solvents, cyanide 3 Good materials choices, except for lead solder waste
Energy use 2,2 1 Energy use during manufacture is high
3 Energy use during manufacture is fairly high
Solid residue 2,3 2 Lots of metal scrap and packaging scrap produced
3 Some metal scrap and packaging scrap produced
Liq. Residue 2,4 2 Substantial liquid residues from cleaning and painting
3 Some liquid residues from cleaning and painting
Gas residue 2,5 1 Volatile hydrocarbons emitted from paint shop
3 Small amounts of volatile hydrocarbons emitted
Table 9. Product Delivery Ratings [Graedel 1998b] Element Designation
Element Value & Explanation: 1950s Auto
Element Value & Explanation: 1990s Auto
Matls. choice 3,1 3 Sparse, recyclable materials used during packaging and shipping
3 Sparse, recyclable materials used during packaging and shipping
Energy use 3,2 2 Over-the-road truck shipping is energy-intensive
3 Long-distance land and sea shipping is energy-intensive
Solid residue 3,3 3 Small amounts of packaging during shipment could be further minimized
3 Small amounts of packaging during shipment could be further minimized
Liq. Residue 3,4 4 Negligible amounts of liquids are generated by packaging and shipping
4 Negligible amounts of liquids are generated by packaging and shipping
Gas residue 3,5 2 Substantial fluxes of greenhouse gases are produced during shipment.
3 Moderate fluxes of greenhouse gases are produced during shipment
Table 10. Product Use Ratings [Graedel 1998b] Element Designation
Element Value & Explanation: 1950s Auto
Element Value & Explanation: 1990s Auto
Matls. choice 4,1 1 Petroleum is a resource in limited supply
1 Petroleum is a resource in limited supply
Energy use 4,2 0 Fossil fuel energy use is very large 2 Fossil fuel energy use is large Solid residue 4,3 1 Significant residues of tires,
defective or obsolete parts 3 Modest residues of tires, defective
or obsolete parts Liq. Residue 4,4 1 Fluid systems are very leaky 3 Fluid systems are somewhat
dissipative Gas residue 4,5 0 No exhaust gas scrubbing; high
emissions 2 CO2, lead (in some locales)

Design and Manufacturing for the Environment
[email protected] Dec 6, 2004 11
Table 11. Refurbishment/Recycling/Disposal Ratings [Graedel 1998b] Element Designation
Element Value & Explanation: 1950s Auto
Element Value & Explanation: 1990s Auto
Matls. choice 5,1 3 Most materials used are recyclable 3 Most materials recyclable plastics, glass, foam not recycled, sodium azide presents difficulty
Energy use 5,2 2 Moderate energy use required to disassemble and recycle materials
2 Moderate energy use required to disassemble and recycle materials
Solid residue 5,3 2 A number of components are difficult to recycle
3 Some components are difficult to recycle
Liq. Residue 5,4 3 Liquid residues from recycling are minimal
3 Liquid residues from recycling are minimal
Gas residue 5,5 1 Recycling commonly involves open burning of residues
2 Recycling involves some open burning of residues
Table 12 a. Environmentally Responsible Product Assessment for the Generic 1950s
Automobile [Graedel 1998b]
Environmental Stressor Life Cycle Stage Materials
Choice Energy Use
Solid Residues
Liquid Residues
Gaseous Residues
Total
Premanufacture 2 2 3 3 2 12/20 Product Manufacture
0 1 2 2 1 6/20
Product Delivery
3 2 3 4 2 14/20
Product Use 1 0 1 1 0 3/20 Refurbishment, Recycling, Disposal
3 2 2 3 1 11/20
Total 9/20 7/20 11/20 13/20 6/20 46/100
Table 12 b. Environmentally Responsible Product Assessment for the Generic 1990s Automobile [Graedel 1998b]
Environmental Stressor Life Cycle Stage Materials
Choice Energy Use
Solid Residues
Liquid Residues
Gaseous Residues
Total
Premanufacture 3 3 3 3 3 15/20 Product Manufacture
3 2 3 3 3 14/20
Product Delivery
3 3 3 4 3 16/20
Product Use 1 2 2 3 2 10/20 Refurbishment, Recycling, Disposal
3 2 3 3 2 13/20
Total 13/20 12/20 14/20 16/20 13/20 68/100

Design and Manufacturing for the Environment
[email protected] Dec 6, 2004 12
4 b) Computers The study of the environmental footprint for computers is an interesting contrast to automobiles. While automobiles use mostly conventional materials and many standard manufacturing processes, the microchips in computers use much more specialized materials and rapidly changing process technology. The result is that the complete life cycle of the computer has not been filled in to the extent that the automobile has. This is clearly illustrated in the important paper “The 1.7 Kilogram Microchip: Energy and Materials Use in the Production of Semiconductor Devices,” by Eric Williams, Robert Ayres, and Miriam Heller [Williams 2002], which illustrated that there is far less agreement on the magnitudes of the environmental impacts associated with microchip fabrication. Nevertheless the available data indicate that microelectronics fabrication is very materials and energy intensive, in fact orders of magnitude more so than, for example, automobile manufacturing. In particular, approximately 1.7 kg of materials (including fuel) are needed to make a 2 gram microchip. This certainly undermines some claims that microelectronics represent a form of dematerialization. Some of the chief findings of Williams et al are summarized in Table 13.
Table 13. Chief Findings of Microelectronics Fabrication [Williams 2002]
Mass of 32 MB DRAM chip 2 grams Total chemical inputs 72 g/chip Total fossil fuel inputs 1,600 g/chip Total water use 32,000 g/chip Total elemental gas use 700 g/chip
At the same time, it is important to keep in mind that a computer is made up of much more than microchips, and the life cycle includes more than the fabrication stage. An approximate bill of materials for a desktop computer and CRT monitor are given in Table 14. In this context the microchips and their constituents hardly show up. In fact many of the materials used in a computer are rather conventional. However, there are some materials of concern. Lead is present in both the CPU and the monitor, cadmium (not listed) may be present in the batteries, mercury can be used in some switches and is used in laptop displays, and there is growing concern, particularly in Europe, over brominated flame-retardants, which are used in the plastics.

Design and Manufacturing for the Environment
[email protected] Dec 6, 2004 13
Table 14. Bill of Materials for a Desktop Computer and CRT Monitor [Kuehr 2004]
Desktop Computer 17” CRT Monitor Material Mass (g) Use Material Mass (g) Use Steel 6050 Housing Glass 6817 Picture tube Copper 670 Wires, Circuit boards Steel 2830 Housing Aluminum 440 Housing, CD-Rom Copper 700 Wires, circuit boards Plastics 650 Circuit boards Ferrite 480 Deflection yoke Epoxy 1040 Solder Aluminum 240 Heat sinks Tin 47 Solder Plastics 3530 Housing Lead 27 Disk drive Epoxy Resin 140 Circuit boards Nickel 18 Circuit boards Tin 20 Solder (circuit boards) Silver 1.4 Circuit boards Lead 593 Glass, solder Gold 0.36 Silver 1.24 Circuit boards Subtotal 8944 Gold 0.31 Circuit boards Other 96 Subtotal 15352 Total 9040 Other 98 Total 15450
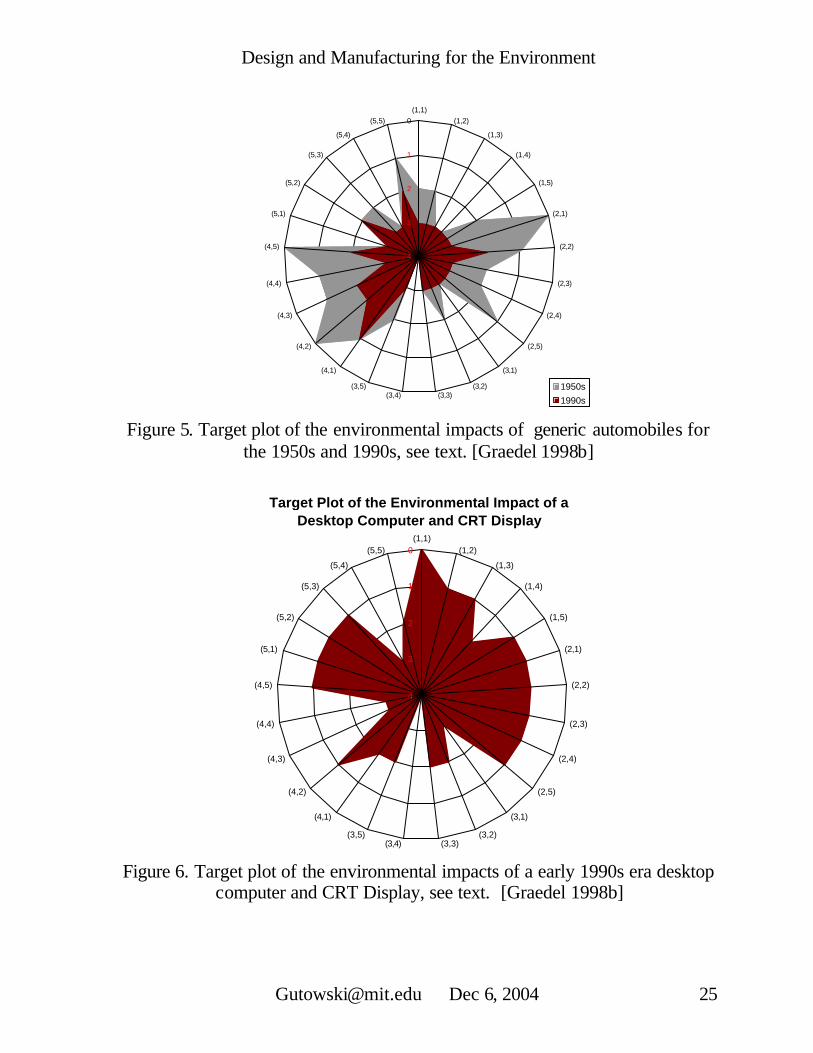
Currently, there is no complete, up to date, life cycle analysis available for a computer, but an earlier study looked at energy, waste, hazardous materials and water used in the life cycle of a computer workstation [MCC 1994, Graedel 1998b], and more recent information particularly on the fabrication, use, and end of life stages for a personal computer are given by Kuehr and Williams [Kuehr 2004]. Computers seem to raise concerns at all stages of life. The premanufacture and manufacturing stages are very material and energy intensive due primarily to the high material purity needed for the microelectronics fabrication. Distribution can be a concern due to the large amount of packing materials and the long distances some products need to travel. The use phase can be very energy intensive. For example, data given by Kawamoto [2000] and Cole [2003] sets the residential annual energy use for a desktop computer and monitor at about 380 MJ/year. In a commercial/industrial setting where the computer monitor may be on continuously, the estimate is 1500 MJ/year. For a three year lifetime, this exceeds about half of the energy used in production. The end-of- life issues are several; there are several “materials of concern” as mentioned earlier, and the shear volume of retired computer and electronics represents a significant solid waste/recycling challenge. Currently only a very small percentage of computers are recycled (about 11%, as estimated by the EPA). Using the materials lists given in Table 14 and the information cited in the references reviewed here [Williams 2002, Kueher 2004, MCC 1994, Graedel 998, Kawamoto 2000, Cole 2003] we have developed a baseline SCLA for a 1990’s era desktop computer and CRT display. The results are given in Tables 15 through 20. A target plot is given in Figure 6.

Design and Manufacturing for the Environment
[email protected] Dec 6, 2004 14
Streamlined Life Cycle Analysis: Desktop Computer Display and CPU
Table 15. Premanufacturing
i, j Environmental stressor score 1,1 Material Choice 0 Few recycled materials are used. Many toxic chemicals are used, including Pb in CRT
and PWB, Cd in some batteries, Hg in some switches, and brominated flame retardants in plastics.
1,2 Energy Use 1 Extra-high-grade materials for microchip very energy intensive. Other high energy
materials include virgin aluminum, copper, CRT glass.
1,3 Solid Residues 1 Manny materials are from virgin ores, creating substantial waste residues. Si wafer chain
is only 9% efficient.
1,4 Liquid Residues 2 Some metals from virgin ores can cause acid mine drainage. 1,5 Gaseous Residues 1 Very high energy use and other materials use lead to substantial emissions of toxic,
smog-producing, and greenhouse gases into the environment.
Table 16. Product Manufacture
2,1 Material Choice 1 Manufacturing uses restricted and toxic materials. (see 1,1 above) plus cleaning solvents. 2,2 Energy Use 1 Energy use in production is very high for IC’s and PWB and moderate to high for
conventional materials. If we examine energy use during the manufacture of individual parts of the computer: microchip (0), printed circuit board (1), cathode ray tube (2), LCD (0), other bulk material (3)
2,3 Solid Residues 1 There are large solid residues for chemical processes, such as CVD, PVP and plating.
e.g. printed circuit boards yield 12 kg of waste for each kilogram of finished product. Also high performance requirements often result in low yields.
2,4 Liquid Residues 1 Large quantities of waste liquid chemicals, e.g. approximately 500 kg of waste liquid
chemicals for each kilogram of product including plating solutions and cleaning fluids. Very high volumes of water are also used.
2,5 Gaseous Residues 1 Manufacturing energy use and processes lead to substantial emissions of toxic, smog-
producing, and greenhouse gases into the environment.

Design and Manufacturing for the Environment
[email protected] Dec 6, 2004 15
Table 17. Product Packaging and Transport
3,1 Material Choice 3 Several materials, large quantities, minimal recycling activity. 3,2 Energy Use 2 Long distances traveled. Large volumes of materials. 3,3 Solid Residues 2 Waste volumes are large, no arrangements to take back product packaging after use. 3,4 Liquid Residues 4 Little or no liquid residue is generated during packaging, transportation, or installation. 3,5 Gaseous Residues 2 Gaseous emissions are released by transport vehicles.
Table 18. Product Use
4,1 Material Choice 2 Power from electrical grid uses 50% coal. 4,2 Energy Use 1 High to very high energy usage. 4,3 Solid Residues 3 Little direct solid residues (excluding printing functions) but power uses coal resulting in
mining residues.
4,4 Liquid Residues 3 Little direct liquid residues (excluding printing function) but coal mining yields liquid
residues.
4,5 Gaseous Residues 1 No emissions are directly associated with the use of computers. However, gaseous
emissions are associated with energy production for use of computers.
Does not include printing
Table 19. Refurbishment/Recycling/Disposal Ratings
5,1 Material Choice 1 Product contains significant quantities of lead and brominated flame retardants and may
contain mercury and cadmium. Often these are not clearly identifiable or easily removable. Many materials are not recycled.
5,2 Energy Use 1 The product is not designed for energy-efficiency in recycling, or for high-level reuse of
materials. Also, the transport of recycling is energy intensive because of weight/volume and location of suitable facilities.
5,3 Solid Residues 1 Dissimilar materials are joined together is ways that are difficult to reverse and the
product overall is difficult to disassemble. Little recycling. Short life cycle of computers compounds these problems.
5,4 Liquid Residues 3 Product contains no operating liquids and minimal cleaning agents are necessary for
reconditioning. (Not including printing functions.)
5,5 Gaseous Residues 2 Roasting of Pritned Wiring Boards (PWBs) to recycle metals leads to emissions.

Design and Manufacturing for the Environment
[email protected] Dec 6, 2004 16
Table 20. Environmentally Responsible Product Assessment for the Computer Display and CPU
Life Stage Materials Energy Solid Liquid Gaseous Total Premanufacture 0 1 1 2 1 5/20 Product Manufacture
1 1 1 1 1 5/20
Product Delivery 3 2 2 4 2 13/20 Product Use 2 1 3 3 1 10/20 Recycling 1 1 1 3 2 8/20 Total 7/20 6/20 8/20 13/20 7/20 41/100
4c) Using Life Cycle Information for Product and Process Improvement One of the primary reasons for developing life cycle environmental information is to
identify opportunities for improvement. Streamlined life cycle analysis (SLCA) as developed in the two preceding sections is particularly good at this because it provides an overview with an emphasis on high profile issues. The automobile example illustrates important environmental improvements from the 1950s to the 1990s, at the same time indicating several remaining challenges, particularly related to fossil fuel usage.
The SLCA given for the 1990’s era desktop computer is intended as a baseline for
identifying critical areas for improvement, which are many. In comparison, the current laptop computer would score much more favorably. Important improvements would include: 1) a drastic reduction in total weight of materials used, 2) elimination of significant amount of lead, found in the CRT (though small amounts of mercury are needed for the laptop display), 3) significantly reduced packing materials, and 4) significantly lower energy required in usage.
The SLCA methodology presented here is a compact way to learn about a complex
problem, however, once a significant target for environmental improvement has been identified by SLCA, a more quantitative Life Cycle Inventory for the material(s) of concern would be warranted. This would allow a much more precise evaluation of potential improvements. For example, Figure 4 gives the total energy used for a generic family automobile of the late 1990s era. An LCI study would then connect each of these energy requirements to the energy technology used and the attendant emissions. For example while the use phase burns gasoline in an internal combustion engine, the material production and manufacturing phases use a mixture of mostly coal along with natural gas, oil, and even nuclear (from the electricity grid). Hence connecting the energy requirements to the fuel cycles would lead to specific contributions of each type of pollutant of interest. For example, energy from electricity in the United States comes from 50% coal, 20% nuclear, 18% natural gas, 7% hydroelectric, 3% oil, and 2% renewables. The corresponding emissions per electricity used are: 633 kg CO2/MWh, 2.75 kg SO2/MWh, 1.35 kg NOx/MWh, and 12.3g mercury/GWh, where MWh is a megawatt-hour, and GWh is a gigawatt-hour. [EPA egrid 2004].

Design and Manufacturing for the Environment
[email protected] Dec 6, 2004 17
A full-blown Life Cycle Analysis (LCA) would include weightings of the different
pollutants based on human value judgments. For example, the LCA software Simapro from the Netherlands employs a weighting scheme called the “Eco- indicator” which reflects the value judgments of Europeans concerning the various environmental issues that concern them. Obviously such schemes could vary widely depending upon local concerns.
Before leaving this section it is worth noting that because SLCA yields numerical scores
for products, it might be tempting to compare different types of products. This is possible but must be done with caution. In the first place the SLCA methodology developed by Graedel and Allenby was intended as a relative indicator for a particular product type. Therefore the methodology would have to be modified. A second problem is that dissimilar products can have vastly different utilities for the users. Hence the comparison may seem nonsensical to some. Nevertheless some comparisons can be useful. For example, Williams has pointed out that the fossil fuel used during the entire life cycle of the production and use for a computer is almost identical to that of a refrigerator even though the computer only lasts about one quarter of the time (2.5 years vs. 10 years) and the refrigerator is on all of the time [Williams 2004]. The obvious implication is that much more could be done to improve the energy efficiency of computers. 5. Design for the Environment (DFE) Design for the environment, like design for manufacturing or design for assembly, is a set of guidelines to help designers meet particular design goals. Often these guidelines are reduced to simple rules which aid understanding. But behind these rules are observations and models which capture how the product can be expected to perform as the result of certain design decisions. To a certain extent this whole chapter has been aimed at understanding how products and product decisions result in environmental loads. There can be however, different environmental goals. For example, designing an automobile for lower fuel consumption may lead to using structural composite materials for weight reduction, whereas designing for recyclability would probably lead to the use of metals for the structural components. In this section we outline some of the generally agreed upon guidelines for two important environmental goals: reduced hydrocarbon fuel consumption and increased recyclability. These are summarized in Table 21 and 22.

Design and Manufacturing for the Environment
[email protected] Dec 6, 2004 18
Table 21. Energy Efficiency Guidelines Action Reason Do SLCA/LCI/LCA for product Identify energy usage Encourage use of clean renewable energy sources Reduce harmful by-products and preserve resources Choose the least harmful source or energy Note for fossil fuels the cleanest is natural gas followed by oil products, and then coal
Reduce harmful by-products
Have subsystems power down when not in use Reduce energy usage and fossil fuel consumption Permit users to turn off systems in part or whole Reduce energy usage and fossil fuel consumption Avoid high energy materials Reduce energy and preserves resources Avoid high energy processes Reduce energy Specify best-in-class energy efficiency components Reduce energy usage and fossil fuel consumption Insulate and /or use waste heat Reduce losses/ increases efficiency Sources: Bras, 2004, Graedel 1998a, Otto 2000
Table 22. Recyclability Guidelines Rating Description or Action Reason or Comment Good Product is reusable/remanufacturable Extends life of product Good Materials in part are recyclable with a clearly defined
technology and infrastructure Most metals, some plastics in particular: PET & HDPE
Good No toxic materials, or if present, clearly labeled and easy to remove
Avoid Pb, Hg, Cd
Good Allow easy removal of materials, avoid adhesives and joining methods which can not be reversed
Facilitates separation and sorting
Less good
Material is technically feasible to recycle but infrastructure to support recycling is not available
Most thermoplastics, some glass
Less good
Material is organic – can be used for energy recovery but cannot be recycled
thermoplastics, rubber, wood products
Avoid Avoid mixtures which cause contamination, and painting and coatings which are difficult to remove
e.g. PVC in PET, Cu in Steel, painted plastics
Avoid Material has no known or very limited technology for recycling
Heated glass, fiberglass, thermoset plastics, composite materials
Sources: Bras 2004, Graedel 1998a, Metzger 2003 7. System Level Observations In this chapter we have presented an overview of engineering actions to lessen the impact of materials use, manufacturing, and design decisions on the environment. One of the goals of this chapter has been to identify the connections between a product life cycle and the associated environmental loads. To do this, we have frequently normalized the environmentally sensitive parameters such as energy requirements or emissions by some measure of useful output such as the weight of the output, the economic activity, or, in some cases, just by the product itself. This scheme helps assign responsibility and allows us to track progress by enabling comparisons.

Design and Manufacturing for the Environment
[email protected] Dec 6, 2004 19
At the same time however, by measuring the environmental load too narrowly, there is a danger of missing the overall trend. One way of making this point is by writing the environmental impact in terms of several normalized parameters. For example, consider eqn. 2 This is a mathematical identity, known as the “IPAT” equation, which associates impact I, with three important elements: P for population, A for affluence and T for technology. Our focus has been on the last term – impact/wealth (or impact/product etc).4 It is the collection of the terms on the right hand side which give the impact. Hence, a technology improvement could be offset by increases in population and/or wealth/person. This is unfortunate, but appears not to be in the domain of the engineer. If this was all there is to the story, the IPAT equation would be a neat way to subdivide responsibility. The implication is that if engineers can improve the technology term, then they have done their job. The actual picture unfortunately is much more complicated. This is because technology improvements do not only improve the environment, they also play an important role in stimulating the economy. In fact, relatively recent economic growth theories, pioneered by Nobel Laureate Robert Solow, now give primary importance to technology change [Solow 1957, Easterly 2002]. Hence the very act of improving the performance of a product could, and often does, stimulate increased production and consumption of the product. Some versions of this effect are called the “rebound effect” or “Jevon’s Paradox” for the nineteenth century economist who noted that more efficient production and use of a resource (coal in his case), stimulated more consumption of the resource, not less [Jevons 1906]. In a similar vein, one could observe that taken as a whole labor-saving technological progress in developed countries has not led to less employment (but it has led to increased income). The general rule is that people respond to incentives, and all of the incentives in a market economy point toward increasing investment and output rather than decreasing employment or resource use [Easterly 2002].
If society wants to reduce resource use, or emissions, or toxic waste, etc., it will need to provide the incentives, most likely through policy instruments, to do this. There are many successful examples to illustrate this point. The United States has reduced emissions of lead and sulfur dioxide, it has reduced the energy consumed by refrigerators and the world has stabilized the levels of ozone in the upper atmosphere through implementation of the Montreal Protocol of 1976. Hence, the engineering actions described in this chapter should be taken in conjunction with a wider incentive and policy system which will preserve the engineering efficiency gains.
4 Many variations on the IPAT are possible, for example A = products/person, T = impact/product, etc.
wealthimpact
personwealth
populationimpact ××=
Design and Manufacturing for the Environment
[email protected] Dec 6, 2004 20
8. References Bras, 2004. Lecture Notes for ME 4171, see; www.srl.gatech.edu/ Chapman, P.F. and F. Roberts, 1983. Metals Resources and Energy. Butterworth-
Heinemann: London. Cole, Danielle. 2003. Energy Consumption and Personal Computers. Computers and the
Environment: Understanding and Managing their Impacts, edited by Ruediger Kuehr and Eric Williams, pp 131-159. Kluwer Academic Publishers.
Dahmus, J. and T. Gutowski. 2004. “An Environmental Analysis of Machining,” ASME
International Mechanical Engineering Congress and RD&D Expo, Anaheim, California, USA, November 13-19, 2004.
Dalquist, S. and T. Gutowski. 2004. “Life Cycle Analysis of Conventional Manufacturing
Techniques: Sand Casting,” ASME International Mechanical Engineering Congress and RD&D Expo, Anaheim, California, USA, November 13-19, 2004.
DeCicco, J.M. and M. Thomas, 1999. “A Method for Green Rating of Automobiles.”
Journal of Industrial Ecology, vol. 3, no. 1, pp. 55-75. Easterly Williams, 2002. The Elusive Quest for Growth: Economists’ Adventures and
Misadventures in the Tropics. The MIT Press. Environmental Protection Agency (EPA), 1998. EPA TRI 1998 Data Release web page.
www.epa/gov/tri/tri98/index.htm EPA egrid 2004 see; www.epa.gov/cleanenergy/egrid/index.htm Graedel, T.E., and B.R. Allenby, 1998a. Design for Environment, Prentice Hall, Inc. Graedel, Thomas E., 1998b. Streamlined Life-Cycle Assessment, Prentice Hall, Inc. Graedel, T.E, and B.R. Allenby. 1998c. Industrial Ecology and the Automobile, Prentice
Hall, Inc. Grubler, Arnulf, Technology and Global Change, Cambridge University Press, 1998. Hendrickson, C., A. Horvath, S. Joshi, and L. Lave. 1998. Economic input-output models for
life-cycle assessment. Environmental Science and Technology: 13(4): 184A-191A. Jevons, W. Stanley, The Coal Question: An Inquiry Concerning the Progress of the Nation,
and the Probable Exhaustion of our Coal-mines. Reprints of Economic Classics, Augustus M. Kelley Publisher, 1906.

Design and Manufacturing for the Environment
[email protected] Dec 6, 2004 21
Joshi, S., 2000. “Product Environmental Life-Cycle Assessment Using Input-Output
Techniques.” Journal of Industrial Ecology, vol. 3, no. 2 & 3, pp. 95-120. Kawamoto, K., J. Koomey, B. Nordman and A. Meier. 2000. Electricity used by office
equipment and network equipment in the U.S. Conference: Energy Efficiency in Buildings. Berkeley, CA: U.S. EPA, Lawrence Berkeley National Laboratory. <http://enduse.lbl.gov/projects/Indo/Puba.html> (14 January 2003).
Keoleian, G.A., K. Kar, M.M. Manion, J.W. Bulkley, 1997. Industrial Ecology of the
Automobile: A Life Cycle Perspective, Socieity of Automotive Engineers (SAE0; Warrendale, PA. 148 pages..
Kuehr Ruediger and Eric Williams (Eds.). 2004. Computers and the Environment
Understanding and Managing their Impacts. Eco-Efficiency in Industry and Science Series, Kluwer Academic Publishers.
Leontief, W., 1986. Input-Output Economics, Second Edition. Oxford University Press. Maclean, H. and L. Lave, 1998. A life-cycle model of an automobile. Environmental
Science & Technology 32(13): 322A-329A. Martchek Kenneth J., Eden S. Fisher & Diane Klocko, 1998. “Alcoa’s Worldwide Life
Cycle Information Initiative,” proceedings Total Life Cycle Conference – Land, Sea and Air Mobility, pp. 121-125, SAE International P-339.
MCC (Microelectronics and Computer Technology Corporation) 1994. Life Cycle
Assessment of a Computer Workstation, Report HVE-059-094 Austin, Texas. Metzger, Brianne, 2003. Design for Recycling: Influencing the Design Process at a Major
Information Technology Company, SM Thesis Department of Mechanical Engineering, Massachusetts Institute of Technology
Miller, R. and P. Blair. 1985. Input-Output Analysis: Foundations and Extensions, Chapter 7
(pp. 236-260), Environmental Input-Output Analysis, Prentice Hall. Nriagu, J.O. and J.M. Pacyna, Quantitative assessment of worldwide contamination of air,
water and soils by trace metals, Nature, 333 (1988): 134-149. Otto, Kevin, and Kristin Wood. 2001. Product Design: Techniques in Reverse Engineering
and New Product Development. Pearson Education. Sherman Julie, Bain Chin, Paul D.T. Huibers, Ricard Garcia-Valls, and T. Alan Hatton,
1998. Solvent Replacement for Green Processing. Environmental Health Perspectives, Vol. 106, Supplement 1, pp. 253-271.
Design and Manufacturing for the Environment
[email protected] Dec 6, 2004 22
Smil, Vaclav. 1999. Energies – An Illustrated Guide to the Biosphere and Civilization. The MIT Press, Cambridge, Massachusetts.
Solow, Robert M. 1957. Technical Change and the Aggregate Production Function, Review
of Economics and Statistics 39:312-320. Solow, Robert M. 1987. Growth Theory: An Exposition. New York: Oxford University
Press (Originally published 1970). Suh, Sangwon,and Gjalt Huppes, (2004), “Methods for Life Cycle Inventory of a product”, to
appear in Journal of Cleaner Production, Elsevier. Also available on- line. Sullivan, J.L., R.L. Williams, S. Yester, E. Cobas-Flores, S.T. Chubbs, S.G. Hentges, and
S.D. Pomper, 1998. “Life Cycle Inventory of a Generic U.S. Family Sedan – Overview of Results USCAR AMP Project.” SAE International, 1998 Total Life Cycle Conference Proceedings, Graz, Austria. December 1-3. paper # 982160, pp 1-14.
Thomas, Valerie M., and Thomas G. Spiro. 1996. The U.S. Dioxin Inventory: Are There
Missing Sources?, Environmental Science & Technololgy, Vol. 30, No. 2, pp 82A- 85A.
Weiss M.A., J.B. Heywood, E.M. Drake, A. Schafer, and F.F. AuYeung, 2000. On the Road
in 2020, Energy Laboratory Report # MIT EL 00-003, Massachusetts Institute of Technology
Williams, Eric. 2004. Environmental Impacts in the Production of Personal Computers.
Computers and the Environment: Understanding and Managing Their Impacts, edited by Ruediger Kuehr and Eric Williams, pp. 41-72. Kluwer Academic Publishers.
Williams, E., R. Ayres and H. Heller. 2002. The 1.7 kg microchip: Energy and chemical use
in the production of semiconductors. Environmental Science & Technology 36(24) (15 December): pp. 5504-5510.

Design and Manufacturing for the Environment
[email protected] Dec 6, 2004 23
Figure 1. Product life cycle material flows
Figure 2. CO2 and toxic materials for several manufacturing industries
Mining Primary Mfg Distribution Use Disposition
0m&8m&
kipm& kopm&
0m&8m&
kipm& kopm&
0m&8m&
kipm& kopm&
0m&8m&
kipm& kopm&
0m&8m&
kipm& kopm&
0m&8m&
kipm& kopm&
Recycle, Remanufacture, Reuse
Mining Primary Mfg Distribution Use Disposition
0m&8m&
kipm& kopm&
0m&8m&
kipm& kopm&
0m&8m&
kipm& kopm&
0m&8m&
kipm& kopm&
0m&8m&
kipm& kopm&
0m&8m&
kipm& kopm&
Recycle, Remanufacture, Reuse
0m&8m&
kipm& kopm&
0m&8m&
kipm& kopm&
0m&8m&
kipm& kopm&
0m&8m&
kipm& kopm&
0m&8m&
kipm& kopm&
0m&8m&
kipm& kopm&
0m&8m&
kipm& kopm&
0m&8m&
kipm& kopm&
0m&8m&
kipm& kopm&
0m&8m&
kipm& kopm&
0m&8m&
kipm& kopm&
0m&8m&
kipm& kopm&
0m&8m&
kipm& kopm&
0m&8m&
kipm& kopm&
0m&8m&
kipm& kopm&
0m&8m&
kipm& kopm&
0m&8m&
kipm& kopm&
0m&8m&
kipm& kopm&
Recycle, Remanufacture, Reuse
Carbon Dioxide and Toxic Materials per Value of Shipments
00.5
11.5
22.5
33.5
44.5
5
Che
mic
als
Pet
role
uman
d C
oal
Pla
stic
s an
dR
ubbe
r
Prim
ary
Met
al
Fab
ricat
edM
etal
Mac
hine
ry
Ele
ctro
nic
Tra
nspo
rtat
ion
Manufacturing industries
Wei
ght/D
olla
rs
CO2 (metricton/$10,000)
Toxic Mat'ls (lb/$1000)
Design and Manufacturing for the Environment
[email protected] Dec 6, 2004 24
Primary Production
f
(1-f )Secondary Production ß
?
Er
Ep
Em
1+a+?
a
Manufacturing
1 kg
Primary Production
f
(1-f )Secondary Production ß
?
Er
Ep
Em
1+a+?
a
Manufacturing
1 kg
Figure 3. System energy requirements for a manufacturing process
Total Energy Use by Lifecycle Stage
0
100
200
300
400
500
600
700
800
900
MaterialProduction
Manufacturing Use Maintenanceand Repair
End of Life
Lifecycle Stage
To
tal E
ner
gy
Use
Per
Car
(GJ)
Figure 4. Total energy use by lifecycle stage for an automobile [Sullivan 1998]
Design and Manufacturing for the Environment
[email protected] Dec 6, 2004 25
4
3
2
1
0(1,1)
(1,2)
(1,3)
(1,4)
(1,5)
(2,1)
(2,2)
(2,3)
(2,4)
(2,5)
(3,1)
(3,2)(3,3)(3,4)
(3,5)
(4,1)
(4,2)
(4,3)
(4,4)
(4,5)
(5,1)
(5,2)
(5,3)
(5,4)
(5,5)
1950s
1990s
Figure 5. Target plot of the environmental impacts of generic automobiles for
the 1950s and 1990s, see text. [Graedel 1998b]
Target Plot of the Environmental Impact of a Desktop Computer and CRT Display
4
3
2
1
0(1,1)
(1,2)
(1,3)
(1,4)
(1,5)
(2,1)
(2,2)
(2,3)
(2,4)
(2,5)
(3,1)
(3,2)(3,3)(3,4)
(3,5)
(4,1)
(4,2)
(4,3)
(4,4)
(4,5)
(5,1)
(5,2)
(5,3)
(5,4)
(5,5)
Figure 6. Target plot of the environmental impacts of a early 1990s era desktop
computer and CRT Display, see text. [Graedel 1998b]