design and interpretation of interference studies: are ... · pdf filedesign and...
TRANSCRIPT

5
DESIGN AND INTERPRETATION OF INTERFERENCE STUDIES: ARE SOME METHODS
TOTALLY UNACCEPTABLE?
ROGER COUSENS
School of Agriculture, La Trobe University, Bundoora, Victoria 3083, Australia
(Received for publication 15 February 1995; revision 9 February 1996)
ABSTRACT There is debate amongst ecologists concerning the validity of particular experimental
designs for the study of interference (competition) and the quest for a "best" design. The debate has become increasingly dogmatic and confusing to outsiders. Most of the criticisms relate not to the validity of the designs themselves, as is usually claimed, but to the interpretability of indices calculated from them. It is argued that it is illogical to condemn a group of experimental treatments for all purposes simply because of the ways in which some researchers choose to interpret the results. Assertions that one particular design, the Replacement Series, is totally unusable are argued to be unwarranted and driven by an assumption that every researcher has the same objective. Each experimental design has both its merits and its restrictions; it is unreasonable to expect that any design will be universally applicable. A researcher must match the aim of the experiment with an appropriate design and method of analysis.
Keywords: experimental designs; interference; competition; replacement series; additive; response surface; interpretation.
INTRODUCTION In the fervour with which scientific debate on an entrenched view may be conducted, it
is easy to see how the two sides of a debate, both convinced of their correctness and the of wrongness of others, could lapse into their own dogmatic statements. Scientists are not immune to this. Faced with a threat to their own beliefs, dedicated to their cause, and protective of their reputations, they are as likely as non-scientists to be selective in their interpretation of data and vehement in their rejection of dissenting views. When recognised authorities publish reviews of data, or opinions backed up by plausible (though perhaps unintentionally selective) arguments, there will be a tendency for those less familiar with the topic to accept the views without question. When one view is rejected by the majority and replaced with another, there will be a tendency to regard all previous work as completely invalid and all those who are unconvinced as "blind" to common sense.
The current debate over experimental designs in plant interference (competition) studies would appear to have followed the above pattern. One design in particular had been adopted
New Zealand Journal of Forestry Science 26(1/2): 5-18 (1996)

6 New Zealand Journal of Forestry Science 26(1/2)
by many ecological researchers; doubt was cast over certain aspects of its utility; alternatives were proposed and championed; previous studies using the old designs were called into question; all uses of the older designs were rejected by some influential commentators; papers are now rejected by some referees simply because they use the older designs. Blind faith in one approach has been replaced by dogmatic enforcement of others. "Thou shalt not use the replacement series design" has become the new dogma! However, this new dogma has recently been questioned and the justifications for the rejection of the older method are being re-examined critically; even so, those who are doing this are being dismissed by some as trying to resurrect discredited old rituals.
The designs which have been the primary focus of attention have been used extensively in studies of annual plants, most often species of agronomic significance. However, they have on occasion been used to study the growth of mixtures of trees, interference between young trees and their competitors during establishment, and interference between herbaceous members of the forest floor vegetation. The debate amongst ecologists therefore has implications for the choice of methods in this type of work. It is also important to consider whether there are parallel messages relevant to other designs used more widely in forest vegetation management. In addition, forestry can benefit from the questions raised about the ways in which we choose experimental designs in general.
The paper will begin by reviewing the chronological development of the debate on the Replacement Series design. It will attempt to bring logic back into the debate and, with as much obj ectivity as possible, examine the evidence on which the rej ection of the Replacement Series design is based. This will be done within the fundamental assumption that experimental designs exist only to serve a purpose: the validity of a particular design can be determined only in relation to the uses to which it is put. Various designs will then be examined in relation to a range of typical research questions. It will be argued that each design has a place; it is the way in which a design is chosen, analysed, and interpreted which can cause problems. Throughout the discussion the term "design" will be used to refer to the choice of experimental treatments (the "treatment design", e.g., factorial, series of quantitative levels) rather than the layout (the "statistical design", e.g., randomised complete block, Latin square). Systematic designs, such as the "fan" or "wedge" designs, in which the treatments are spatially restricted and therefore lack randomisation, will not be considered here: these warrant detailed discussion in their own right.
A BRIEF HISTORY The replacement series (RS) "method" is normally attributed to C.T. de Wit, although the
experimental design was probably first used by W.H. van Dobben in the early 1950s (de Wit 1960). In the RS design, the proportion of two competitors is varied, while keeping their combined density constant. In effect, it consists of sequentially replacing neighbouring plants of the same species by plants of another. De Wit (1960) calculated two indices from plant weights in mixtures and monocultures, referred to as the Relative Yield Total (RYT) and the Relative Crowding Coefficient (k) (van Dobben also calculated a "verdringingsfactor", translated by de Wit as crowding coefficient). De Wit went on to interpret the results of van Dobben's experiments in terms of niche differentiation: if the combined relative yields of the two species increases in mixture when compared to their relative yields in monoculture, then it was argued that they must be competing differently for resources (de Wit used the term

Cousens—Interference studies 7
"space", but gave it a broad definition to include all resources). It was also shown how outpufcinput (seed produced:seed sown) ratios could be used to predict the dynamics of species proportions over generations.
The design became widely adopted (e.g., Trenbath 1974) and championed for its elegance by Harper (1977) and others. It would appear that many researchers included RS experiments in their research wherever they wanted to "look at competition", without stating clearly what it was they were trying to achieve. There was little questioning of the design. New indices, such as Aggressivity and Competitive Ratio were invented in further attempts to deduce the nature of ecological interactions from measurements of the weights of plants at a single point in time. Papers were also published on methods of statistical analysis (Machin & Sanderson 1977). Hall (1974) published studies in which the RS was used to determine which nutrients were being competed for most strongly. The RS has been used to compare species interactions under different nutrient regimes (Austin et al. 1985) and in the presence and absence of pathogens and mycorrhizas, an application which has been highly praised (Silvertown 1982; Firbank & Watkinson 1990).
From the early 1980s some researchers began to use designs in which the densities of both species were varied, without the constraint of holding total density constant (Suehiro & Ogawa 1980; Wright 1981; Spitters 1983; Cousens 1985; Firbank & Watkinson 1985; Connolly 1987). One of the aims was to predict the long-term dynamics of mixtures which, it was argued, could not be done from an experiment at a single total density (e.g., Inouye & Schaffer 1981; Firbank & Watkinson 1985). Other uses were to predict the optimum sowing density and proportion of mixtures of two species, and to measure the relative intensities of inter- and intra-specific competition. These designs {see Table 1) were mostly either factorial combinations of densities of two species, or a series of replacement series at different total densities: these two designs have been given various names, some of which have been so similar as to cause confusion (the "bivariate factorial" (Snaydon 1991) has also been referred to as a "complete additive design" (Rejmanek et al 1989), while the series of RS designs has been termed an "addition series" (Spitters 1983) and an "additive series" (Rejmanek et al 1989)). They can be analysed by fitting some form of non-linear equation to the data and may be referred to collectively as response surface designs; Cousens (1991) discussed statistical pitfalls for the unwary users of these methods. Response surface designs have spawned another generation of indices, such as Relative Resource Total, Substitution Rate, Equivalent Monoculture Density, Density Conversion Factor and Efficiency of Utilisation of Resources (Suehiro & Ogawa 1980; Firbank & Watkinson 1985; Connolly 1987); as before, these indices are being used to interpret the biological nature of the interaction occurring. Connolly et al (1990) found that the conclusions reached from a response surface approach can be qualitatively different from those derived from the RS.
In recent times, criticisms of the RS design have abounded. Among the comments made are that the results may vary with the total density at which the RS is conducted (e.g., Firbank & Watkinson 1985), the densities of the two species are confounded (e.g., Snaydon 1991), densities and spatial arrangements are confounded (Connolly 1988), the various indices are ambiguous in their biological interpretation (Rejmanek et al 1989), it is difficult to separate quantitatively the effects of intra- and inter-specific interference (Firbank & Watkinson 1985), it cannot discriminate between frequency-dependent and frequency-independent competition (DeBenedictis 1977), it tends to produce artificially deterministic interactions
New Zealand Journal of Forestry Science 26(1/2)
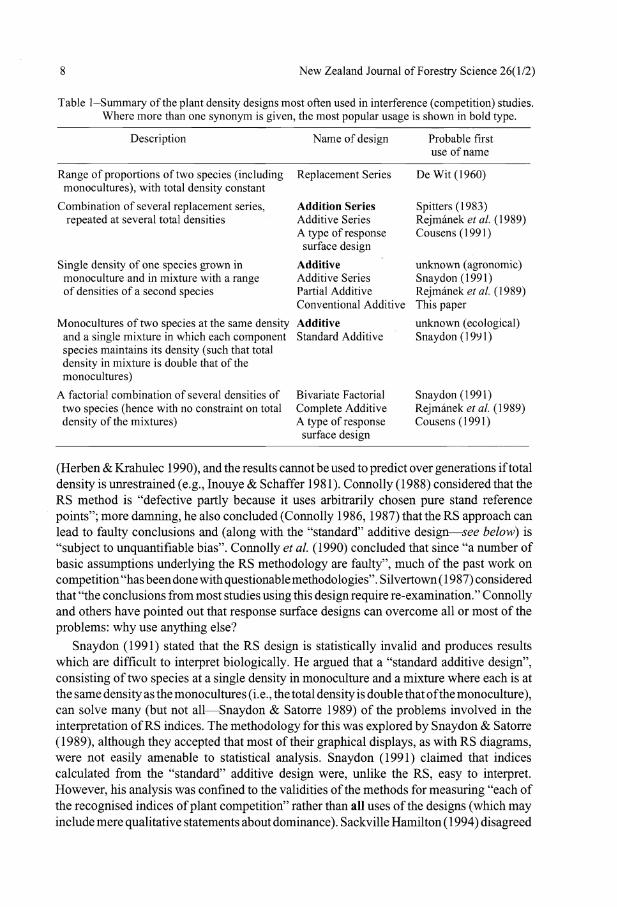
Table 1—Summary of the plant density designs most often used in interference (competition) studies. Where more than one synonym is given, the most popular usage is shown in bold type.
Description Name of design Probable first use of name
Range of proportions of two species (including monocultures), with total density constant
Combination of several replacement series, repeated at several total densities
Single density of one species grown in monoculture and in mixture with a range of densities of a second species
Replacement Series De Wit (1960)
Addition Series Additive Series A type of response surface design
Additive Additive Series Partial Additive Conventional Additive
Monocultures of two species at the same density Additive and a single mixture in which each component Standard Additive species maintains its density (such that total density in mixture is double that of the monocultures)
A factorial combination of several densities of Bivariate Factorial two species (hence with no constraint on total Complete Additive density of the mixtures) A type of response
surface design
Spitters(1983) Rejmanek <?/a/. (1989) Cousens(1991)
unknown (agronomic) Snaydon(1991) Rejmanek er a/. (1989) This paper unknown (ecological) Snaydon (1991)
Snaydon(1991) Rejmanek ef a/. (1989) Cousens(1991)
(Herben & Krahulec 1990), and the results cannot be used to predict over generations if total density is unrestrained (e.g., Inouye & Schaffer 1981). Connolly (1988) considered that the RS method is "defective partly because it uses arbitrarily chosen pure stand reference points"; more damning, he also concluded (Connolly 1986,1987) that the RS approach can lead to faulty conclusions and (along with the "standard" additive design—see below) is "subject to unquantifiable bias". Connolly et al (1990) concluded that since "a number of basic assumptions underlying the RS methodology are faulty", much of the past work on competition "has been done with questionable methodologies". Silvertown (1987) considered that "the conclusions from most studies using this design require re-examination." Connolly and others have pointed out that response surface designs can overcome all or most of the problems: why use anything else?
Snaydon (1991) stated that the RS design is statistically invalid and produces results which are difficult to interpret biologically. He argued that a "standard additive design", consisting of two species at a single density in monoculture and a mixture where each is at the same density as the monocultures (i.e., the total density is double that of the monoculture), can solve many (but not all—Snaydon & Satorre 1989) of the problems involved in the interpretation of RS indices. The methodology for this was explored by Snaydon & Satorre (1989), although they accepted that most of their graphical displays, as with RS diagrams, were not easily amenable to statistical analysis. Snaydon (1991) claimed that indices calculated from the "standard" additive design were, unlike the RS, easy to interpret. However, his analysis was confined to the validities of the methods for measuring "each of the recognised indices of plant competition" rather than all uses of the designs (which may include mere qualitative statements about dominance). Sackville Hamilton (1994) disagreed

Cousens—Interference studies 9
with Snaydon's analysis. He concluded that both the "standard" additive design and the RS design share similar problems—in their statistical analysis, in the fact that the values of competition indices will change with density, and in the interpretation of the indices—and that both have their (limited) uses. He argued that the uses of each design and their interpretation depend on the null hypotheses being tested. Snaydon (1994) refuted Sackville Hamilton's arguments, likening his paper to a spirited defence of the phlogiston theory. However, it is easily seen from Sackville Hamilton's paper that he was merely questioning the logic of Snaydon's arguments, not defending the RS design out of devotion. The whole debate must seem highly convoluted and irreconcilable to the uninitiated!
Under the weight of criticism from so many quarters, it is hardly surprising that many researchers have been turned against the RS design and some have concluded that it must be totally unacceptable. Rather than ask whether, in fact, the RS can be valid and useful for at least some objectives, it is easier to disregard it altogether and therefore to avoid possible criticism at the publication stage. One editor (personal experience) stated "the replacement series method has been discredited; please justify in detail your use of the design"; another referee rejected a paper out of hand, simply because it concerned the RS (D.E. Goldbergpers. comm.). Like Sackville Hamilton (1994), Cousens (1991) argued that this rejection of a design for all purposes was illogical and unduly dogmatic, and that RS does have its uses as one of many designs, all of which have both their restrictions and merits.
Weed agronomists have used another design commonly called the "additive design" as their standard interference experiment. The density of one species (the crop) is constant while the density of the second species (the weed) is varied. This design has been referred to as an "additive series" (Snaydon 1991) and a "partial additive design" by Rejmanek et al (1989). Because of confusion of its name with the "standard additive design" discussed above and in recognition of its more widespread use, this design will be referred to as the "conventional additive design". It allows the calculation of weed control thresholds, i.e., the numbers of weeds which, if present in a crop, would justify spraying (Marra & Carlson 1983). It has also been used to compare the effects of different weeds on the crop (Stoller et al 1987), of different crops on a weed, and of fertiliser application on losses caused by weeds (Bell & Nalewaja 1968). Harper (1977) considered that additive designs are flawed in that they confound total density and species proportions. Rejmanek et al (1989) repeated this criticism, stating that use of the "conventional" additive design "makes interpretation of results difficult". Rejmanek et al (1989) recommended the adoption of the more complex response surface designs. However, weed scientists have continued to use the design because of its utility for their purposes. An array of other experimental designs have been used for applied purposes and these will be discussed later.
ARE THE CRITICISMS OF THE REPLACEMENT SERIES JUSTIFIED? Several of the criticisms outlined above are inter-related and will be grouped in this
discussion.
Statistical Validity Snaydon (1991, 1994) has made the claim that, because densities of the two species are
confounded, the RS design is statistically invalid. Strictly speaking, a set of treatments cannot be statistically invalid; it is only the analysis of the data which can be invalid, when

10 New Zealand Journal of Forestry Science 26( 112)
the assumptions of that analysis have not been met. Provided that the "statistical design" (spatial layout) meets certain requirements, then any set of treatments can be analysed using statistics.
So, can the treatments be analysed in a valid way? This clearly depends on what is to be achieved. If the intention is to use the results to separate out the independent effects of the densities of the two species, and perhaps to fit a model which includes the density of each species, then clearly no statistical analysis can achieve this because the densities are completely confounded. If the intention is to interpret an index of competition, and this interpretation is dependent on the assumption that densities are acting independently (as Snaydon argues), or that the total density and the proportion of each species are not confounded, then the interpretation would be invalid (not the statistical analysis). However, for most studies the confounding of densities and proportions within treatments is irrelevant because there is no attempt to separate their effects. In the majority of RS studies, varying of component density and proportion is used as a surrogate in order to examine the biology of competition indirectly (often in relation to resources), not because they are of any direct interest in themselves.
If the researcher wants to ask a question about the effect of species proportion, then it is entirely logical to vary proportion: the effect of proportion on plant sizes can be analysed statistically. Clearly, however, the interpretation would have to bear in mind the environment in which the experiment was conducted, namely a particular soil type, water regime, total plant density, etc. The results, as would be the case if any other environmental parameter was changed, might well vary if the density were altered. However, this does not affect the statistical validity of the analysis.
The simplest form of RS design, where there are the two monocultures and one mixture of equal proportion of the two species, is in fact a simple single-factor design. In the mixture, half of the neighbours of one species are replaced by individuals of the other species. By comparing the mean plant size, or other attribute, of a species in monoculture and in mixture, a test is made of the effect of the type of neighbour. The null hypothesis is that neighbour type has no effect, and the analysis is both straightforward and valid. For example, a consulting biometrician showed no concern in analysing the plant mass data generated from an RS by Cousens et al. (1991); similarly, in another study a biometrician used both ANOVA and regression in analysing relative yields in both RS and "standard" additive designs (Austin et al. 1988). It is unclear whether Snaydon (1991) received statistical advice in reaching his conclusion that the RS design is statistically invalid.
As Law & Watkinson (1987) and Sackville Hamilton (1994) have pointed out, there are statistical problems if both species are compared with each other if they have been assessed in the same plots. The observations will not be statistically independent. However, this will be true for any mixture experiment, including the RS, "standard" additive, and response surface designs. It is certainly a failing that in the past many uses of RS have not been analysed statistically, and that indices such as the relative yield total have as a result not been compared rigorously with their appropriate null hypotheses.
Density-dependence of Results Several authors have pointed out that the results of RS experiments vary with total density.
Cousens & O'Neill (1993) showed that it is both expected on the basis of known plant-

Cousens—Interference studies 11
density responses and supported by experimental data that the values of RS indices vary with density. Sackville Hamilton (1994) argued in a similar way that the same will be true for indices derived from "standard" additive designs. However, in reviewing the literature (though confining their survey to equal proportion mixtures), Cousens & O'Neill (1993) found no evidence to show that the species dominating in mixture changes with density. Provided that density is great enough, the hierarchy of two species is usually maintained. (It is interesting to note that one of the studies used most often as evidence of the density-dependence of RS (Marshall & Jain 1969) used as its basis a method which has been argued to be invalid—output:input ratios for long-term predictions.) However, it has also been recorded that provided the experimental density is sufficiently high for strong competition to occur, even the values of the indices may tend to stabilise (Taylor & Aarssen 1989).
Connolly (1988) argued that an index which is used to reflect some intrinsic biological feature of a species should not vary with experimental design. While this ideal is appealing, it is perhaps naive to expect that the performance of a species, and especially the relativity between two species, will not vary with at least some aspects of the plant's environment. A similar point was made by Firbank & Watkinson (1985): "Competition coefficients ... do not differentiate between the effects of the environment and those innate to the species involved." Can any single experiment expect to measure a single index which encapsulates the ecology (or even specifically the competitive behaviour) of a species? The degree of resource complementarity, for example, might easily vary with the nutrient status of the soil, although it is rare for any interference experiment to be criticised because only one soil type or fertiliser regime was used. Is it, then, either surprising or unacceptable that plant behaviour should vary with plant density? It is surely more important that the nature of the variation with density be determined, using an appropriate methodology. However, should a single index or set of indices be required which represents behaviour at all densities, then a response surface design and regression analysis provide a more appropriate approach than a single RS (references cited above).
Prediction over Generations There can be little dispute that a design in which total density is constrained at a single
value is likely to have poor predictive ability when used to extrapolate the dynamics of a mixture in which density is allowed to vary. Any study in which this has been done should therefore be examined with caution. Also, as discussed above, the parameters of a model which incorporates the density of two species cannot be derived from a single RS design because of the confounding of densities. Response surface designs are far more appropriate for predicting population dynamics.
Interpretation of Indices The majority of the criticism of the RS "method" is not really directed at the design at all,
but at the indices calculated from RS experiments and the biological inferences made from them. Unfortunately, this distinction has often been overlooked. Just because one use (or even many uses) of a design is argued to be invalid does not mean that it is invalid for all purposes. Every design has its limitations, but equally there may be instances (albeit restricted) in which each one is a powerful tool and may be the most efficient design for answering a particular question. To totally outlaw a method without determining whether there are valid uses is therefore illogical.
12 New Zealand Journal of Forestry Science 26(1/2)
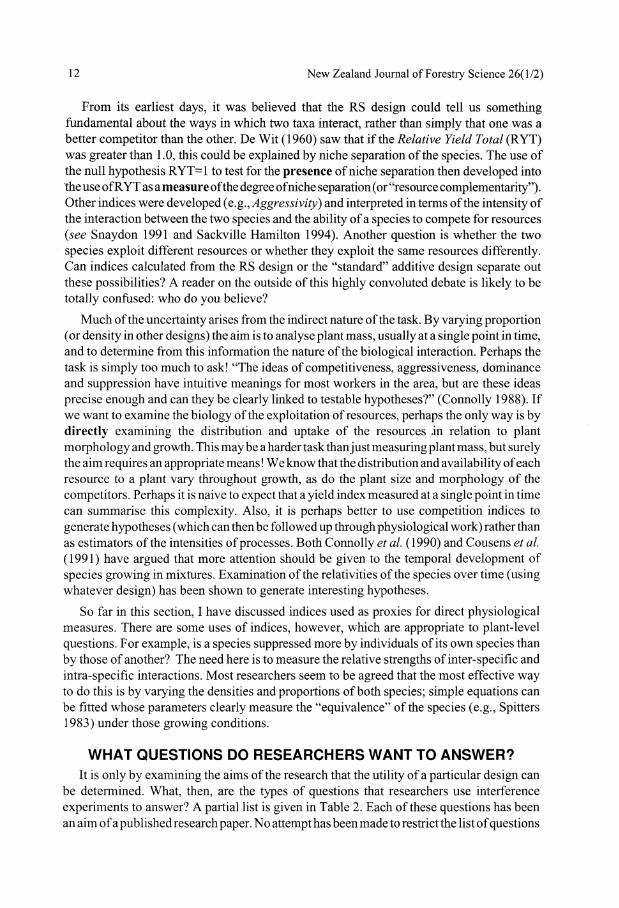
From its earliest days, it was believed that the RS design could tell us something fundamental about the ways in which two taxa interact, rather than simply that one was a better competitor than the other. De Wit (1960) saw that if the Relative Yield Total (RYT) was greater than 1.0, this could be explained by niche separation of the species. The use of the null hypothesis RYT=1 to test for the presence of niche separation then developed into the use of RYT as a measure of the degree of niche separation (or "resource complementarity"). Other indices were developed (e.g., Aggressivity) and interpreted in terms of the intensity of the interaction between the two species and the ability of a species to compete for resources (see Snaydon 1991 and Sackville Hamilton 1994). Another question is whether the two species exploit different resources or whether they exploit the same resources differently. Can indices calculated from the RS design or the "standard" additive design separate out these possibilities? A reader on the outside of this highly convoluted debate is likely to be totally confused: who do you believe?
Much of the uncertainty arises from the indirect nature of the task. By varying proportion (or density in other designs) the aim is to analyse plant mass, usually at a single point in time, and to determine from this information the nature of the biological interaction. Perhaps the task is simply too much to ask! "The ideas of competitiveness, aggressiveness, dominance and suppression have intuitive meanings for most workers in the area, but are these ideas precise enough and can they be clearly linked to testable hypotheses?" (Connolly 1988). If we want to examine the biology of the exploitation of resources, perhaps the only way is by directly examining the distribution and uptake of the resources in relation to plant morphology and growth. This may be a harder task than just measuring plant mass, but surely the aim requires an appropriate means! We know that the distribution and availability of each resource to a plant vary throughout growth, as do the plant size and morphology of the competitors. Perhaps it is naive to expect that a yield index measured at a single point in time can summarise this complexity. Also, it is perhaps better to use competition indices to generate hypotheses (which can then be followed up through physiological work) rather than as estimators of the intensities of processes. Both Connolly et al. (1990) and Cousens et al. (1991) have argued that more attention should be given to the temporal development of species growing in mixtures. Examination of the relativities of the species over time (using whatever design) has been shown to generate interesting hypotheses.
So far in this section, I have discussed indices used as proxies for direct physiological measures. There are some uses of indices, however, which are appropriate to plant-level questions. For example, is a species suppressed more by individuals of its own species than by those of another? The need here is to measure the relative strengths of inter-specific and intra-specific interactions. Most researchers seem to be agreed that the most effective way to do this is by varying the densities and proportions of both species; simple equations can be fitted whose parameters clearly measure the "equivalence" of the species (e.g., Spitters 1983) under those growing conditions.
WHAT QUESTIONS DO RESEARCHERS WANT TO ANSWER? It is only by examining the aims of the research that the utility of a particular design can
be determined. What, then, are the types of questions that researchers use interference experiments to answer? A partial list is given in Table 2. Each of these questions has been an aim of a published research paper. No attempt has been made to restrict the list of questions

Cousens—Interference studies 13
TABLE 2—Some typical questions posed by researchers.
Questions relating to the ways in which species interact (1) Do species X and Y compete for similar resources and in similar ways? (2) What is the degree of complementarity of resources when species X and Y compete? (3) What is the magnitude of the Aggressivity index for species X and Y? (4) What is the "severity of competition" between species X and Y? (5) For which resources is competition between X and Y most intense? (6) What are the relative strengths of inter- and intra-specific interference when X and Y grow in
mixture?
Questions relating to population or community composition and dynamics (7) How far away from a plant of X does Y cease to have an effect on its growth? (8) Which of species X and Y is dominant when they compete? (9) How does competition between X and Y vary on a gradient of nutrient concentration, seawater
dilution, or pH? (10) At what time in the growth of co-occurring species does interference begin? (11) How does dominance between species change throughout the year? (12) If a mixture of species is allowed to develop over time, what will happen to the proportions and
population sizes of the component species?
Questions relating to vegetation management (13) How do the relative seed outputs of X and Y vary with sowing density? (14) What is the optimum sowing/planting density of two species for maximum production or profit? (15) Does the addition of fertiliser increase the yield loss caused by weed X in crop Y? (16) How wide does a strip along a row (or a halo around a plant) of X have to be kept free of competitors
in order not to affect its size? (17) What is the economic threshold density for controlling weed X in crop Y? (18) What is the critical period in the growth of species X in which inter-specific interference must be
prevented so that its growth is unaffected? (19) What is the fitness differential between herbicide resistant and susceptible biotypes of weeds
(hence is a fitness gene likely to decrease in frequency in the absence of herbicide)?
to those which might be considered sensible questions to ask. Some questions which might be regarded as pointless or flawed by a physiologist or ecologist may be regarded as highly informative to a manager (and vice versa). The point here is not to challenge the ability of researchers to ask the right questions, nor to read into the questions any underlying rationale, but to take each question at face value and to ask which design might be appropriate to each specific question.
The questions have been broadly divided into three groups: practical questions for vegetation/crop managers; ecological questions relating to population/community composition and dynamics; physioTecological and pseudo-physiological questions concerned with the ways in which individual plants interact. Given that the questions are very different, it would not be surprising if different designs would suit some objectives and not others. Hence, just because a design cannot determine the intensity of inter- versus intra-specific competition (Rejmanek et al. 1989) that does not mean it will be unsuitable for determining economic questions for weed management. Of course, if one design is capable of generating other information outside the primary aim, and which would be of interest to others, all well and good. However, universal utility should not be a requirement for the acceptance of a design.

14 New Zealand Journal of Forestry Science 26(1/2)
Many (most?) researchers, even those who have used the RS in the past, do not have as their objective the measurement of resource complementarity or the measurement of an index such as Aggressivity (Q1^4). It is therefore somewhat harsh to reject designs totally just because they are unable to answer physiological or pseudo-physiological questions on the basis of observed yields (i.e., on their "biological interpretability"—Snaydon 1991,1994). Indeed, it must be questionable whether any experiment which varies only density and measures only yields can ever be capable of determining the biological basis of species interactions (Cousens 1991). From a perusal of recent ecological papers, very few researchers would appear to be trying to ask physiological questions (e.g., Q5)—or at least not without studying those phenomena directly at a physiological level. Common aims are to determine dominance and suppression hierarchies or the magnitude of suppression of seed production of one species by another (Q8, 9, 11,13), i.e., questions at a whole-plant level. The RS has been used effectively to describe the relative growth of competitors over time and to generate hypotheses concerning the part played in this by phenological development (Cousens et al. 1991); both the RS and "standard" additive design were shown to describe changes of dominance among thistles along a nutrient gradient (Austin et al. 1988), although the results appeared more consistent for the RS. For ranking species in terms of competitive dominance, the RS, the "standard" additive design, the "conventional" additive design, or any response surface design would appear to be suitable; the same is true for studying how dominance changes through time (Q10, 11). The decision of which to use is then governed largely by the size of the experiment, the capabilities of sowing equipment (especially for crops), and the familiarity of the researcher with the appropriate analytical methods (Cousens 1991).
Some of the physiological and ecological questions are not concerned directly with plant density (e.g., Ql—6, 8-11): even fewer are concerned with proportion. As has been pointed out before, arguments about the confounding of variables are relevant only where either (a) those variables are of direct interest and their independent effects need to be assessed or (b) the interpretation of an index depends on the assumption that they are not confounded. It has been pointed out by many authors that parameters such as relative seed production vary with density. This is hardly surprising, since increasing density will necessarily increase competition. But those same parameters are also expected to vary with time of year, soil type, nutrient supply, and various other factors. Is it therefore logical to insist that a range of densities must be studied because density causes parameters to vary and not to insist that the other parameters be varied also? It appears common that ecologists interested in interactions between species, even at a physiological level, conduct their interference experiments in small pots containing an artificial potting compost in the glasshouse! Surely it just as important to argue for experiments to be done in a relevant environment as it is to argue that densities span the range likely to be experienced in the appropriate habitat?
A good example to illustrate the previous point is the assessment of relative fitness of herbicide resistant and susceptible weeds (Q19). Part of the environment of a weed of cropping is the crop itself, and yet many studies try to measure relative fitness by putting the two biotypes together in mixtures (such as using the RS) in pots, but without the crop present. Such an experiment will show whether one biotype is a superior competitor, at least under those conditions, but the estimated relative seed production may well give unreliable results if used in predicting population genetics in the field. The study of biotype fitnesses for population modelling purposes should be conducted in a typical habitat and, since density

Cousens—Interference studies 15
will change over the time scale to be predicted, should include a range of densities of each species (e.g., an addition series or bivariate factorial with crop as a constant background— see Jensen 1993). However, the general qualitative conclusion from the many RS experiments on triazine resistant and susceptible biotypes, that the resistance genes usually result in a loss of vigour and fitness, should not be disregarded: the RS design is probably adequate for making such qualitative statements.
Some questions directly address issues concerning density or proportion and in those it is clearly essential to include a range of those variables (Q12-14). For estimating parameters of two-species density models, response surface designs are the most appropriate. These designs would appear to be the most useful for measuring inter- and intra-specific competition, either compounded over a time period and measured at a final harvest, or throughout plant growth (Connolly et al. 1990). The determination of the optimal sowing density and species proportions in inter-cropping also warrants response surface designs (Q14).
Most of the debate over experimental designs has been by ecologists working at the "pure" end of the research spectrum. A question such as "what happens when a species, or the rest of a plant community, is removed?" is an applied ecological question in its own right, as well as being of practical relevance for the manager. Although multifactorials of different crop densities, weed densities, times of removal, and durations of removal could be conducted, in applied research there is a pressing need to make the experiments no larger or more time-consuming than absolutely necessary. A factorial combination of treatments may give the greatest quantity of information, but a simpler design may be the most efficient way of answering a particular question because it requires fewer resources. Most applied researchers have a large number of questions to be answered and clients who are urgently awaiting the outcomes. There is a need for them to include several experimental locations to ensure generality of findings rather than more treatments at a single site. For example, if most producers in a region plant their trees or sow their crops at a similar seeding or planting density, only that density need be included (unless the question specifically relates to changes in density). Hence, the question "what density of weeds would justify weed control?" (Q17) would point directly to a "conventional" additive design with a single tree or crop density and a range of weed densities. "How much does fertiliser use affect yield losses?" could be appropriately answered by the same "conventional" additive design with fertiliser treatments superimposed; if only the qualitative question "does fertiliser affect yield losses?" (Q15) is asked, then only a single weed density might be included instead of a range. The question of how wide to control weeds around a plant or row of plants (Q16) requires a typical tree or crop stand to which a range of control widths are applied. A question of when to remove weeds dictates treatments of the in situ weed density with a range of times of removal; if treatments of a range of durations of removal are included along with a range of durations of competition, the "critical period" can be estimated during which weeds need to be kept out (Q18) (Nieto et al 1968).
Since questions in applied research tend to be more precisely defined than those in pure research, the choice of design is more obvious and the debate more easily settled.
IMPLICATIONS FOR FORESTRY RESEARCH It was argued above that over-interpretation from simple yield observations, in trying to
assess mechanisms of interference, has led to a seemingly irreconcilable debate over the

16 New Zealand Journal of Forestry Science 26(1/2)
meaning of RS (and other) indices. This debate over data interpretation has even led to a complete rejection of the design by some researchers, regardless of the objective of the research. Although the Replacement Series design has been used only seldom in forestry, the major messages from the debate on interference designs are extremely relevant to research on forest vegetation management. Namely, (i) it is naive to expect that a single experimental design will be relevant for all purposes, (ii) the design should be selected according to the requirements of the research and not according to which design has the fewest flaws when used for other purposes, and (iii) over-interpretation from a simple design can lead to lack of scientific rigour and, ultimately, confusion. No amount of statistical analysis or calculation of indices can compensate for an inappropriate design. Many of the supposed flaws in particular designs discussed by Connolly, Rejmanek, Snaydon, and others are in fact flaws in the interpretation of data, arising when the researcher is trying to make deductions from experiments which are unsuited to the purpose. However, if the design is matched to the objectives of the research, such errors in interpretation should be minimised.
Unfortunately, even if the appropriate design is selected, problems in analysis and interpretation remain. Surveys of the reporting of statistics in biological and agronomic journals have shown high levels of mis-use (Petersen 1977; Johnson & Berger 1982; Lauckner 1989). This has led to the misinterpretation of results in some cases (Cousens 1988). It is surely a great shame if the hard work of data collection is spoiled by the way in which the results are used. Questions which require the estimation of a quantity should use an appropriate estimation procedure, rather than testing pointless null hypotheses. For example, if the aim of an experiment is to measure the yield response of Pinus radiata D.Don to weed control, a conclusion that "the yields were significantly different (p<0.05)" clearly does not address the objective: the estimated difference should be stated along with its confidence interval. If a question relates in some way to the shape of the response to a variable (such as the existence of a threshold and its position), then graphical presentation and some form of curve-fitting (regression) should be used. It is far easier to gain an intuitive understanding of experimental results through graphs than through lists of means presented in tables. Indeed, it has been demonstrated how misinterpretations of data can occur if tables and pairwise comparison tests are relied on to analyse responses to quantitative variables (Cousens 1988) rather than graphs and regression.
ACKNOWLEDGMENTS
I thank Jon Dodd and Jane Speijers for their helpful comments on the first draft of this paper, and the organisers of the Second International Conference on Forest Vegetation Management for their invitation to present this material.
REFERENCES AUSTIN, M.P.; GROVES, R.H.; FRESCO, L.F.M.; KAYE, P.E. 1985: Relative growth of six thistle
species along a nutrient gradient with multispecies competition. Journal of Ecology 73: 667— 84.
AUSTIN,M.P.;FRESCO,L.F.M.;NICHOLLS,A.O.;GROVES,R.H.;KAYE,P.E.1988:Competition and relative yield estimation and interpretation at different densities and under various nutrient concentrations using Silybum marianum and Cirsium vulgare. Journal of Ecology 76: 157—71.
BELL, A.R.; NALEWAJA, J.D. 1968: Competition of wild oat in wheat and barley. Weed Science 16: 505-8.

Cousens—Interference studies 17
CONNOLLY, J. 1986: On difficulties with replacement-series methodology in mixture experiments. Journal of Applied Ecology 23: 125—37. 1987: On the use of response models in mixture experiments. Oecologia 72: 95-103. 1988: What is wrong with replacement series? TREE 3: 24—6.
CONNOLLY, J.; WAYNE, P.; MURRAY, R. 1990: Time course of plant-plant interactions in experimental mixtures of annuals: density, frequency, apd nutrient effects. Oecologia 82: 513— 26.
COUSENS, R. 1985. An empirical model relating crop yield to weed and crop density and a statistical comparison with other models. Journal of Agricultural Science (Cambridge) 105: 513—21. 1988: Misinterpretation of results in weed research through inappropriate use of statistics. Weed Research 28: 281-9. 1991: Aspects of the design and interpretation of competition (interference) experiments. Weed Technology 5: 664—13.
COUSENS, R.; O'NEILL, M.E. 1993: Density dependence of replacement series experiments. Oikos 66: 347-52.
COUSENS, R.; WEAVER, S.E.; MARTIN, T.D.; BLAIR, A.M.; WILSON, J. 1991: Dynamics of competition between wild oats (Avena fatua L.) and winter cereals. Weed Research 31: 203— 10.
DeBENEDICTIS, P.A. 1977: The meaning and measurement of frequency-dependent competition. Ecology 58: 158-66.
DE WIT, C.T. 1960: On competition. Verslagen van Landbouwkundige Onderzoehingen 66: 1—82. FIRBANK, L.G.; WATKINSON, A.R. 1985: On the analysis of competition within two-species
mixtures of plants. Journal of Applied Ecology 22: 503—17. 1990: On the effects of competition: from monocultures to mixtures. Pp. 165-92 in Grace, J.B.; Tilman, D. (Ed.) "Perspectives on Plant Competition". Academic Press.
HALL, R.L. 1974: Analysis of the nature of interference between plants of different species. I. Concepts and extension of the de Wit analysis to examine effects. Australian Journal of Agricultural Research 25: 739-47.
HARPER, J.L. 1977: "Population Biology of Plants". Academic Press. HERBEN, T.; KRAHULEC, F. 1990: Competitive hierarchies, reversals of rank order and the de Wit
approach: are they compatible? Oikos 58: 254-6. INOUYE, R.S.; SCHAFFER, W.M. 1981: On the ecological meaning of ratio (de Wit) diagrams in
plant ecology. Ecology 62: 1679-81. JENSEN, J. E. 1993: Fitness of herbicide-resistant weed biotypes described by competition models. :In
"Quantitative Approaches in Weed and Herbicide Research and their Practical Application", Proceedings of the European Weed Research Society Symposium, Braunschweig.
JOHNSON, S.B.; BERGER, R.D. 1982: On the status of statistics in PHYTOPATHOLOGY. Phytopathology 72: 1014-5.
LAUCKNER, F.B. 1989: Survey of the use of statistics in agricultural research journals. Tropical Agriculture 66: 2—7.
LAW, R.; WATKINSON, A.R. 1987: Response-surface analysis of two-species competition: an experiment on Phleum arenarium and Vulpia fasciculata. Journal of Ecology 75: 871—86.
MACHIN,D.; SANDERSON, B. 1977: Computing maximum-likelihood estimates for the parameters of the de Wit competition model. Applied Statistics 26: 1—8.
MARRA, M.C.; CARLSON, G.A. 1983: An economic threshold model for weeds in soybeans (Glycine max). Weed Science 31: 604—9.
MARSHALL, D.R.; JAIN, S.K. 1969: Interference in pure and mixed populations of Avena fatua and A. barbata. Journal of Ecology 57: 251—70.
NIETO, J.H.; BRANDO, M. A.; GONZALEZ, J.T. 1968: Critical periods of the crop growth cycle for competition from weeds. PANS 14: 159-66.

18 New Zealand Journal of Forestry Science 26(1/2)
PETERSEN, R.G. 1977: Use and misuse of multiple comparison procedures. Agronomy Journal 69: 205-8.
REJMANEK, M.; ROBINSON, G.R.; REJMANKOVA, E. 1989: Weed-crop competition: experimental designs and models for data analysis. Weed Science 37: 276-84.
SACKVILLE HAMILTON, N.R. 1994: Replacement and additive designs for plant competition studies. Journal of Applied Ecology 31: 599-603.
SILVERTOWN, J.W. 1982: "Introduction to Plant Population Ecology". Longman. 1987: "Introduction to Plant Population Ecology", 2nd edition. Longman.
SN A YDON, R. W. 1991: Replacement or additive designs for competition studies? Journal of Applied Ecology 28: 930-46. 1994: Replacement and additive designs revisited: comments on the review paper by N.R. Sackville Hamilton. Journal of Applied Ecology 31: 784—6.
SNAYDON, R. W.; SATORRE, E.H. 1989: Bivariate diagrams for plant competition data: modifications and interpretation. Journal of Applied Ecology 26: 1043-57.
SPITTERS, C.J.T. 1983: An alternative approach to the analysis of mixed cropping experiments. 1. Estimation of competition effects. Netherlands Journal of Agricultural Science 31: 1—11.
STOLLER, E.W.; HARRISON, S.K.; WAX, L.M.; REGNIER, E.E.; NAFZIGER, E.D. 1987: Weed interference in soybeans (Glycine max). Reviews of Weed Science 3: 155-81.
SUEHIRO, K.; OGAWA, H. 1980: Competition between two annual herbs, Atriplex gmelini CA. Mey and Chenopodium album L., in mixed cultures irrigated with seawater of various concentrations. Oecologia 45: X61—11.
TAYLOR, D.R.; AARSSEN, L.W. 1989: The density dependence of replacement-series competition experiments. Journal of Ecology 77: 975—88.
TRENBATH, B.R. 1974: Biomass productivity of mixtures. Advances in Agronomy 26: 177-210. WRIGHT, A.J. 1981: The analysis of yield-density relationships in binary mixtures using inverse
polynomials. Journal of Agricultural Science (Cambridge) 96: 561—7.