design and implementation of raid load shedding scheme … (no.27... · rls scheme for southern...
TRANSCRIPT

Design and Implementation ofDesign and Implementation ofRLS SchemeRLS Scheme for Southern Thailand Network
byM Y i B tMr.Yossawin Bureetan
Engineering Level 4Control and Protection System Department
Electricity Generating Authority of Thailand

Outline
1. Introduction1. Introduction
2. Previous Protection Scheme
3. Power System Analysis
4. Transient Stability Studies
5. Installation of the Protection Scheme
6 Post Event Analysis6. Post Event Analysis
7. Conclusion

Network Configuration of Southern Thailand
To PKK
- Network configuration before 2011
BSPBSP2
CP
500 kV
230 kV
115 kV Power Flow From Central RegionCP
LSNRN
KNSRT
RPB
TPPN
PP BDN
KN
NT
KAPK1
PK2
TS
LRPU RA
Main Load
SKLHY2
HY1
STU SDO KNEPTN
YL1 NW
CHN
BLG
BSTSUK
GURUN
YL2

Problem Solving Method
To PKK
- The previous RLS Scheme System Information- Tie-Lines Power Flow
BSPBSP2
CP
500 kV230 kV115 kV Areva
- Generation in Southern system- HVDC Status
CP
LSNRN
KNControlTrip
L d Sh ddi
HVDCRun Up/Back
SRTRPB
TPPN
PP BDN
KN
NT
BoxSignal Load Shedding(81 Cases Table)
KAPK1
PK2
TS
LRPU RA
SKLHY2
HY1
STU SDO KNEPTN
YL1 NW
CHN
BLG
BSTSUK
GURUN
YL2
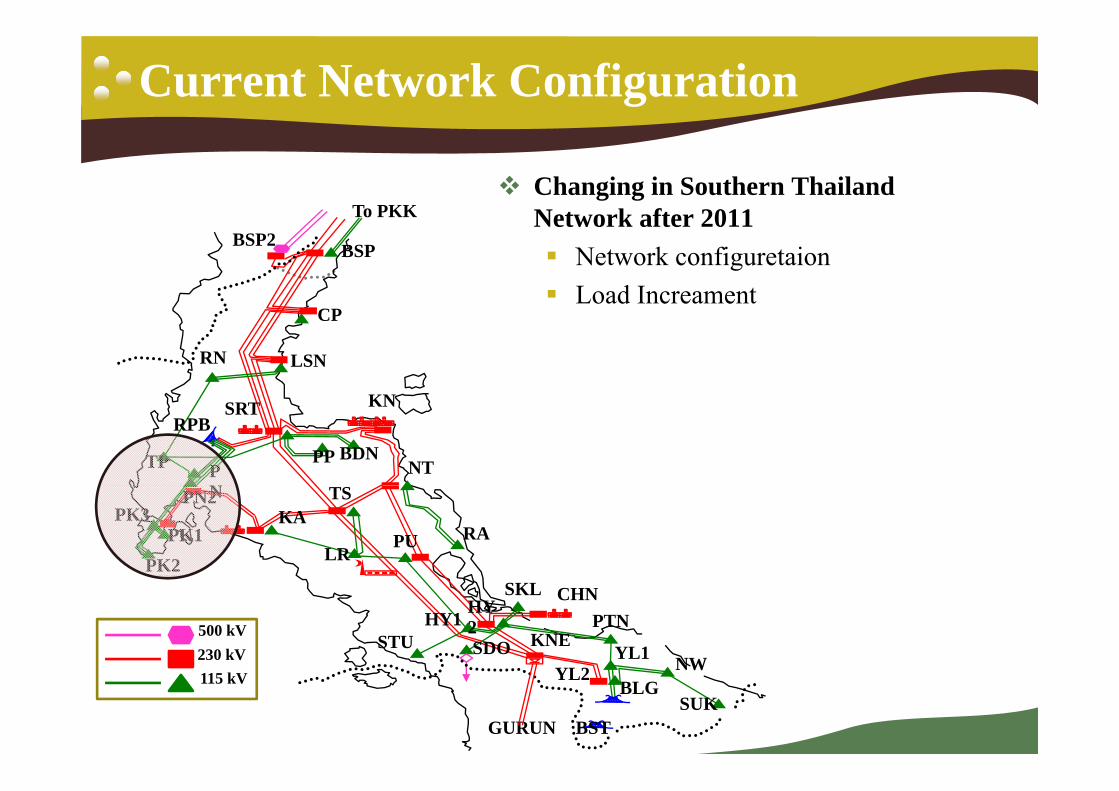
Current Network Configuration
Changing in Southern Thailand Network after 2011To PKK Network after 2011 Network configuretaion Load Increament
BSPBSP2To PKK
CP
LSNRN
KNSRTRPB
TP PP BDN
KN
NTPN
KAPK1
PK2
TS
LRPU RA
NPK3
PN2
500 kV230 kV
SKLHY2HY1
STU SDO KNEPTN
YL1 NW
CHN
115 kV BLG
BSTSUK
NW
GURUN
YL2

Power System Analysis
C diti fCondition forSteady State Study
System Disturbance :Only largeLoad Condition is divided into 3 condition
System Disturbance :Only large disturbance will be investigated, Ex.- CHN Power Plant Full Block Trip (700 MW)
- Evening Peak Load- Day Peak Load- Light Load
- CHN Power Plant Half Block Trip (350 MW)- KA Power Plant Trip- HVDC Trip while importing 300 MWHVDC Trip while importing 300 MW- Central to Southern Tie-Line Trip 2 Circuits- Tie-Transformer 500/230 kV BSP2 Trip

Part of study
Part 1 Part 2 Part 3
Aft th tAfter the system disturbance, the System can
After the system disturbance, the system can remain stable with
After the system disturbance, the system can remain stable with
remain stable without any protection Scheme
can remain stable with only the action of HVDC Run Up/Run Back
can remain stable with HVDC Run Up/Run Back and Rapid Load Sheddingp
response Back Shedding
Studies Result from Part 1
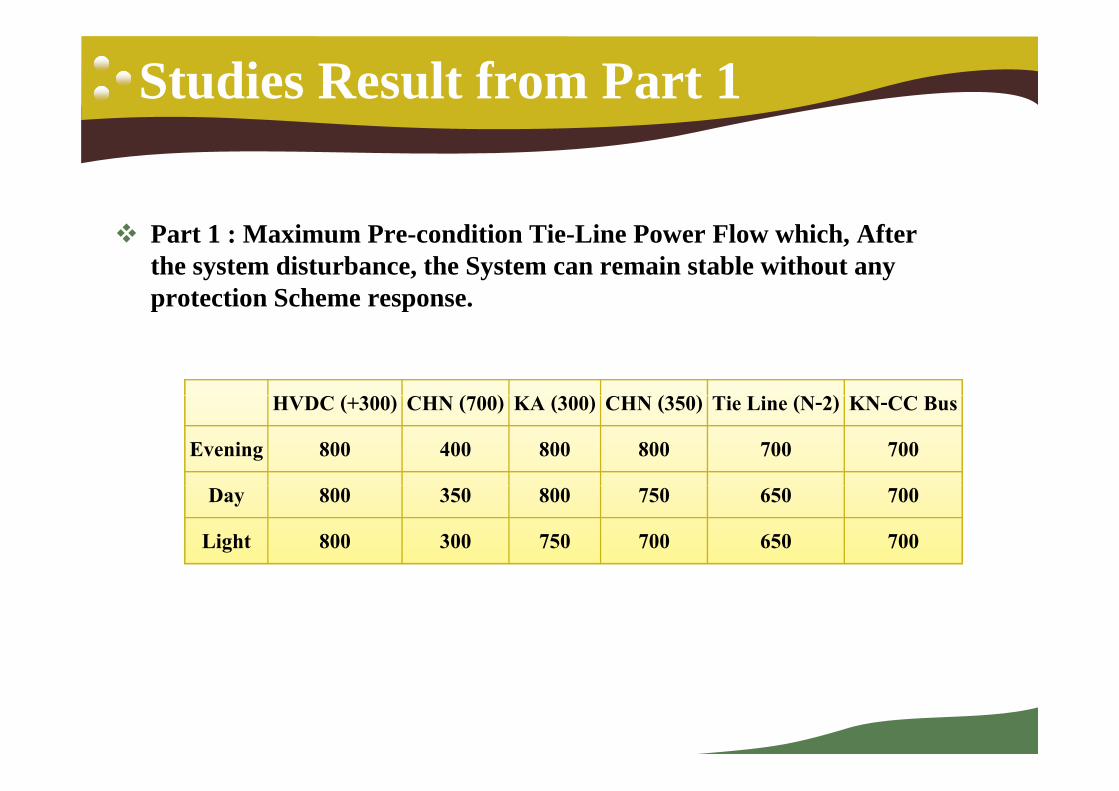
Part 1 : Maximum Pre-condition Tie-Line Power Flow which, After the system disturbance, the System can remain stable without any protection Scheme response.protection Scheme response.
( ) ( ) ( ) ( ) ( )HVDC (+300) CHN (700) KA (300) CHN (350) Tie Line (N-2) KN-CC Bus
Evening 800 400 800 800 700 700
Day 800 350 800 750 650 700
Light 800 300 750 700 650 700

Studies Result from Part 2
Part 2 : Maximum Pre-condition Tie-Line Power Flow which, After Part 2 : Maximum Pre condition Tie Line Power Flow which, After the system disturbance, the system can remain stable with only the action of HVDC Run Up/Run Back
CHN (700) KA (300) CHN (350)
Evening 700 1100 1100
Day 750 1100 1100
Light 650 1100 1000
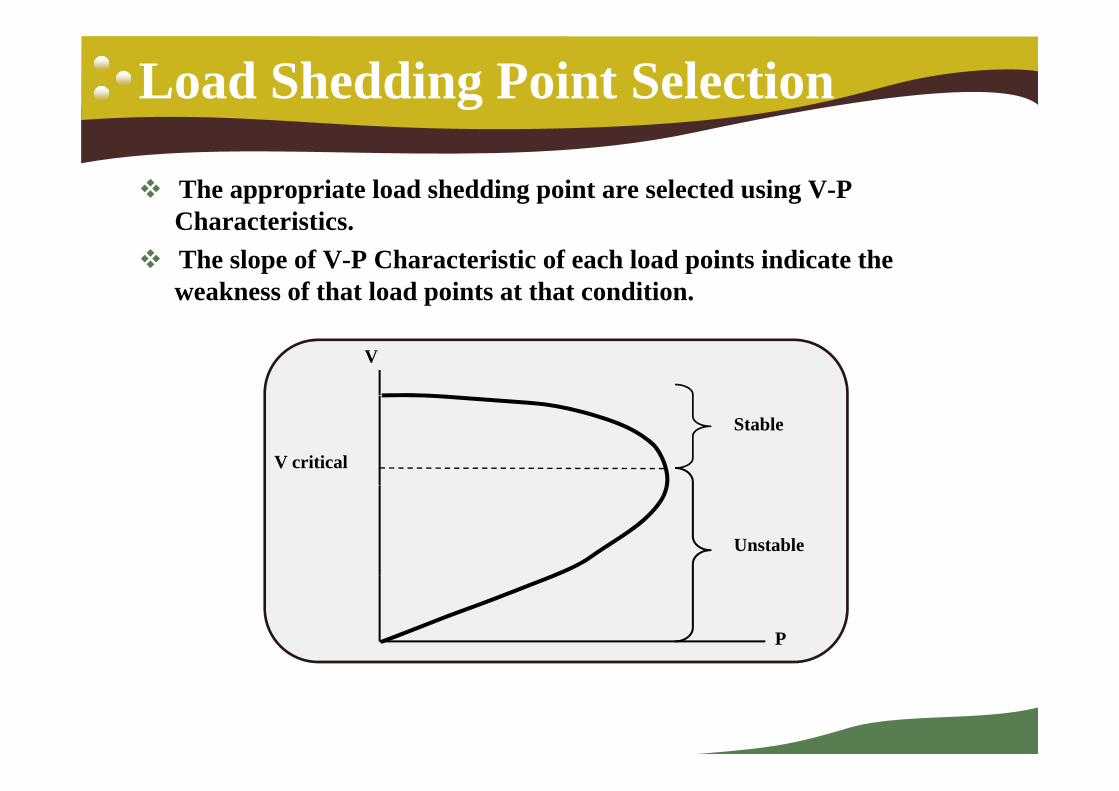
Load Shedding Point Selection
The appropriate load shedding point are selected using V-P Ch t i tiCharacteristics.
The slope of V-P Characteristic of each load points indicate the weakness of that load points at that condition.
V
Stable
V critical
Unstable
P
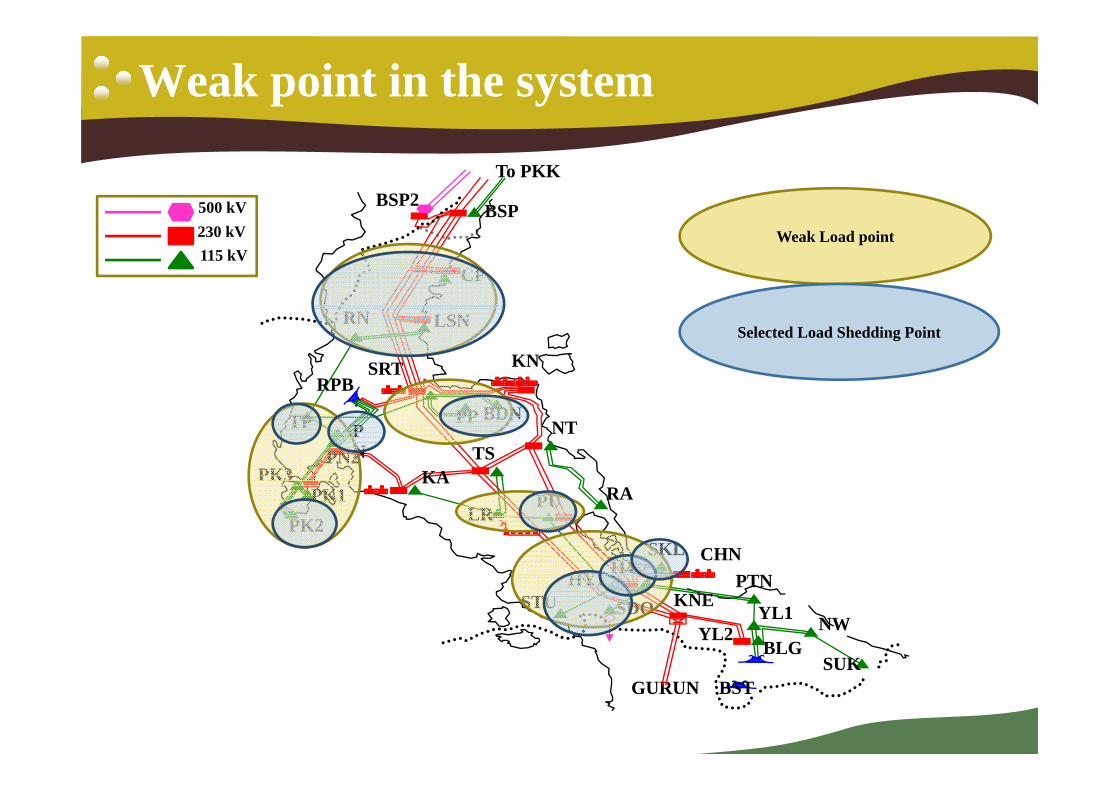
Weak point in the system
500 kV BSPBSP2To PKK
230 kV115 kV
BSP
CP
Weak Load point
LSNRN
SRTRPB
KNSelected Load Shedding Point
TP
KA
PP BDNNT
TSPN
PK3PN2
PK1PK2 LR
PU RA
SKLHY
HY1 PTNCHN
2HY1STU SDO KNE
PTN
YL1
BLGSUK
NWYL2
BSTSUK
GURUN
Studies Result from Part 3
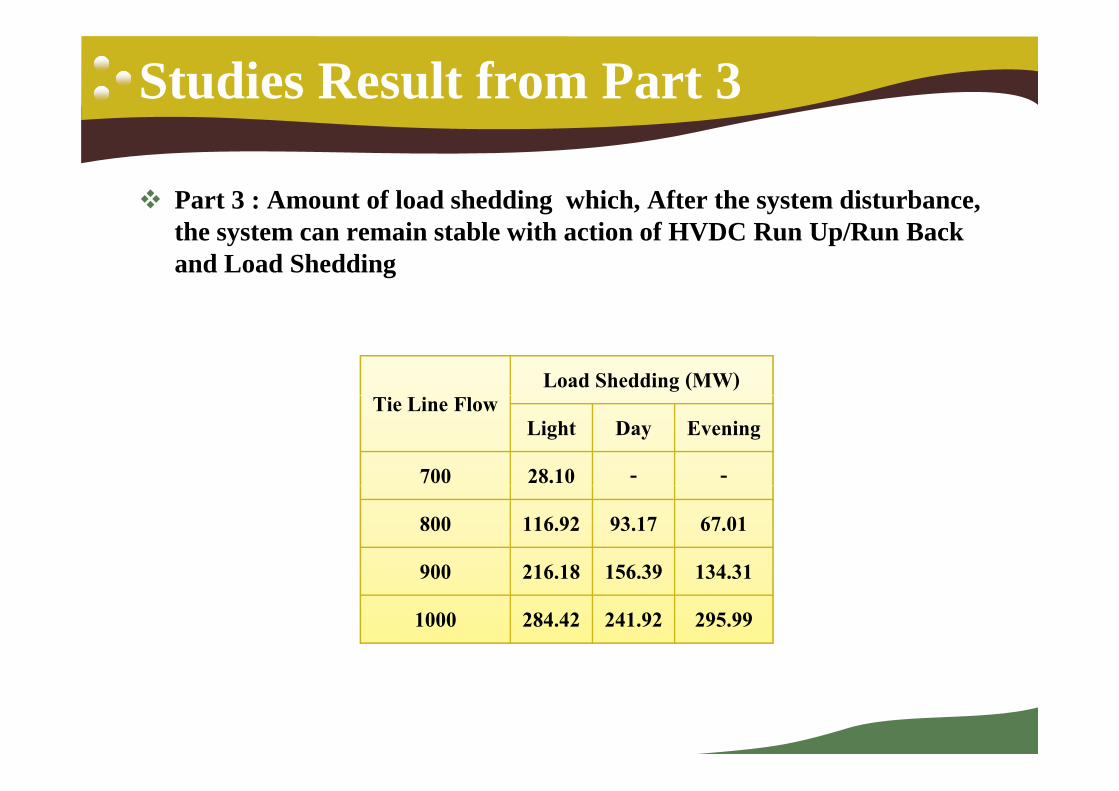
Part 3 : Amount of load shedding which, After the system disturbance, the system can remain stable with action of HVDC Run Up/Run Back and Load Shedding
Load Shedding (MW)Tie Line Flow
Light Day Evening
700 28.10 - -
800 116.92 93.17 67.01
900 216 18 156 39 134 31900 216.18 156.39 134.31
1000 284.42 241.92 295.99

Transient Stability Studies
In studies result from transient stability studies 2 example cases are In studies result from transient stability studies, 2-example cases are shown Case 1: CHN full block trip (700 MW) at tie-line flow 400 MW Case 2: CHN full block trip (700 MW) at tie-line flow 700 MW

Transient Stability Result : Case 1
Case 1 : CHN Full Block Trip ( 700 MW) : Tie-Line Flow 400 MW
T = 1 s : Fault
T ≈ 1.4 s : HVDC Run up
T = 1.1 s : Clear Fault
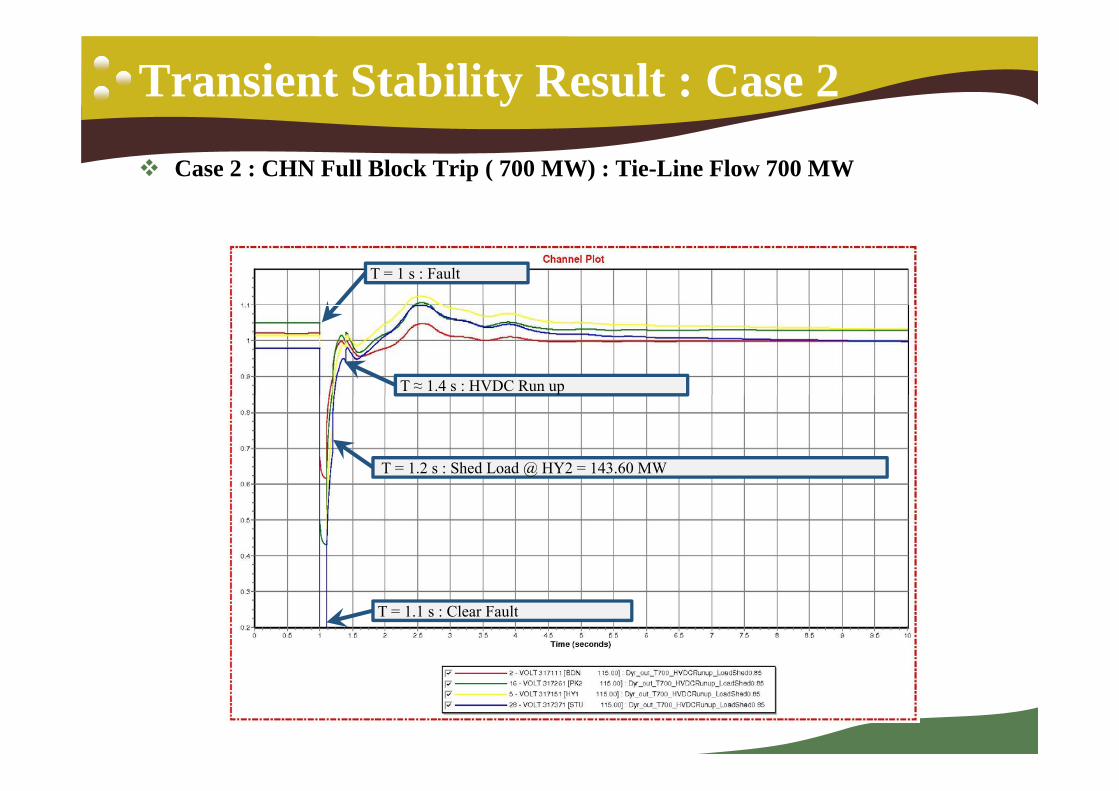
Transient Stability Result : Case 2
Case 2 : CHN Full Block Trip ( 700 MW) : Tie-Line Flow 700 MW
T = 1 s : Fault
T ≈ 1.4 s : HVDC Run up
T = 1.2 s : Shed Load @ HY2 = 143.60 MW
T = 1.1 s : Clear Fault

Special Protection Scheme Operation
To PKK- The Scheme Operation to prevent system instability after large disturbance
BSPBSP2
ArevaTie-line Flow
CP
LSNRN
KNControlTrip
Load1Shedding
U/V @ Load(200 ms)
If Tie-line Flow > 700 MWand CHN full block trip
SRTRPB
TP PP BDN
KN
NTPN
BoxSignalLoad2
Shedding
500 ms
U/V @ Load
500 kV
230 kV
KAPK1
PK2
TS
LRPU RA
PK3PN2 HVDC
Run Up/Back
115 kVSKLHY2
HY1STU SDO KNE
PTN
YL1NW
CHN
BLG
BSTSUK
NW
GURUN
YL2

Special Protection Scheme Operation
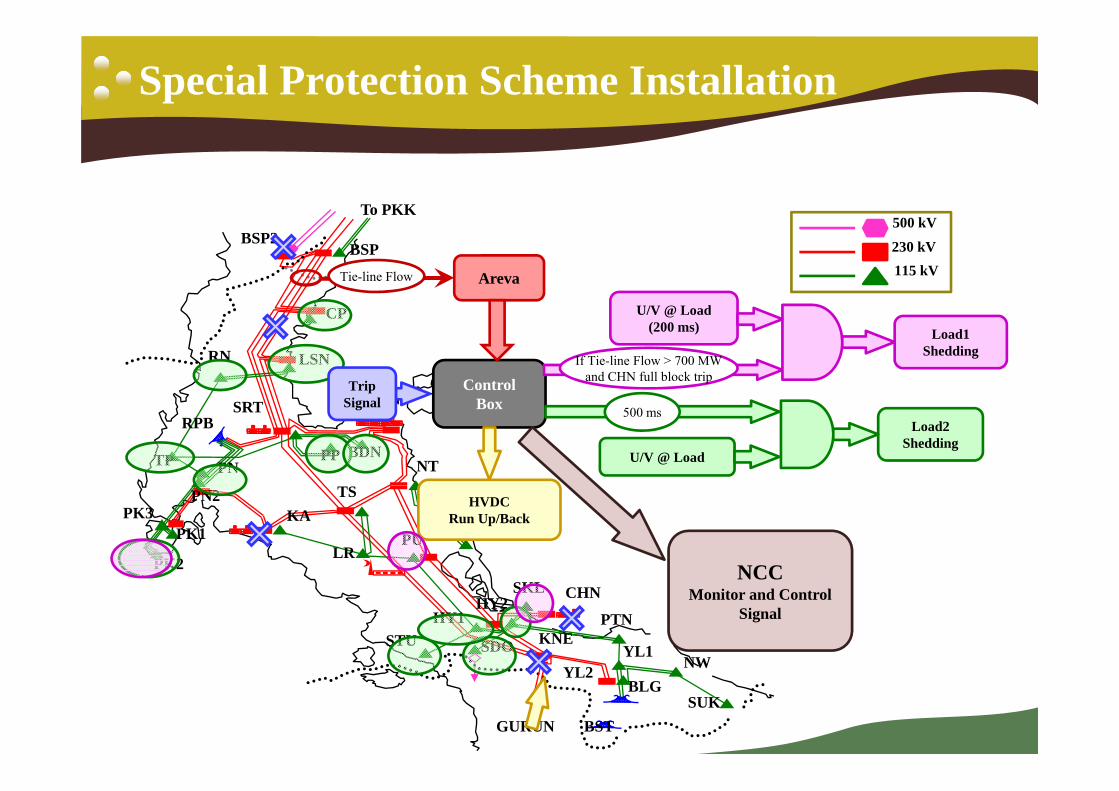
Special Protection Scheme Installation
To PKK500 kV
230 kV115 kV
BSPBSP2
Areva
U/V @ L d
Tie-line Flow
CP
LSNRN
KNControlTrip
Load1Shedding
U/V @ Load(200 ms)
If Tie-line Flow > 700 MWand CHN full block trip
SRTRPB
TP PP BDN
KN
NTPN
BoxSignal
Load2Shedding
500 ms
U/V @ Load
KAPK1
PK2
TS
LRPU RA
PK3PN2 HVDC
Run Up/Back
NCCSKL
HY2HY1
STU SDO KNEPTN
YL1NW
CHNNCC
Monitor and ControlSignal
BLG
BSTSUK
NW
GURUN
YL2
Challenge and Suggestion
The delay of the construction cause delay of scheme The delay of the construction cause delay of scheme installation.
Number and location of the communication device have to Number and location of the communication device have to be consider to minimize the scheme installation cost while remaining effective scheme operation.g p
Changing of load point impact amount of load shedding when the scheme operate.
In the scheme installation, the previous scheme was removed then the new scheme was installed. The function of scheme operation during that period had to be able to protect the system from black/brown out.
Example Event
On 5th March 2012 : Transmission Line 230 kV SKL2 On 5th March 2012 : Transmission Line 230 kV SKL2 –HY2 – KNE cct. 1 and 230 kV HY2 – KNE cct. 2 trip while central to southern tie-line flow 442 MW from Central tocentral to southern tie line flow 442 MW from Central to Southern System and HVDC was importing power 30 MW from Gurun to KNE
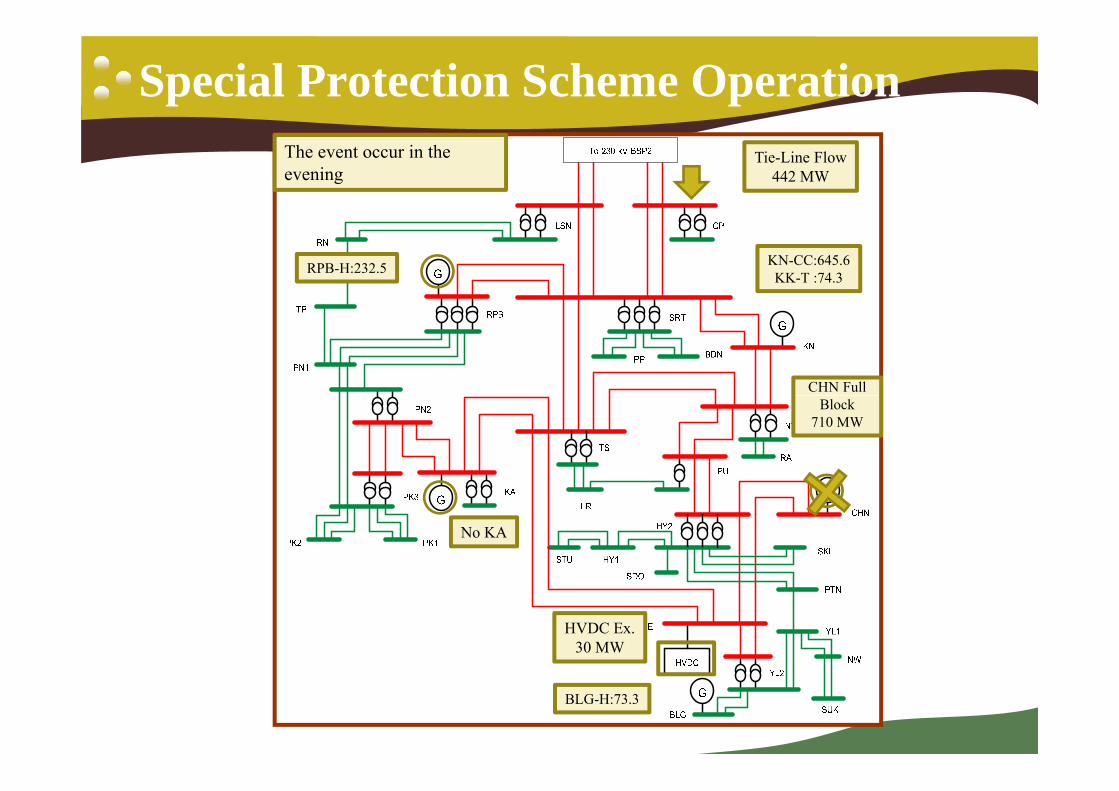
Special Protection Scheme OperationTie-Line Flow
442 MWThe event occur in the evening
RPB-H:232.5 KN-CC:645.6KK-T :74.3
CHN Full Block
710 MW
No KA
HVDC Ex.30 MW
BLG-H:73.3
Special Protection Scheme Operation
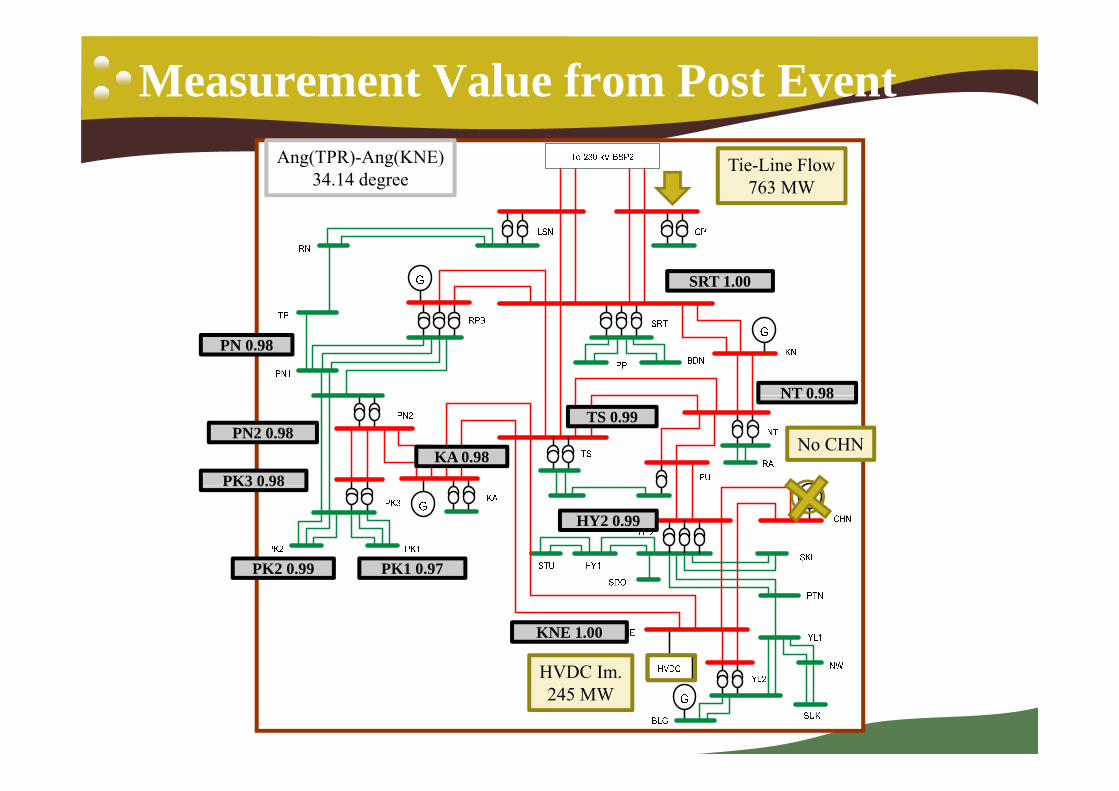
Measurement Value from Post EventTie-Line Flow
763 MWAng(TPR)-Ang(KNE)
34.14 degree
SRT 1.00
PN 0.98
NT 0 98
No CHN
PK3 0.98
PN2 0.98KA 0.98
TS 0.99NT 0.98
PK3 0.98
PK2 0.99 PK1 0.97
HY2 0.99
KNE 1.00
HVDC Im.245 MW

Study ResultTie-Line Flow
929 MWAng(TPR)-Ang(KNE)
44.27 degree
SRT 0.98
PN 0.93
NT 0.97
No CHNPK3 0.93
PN2 0.93KA 0.95
TS 0.96
PK2 0.90 PK1 0.90
HY2 0.98
HVDC Im
KNE 1.00
HVDC Im.245 MW

Study ResultActual Value

Study ResultActual Value

Conclusion
In Southern Thailand Network a special protection In Southern Thailand Network, a special protection scheme was installed to prevent black out after large disturbance.disturbance.
When the scheme is trig, the scheme will send run up/back command to HVDC and load shedding command to load gpoint simultaneously.
After getting the shedding command, load at each will be shedded only when the voltage at that bus is low.
Post event analysis show that the scheme can prevent the system black out when large disturbance occur.
The load shedding, after the scheme action, can be avoided by controlling of the tie line flowby controlling of the tie-line flow.

Thank you