design and implementation of a mems based spiral … · design and implementation of . a mems based...
TRANSCRIPT

DESIGN AND IMPLEMENTATION OF
A MEMS BASED SPIRAL CHANNEL DIELECTROPHORETIC SEPARATOR FOR CYTOMETRY APPLICATIONS
A THESIS SUBMITTED TO THE GRADUATE SCHOOL OF NATURAL AND APPLIED SCIENCES
OF MIDDLE EAST TECHNICAL UNIVERSITY
BY
GÜRKAN YILMAZ
IN PARTIAL FULFILLMENT OF THE REQUIREMENTS FOR
THE DEGREE OF MASTER OF SCIENCE IN
ELECTRICAL AND ELECTRONICS ENGINEERING
NOVEMBER 2010

Approval of the thesis:
DESIGN AND IMPLEMENTATION OF A MEMS BASED SPIRAL CHANNEL DIELECTROPHORETIC
SEPARATOR FOR CYTOMETRY APPLICATIONS
submitted by GÜRKAN YILMAZ in partial fulfillment of the requirements for the degree of Master of Science in Electrical and Electronics Engineering Department, Middle East Technical University by, Prof. Dr. Canan Özgen Dean, Graduate School of Natural and Applied Sciences
Prof. Dr. İsmet Erkmen Head of Department, Electrical and Electronics Engineering
Assoc. Prof. Dr. Haluk Külah Supervisor, Electrical and Electronics Eng. Dept., METU
Examining Committee Members:
Prof. Dr. Tayfun Akın Electrical and Electronics Engineering Dept., METU
Assoc. Prof. Dr. Haluk Külah Electrical and Electronics Engineering Dept., METU
Prof. Dr. Cengiz Beşikçi Electrical and Electronics Engineering Dept., METU
Prof. Dr. Nevzat Güneri Gençer Electrical and Electronics Engineering Dept., METU
Dr. Said Emre Alper MEMS Research and Application Center, METU
Date: 25.11.2010

I hereby declare that all information in this document has been obtained and presented in accordance with academic rules and ethical conduct. I also declare that, as required by these rules and conduct, I have fully cited and referenced all material and results that are not original to this work.
Name, Lastname: Gürkan Yılmaz
Signature:
iii

ABSTRACT
DESIGN AND IMPLEMENTATION OF A MEMS BASED SPIRAL CHANNEL
DIELECTROPHORETIC SEPARATOR FOR CYTOMETRY APPLICATIONS
Yılmaz, Gürkan
M. Sc., Department of Electrical and Electronics Engineering
Supervisor: Assoc. Prof. Dr. Haluk Külah
November 2010, 93 pages
This thesis reports design and implementation of a MEMS based spiral channel
dielectrophoretic separator for cytometry applications. Main objective of the thesis is
to separate leukemia cells from healthy leukocytes with respect to the differences in
their dielectric properties.
A novel MEMS based dielectrophoretic separator with spiral channels and concentric
3D electrodes has been proposed. The proposed geometry decreased the footprint,
which reduces the device cost, without degrading the separation and quantization
performances. Concentric electrode geometry enables continuous electric-field
application with simple voltage supplies.
Theoretical explanation of the design has been presented and supported with finite
element method simulations. Evolution of the design has been explained in
conjunction with solutions to arising problems, chronologically. Comparisons of the
iv

proposed system with respect to the existing systems in the literature have been
given.
The devices are fabricated using a 3-mask process utilizing suspended parylene
channel process. The experiments are realized with 1 µm and 10 µm polystyrene
beads. The results show that 1 µm particles have an average speed of 4.57 µm/s with
1.06 µm/s standard deviation, and 10 µm particles have an average speed of 544
µm/s with 105 µm/s standard deviation. The speed variation coefficient for 1 µm
and 10 µm beads can be calculated as 23% and 19%, respectively. The size accuracy
of the device is ±10%, while the resolution is 20%, that is, particles with radii
different from each other by 20% can be separated. It is worthy to note that the
experimental results almost match the simulation results.
Keywords: Dielectrophoresis, separation, chromatography, cytometry, concentric
electrodes, spiral channel, parylene, finite element method.
v
ÖZ
SİTOMETRİ UYGULAMALARI İÇİN MEMS TABANLI SPİRAL KANAL
DİYELEKTROFORETİK AYRIŞTIRICI TASARIMI VE UYGULANMASI
Yılmaz, Gürkan
Yüksek Lisans, Elektrik ve Elektronik Mühendisliği Bölümü
Tez Yöneticisi: Doç. Dr. Haluk Külah
Kasım 2010, 93 sayfa
Bu tez, sitometri uygulamaları için MEMS tabanlı bir spiral kanal diyelektroforetik
ayrıştırıcının tasarımı ve uygulanmasını anlatmaktadır. Tezin temel amacı lösemi
hücrelerini sağlıklı akyuvarlardan diyelektrik özelliklerindeki farklılıklara gore
ayrıştırmaktır.
Spiral kanallara ve eşmerkezli üç boyutlu elektrotlara sahip MEMS tabanlı özgün bir
diyelektroforetik ayrıştırıcı önerilmiştir. Önerilen geometri, ayrıştırma ve niceleme
performansını kötüleştirmeden, aygıt fiyatını düşüren aygıt alanını küçültmüştür.
Eşmerkezli elektrot geometrisi basit voltaj kaynakları ile sürekli elektrik alan
uygulamasını mümkün kılmıştır.
Tasarımın kuramsal açıklaması sunulmuş ve sonlu eleman yöntemi ile
desteklenmiştir. Tasarımın geçirdiği evrim, ortaya çıkan sorunlara getirilen
vi

çözümlerle beraber kronolojik olarak açıklanmıştır. Önerilen sistemin literatürde
varolan sistemlere gore karşılaştırılmasına yer verilmiştir.
Aygıtlar havada asılı parilen kanal sürecini kullanan 3-maskeli bir süreçte
üretilmiştir. Deneyler 1 µm ve 10 µm polistiren boncuklarla gerçeklenmiştir. Deney
sonuçları 1 µm parçacıkların 4.57 µm/s ortalama hız ve 1.06 µm/s standard sapmaya,
10 µm parçacıkların ise 544 µm/s ortalama hız ve 105 µm/s standard sapmaya sahip
olduklarını göstermiştir. Sürat değişim katsayıları 1 µm ve 10 µm boncuklar için
sırasıyla %23 ve %19 olarak hesaplanmıştır. Aygıtın boyut doğruluğu çözünürlük
%20 iken ±%10’dur, yani yarıçapları birbirinden %20 farklı olan parçacıklar
ayrıştırılabilir. Deneysel sonuçların benzetim sonuçlarıyla uyum sağlaması
belirtmeye değer bulunmuştur.
Anahtar Kelimeler: Diyelektroforez, ayrıştırma, kromatografi, sitometri, eş-
merkezli elektrotlar, spiral kanal, parilen, sonlu elemanlar metodu.
vii

To my family
viii

ACKNOWLEDGEMENTS
I would like to thank my thesis advisor, Assoc. Prof. Dr. Haluk Külah, for his
support and help during my graduate study. I would also like to thank Prof. Dr.
Tayfun Akın for his contributions and supports during my studies. I would like to
acknowledge TUBITAK BIDEB for supporting me throughout my Master of Science
study.
I am particularly grateful to my colleague Ekrem Bayraktar for sharing almost
everything; time, experience, fun, ideas, and disappointments, and not leaving me
alone in overnight studies in the laboratory and clean room. I am particularly
thankful to Emre Yılmaz for his candid friendship and intellectual talks. I would also
like to show my appreciation to Ozan Yılmaz, Caner Güçlü, Ozan Doğan Gürbüz,
Akın Aybar, Emre Tatlı, Emir Konuk, Emre Büküşoğlu, and Hasan Arslan for our
engineering based discussions.
I would also like to express my gratitude to Ata Tuna Çiftlik and Dr. Özge Zorlu for
their valuable contributions on my thesis study and for sharing their deep knowledge.
Many thanks to Deniz Eroğlu, Ender Yıldırım, Aziz Koyuncuoğlu, Dr. Yekbun
Adıgüzel, Bilge Akbıyık, Yağmur Demircan, and Hatice Ceylan for sharing the
laboratory and clean room environment. I would like to thank to all my friends in
BioMEMS research group for excellent and enjoyable laboratory environment. Also,
I would like to acknowledge Sertan Sukas for his contributions in the development of
BioMEMS research at METU.
I am exceptionally thankful to my seniors and my dear friends at METU-MEMS
Research and Application Center for transforming stressful clean room days to fun.
Firstly, special thanks to Orhan Şevket Akar for sharing his deep process knowledge
and his classical music taste, and for encouraging us during thesis writing phase.
ix

Of course, special thanks to always smiling couple, Dr. Ebru Topallı and Dr. Kağan
Topallı, not only for constantly coaching and helping me in clean room, but also for
being an elder sister and brother. Certainly, particular thanks to Akın Aydemir and
Kaan Demirel for their kind helps. I would also thank to all technical and
administrative staff of METU-MEMS Research and Application Center for their
devoted works.
I would like to thank all present and former members of METU MEMS-VLSI and
RF MEMS Research Group for their nice friendship. Thanks to İlker Comart, Çağrı
Çetintepe, Özgehan Şahin, Ramazan Çetin, Korkut Kaan Tokgöz for nice talks and
friendships. Great thanks to Emre Şahin and Burak Eminoğlu for their contributions
on my electronics background. Equally, I am grateful to my seniors Dr. Mehmet
Ünlü, Dr. Murat Tepegöz, Dr. Said Emre Alper, and Dr. Mahmud Yusuf Tanrıkulu.
My very special thanks go to my parents, Kiraz and Hilmi Yılmaz, for their eternal
trust and support, and for never leaving me alone in any period of my life. Of
course, I have not forgotten my brother, Serkan Yılmaz, and I will always feel
confident thanks to his unconditional support.
x

TABLE OF CONTENTS
ABSTRACT ............................................................................................................................ iv
ÖZ ........................................................................................................................................... vi
ACKNOWLEDGEMENTS .................................................................................................... ix
TABLE OF CONTENTS ........................................................................................................ xi
LIST OF TABLES ................................................................................................................ xiii
LIST OF FIGURES .............................................................................................................. xiv
CHAPTERS
1 INTRODUCTION ................................................................................................................ 1
1.1 Particle Separation Methods and Theoretical Background ......................................... 5
1.1.1 Acoustic Separation ........................................................................................... 5
1.1.2 Magnetic Separation ........................................................................................... 6
1.1.3 Mechanical Separation ....................................................................................... 7
1.1.4 Electrochemical Separation ................................................................................ 9
1.1.5 Electrical Separation ........................................................................................ 10
1.2 Electrical Separation Methods in the Literature ....................................................... 11
1.3 Research Objectives and Thesis Organization .......................................................... 16
2 THEORY OF DIELECTROPHORESIS ............................................................................ 18
2.1 Direct Dielectrophoresis (DEP) ................................................................................ 19
2.2 Travelling Wave Dielectrophoresis (TWD) .............................................................. 26
2.3 Electrorotation .......................................................................................................... 28
2.4 Strategies for Applications of Dielectrophoresis ...................................................... 29
2.4.1 Castellated Electrodes ...................................................................................... 29
2.4.2 Ratchet Electrodes ............................................................................................ 30
2.4.3 Concentric Electrodes ...................................................................................... 31
2.4.4 Quadruple Electrodes ....................................................................................... 32
xi

2.4.5 Parallel Electrodes ............................................................................................ 33
2.4.6 Spiral Electrodes .............................................................................................. 34
2.4.7 Insulating Obstacles and Deformations on the Channel .................................. 34
2.5 Techniques of Dielectrophoresis ............................................................................... 35
3 DESIGN OF THE DIELECTROPHORETIC PARTICLE SEPARATOR ........................ 37
3.1 Physical Structure of the Dielectrophoretic Particle Separator ................................. 37
3.2 Evolution of the 3D Device Design .......................................................................... 40
3.2.1 Design I: Cross Junction Center Electrode ...................................................... 40
3.2.2 Design II: Dome Shaped Back Side Electrode ................................................. 43
3.2.3 Design III: Co-planar Electrodes ...................................................................... 45
3.2.4 Design IV: 3D Electrodes ................................................................................ 48
3.3 Theoretical Explanation of the Device ...................................................................... 49
3.4 Design Parameters and Trade-Off ............................................................................ 51
3.5 Advantages of the Design ......................................................................................... 55
3.6 Simulations Based on FEM ...................................................................................... 57
4 FABRICATION AND EXPERIMENTATION OF THE DIELECTROPHORETIC
SEPARATOR ........................................................................................................................ 61
4.1 Fabrication Flow of the Structures ............................................................................ 62
4.1.1 Fabrication Flow of Design I ........................................................................... 62
4.1.2 Fabrication Flow of Design II .......................................................................... 64
4.1.3 Fabrication Flow of Design III ......................................................................... 66
4.1.4 Fabrication Flow of Design IV ......................................................................... 68
4.2 Experimental Setup ................................................................................................... 73
4.3 Experimental Method (DC Dielectrophoresis) ......................................................... 75
4.4 Test Results and Discussions .................................................................................... 76
5 CONCLUSIONS AND FUTURE RESEARCH OBJECTIVES ........................................ 80
REFERENCES ...................................................................................................................... 83
APPENDIX .................................. 87 A. FEM SIMULATIONS OF ALL SETS OF DEVICES
xii

LIST OF TABLES
TABLES
Table 2.1: Dimensions of DSC group 1 devices. All dimensions are in micrometers.
.................................................................................................................................... 54
Table 2.2: Dimensions of DSC group 2 devices. All dimensions are in micrometers.
.................................................................................................................................... 55
Table 2.3: Dimensions of DSC group 3 devices. All dimensions are in micrometers.
.................................................................................................................................... 55
xiii

LIST OF FIGURES
FIGURES
Figure 1.1: Scale comparison of biological agents vs. micro systems [3]. .................. 4
Figure 1.2: (a) Separation mechanism and repositioning of larger particles closer to
the channel center and smaller particles farther from the center due to differing
acoustic forces (b) Comparison of forces acting on particles at site 1 and site 2,
respectively [7]. ............................................................................................................ 6
Figure 1.3: Schematic depiction of the micromagnetic separation device that contains
a microfabricated layer of soft magnetic NiFe material adjacent to a microfluidic
channel with two inlets and outlets [9]. ....................................................................... 7
Figure 1.4: Deep-field image of a filter array and access well. The 10 mm particles
are arrested at the filter structures while 3 mm particles pass unaffected [10]. ........... 8
Figure 1.5: Impedance magnitude at 760 Hz during the process of cell capture and
on-chip lysis. The impedance drop before and 10 min after injecting the lysing
solution is associated with cell lysis and is used as a cell-numbers indicator [11]. ..... 9
Figure 1.6: Separation of white blood cells and yeast cells using dielectrophoresis
[12]. White blood cells are deflected to the angled micro channel due to the
dielectrophoretic force generated at the tip of the triangular electrode whereas yeast
cells continue to move in the mainstream. ................................................................. 11
Figure 1.7: Fluorescence image of streaming dielectrophoresis of 200-nm fluorescent
latex spheres (white) in a microchip containing an array of diamond-shaped posts
(black) [21]. ................................................................................................................ 14
xiv

Figure 1.8: Moving electric field is generated by sequentially energizing an array of
electrodes to form an electric field that moves from one end to other. Note that there
is no phase difference in the electric field, as in the traveling wave electric field [24].
.................................................................................................................................... 15
Figure 2.1: (a) Homogenous rigid spherical particle with radius R and (b) single shell
spherical particle with overall radius R and shell thickness of d. .............................. 20
Figure 2.2: Variation of Clausius-Mossotti factor, and hence the dielectrophoretic
force, with respect to the frequency of the applied electric field for three different
media conductivities [12]. .......................................................................................... 23
Figure 2.3: Distribution of crossover frequency, a dielectrophoretic parameter, for 9
different types of tumor cells and normal peripheral blood mononucleocytes [29]. 24
Figure 2.4: Illustration of one dimensional travelling electric field [17]. Since the
signals on each electrode are shifted in time-domain, potential along the channel
varies in space-domain at a certain instant. Therefore, the cell tracks the varying
electric field. ............................................................................................................... 27
Figure 2.5: Castellated electrodes are utilized to create dielectrophoretic force.
Separation of human metastatic breast cancer (larger cells) from dilute peripheral
blood. (A) During initial collection. (B) During release. (C) Cancer cells remained on
the electrode tips after blood cells had been swept downstream. (D) Close to the
outlet only blood cells, in focused bands, are moving [33]. ...................................... 30
Figure 2.6: An application of ratchet electrodes which separates cells using three-
outlet system which differentiates focusing and deviating cells under electric field
[34]. ............................................................................................................................ 31
Figure 2.7: Concentric electrode configuration to create non uniform electric field in
the radial direction [17]. ............................................................................................. 32
Figure 2.8: Quadruple electrodes are utilized to manipulate actin-myosin systems
[38]. From left to right, no field application, distribution under electric field, and
fluorescent imaging of actin-myosin systems are presented. ..................................... 33
xv

Figure 2.9: An illustration presenting how direct and travelling wave
dielectrophoresis can be applied using the same electrode configuration but changing
the phases of the applied potential. ............................................................................ 33
Figure 2.10: Collection of malaria infected erythrocytes by TWD. (A) Before
application of a travelling electrical field, parasitised cells (arrows) were spread
throughout the sample. (B) Application of four phase signals to the spiral electrode
elements caused normal erythrocytes to be trapped at the electrode edges while
parasitised cells were levitated and carried towards the centre of the spiral by the
travelling field [32]. ................................................................................................... 34
Figure 2.11: Utilization of an insulating hurdle to create non-uniformity in the
electric field distribution [12]..................................................................................... 35
Figure 3.1: Parallel electrode configuration to create non-uniform electric field
between electrodes. .................................................................................................... 38
Figure 3.2: Concentric electrode configuration to form radially non-uniform electric
field. ........................................................................................................................... 38
Figure 3.3: Red lines indicate the spiral channel walls and blue regions define the
spiral channel area. ..................................................................................................... 39
Figure 3.4: Illustration of the cross-junction center electrode configuration: (a) top
view and (b) side view. .............................................................................................. 41
Figure 3.5: Weak and strong electric field regions in cross-junction center electrode
configuration. ............................................................................................................. 42
Figure 3.6: Illustration of the dome shaped back side electrode: (a) top view and (b)
bottom view (c) side view. ......................................................................................... 43
Figure 3.7: Illustration of the electric field lines for design II. Electric field lines
confine into the glass substrate instead of micro channels, therefore sufficient
dielectrophoretic force cannot be generated inside the channels. .............................. 44
Figure 3.8: Illustration of the co-planar electrode configuration: (a) top view and (b)
side view. ................................................................................................................... 46
xvi

Figure 3.9: Illustration of the method to bias the center electrode in co-planar
electrode configuration. ............................................................................................. 47
Figure 3.10: Illustration of the side view of the 3D electrodes design. ..................... 48
Figure 3.11: Design parameters of the spiral dielectrophoretic separator. ................ 49
Figure 3.12: Electric field line distributions for 2D and 3D electrodes where red
particles denote the small particles and green ones denote the larger particles. ........ 56
Figure 3.13: COMSOL 3.4 Multiphysics simulation results for the device possessing
the parameters a=100 µm, b=1700 µm, r0=400 µm, rq=160 µm and a channel width
of 80 µm. In this case, simulation results are limited between 2.05x10⁴ V/m and
2.4x10⁴ V/m to provide better representation of field distribution inside the channels.
.................................................................................................................................... 59
Figure 3.14: COMSOL 3.4 Multiphysics simulation results for the device possessing
the parameters a=100 µm, b=1700 µm, r0=400 µm, rq=160 µm and a channel width
of 80 µm. Simulation results are limited between 1.00x10¹¹ V2/m3 and 3.00x10¹²
V2/m3 to provide better representation of 2 distribution inside the channels. ..... 60
Figure 4.1: Fabrication flow of design I. ................................................................... 63
Figure 4.2: Fabrication flow of design II. .................................................................. 64
Figure 4.3: Fabrication flow of design III. ................................................................. 67
Figure 4.4: Fabrication flow of design IV. ................................................................. 71
Figure 4.5: Fabricated dielectrophoretic separators. (a) Wafer level devices with
dicing, (b) a single device containing three identical spirals, (c) optical microscope
image of a single spiral device. .................................................................................. 72
Figure 4.6: Illustration of test setup prepared to perform high voltage DC
dielectrophoresis and monitoring of the moving particles using a CCD camera
mounted microscope with fluorescent attachment. .................................................... 73
Figure 4.7: Test setup used for performing high voltage DC dielectrophoresis tests
using a fluorescent microscope with a CCD camera for online monitoring. ............. 74
Figure 4.8: A typical snapshot of the recorded video. ............................................... 76
xvii

xviii
Figure 4.9: Comparative histogram of extracted speeds of 1 µm and 10 µm beads,
where data bars show the number of bead counts for given speed interval and the
straight lines show the best Gaussian fits for normalized amplitude. Please note the
break in the horizontal axis. ....................................................................................... 79
Figure A.1: distribution of the device 100a_550b_300r_20q_10w. .................. 88 2
Figure A.2: distribution of the device 100a_550b_300r_20q_18w. .................. 88 2
Figure A.3: distribution of the device 100a_550b_300r_40q_20w. .................. 89 2
Figure A.4: distribution of the device 100a_900b_400r_40q_20w. .................. 89 2
Figure A.5: distribution of the device 100a_900b_400r_40q_35w. .................. 90 2
Figure A.6: distribution of the device 100a_1150b_400r_50q_25w. ................ 90 2
Figure A.7: distribution of the device 100a_1150b_400r_50q_45w. ................ 91 2
Figure A.8: distribution of the device 100a_1200b_400r_80q_40w. ................ 91 2
Figure A.9: istribution of the device 100a_1200b_400r_80q_75w. ................ 92 2 d
Figure A.10: distribution of the device 100a_1700b_400r_160q_150w. .......... 92 2
Figure A.11: distribution of the device 200a_1100b_600r_40q_20w. .............. 93 2
Figure A.12: 2 distribution of the device 200a_1100b_600r_40q_30w. .............. 93

CHAPTER 1
1 INTRODUCTION
When integrated circuit (IC) production technology has been started to be applied to
create electro-mechanical systems, Micro ElectroMechanical Systems (MEMS)
research and application area has emerged. This research area exploits the
microfabrication technologies developed for IC manufacturing and aims to create
systems consisting of electrical and mechanical sub-systems. With this technology,
macro level conventional applications such as accelerometers, gyroscopes, RF
switches, bolometers, and pressure sensors are miniaturized at first for research
purposes; however, nowadays most of them can be found in the customer electronics
market. Besides, these micro sensors can be found in popular systems such as Apple
iPhone and Nintendo Wii. This fast development line from research to end-product
shows that MEMS technology will play an important role both in the cutting-edge
technology development and in the customer electronics market in the very near
future. This achievement can be explained by the following features which MEMS
posssess:
• Small size (volume and mass)
• Low cost fabrication if mass production is available
• Low power consumption
In the last decades, MEMS technology found a new application area: Biomedical
Micro ElectroMechanical Systems (BioMEMS). In this research and application
area, basically, miniaturization of conventional biomedical systems and integration
of these systems onto chips are studied. BioMEMS research can be analyzed in two
classes: diagnostic and therapeutic [1]. Diagnostic systems cover analysis and
1

characterization of the biological samples, and therapeutic systems include flexible
electrode arrays for stimulation and neural implants. This thesis concentrates on
systems which can be utilized in diagnosis.
Ultimate goal in diagnostic BioMEMS is to design and implement systems which
could perform the all the steps of a conventional clinical analysis on a single chip, so
called Lab-On-a-Chip. As the name implies, BioMEMS offer chip-level biochemical
laboratories, which are supposed to exhibit high performance at very low cost. In
order to achieve this goal, first of all, the individual components have been studied,
and now, integration of these components to perform an application is one of the
main research topics in this area. These individual components refer to
• micro needles for injection and delivery purposes,
• various micro channel types for transportation and manipulation of fluids,
• micro valves, micro mixers, and micro pumps for microfluidic applications,
• micro grippers for handling a single cell
• gravimetric mass sensors for biological sample detection purposes,
• chemical and biochemical sensors for toxic agent detection, and
• electrical separators for separation and concentration purposes.
Currently, the researchers in BioMEMS area are looking for a way to combine the
appropriate elements to design Lab-On-a-Chips performing a clinical analysis such
as blood cell analysis, mutation detection, and cancer cell detection etc.
Another aspect of BioMEMS is to fulfill the necessity of micro level systems which
possess dimensions comparable with the biological agents under consideration such
as cell, bacteria, protein, and DNA. Note that micro systems allow realization of
certain phenomena such as dielectrophoresis which is only applicable for particles in
the range of 1 µm - 1 mm and applications such as capillary electrophoresis which
are not possible or feasible in macro level.
BioMEMS offer both massive and single particle analysis which is not common in
conventional macro systems. Since cells or particles under concern in medicine and
biology are in the order of micrometers, it is obvious that employing MEMS into
biomedical systems is beneficial. A scaled diagram exhibiting common biological
2

agents and their dimensions with respect to the dimensions employed in IC and
MEMS fabrication technology is presented in Figure 1.1.
Other than these advantages, miniaturization of biomedical devices provides the
below advantages additionally [2]:
• less sample and reagent consumption due to the analysis volume in the order
of microliters,
• short analysis duration due to the shorter length of separation of concentration
compared to conventional systems,
• safe experiments since chemical analytes which can cause hazardous
reactions are used in very low volumes,
• enhanced heat transfer due to high surface area-to-volume ratio,
• in vivo usage since they are biocompatible and small enough to insert into the
body,
• high sensitivity and resolution since the micro systems are comparable with
the biological agents,
• laminar flow due to very low Reynolds number in the microchannels, and
• portability due to low weight and low power consumption.
Considering the mentioned advantages of BioMEMS over conventional biomedical
systems, it is not surprising that biosensors have found applications in medicine, food
safety, and homeland security.
As stated previously, devices performing separation of biological agents constitute
one of the major research topics in the biomedical micro technologies. Separation of
biological agents is generally the first step of many analyses. Note that the accuracy
and the sensitivity of Lab-On-a-Chip systems can be improved by eliminating the
unnecessary particles or concentrating the necessary particles at the very first
separation step. Also, separation of biological agents is important for diagnosis in
clinical medicine.
3

Figure 1.1: Scale comparison of biological agents vs. micro systems [3].
This thesis reports a dielectrophoretic particle and cell separator to differentiate
different-size particles which possess the same electrical properties. Ultimate goal in
this study is to enhance the performance of separation such that separation of sub-
species of a cell line becomes possible due to their different sizes.
This chapter presents the literature survey related with separation methods and the
background information on theoretical basis. Advantages and disadvantages of these
methods have been compared for practical cases and the relevant discussions are
presented.
Finally, the chapter is concluded with research objectives and motivations and
organization of the thesis is given.
4

1.1 Particle Separation Methods and Theoretical Background
As explained previously, particle and cell separation methods constitute one of the
most important research areas in BioMEMS. Therefore, various methods have been
established through the years. Some of them are the imitations of the macro systems,
and the rest is only possible for micro systems. General separation types employed in
micro systems are based on acoustic, magnetic, mechanical, electrochemical, and
electrical phenomena [4-5].
1.1.1 Acoustic Separation
Acoustic separation technique addresses the separation of particles by means of
sound waves. Generation of standing waves via ultrasonic waves is the main method
employed for acoustic separation which is also named as acoustophoresis. The main
challenge in acoustic separation is to create and sustain the standing wave formation
inside the channel which requires a challenging design phase and repeatable
fabrication methods. Acoustic separation is performed via the trapping sites which
correspond to the nodes and antinodes of the standing wave. The particles which are
subjected to acoustic force move either towards the nodes or towards the antinodes
depending on the particle properties. It has been reported that particles and cells
which are under influence of acoustic forces are differentiated depending on their
specific properties such as density or geometric properties such as size [6].
Since the positions and numbers of trapping sites are determined by the geometry of
the separation chamber, the design phase is critical. Moreover, the deviations in the
fabrication phase affect the device performance significantly. Note that separation
efficiency degrades if the alignment of the trapping sites and separation zone is not
perfectly done. An external resonator is required for generating a standing wave and
integration of this external unit into the micro system is required. Therefore, to
eliminate this requirement, acoustic separation is performed via surface acoustic
waves which are generated on chip. Figure 1.2 presents the continuous particle
5

separation mechanism based on size difference using standing surface acoustic
waves [7].
Figure 1.2: (a) Separation mechanism and repositioning of larger particles closer to the
channel center and smaller particles farther from the center due to differing acoustic forces
(b) Comparison of forces acting on particles at site 1 and site 2, respectively [7].
1.1.2 Magnetic Separation
Magnetic separation methods are mainly utilized for separation of ferromagnetic and
non-magnetic particles. Note that using a magnet, ferromagnetic particles can be
brought together, and therefore can be separated from non-magnetic particles. There
are two methods employed to possess the magnetic property required for magnetic
separation: either use the natural magnetic properties of the cell or attach a magnetic
tag onto the cell [8]. The first one, usually, fails in the experimentation phase due to
the weak magnetic properties of the living cells and non-magnetic polymeric beads.
6

The latter one provides better separation performance; however, requires additional
processing of the cell such as magnetic bead attachment protocols.
The most popular cell used in the literature is red blood cell due to its iron containing
protein, Hemoglobin, content. Figure 1.3 shows the illustration of a red blood cell
separator in continuous flow relying on magnetophoretic principles [9].
Figure 1.3: Schematic depiction of the micromagnetic separation device that contains a
microfabricated layer of soft magnetic NiFe material adjacent to a microfluidic channel with
two inlets and outlets [9].
1.1.3 Mechanical Separation
Differences in mechanical properties such as size, shape, and elasticity provide
mechanical separation of particles. Common method is to create different size
channels or different size obstacles to prevent the passage of bigger particles and
7

allow the smaller ones [10]. Figure 1.4 presents an example of mechanical separation
of particles depending on their size differences. Main challenge for this kind of
design is the blockage of the gates due to piling bigger particles. Generally, turbulent
flow regimes are created to prevent blockage; however, this solution increases the
separation time and decreases the separation efficiency. Another way is to use the
elasticity differences of the living cells. Common application is to differentiate red
blood cells which exhibit a high elasticity from other blood cells.
Figure 1.4: Deep-field image of a filter array and access well. The 10 mm particles are
arrested at the filter structures while 3 mm particles pass unaffected [10].
8

1.1.4 Electrochemical Separation
Miniaturization of the conventional macro systems such as voltammetry and
amperometry defines the electrochemical separation methods. These systems detect
the variations in the electrical signals due to the chemical reactions performed. Cell
lysate impedance spectroscopy [11] is an example for electrochemical separation in
which cell concentration is measured with respect to the variations in the lysing agent
inside the solution. Figure 1.5 exhibits the experimental results of cell lysis by
correlating the impedance variation with number of cells died. When the cells die,
the content of the cytoplasm gets out and ion release from cell lysis causes
impedance drop. As the cells die in this method, it is not suitable for systems which
require further processing of the cells.
Figure 1.5: Impedance magnitude at 760 Hz during the process of cell capture and on-chip
lysis. The impedance drop before and 10 min after injecting the lysing solution is associated
with cell lysis and is used as a cell-numbers indicator [11].
9

1.1.5 Electrical Separation
Electrical separation methods rely on the differences in the dielectric properties of
the particles and cells such as permittivity and conductivity. When permittivity and
conductivity parameters are combined with the geometric information, capacitance
and resistance values are found, respectively. Therefore, electrical modeling of the
particles/cells and medium is performed with these parameters to understand the
behavior. For instance, modeling of a living cell with its medium provides
information about the reaction of the cell with respect to various concentration level
of a certain ion to some extent.
Electrical separation is important since electrical properties of biological samples
such as DNA and cells are specific to each type and these properties, generally, alter
under unusual conditions. In the literature, there are mainly two electrical separation
methods: electrophoresis and dielectrophoresis. All other methods in the literature
can be deducted from these two methods. In fact, this classification depends on
whether the particle has a net charge or not. Electrophoretic methods can only be
employed on charged particles; however, dielectrophoresis works on neutral
particles. Electrophoresis, mainly, defines the movement of charged particles which
are dispersed in a medium under a uniform electric field. Dielectrophoresis is defined
as the movement of dielectric particles in the presence of a non-uniform electric
field, when the particle and the surrounding medium have different dielectric
constants and polarizabilities. Detailed information about electrical separation
methods is supplied throughout the text. Figure 1.6 depicts a study on differentiation
of white blood cells from yeast cells [12].
10

Figure 1.6: Separation of white blood cells and yeast cells using dielectrophoresis [12].
White blood cells are deflected to the angled micro channel due to the dielectrophoretic force
generated at the tip of the triangular electrode whereas yeast cells continue to move in the
mainstream.
Up to now, state-of-the-art separation methods in micro systems are explained
briefly. In this study, electrical separation is preferred since it
• does not require labeling or magnetic tag attachment,
• is more reliable than acoustic separation thanks to its design and fabrication
flexilibity,
• does not require electrochemical reactions to separate cells, and
• shows better performance than mechanical separation methods.
Next section describes the electrical separation methods reported in the literature and
presents a comparison among them.
1.2 Electrical Separation Methods in the Literature
As indicated in previous section, electrical separation methods rely on the detection
of the differences in the electrical properties of the particles and these techniques are
mainly based on two electrical phenomena: electrophoresis and dielectrophoresis.
Electrophoresis is the motion of charged particles, which are dispersed in a medium,
under the influence of spatially uniform electric field. Dielectrophoresis is the motion
11

of dielectric particles which have different polarizabilities from medium under
spatially non-uniform electric field [13]. The main differences between
electrophoresis and dielectrophoresis are observed in the definitions: Electrophoresis
requires charged particles whereas dielectrophoresis can be performed on neutral
particles since dielectrophoresis forms its own dipole from the polarizable particle.
Moreover, uniform electric field is utilized in electrophoresis while non-uniform
electric field is required in dielectrophoresis. This non-uniform electric field plays an
important role in generating dipoles from neutral particles.
In order to separate particles using electrophoresis, particles should fit one of these
options: either opposite charged particles or same charged particles which possess
different amount of charge are required. Actually, the charge-to-mass ratio should be
different to perform electrophoretic separation. Note that aggregation is inevitable
when opposite charged particles are dispersed in a medium. Therefore, separation of
opposite charged particles in the same medium is theoretically possible; however,
practical problems are encountered during experimentation. On the other hand,
separation of same charged particles which have different amount of charge is
limited when resolution is considered. To increase resolution, separation length
should be increased; however, it means higher voltage application to possess the
same electric field magnitude, which is not practical. On top of that, it should be
noted that most of the cells have a dynamic charge transfer with the ambient. Thus,
relying on a constant net charge for separating cells is not reasonable. As a result,
electrophoresis is not the best method for separation of particles. Nevertheless, power
of electrophoresis in separation of charged particles such as DNA or proteins cannot
be ignored [14]. When cells or polymeric particles are the main interest,
dielectrophoresis steps up since it does not require a stable net charge distribution on
the particle.
There are several types of dielectrophoresis reported in the literature: direct
dielectrophoresis (DEP) [15-17], travelling wave dielectrophoresis (TWD) [18-19],
electro-rotation (ROT) [20], isolating dielectrophoresis [21-22], image
dielectrophoresis [23], and moving dielectrophoresis [24].
12

Direct dielectrophoresis has a number of advantages and differences with respect to
the other types of dielectrophoresis. Firstly, travelling wave dielectrophoresis occurs
where a travelling electric field exists. This existence can be provided by placing
electrodes and applying phase-shifted signals to these electrodes. Therefore,
controlled phase-shifted signal sources or phase shifter circuits are required to
perform experiments. Secondly, electrorotation is an action induced by a dielectric
dipole placed in a rotating electric field; therefore, it also requires phase shifted
signals or high frequency switching on electrodes surrounding the region of interest.
However, it should also be noted that electrorotation spectrum is very useful in
determining dielectrophoretic spectra and extraction of DEP spectrum from ROT
spectrum is very common in literature [25-26].
This extraction is necessary since directly measuring force exerted on cells is not
possible, while extracting rotational speed of them using image processing tools is
easy; however, this method still requires additional effort for image processing.
Thirdly, isolating dielectrophoresis is an application of dielectrophoresis in which
streaming and trapping regimes are employed. Dielectrophoretic streaming means
the fluid flow through the arrays and trapping means the reversibly immobilization of
particles on the insulating posts [21]. This method is similar to direct
dielectrophoresis; however, immobilization process makes it a bit hard. Figure 1.7
shows fluorescence image of streaming dielectrophoresis of latex spheres in a
microchip containing an array of diamond-shaped posts.
13

Figure 1.7: Fluorescence image of streaming dielectrophoresis of 200-nm fluorescent latex
spheres (white) in a microchip containing an array of diamond-shaped posts (black) [21].
Fourthly, optical image-driven dielectrophoresis technique requires a
photoconductive surface, on which electric fields can be patterned at high-resolution,
for manipulation of particles [23]. Finally, moving dielectrophoresis utilizes moving
electric field which is generated by sequentially energizing an array of electrodes to
form an electric field that moves from one end to other as in the case of
electrorotation [24].
14

Figure 1.8: Moving electric field is generated by sequentially energizing an array of
electrodes to form an electric field that moves from one end to other. Note that there is no
phase difference in the electric field, as in the traveling wave electric field [24].
From this point, direct dielectrophoresis will be named as dielectrophoresis since all
the dielectrophoresis methods rely on almost the same theory. The only difference
arises at real and imaginary parts of the Clausius-Mossotti factor which is a function
of complex permittivities of the medium and the particle. Detailed analysis of
Clausius-Mossotti factor is presented in Chapter 2.
15

1.3 Research Objectives and Thesis Organization
In this research, the following objectives are aimed:
• Design, simulation, and implementation of a dielectrophoretic cell separation
system which does not require markers or labeling:
o A design that satisfies the theoretical requirements of
dielectrophoresis and could separate particles with respect to their size
differences when the environmental conditions are properly adjusted.
o A design that allows parallel processing, which means separation of
various particles simultaneously.
o Verification of the design with a simulation tool that utilizes finite
element method. Comparison with rough hand calculations may be a
good starting point to check the accuracy of the simulated model.
o Fabrication flow development for the dielectrophoretic particle
separator. The fabrication flow should be optimized at each step such
that preceding and proceeding steps do not damage the current step.
o Design of an experimental setup which aims to eliminate all the
environmental effects that worsen the device performance and
interfere with the device characterization.
o Discussion of the experimental results in conjunction with the
simulation results.
This thesis is organized as follows:
Chapter 2 introduces the theoretical background of dielectrophoresis with an
emphasis on direct dielectrophoresis. Next, brief information about other types of
dielectrophoresis, namely as travelling wave dielectrophoresis and electrorotation, is
given. Then, strategies for application of dielectrophoresis are discussed by
referencing the literature. Finally, techniques of dielectrophoresis are presented.
16

17
Chapter 3 gives the details of the design phase of the dielectrophoretic particle
separator. First, the physical design of the separator is introduced with the discussion
why this geometry is selected in comparison with other possibilities. Also,
modifications on the design are presented by explaining the reasons. Next, theoretical
explanation and validity of the final design is introduced with design parameters.
Then, the trade-offs between the mentioned design parameters are investigated. After
that, the advantages of this design are presented with practical reasons. Finally,
simulations of the proposed structure are performed using finite element analysis
tools to prove that the design is correct in terms of theoretical aspects such as electric
field gradient and its distribution.
Chapter 4 spreads out the fabrication process of dielectrophoretic particle separator
and experimentation. Fabrication flow is introduced in detail and solutions of the
problems related with fabrication are explained. Fabricated devices, as well as the
test setup, are presented. Next, the experimental method and the protocols for
preparation of the samples are given. Finally, the test results are presented and
discussions on the results in conjunction with simulation results are performed.
Finally, Chapter 5presents the conclusion of this work and states the possible future
works related to this study. The final chapter explains the scientific value of this
work and gives explicit examples for practical clinical applications. In the end, the
methods that may enhance the separation performance are discussed.

CHAPTER 2
2 THEORY OF DIELECTROPHORESIS
Dielectrophoretic force is defined as the force exerted on an uncharged dielectric
particle in the presence of a non-uniform electric field, when the particle and the
surrounding medium have different dielectric constants and polarizabilities.
Dielectrophoresis is the manipulation or the motion of particles which are exposed to
the dielectrophoretic force.
Equation (2.1) represents the general formula governing the force ( ) exerted on a
dipole in an electric field , where ( ) denotes the dipole moment of the particle
and ) denotes the del operator in three dimensional Cartesian coordinate system
[27].
· (2.1)
The dipole moment of a homogenous solid spherical particle of radius R is defined in
equation (2.2) [27]:
4 2 R (2.2)
where denotes the electrical permittivity of the medium, and are complex
electrical permittivities of the particle and the medium, respectively.
18

2.1 Direct Dielectrophoresis (DEP)
Substituting equation (2.2) into equation (2.1) and assuming that applied electric
field is formed via an AC source for the sake of generality, the time-averaged
dielectrophoretic force exerted on a spherical particle is represented as [17]:
2 R Re fCM | | (2.3)
where fCM is the Clausius-Mossotti factor which indicates whether the medium or the
particle is more polarizable as given in equation (2.4) [17].
fCM 2 (2.4)
As stated previously, Clausius-Mossotti factor explains the dependence of the force
on complex permittivities of the medium and the particle. Complex permittivity of
the medium is defined as [17]:
(2.5)
where ω is the angular frequency of the applied electric field, and ε and σ denote the
electrical permittivity and the electrical conductivity, respectively.
The definition in equation (2.5) holds for the particle; however, with a limitation. If
the spherical particle is a homogenous rigid body, complex permittivity of the
particle is defined as in equation (2.5). However, if the spherical particle is formed
from a single shell covering a core, the particle complex permittivity, , equation
becomes:
2 2
2
(2.6)
19

where d is the thickness of the shell, R is the overall radius of the particle, and and
denote the complex permittivities of the core and the shell, respectively. Figure
2.1 depicts a homogenous rigid spherical particle with radius R and a single shell
spherical particle with overall radius R and shell thickness of d. More detailed
modeling of alive cells is investigated in the literature [28].
Figure 2.1: (a) Homogenous rigid spherical particle with radius R and (b) single shell
spherical particle with overall radius R and shell thickness of d.
Note that for multi-shell modeling purposes, complex permittivity definition gets
more complicated; however, since most of the living cells can be modeled as a single
shell and a single core, further calculation is not required at the moment. The hint for
multi-shell modeling is to employ successive single shell operations from inner shell
to the outmost shell.
The equations presented up to now gives the following outcomes:
• Under constant electric field, DEP force does not exist.
• Polarity of the applied potential is insignificant on the direction of the DEP
force, therefore, direction of the DEP force can be either in the same direction
with or in the opposite direction of electric field.
20

• Frequency of the applied potential plays an important role in the direction of
the DEP force since the frequency is the only adjustable value in the complex
permittivity equation. Note that complex permittivity defines the
polarizability of the particle and the medium, and hence, the direction of the
DEP force. If the particle and the medium have the same polarizabilities,
force becomes zero.
• Force is directly dependent on the cube of the radius; however, it should be
noted that dielectrophoresis is possible for particles having radii in the order
of micrometers [17]. Thus, the application of the force is limited to
micrometer scale particles.
Dielectrophoresis is classified as positive DEP or negative DEP depending on the
sign of the fCM which indicates the movement direction of the dielectric particle. If
complex permittivity of the particle is larger than the medium, i.e. , then the
particle moves to the region where the electric field is more intense. Inversely, if
complex permittivity of the particle is smaller than medium, i.e. , then the
particle moves to the region where electric field is less intense. These force direction
dependent phenomena are called positive DEP (pDEP) and negative DEP (nDEP),
respectively.
Limiting cases of the Clausius-Mossotti factor for frequency spectrum can be
expressed as:
lim e fC 2R M
lim Re fCM 2
(2.7)
The results show that the sign of the Clausius-Mossotti factor is determined by the
electrical conductivities of the particle and the medium at low frequencies.
However, it is determined by the permittivities at higher frequencies.
21

Figure 2.2 presents the variation of Clausius-Mossotti factor, and hence the
dielectrophoretic force, with respect to the frequency of the applied electric field for
different media conductivities.
Another point is that when frequency goes to zero (DC), if , maximum
value of the Clausius-Mossotti factor occurs and it is equal to 1. However, if
occurs in the same case, then minimum value of the Clausius-Mossotti
factor occurs and it is equal to -0.5. These outcomes can be extended for high
frequency case when electrical permittivities are compared.
Careful analysis of the Clausius-Mossotti factor equation with complex permittivity
definition shows that there exists a frequency such that the Clausius-Mossotti factor
becomes zero, and therefore the DEP force. It is also evident that, at one side of this
zero-force frequency the force is negative and at the other side, force is positive.
This frequency is called DEP crossover frequency. The formal definition of DEP
crossover frequency is that the point where the real part of Clausius-Mossotti factor,
Re becomes zero. The crossover frequency, , whose expression is given in
equation (2.8) can easily be derived using above given formulas.
12
22
(2.8)
Analysis of Clausius-Mossotti factor indicates that separation of particles can be
performed using the difference in their electrical properties. The distribution of
crossover frequency for nine different types of tumor cells and normal peripheral
blood mononucleocytes has been reported in the literature as depicted in Figure 2.3
[29]. For example, if 50 kHz signal is applied, monocytes will be affected by
negative dielectrophoresis, whereas granulocytes will be affected by positive
dielectrophoresis. The main challenge is, again, the resolution of crossover
frequency.
22

Note that for particles or cells having crossover frequencies close to each other even
if proper frequency is applied, dielectrophoretic forces may not be sufficient
although they are in the opposite direction. Since the value of Clausius-Mossotti
factor is close to zero near the crossover frequency, it will be wise to separate
particles having sufficient difference in crossover frequency using this method.
However, there is another way to separate particles possessing similar electrical
properties: size based separation.
Figure 2.2: Variation of Clausius-Mossotti factor, and hence the dielectrophoretic force, with
respect to the frequency of the applied electric field for three different media conductivities
[12].
Considering that dielectrophoretic force is directly dependent on R3 for a spherical
particle, there exists a force difference for different size particles. At first, since
mass is directly dependent on R3, it is not supposed to create any difference in
acceleration terms.
23

However, it should be noted that when particle is exposed to dielectrophoretic force
and starts to move, new forces arise and if all the forces acting on the particle are in
balance, then no acceleration is observed, but this does not mean that there is no
movement or the velocity is zero. Therefore, for zero acceleration case, a force
balance equation can be designed by using the viscous drag force which is generated
by the movement of the particle. Equation (2.9) denotes the viscous drag force [17].
Figure 2.3: Distribution of crossover frequency, a dielectrophoretic parameter, for 9
different types of tumor cells and normal peripheral blood mononucleocytes [29].
24

6 R
(2.9)
where denotes the viscosity of the medium and represents the velocity of the
particle. Equating dielectrophoretic force and viscous drag force, force balance
equation is obtained:
(2.10)
Substituting the expressions of these two forces, the following equation is obtained:
2 R Re fCM | | 6 R
(2.11)
The velocity of the particle inside the microchannel can be derived from equation
(2.11) by taking into account the effect of viscosity:
6 (2.12)
where is the average velocity of the particles, R is the radius of the particle,
and η is the viscosity of the medium.
According to equation (2.12), for two different particles having radii R1 and R2 and
with Clausius-Mossotti factors fCM,1 and fCM,2, respectively, following relation
between the average speeds and holds:
,6
,6
R Re fCM,
R Re fCM,
(2.13)
25

Therefore the average speed, or equivalently, the travelled distance in the
microchannels for a predefined time period, can be used as the discrimination factor
between different particles.
For the same type of particles having different sizes the expression becomes:
,6
,6
RR
(2.14)
Since Clausius-Mossotti factors of the same type of particles will be the same, they
will cancel each other.
As a result, for the particles having the same electrical properties, different size
particles move at a velocity which is directly dependent of the square of their radii.
In this study, the main focus is on the separation of particles at different sizes, hence,
derivations on the velocity vs. radius relationship has been derived from the already-
established electrokinetic phenomena equations related with dielectrophoresis and
viscous drag force.
2.2 Travelling Wave Dielectrophoresis (TWD)
Other component of the dielectrophoretic force causes the travelling wave
dielectrophoresis. The difference between direct and travelling wave
dielectrophoresis (TWD) is that direct dielectrophoresis requires magnitude gradient
in the electric field, whereas TWD is observed under the presence of a phase
26

gradient. Since detailed background is presented in the direct dielectrophoresis
section, this section will only introduce the differences. The common example is the
one-dimensional travelling electric field (Figure 2.4) which is created by parallel
microelectrodes. These electrodes are separated from each other such that there is a
periodic distance, λ, between electrodes of the same phase. Therefore, the phase
gradient is expressed as 2π/λ and induced force on the particle described in the
previous sections is expressed as [13]:
2 R Im fCM E2λ
(2.15)
Note that imaginary of the Clausius-Mossotti factor is limited between -0.75 and
0.75 which exhibits a more balanced distribution when compared with the real part
limitations. It is also obvious that all derivations related with speed are applicable to
this case.
Figure 2.4: Illustration of one dimensional travelling electric field [17]. Since the signals on
each electrode are shifted in time-domain, potential along the channel varies in space-domain
at a certain instant. Therefore, the cell tracks the varying electric field.
27

2.3 Electrorotation
When a dielectric particle is subjected to an electric field, the particle gets polarized
according to the orientation of the electric field. However, due to capacitive effects
polarization of the particle requires a finite time. Consider a rotating electric field
which is generated by means of utilizing a phase-varying non-uniform electric field.
In this case, polarization orientation of the particle tries to follow the electric field
orientation. Note that it lags the electric field with a certain time constant due to
capacitive effects. If the electric field is adjusted to rotate fast enough, the polarized
particle becomes misaligned with the electric field. The tendency of polarized
particle to align itself with the electric field generates a net torque on particles. As a
result, the dielectric particle starts rotating and will indefinitely rotate as long as the
electric field rotates at a higher speed than particle polarization can achieve. This
dielectrophoretic phenomenon is called electrorotation. As a result, electrorotation
can be defined as the rotation of the polarized dielectric particle placed in a rotating
electric field.
In contrast with electrophoresis, torque calculation is required for electrorotation
instead of force calculation. Note that it is due to the rotational movement of the
particles. The mathematical expression for the torque generated by electrorotation,
given in equation (2.16), is directly dependent on the imaginary part of Clausius-
Mossotti factor, Im , in contrast with dielectrophoretic forces depending on real
part, Re .
4 R Im | | (2.16)
It should be noted that there is also a crossover frequency where imaginary part of
the Clausius-Mossotti factor becomes zero. This crossover frequency differentiates
the rotation direction whereas the crossover frequency in real part case differentiates
the movement direction. The rotation will be in the same sense with the rotating
electric field when the actual frequency is below this crossover frequency; however,
it turns opposite when the frequency exceeds this frequency. Considering the viscous
28

drag forces associated with the particle an angular velocity for ROT can be defined
as:
Im | |2
(2.17)
As stated previously, main application of electrorotation is to extract the dielectric
parameters of the particles. Of course, there are also techniques aiming to use
electrorotation directly to manipulate, examine, and differentiate cells [30-32].
2.4 Strategies for Applications of Dielectrophoresis
Since there exists many ways to create a non-uniform electric field to manipulate and
separate particles, there are various strategies reported in the literature. This section
presents the unique features of some popular strategies.
At first glance, it can be observed that creating different electrode configurations is
the most common method to create a non-uniform electric field. Some of the
electrode configurations can be listed as castellated electrodes [33], ratchet electrodes
[34], concentric electrodes [35-37], and quadruple electrodes [38] for DEP; parallel
and spiral electrodes [32] for TWD. These electrode configurations are investigated
below.
2.4.1 Castellated Electrodes
This electrode configuration consists of electrodes which are patterned such that the
distance between electrodes is periodically increasing and decreasing in a square
wave formation. The electric field on the sharp edges of facing electrodes is intenser
than the electric field formed in the inner regions of electrodes. Note that these
electrodes can be placed with an off-set to manipulate the intense electric field
regions. Figure 2.5 shows an example of castellated electrodes for dielectrophoretic
force generation [33].
29

Figure 2.5: Castellated electrodes are utilized to create dielectrophoretic force. Separation of
human metastatic breast cancer (larger cells) from dilute peripheral blood. (A) During initial
collection. (B) During release. (C) Cancer cells remained on the electrode tips after blood
cells had been swept downstream. (D) Close to the outlet only blood cells, in focused bands,
are moving [33].
2.4.2 Ratchet Electrodes
This electrode configuration is patterned such that parallel electrodes are placed into
the microchannel with a constant inclination angle with the wall of the microchannel.
Since the electric field is stronger at the tips of the electrodes with respect to the
regions near to the channel walls, positive DEP particles are confined into the middle
of the channel and using a 3-way exit, these particles can be collected. Figure 2.6
illustrates the mentioned application [34].
30

Figure 2.6: An application of ratchet electrodes which separates cells using three-outlet
system which differentiates focusing and deviating cells under electric field [34].
2.4.3 Concentric Electrodes
This electrode configuration provides a non-uniform electric field in the radial
direction. Considering the electric field equation for coaxial lines, it is evident that
strong electric field is generated around the inner electrode, whereas weak electric
field is observed around outer electrode. This electrode configuration has an
important aspect among the electrode configurations introduced in this section; there
exists no fringe fields on the plane where electrodes are lying. This is due to the
closed geometry of the structure. Unfortunately, this geometry makes the potential
application to the inner electrode using co-planar metal routing very hard. However,
this challenge is overcome by using a vertical wire along the normal line to the
surface which does not cause disturbance in the field distribution in the region of
interest.
Concentric electrode configuration is proposed in this thesis and relevant
publications [35-37]. Figure 2.7 illustrates the concentric electrode configuration to
create non uniform electric field in radial direction.
31

Figure 2.7: Concentric electrode configuration to create non uniform electric field in the
radial direction [17].
2.4.4 Quadruple Electrodes
Quadruple electrode configuration consists of 4 electrodes facing a center point and
each are offset by 90° with respect to each other. Electrodes are biased with
sinusoidal voltages having a phase difference of 180° between the neighbour
electrodes.
Therefore strong electric field is created along the gap between the electrodes and
weak field is created at the center. Figure 2.8 shows an application of quadruple
electrodes for manipulation and orientation of actin-myosin systems [38].
32

Figure 2.8: Quadruple electrodes are utilized to manipulate actin-myosin systems [38]. From
left to right, no field application, distribution under electric field, and fluorescent imaging of
actin-myosin systems are presented.
2.4.5 Parallel Electrodes
This electrode configuration consists of a series of parallel electrodes which are
powered by signal having constant phase difference (Figure 2.9). Common method is
to apply 0°, 90°,180°, 270°, 0°, 90°… cycle. This electrode configuration can be
utilized for both direct dielectrophoresis and travelling wave dielectrophoresis by
adjusting the phases of the applied signals.
Figure 2.9: An illustration presenting how direct and travelling wave dielectrophoresis can
be applied using the same electrode configuration but changing the phases of the applied
potential.
33

2.4.6 Spiral Electrodes
This electrode configuration can be utilized by either rectangular or spherical spiral
electrodes. The structure is the wrapped version of very long parallel electrodes.
Figure 2.10 exhibits a study where malaria infected erythrocytes are concentrated
using 4 electrodes which are biased with 90° phase difference [32].
Figure 2.10: Collection of malaria infected erythrocytes by TWD. (A) Before application of
a travelling electrical field, parasitised cells (arrows) were spread throughout the sample. (B)
Application of four phase signals to the spiral electrode elements caused normal erythrocytes
to be trapped at the electrode edges while parasitised cells were levitated and carried towards
the centre of the spiral by the travelling field [32].
2.4.7 Insulating Obstacles and Deformations on the Channel
Up to now, methods of creating non-uniform electric field by electrode configuration
is presented. Another way of forming a non-uniform electric field is to place
insulating obstacles inside the channel which will disturb the field distribution. The
insulating obstacle can be either inside the channel or at the channel wall. Figure
2.11 presents a study in which an insulating hurdle is constructed between the
34

electrodes to create a non-uniform electric field to separate latex particles and yeast
cells [12].
Figure 2.11: Utilization of an insulating hurdle to create non-uniformity in the electric field
distribution [12].
Creating a non-uniform electric field is the first step to perform dielectrophoretic
separation. However, correct solution and particle decision is another parameter that
defines the separation performance. It should be remarked that it is required to use a
solution which has a different polarizability from the particle at the separation
frequency.
2.5 Techniques of Dielectrophoresis
Some applications of dielectrophoresis has become more popular than others and
created a set of techniques such as field-flow fractionation and multiple frequency
dielectrophoresis.
Field-flow fractionation is a time-domain separation technique that is reported a few
decades ago. It states that application of a field causes separation due to the variation
in the velocities of particles in different regions. Thus particles leave the
microchannel at different speeds, and therefore at different types. For instance, when
35

36
particles are levitated with dielectrophoretic force, the particles at different heights
will move along the channel at different velocities due to parabolic flow profile. Of
course, channel length defines the separation resolution in this technique.
Multiple frequency dielectrophoresis is performed using electric fields at two or
more frequencies [39]. Here, Clausius-Mossotti factor becomes dependent both the
frequency and the location of the particle. Therefore, particles possessing similar
Clausius-Mossotti factors can be separated by changing the effective fCM. This
technique can be utilized to cancel undesired dielectrophoretic traps and trap multiple
groups of cells simultaneously.
CHAPTER 3
3 DESIGN OF THE DIELECTROPHORETIC
PARTICLE SEPARATOR
This chapter focuses on the design of the dielectrophoretic particle separator. In the
proceeding sections, firstly, physical structure of the device is presented. Next,
theoretical explanation of the device is introduced by substituting the specific
geometric formulations of the proposed structure into the governing equations of
dielectrophoresis with emphasis on size based separation. After that, design
parameters and trade-off between these parameters are explained. Finally, finite
element method simulations are performed to validate and optimize the design.
3.1 Physical Structure of the Dielectrophoretic Particle Separator
The physical structure of a dielectrophoretic separator is based on two main
components: the microchannel and the electrodes. Microchannels are utilized such
that injected particles are confined in and separated throughout. Electrodes are the
components which provide the required non-uniform electric field. As stated in
Chapter 1, non-uniform electric field is required to create dielectrophoretic force.
Common way of creating a non-uniform electric field is to adjust the electrode
configuration. Basic method is to place parallel electrodes at different lengths. Thus,
more intense electric field is created at the shorter electrode than the field intensity at
the longer electrode as shown in Figure 3.1.
37

Figure 3.1: Parallel electrode configuration to create non-uniform electric field between
electrodes.
In this study, non-uniform electric field in radial direction is created by means of
concentric electrode configuration. Detailed explanation of the non-uniformity in the
radial direction for this configuration is presented in section 2.3. This electrode
configuration (Figure 3.2) is preferred due to several reasons: First of all, generated
electric field is concentrated between the electrodes. Note that fringe fields are
minimized in the co-planar surface with respect to parallel electrodes.
Figure 3.2: Concentric electrode configuration to form radially non-uniform electric field.
38

Secondly, continuous electric field exposure is possible if particles are placed
between the concentric electrodes; actually, that is the case in this study.
The next step is to define the microchannels in which separation is performed.
Instead of placing straight channels in the radial direction, spiral channel structure
(Figure 3.3) is chosen due to several reasons: Firstly, layout area which will be used
for microchannels is minimized by confining the spiral channels between the
electrodes. On top of that, continuos exposure of electric field along the entire
separation zone is achieved, as mentioned previously.
Figure 3.3: Red lines indicate the spiral channel walls and blue regions define the spiral
channel area.
Final layout of the device is presented in Figure 3.11 in which spiral microchannels
are confined between concentric electrodes. Note that Figure 3.11 just gives an idea
about the top view of the device; however, there is the 3rd dimension which affects
the performance of the device significantly. Therefore, modifications on 3D design
39

play an important role in the evolution of the dielectrophoretic separator. The next
section introduces the modifications on the 3D design of the device.
3.2 Evolution of the 3D Device Design
Using the proposed layout, four different 3D level designs have been developed
throughout the study. The modifications on the design are performed to
• solve the problems encountered in the fabrication,
• overcome the difficulties in the experimentation, and
• improve the performance of the separator.
Note that the design of the structures is initialized with layout drawing which is two-
dimensional design. In fact, the 3rd dimension evolves in the fabrication. Thus, all the
modifications on the 3D design affect the fabrication significantly. Therefore,
fabrication procedures of all four designs are explained in detail in Chapter 4 for the
sake of completeness.
Evolution of the device is mainly based on the electrode placement in 3D since the
major problem in concentric electrode configuration is to reach and bias the center
electrode. First of all, cross junction electrode configuration is performed to bias the
center electrode; next dome shaped center electrode configuration has been
developed to solve the problems encountered in the first design. Thirdly, co-planar
electrodes are proposed, and finally, the co-planar electrodes have evolved to 3D
electrodes.
3.2.1 Design I: Cross Junction Center Electrode
Considering the layout of the device presented in Figure 3.11, a method to bias the
center electrode has been proposed. This method involves a connection to the center
electrode with electrodes having a “+” shape as indicated in Figure 3.4. Note that
40

biasing the outer concentric electrode is simpler since connection to that electrode
does not intersect any other electrode.
Figure 3.4: Illustration of the cross-junction center electrode configuration: (a) top view and
(b) side view.
In this electrode configuration, inner electrode and cross-junction connections are
placed below the outer concentric electrode with an insulator in between them as
depicted in Figure 3.4. Composition of the device is completed with the placement of
the microchannel at the same level as the outer electrode. By keeping the insulator as
thin as possible, amount of the electric field lines confined in the channel is supposed
to be kept at maximum. However, this configuration has a significant problem that
devastates the separation performance. The problem is based on an electrical
phenomenon namely as dielectrophoretic trap. Dielectrophoretic trap occurs when
the dielectric particle goes into a state where it cannot move any further. For
41

instance, a negative DEP particle tends to move electric field minima. Therefore it
moves from more intense electric field region to less intense electric field region.
However, it cannot move any further if the path on the way is again a more intense
electric field region. Note that particle tends to move to the less intense electric field
region between these two more intense electric field regions independent of its
movement direction. As depicted in Figure 3.5, the particle feels the strongest
electric field at the inner and outer electrode junctions although that region is
supposed to be the weakest electric field region according to the design. Moreover,
the particle feels the weakest electric field in the center which is also the inverse of
the proposed design. On top of that, the distribution of the electric field lines between
concentric electrodes is disturbed and deviates a lot from what is supposed to be in
this design. In order to solve the problem, cross junction connections have been
removed and to bias the center electrode, dome shaped back side electrode
configuration is proposed.
Figure 3.5: Weak and strong electric field regions in cross-junction center electrode
configuration.
42

3.2.2 Design II: Dome Shaped Back Side Electrode
Instead of biasing the center electrode directly on the upper surface of the substrate,
back side electrode formation is preferred in this modified design. Note that outer
concentric electrodes are still placed on the upper surface of the substrate. Inner
electrode is formed by shaping the substrate as a dome which reaches its peak at the
center of the device where the center electrode is supposed to be placed. Figure 3.6
illustrates the inner and outer concentric electrodes from both top and bottom views.
As Figure 3.6 presents, the outer electrode and inner electrode are placed on the front
and the back sides of the substrate, respectively.
Figure 3.6: Illustration of the dome shaped back side electrode: (a) top view and (b) bottom
view (c) side view.
43

In this design, placing an insulator between electrodes is not necessary in contrast
with the first design. In fact, since the substrate material is chosen as glass for
fabrication, it works as an insulator between two concentric electrodes to prevent
short-circuit between electrodes. Figure 3.6 depicts the side view of the second
design to provide a clear understanding of the structure.
This design solves the biasing problem for center electrode successfully. However, it
is not the best solution since it has a repeatability problem in fabrication. On top of
that, it has another crucial disadvantage: Electric field lines mainly confine into the
glass layer between the concentric electrodes as illustrated in Figure 3.7, and hence,
only fringe fields are confined into the channel and they are not sufficient to perform
dielectrophoresis in this design.
Figure 3.7: Illustration of the electric field lines for design II. Electric field lines confine into
the glass substrate instead of micro channels, therefore sufficient dielectrophoretic force
cannot be generated inside the channels.
Since this design is performed to separate cells or particles in the order of several
micrometers, the channel will be about 20 micrometers high. Therefore, fringe fields
at a distance like this cannot create dielectrophoretic force which can overcome
viscous drag force and move the particles. This problem is noticed during
experimentation and at first fabrication method is tried to be optimized; however, it
has been shown that, even if the thickness of the layer is minimized, device
performance will not be sufficient by the finite element method simulations run
44

meanwhile. Therefore, this electrode configuration has to be replaced with a better
one since experimentation of these devices yields no successful results. The next
modification aims to confine the electric field lines into the channel as much as
possible.
3.2.3 Design III: Co-planar Electrodes
From previous experience, it becomes evident that electrodes should be placed such
that maximum number of electric field lines can confine into the separation zone,
that is, into the spiral microchannels. The only way to provide this case is to place all
the electrodes and the channel onto the same plane. This idea brings the third design
which employs co-planar electrodes. In this design, inner and outer concentric
electrodes are formed on the same plane and at the same height as a thin film. Then
microchannels are confined between concentric electrodes. Figure 3.8 illustrates the
top view and side view of the third design.
45

Figure 3.8: Illustration of the co-planar electrode configuration: (a) top view and (b) side
view.
This design solves the electric field confinement problem, however, brings the
contact problem to center electrode back. In this case, this contact problem is solved
by taking an external help: probe tip. Using a “Γ” shaped probe tip connected to a
micro manipulator, contact to the center electrode has been achieved. Figure 3.9
explains how the center electrode is biased using an illustration of the side view of
the device. As shown in Figure 3.9, there is a height of “h” between the probe tip’s
side arm and the outer electrode. Since “h” is in the order of tens of millimeters and
the distance between concentric electrodes is in the order of hundreds of
micrometers, it can be ensured that the electric field lines confine into the
microchannel at maximum.
46

Figure 3.9: Illustration of the method to bias the center electrode in co-planar electrode
configuration.
This configuration solves all the previous problems; however, it has a minor
disadvantage: since the electrodes are deposited as thin film metals, they are in the
order of hundreds of nanometers. However, the channel height is in the order of 10-
20 micrometers. Thus, upper portion of the channel contains fringe field lines and
lower portion of the channel contains strong electric field lines. Therefore, another
dielectrophoretic force in the z-axis is created. This force causes the particles to
move either to the floor or ceiling of the channel depending on the dielectric
parameters. Unfortunately, this effect is not desired and cannot be allowed in this
design. The proposed dielectrophoretic separator is to be used in the separation of
polymeric particles and living cells. However, the movement of the particles may be
prevented since polymeric particles and alive cells have tendency to adhere another
polymer which constructs the channel walls, parylene-C.
Therefore, the final modification takes place to remove the non-uniform electric field
distribution in the z-axis throughout the microchannel.
47

3.2.4 Design IV: 3D Electrodes
Final design involves 3D electrodes which are placed in the same plane with the
microchannels. The top view of this design is exactly the same as the third design,
and there is just a slight difference between the side view of the final and the third
design. Again, the contact to the center electrode is provided via external probe tip
usage.As explained in the third design, the height of the electrodes is not comparable
with the height of the microchannel. Thus, in the final design, the heights of the
electrodes and the microchannel have been equalized to get better performance from
the separator. Figure 3.10 introduces the side view of the final design.
Figure 3.10: Illustration of the side view of the 3D electrodes design.
Up to now, conceptual design of the dielectrophoretic separator is presented. In the
next sections, theoretical explanation of the device will be presented with design
parameters.
48

3.3 Theoretical Explanation of the Device
Conceptual design of the dielectrophoretic separator is presented in the preceding
section. This section explains the theoretical analysis of the proposed physical
structure.
Operation of the dielectrophoretic separator is based on the electric field gradient
generated in the radial direction when a potential difference is applied between two
concentric electrodes. Radius of the inner electrode, a, and the inner radius of the
outer electrode affects the magnitude of the electric field indirectly. Considering the
equation (3.1), only the ratio of these parameters affects the electric field magnitude.
On top of that the effect is weakened due to the natural logarithm operation.
Figure 3.11: Design parameters of the spiral dielectrophoretic separator.
Expression of the electric field generated between coaxial lines which have infinite
length is [17]:
E rV
b a⁄ r (3.1)
49

where V is the magnitude of the potential difference applied, r is the distance from
the center of the concentric electrodes, and is the unit vector in the radial
direction. It is evident that this expression is valid only for a < r < b condition.
Another concern is that concentric electrodes, of course, do not have “infinite
length”. However, the formula is still correct for finite length electrodes provided
that electric field lines which are confined into the length of the electrodes are
calculated. Therefore, there is no inconvenience in using this formula for the z-axis
points where thickness of the electrodes is greater. Up to now, an electric field,
which depends on the radial distance travelled, is generated in the radial direction.
As indicated in the previous section, spiral microchannel is confined into the region
between the electrodes. Spiral path originates from initial spiral radius, r , and has a
radius increment, r , per turn. Thus the radius of the path can be written as a
function of angle θ as given below:
r rr2π θ (3.2)
It should be noted that θ is not necessarily to be bounded by 2π, in fact, it is certainly
larger than 2π after a full cycle is completed. “θ” can be considered as the distance
travelled in the angular direction in terms of radians.
Note that radial distance, r, becomes a function of θ with this equation, and therefore,
the electric field generated becomes a function of θ, given by equation (3.3).
E θV
b a⁄ rr2π θ
(3.3)
Finally, the electric field gradient between concentric electrodes is expressed as
shown in the equation (3.4):
50

|E θ |∂E θ
r ∂θ|V |
b a⁄ rr2π θ
rπ
(3.4)
This gradient is a result of a physical transformation which transforms electric field
gradient in the radial direction to angular direction due to spiral geometry. Since
|E θ | is directed in the theta direction, dielectrophoretic force is also directed in
the same sense; however direction can be either clockwise or counter-clockwise
depending on the sign of the Clausius-Mossotti factor. It should also be noted that
force is affected from the geometry parameters in the same sense |E θ | is
affected.
3.4 Design Parameters and Trade-Off
This section presents the limitations on design parameters and how they affect the
performance criteria such as resolution, separation time, and accuracy. Moreover,
trade-offs between these parameters is explained in detail.
Design parameters of the dielectrophoretic particle separator are
• radius of the inner electrode, a,
• inner radius of the outer electrode, b,
• ratio of radii of electrodes, b/a,
• initial spiral radius, r0,
• radius increment per turn, rq,
• channel width, w,
• number of spiral turns, N,
• electrode thickness, t, and
• channel height, h.
51

Radius of the inner electrode (a): This parameter affects the electric field gradient,
and hence, the dielectrophoretic force. To maximize the force, inner electrode radius
should be kept as close as possible to inner radius of the outer electrode radius,
theoretically. In the limiting case, when a=b, the force between electrodes becomes
infinity; however, there exists no space where force can be defined which is
consistent with energy conservation. Still keeping “a” close to “b” maximizes the
force; however, separation zone is reduced. Thus, to increase separation zone
increasing both “a” and “b” in the same scale seems as a solution, but it has a major
drawback. Note that radial distance in electric field equation, r, is measured from the
center of the concentric electrodes. Thus, if radii of both electrodes are increased,
starting value of “r”, in fact “r0” increases intrinsically. This drops down the force
very fast, since force is inversely proportional with r04. As a result, “a” should be
kept as close as possible to “b” and should be kept as small as possible by
considering the area of separation zone.
Inner radius of the outer electrode (b): Mentioned limitations for inner electrode
radius are also valid for this parameter. On top of that, “b” defines the layout area of
a single dielectrophoretic particle separator.
Ratio of radii of electrodes (b/a): As equation (3.4) indicates as “b/a” ratio increases,
the force decreases. Thus, as stated previously, this value should be kept as small as
possible.
Initial spiral radius (r0): This parameter defines the distance from the center of
electrodes to the first point of the wall of the spiral microchannel. As stated in
equation (3.4), r0 should be minimized to maximize the dielectrophoretic force. Thus,
r0 should be kept as close as possible to “a”; however, this cannot be applied due to
practical injection issues. Thus, the distance between “a” and “r0” should be kept as
small as the practical issues allow. This parameter, also, affects the number of turns
with radius increment per turn, “rq”, since spiral microchannel is confined between
“r0” and “b”, practically.
Radius increment per turn (rq): The dielectrophoretic force is inversely proportional
to rq3, thus “rq” should be kept as small as possible. However, as “rq” decreases,
52

number of spiral turns, “N”, increases which also increases the separation time and
distance. Therefore, there is a trade-off between magnitude of force and separation
time for this parameter. Another effect of “rq” is observed in resolution performance.
Since resolution is defined as Δθ for different particles, considering the equation
(3.2) to reach the same Δr value with high Δθ, rq should be kept small. Also, for an
intuitive approach, if rq is kept small, then number of spiral turns between electrodes
increases, thus, particles are exposed to DEP force for a longer time. Since the
difference between particles is small, integration of this small difference over a
longer time provides visible separation.
Channel width (w): This parameter is, in fact, another expression of “rq” with only
one difference: the thickness of wall between adjacent spiral turns. Note that w is
intrinsically smaller than rq. However, since it directly affects the value of “rq”, it is
considered as a design parameter. If “w” is kept small, keeping “rq” small will be
much easier. It can be anticipated that there is a lower limit for “w” which is due to
the particle sizes. Channel width should allow at least a couple of particles to pass
through. On the other hand, “w” should be kept as wide as possible to increase the
effective potential difference across the channel. Considering series-capacitance
modeling of the medium in the channel and channel walls, if channel width is kept
wide, capacitance of the medium decreases, and hence, potential difference increases
across the channel which means effective division of applied voltage.
Number of spiral turns (N): This parameter is not an independent parameter, it
depends on “r0” , “rq”, and “b”. N is almost equal to b r r⁄ , thus selection of
the mentioned parameters defines the number of spiral turns unless spiral is finalized
before reaching the outer electrode. In this case, separation distance is directly
proportional with “N”.
Electrode thickness (t): Electrode thickness defines the maximum height at the
channel where electric field distribution in z-axis is uniform. The necessity of
uniform electric field distribution in z-axis is explained in the following section. The
best case for electrode thickness is the height of the channel; however, due to
fabrication limitations in lithography and electroplating, electrode thickness is kept
smaller than channel height in practice.
53

Channel height (h): This parameter limits the size of the particles which are allowed
to pass through as “w”. It is preferred to have w=h for most cases due to square
cross-section of the channel and symmetric distribution. Previously, it has been
stated that “h” is intrinsically greater than “t”; however it should be considered that if
h>>t , electric field distribution in z-axis will be non-uniform for most of the channel
cross-section area.
In order to observe the results for various combinations of the given design
parameters, design, simulation, and experimentation phases have been performed for
3 sets of devices.
In the following tables ranging from Table 3.1 to Table 3.3, mechanical dimensions
used in the design are summarized with respect to device group. Note that in these
tables parameters are given in micrometers.
Table 3.1: Dimensions of DSC group 1 devices. All dimensions are in micrometers.
Group Name
1
DSC1.1
100
550 300 20
10 10
DSC1.2 18 2
DSC1.3 40 20 20
DSC1.4 900 400 40
20 20
DSC1.5 35 5
54

Table 3.2: Dimensions of DSC group 2 devices. All dimensions are in micrometers.
Group Name
2
DSC2.1
100
1150
400
50 25 25
DSC2.2 45 5
DSC2.3 1200 80
40 40
DSC2.4 75 5
DSC2.5 1700 160
80 80
DSC2.6 150 10
Table 3.3: Dimensions of DSC group 3 devices. All dimensions are in micrometers.
Group Name
3 DSC3.1 200 1100 600 40 20 20
DSC3.2 200 1100 600 40 30 10
This section has presented the design parameters and their dependencies on each
other. The next section describes the advantages proposed with this design.
3.5 Advantages of the Design
As stated in the previous sections, this design has three major advantages:
• Concentric electrode configuration
• Spiral microchannel structure
• 3D electrode structure
55

First of all, the spiral channel geometry with coaxial electrodes enables much longer
separation region with only two electrodes. This is important since as the exposure
time for DEP forces becomes continuous, the effect of any instantaneous force is
minimized, and hence the undesired variations at the output diminish. Also, spiral
channel enables enough time and path for separating particles with close dielectric
parameters or sizes which is equivalent to high resolution. Besides, as the particles
are always in touch with outer walls, affinity separations can also be realized. For
example, an antibody can be coated to the walls of the micro channels and cells
having an affinity to this antibody can be captured, while others continue travelling.
3D electrodes are utilized to provide uniform electric field distribution in the z-axis.
Since different size particles are under concern, it is critical to have uniformity in
electric field distribution in the z-axis. The separation is supposed to be performed
via non-uniform electric field generated in the x-y plane. Electric field line
distributions for both 2D and 3D electrodes cases are illustrated in Figure 3.12:
Figure 3.12: Electric field line distributions for 2D and 3D electrodes where red particles
denote the small particles and green ones denote the larger particles.
56

Figure 3.12 clearly indicates that
• electric field lines (fringe fields) get less concentrated above the electrodes in
co-planar electrode configuration. Thus DEP force is decreased.
• 3D electrode configuration provides uniform force distribution on both
particles.
• if co-planar electrodes are used, mostly fringe fields will be confined into
channels whereas main electric field lines are confined into channels when
3D electrodes are used.
It should also be noted that if co-planar electrodes have been used, dielectrophoretic
force in the z-axis will affect particles which have different sizes at different levels in
magnitude sense, and the dielectrophoretic force created will be less with respect to
3D electrode configuration in the upper portion of the microchannel volume.
3.6 Simulations Based on FEM
Up to this section, analytical explanation of the dielectrophoretic particle separator is
presented. This section presents numerical analysis of the physical structure in terms
of electric field and dielectrophoretic force with the help of a finite element method
simulation tool.
In order to observe the effects of each design parameter, three sets of design have
been simulated via Generalized Electrostatics module of COMSOL 3.4 Multiphysics
by utilization of Lagrange-Quadratic shape functions. Using the dimensions given in
Table 3.1, Table 3.2, and Table 3.3, electric field and gradient of the square of the
electric field of each dielectrophoretic separator are simulated. Simulation results of
a single type are given in this section and the rest is given in the Appendix A.
First of all, all the geometries drawn in Cadence have been imported into COMSOL
3.4 Multiphysics, and then, subdomains are defined. Note that channel walls are
made of parylene-C, and hence, it is defined as dielectric with relative permittivity of
3.10. Buffer solution is defined with relative permittivity of 78.5 and conductivity of
57

1.55 S/m [40]. Next, boundary conditions are set at the electrode boundaries for
voltage application. Finally, the structures have been meshed and solver is run.
First, electric field analysis has been completed with a voltage of 1000 V DC, and
then | | is calculated by writing the following equation in the appropriate script
[41]:
| | ∂
∂x E E∂
∂y E E (3.5)
Electric field analysis is conducted in 2D since there will be a uniform distribution in
the z direction due to 3D electrode geometry. Since other parameters in the force
equation are constant for a defined test environment, checking the pattern and
amplitude of | | is usually sufficient to understand the behavior of the force.
For the device having an inner electrode radius of 100 µm, an outer electrode radius
of 1700 µm, a spiral start radius of 400 µm, a radius increment per turn of 160 µm,
and a channel width of 80 µm, results for |E| and | | are represented in Figure 3.13
and Figure 3.14, respectively. The simulations suggest that, average electric field and
| | values inside the channels are 2.2x10⁴ V/m and 9.6x10¹¹ V/m2, respectively.
It is worthy to note that simulations related with the first three designs have also been
performed. The simulation of the first design shows the dielectrophoretic traps which
causes the particles stop at those points, the second design gives the least electric
field magnitude inside the channels. The simulation of the third one resembles the
final design only for the electrode height. Again, the amplitude of the electric field is
less than the final design as the cross-section height gets closer to the height of the
ceiling of the parylene channel.
58

Figure 3.13: COMSOL 3.4 Multiphysics simulation results for the device possessing the
parameters a=100 µm, b=1700 µm, r0=400 µm, rq=160 µm and a channel width of 80 µm. In
this case, simulation results are limited between 2.05x10⁴ V/m and 2.4x10⁴ V/m to provide
better representation of field distribution inside the channels.
Given these parameters and conditions, 10 µm and 1 µm beads are, theoretically,
expected to move with average speeds of 534.2 µm/s and 5.3 µm/s, respectively.
These values are calculated in accordance with equation (2.12). Simulation results
prove that 1 µm and 10 µm beads can be separated in the proposed structure.
Also, it should be noted that the results deviate too much when irrelevant parts are
included in the analysis. Simulation results and calculations of the average speeds of
1 µm and 10 µm particles for other types of devices are presented in the Appendix A.
59

Figure 3.14: COMSOL 3.4 Multiphysics simulation results for the device possessing the
parameters a=100 µm, b=1700 µm, r0=400 µm, rq=160 µm and a channel width of 80 µm.
Simulation results are limited between 1.00x10¹¹ V2/m3 and 3.00x10¹² V2/m3 to provide
better representation of | | distribution inside the channels.
60

CHAPTER 4
4 FABRICATION AND EXPERIMENTATION OF THE
DIELECTROPHORETIC SEPARATOR
This chapter, firstly, presents the fabrication of the spiral channel dielectrophoretic
separator with concentric 3D electrodes. Then the experimental setup and method are
introduced. Finally, the test results are compared with simulation results and the
discussion on the results are given.
While planning of the fabrication flow of a dielectrophoretic separator,
biocompatibility of the materials and the parameters of the design such as electrode
height, channel width should be considered. Also, electrical and fluidic connections
are also considered during layout creation phase. In this study, fabrication of the
micro channels is performed via suspended parylene channel process which was
developed by Prof. Mastrangelo [42]. Another aspect of fabrication is the gold
electroplating step to increase the height of the electrodes to create a uniform electric
field in the z-direction in the channel as explained in the design chapter. The channel
material, Parylene-C, and the electrode material, gold, are known to be
biocompatible. Moreover, glass wafer is selected as the base material to preserve the
biocompatibility.
After fabrication of the devices with the aforementioned method, the
dielectrophoretic separator has been tested and characterized in terms of output
variation, separation resolution, and accuracy. The tests have been performed using
polystyrene beads at different sizes to prove the size based separation of same type
particles under the influence of dielectrophoretic forces.
61
As a final remark, the test results have been compared with the simulations results,
and it has been shown that there is a good matching between them. Also, the reasons
for the discrepancies have been discussed.
4.1 Fabrication Flow of the Structures
As mentioned previously, four different designs have been implemented. Fabrication
flows of first three designs are explained briefly for the sake of simplicity, and
fabrication flow of the final design is presented in detail.
4.1.1 Fabrication Flow of Design I
The first design is fabricated using 4-inch glass wafers. After BHF treatment of
wafers, Cr/Au metallization and related photolithography step is performed to form
the inner electrodes. After patterning the inner electrodes, a very thin Parylene-C
layer is deposited on top the first metal in order to insulate inner and outer electrodes
from each other. Next, second metallization and corresponding photolithography step
is performed to create the Cr/Au outer electrodes. These two metallizations are
performed using magnetron sputtering system. Then, channel forming lithography
using thick photoresist is performed to pattern the channel volume. The channel
material has been chosen as Parylene-C due to aforementioned properties. By
deposition of parylene, the micro channels have been formed. Next steps aim to open
up reservoirs and metal pad contacts. Therefore, a photolithography step with very
thick photoresist has been performed to define the regions where reservoirs and
contact pads are located. To etch the parylene-C at these regions, reactive ion etching
has been performed. Finally, the channels are released using acetone, isopropanol,
and methanol rinse cycle. Figure 4.1 illustrates the entire fabrication flow.
62

Figure 4.1: Fabrication flow of design I.
63

4.1.2 Fabrication Flow of Design II
The second fabrication flow is initialized with Cr/Au metallization of both sides of a
4-inch glass wafer. The metallization on the back side of the wafer is patterned to
etch the glass wafer to create the surface for inner concentric electrode; however, the
metallization on the front side has not been patterned at this step to prevent etching
of glass from the front side. After etching of glass from backside with HF, the
metallization at the back side has been stripped off. Since it has floating regions due
to the undercuts formed during HF etching, this strip step has been performed.
During removal of back side Cr/Au, the metallization on the front side has been
protected by photoresist coating prior to metal etch. Next, metallization on the front
side has been patterned to create the outer concentric electrodes. After that,
metallization of back side of the wafer has been performed via sputtering, and hence
inner concentric electrodes have been performed. The next steps constitute the
formation of parylene suspended channels. After definition of channel volume with
thick photoresist, parylene-C is deposited using chemical vapor deposition method.
Then, definition of regions where fluidic openings and electrical contacts are located
is performed by photolithography step which utilizes very thick photoresist. Reactive
ion etching of parylene opens the mentioned contact and opening regions. Finally,
the channels are released using acetone, isopropanol, and methanol rinse cycle.
Figure 4.2 illustrates the entire fabrication flow of design II.
Figure 4.2: Fabrication flow of design II.
64
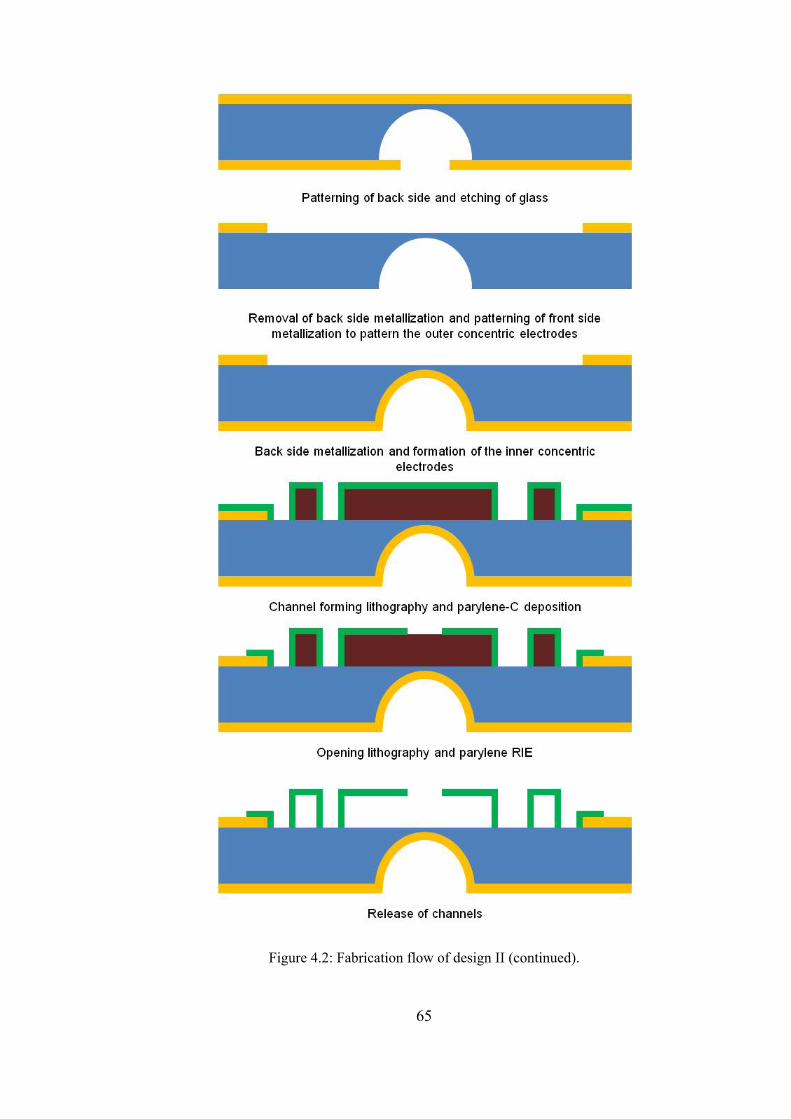
Figure 4.2: Fabrication flow of design II (continued).
65

4.1.3 Fabrication Flow of Design III
The third fabrication is also performed using 4-inch glass wafers and utilizing 3
masks. The first step is the Cr/Au metallization of glass wafers after BHF treatment.
Photolithography to pattern the concentric electrodes has been performed and Cr/Au
has been etched accordingly. Therefore, electrode formation is completed with this
first step. Next step is to define the channel volume using a thick photoresist. After
forming the channel volume with thick photoresist, parylene-C deposition is
performed to create the channel structure. Then, opening lithography to pattern the
reservoirs and contact pads has been performed. Finally, reactive ion etching of
parylene has been completed to open the fluidic openings and electrical contacts. To
prepare the devices for testing, release of channels are performed with acetone,
ispropanol, and methanol rinse cycle. Figure 4.3 illustrates the entire fabrication flow
for design III.
66

Figure 4.3: Fabrication flow of design III.
67

4.1.4 Fabrication Flow of Design IV
4-inch glass wafers are cleaned in piranha solution (H2SO4:H2O2, 1:1) prior to
processing to remove organic residues. In this fabrication flow, glass wafer is
preferred due to its transparency and electrical insulation. Then, buffered
hydrofluoric acid (BHF) (NH4F:HF, 7:1) has been applied to the glass wafers for 1
minute to roughen the surface, and hence, to improve the adhesion quality of
deposited metals. Note that roughness created on the glass wafer is just in the order
of a few nanometers. Gold has been chosen as the electrode material since it is a
noble metal which possesses a resistance to oxidation and corrosion. It should be
anticipated that, during tests, buffer solutions containing water and ions will be in
touch with the electrode. However, direct deposition of gold onto glass does not
provide the required adhesion, especially after etching. Thus, it is decided to employ
chromium as the adhesion layer. Therefore, chromium (Cr) and gold (Au) layers with
25 nm and 200 nm thicknesses have been deposited by sputtering (BESTEC
Magnetron Sputtering), respectively.
Thicknesses are optimized such that chromium is deposited at the lowest thickness at
which sputter can preserve uniformity and gold is deposited at the thickness which
creates acceptable resistance values during gold electroplating to create 3D
electrodes. Before performing gold electroplating, gold seed layer is patterned to
eliminate the necessity of gold etching after gold electroplating which requires a new
mask. To define the pattern which will be protected during gold etch, lithography is
performed with AZ® 5214E Image Reversal Photoresist (MicroChemicals GmbH)
[43]. AZ® 5214E is a very special photoresist which is capable of image reversal.
Exposed areas may be selectively cross-linked by applying a bake cycle after
exposure. A flood exposure before development converts unexposed areas soluble,
resulting in a negative tone image which provides the patterning of gold seed layer
with the same mask used for electroplating molding. After development of
photoresist, gold has been shaped using commercial gold etchant (Transene) in 120
seconds to pattern the seed layer required to form electroplated concentric electrodes.
68

Next step is the preparation of the wafer for gold electroplating. First of all, patterned
photoresist is stripped off using PRS-2000 Stripper (Baker) at 70°C for 20 minutes.
Then, AZ® 9260 lithography has been performed to generate the electroplating mold.
Photoresist height is measured as 9 µm. Since expected height of the electroplating is
about 7 µm, the measured thickness is sufficient to perform uniform electroplating,
otherwise electroplated gold will take the shape of a mushroom. Gold electroplating
process has been performed using gold cyanide solution at 32°C (FIBRoplate
process) to create 3D electrodes. After stripping the photoresist, heights of the
electrodes are measured using Veeco Optical Surface Profiler and the thicknesses are
found to be 7±0.5 µm.
Next, chromium adhesion layer between gold and glass has been etched in 60
seconds by using commercial chromium etchant (Transene) which is followed by
dipping the wafer into 2% H2SO4 solution for 30 seconds to remove the Cr etchant
resiudes from the surface of the wafer.
Up to now, 3D concentric electrodes are fabricated. Next step is to create the spiral
micro channels. To fabricate microchannels, suspended parylene channel process is
used. Parylene microchannel fabrication technology by releasing sacrificial
photoresist has been developed by Prof. Carlos H. Mastrangelo [42]. In this process
flow, firstly the volume of the channel is defined, secondly wall of the channel is
created by parylene deposition, thirdly openings are created on parylene, and finally
photoresist which defines the channel is stripped to release the channel. In this study,
channel volume has been created with 16 µm thick AZ® 9260 photoresist.
Channel walls have been formed by 20 µm thick Parylene-C deposition using SCS
2010 Parylene Deposition System with 40 g Parylene-C dimer (SCS) onto AZ® 9260
photoresist layer. Before parylene deposition, a dicing tape is stick to the bottom of
the wafer to prevent deposition of parylene on bottom surface since the deposition
process is based on chemical vapor deposition. After that, the reservoir and electrode
openings have been defined with AZ® 9260 lithography. Reservoir and electrode
openings on parylene channels have been realized by Reactive Ion Etching (RIE,
STS) in 90 minutes. Etching is performed in three cycles in order to reduce the
thermal effects occurring due to the low temperature conductivity of glass.
69

After dicing, the sacrificial photoresist defining microfluidic channels are released by
sequentially exposing devices to acetone (J.T. Baker), isopropanol (J.T. Baker), and
methanol (J.T. Baker) for 6 hours, 30 minutes, and 10 minutes, respectively. Next,
dies are dried on 70°C hotplate during 2 minutes. Fabrication flow of design IV is
illustrated in Figure 4.4, and Figure 4.5 shows the fabricated DEP devices.
As an alternative fabrication flow, PDMS can be utilized instead of Parylene-C to
form the structural material for the channel layer. It is obvious that this alteration will
reduce the cost and remove the necessity for high-class clean room environment
during the microfabrication. However, since the ultimate goal for this study is to
integrate DEP separator onto a lab-on-a-chip, Parylene-C is preferable since further
fabrication steps (e.g. deposition) can be performed.
70

Figure 4.4: Fabrication flow of design IV.
71

Figure 4.5: Fabricated dielectrophoretic separators. (a) Wafer level devices with dicing, (b) a
single device containing three identical spirals, (c) optical microscope image of a single
spiral device.
72

4.2 Experimental Setup
The experimental setup was constructed for performing dielectrophoresis with high
voltages and fluorescence based detection of the separation process. Online
monitoring of the dielectrophoresis application was performed using Olympus
SZX12 stereo microscope with fluorescence attachment. The attachment has a 100
W mercury lamp for illumination. For monitoring of the process, a high resolution
digital camera, Olympus DP70, which was directly connected to a computer, was
used. For the illumination and monitoring, a filter set with 460 nm band-pass
excitation filter, 495 nm long-pass emission filter, and 485 nm long-pass dichromatic
mirror was placed into the microscope. A high voltage DC supply is used for voltage
application. The test setup is illustrated in Figure 4.6 and the final experimentation
setup is given in Figure 4.7.
Figure 4.6: Illustration of test setup prepared to perform high voltage DC dielectrophoresis
and monitoring of the moving particles using a CCD camera mounted microscope with
fluorescent attachment.
73

The devices are placed on a custom designed package for electrical interfacing. Also
a micromanipulator to contact the probe tip to inner electrode is prepared and wired.
Voltage supply is connected to device inputs via the package electrodes and probe
tip. In order to prevent the excessive drying due to high electrical voltage and optical
illumination, humidity of the environment is kept constant at a sufficient level. This
is achieved by placing the chip holder into a petri-dish which has a DI water
reservoir and an opening to allow the electrical connections. The vapor pressure of
the DI-water keeps the humidity of the environment in the required levels. Note that
the external equipment needed for device operation can be found in any biomedical
laboratory.
Figure 4.7: Test setup used for performing high voltage DC dielectrophoresis tests using a
fluorescent microscope with a CCD camera for online monitoring.
74

4.3 Experimental Method (DC Dielectrophoresis)
The experimental procedure is as follows: Phosphate Buffered Saline (PBS) is first
loaded into channels by placing a droplet on central opening of the devices. Then, the
capillary action is enough to fill the microfluidic channels in a few seconds. After
that, a DC voltage of 1000 V is applied to stabilize the electrokinetic effects on the
flow. The expected electric field amplitude inside the channels is around 2.2x10⁴
V/m for the DSC2.5 type device (Table 2.2). It has been previously shown that this
value of electric field is enough for dielectrophoretic forces to overcome
electroosmotic flows induced by DC voltage application [21]. For testing purposes
Fluoresbrite® YG Microspheres 10.0 µm, Polysciences Inc. and Polybead®
Polystyrene Red Dyed Microsphere 1.00 µm, Polysciences Inc. are loaded into the
center reservoir using a Hamilton microliter syringe.
To observe the movement of particles, fluorescence shutter is opened and the video
recorder is turned on. Video is recorded with 25 frames per second (FPS) and
processed using Particle Tracker plugin of ImageJ, an open source software [44].
Speed values for each experiment are calculated by processing approximately 125
frames which correspond to 5 seconds. It can be inferred that time required for 1 µm
polystyrene beads reaching the end point is around 2500 seconds, which corresponds
to approximately 40 minutes. A typical snapshot of the recorded video is shown in
Figure 4.8.
75

Figure 4.8: A typical snapshot of the recorded video.
4.4 Test Results and Discussions
Expected Results: In this experimental study, by using DC electric fields, size based
separation is aimed. This is due to the fact that in the lower frequency limit
approaching to DC, Re(fCM) approaches -0.5 for polystyrene particles [45]. Hence,
by equation (2.12) we can estimate that the speed for experiment parameters given in
section 3.6 (or the travelled distance per given time) should be proportional to R2.
For 1 µm and 10 µm diameter particles used within the same device, the speed ratio
should be 1:100 which is consistent with simulation results. Note that for 1 µm and
10 µm beads simulated speeds are found to be 5.3 µm/s and 534.2 µm/s,
respectively.
Experimental Data: Figure 4.9 shows a comparative histogram of extracted speeds
of 1 µm and 10 µm, where data bars show the number of bead counts for given speed
interval and the straight lines show the best Gaussian fits for normalized amplitude.
76

Data indicates that 1 µm particles have an average speed of 4.57 µm/s with a
standard deviation of 1.06 µm/s, and 10 µm particles have an average speed of 544
µm/s with a standard deviation of 105 µm/s. There is a -14% and +2% deviation
from the simulation results for 1 µm and 10 µm beads, respectively. Moreover, DEP
devices with planar electrodes have been tested; however, it is observed that electric
field gradient is not sufficient to perform a separation.
Output Variation: Using the experimental data, the coefficient of variation for the
speed for 1 µm and 10 µm beads can be calculated as 23% and 19%, respectively. On
the other hand, microparticles have also some size variation due to production. The
reported size variation by the supplier is 3% and 10%, which corresponds to a speed
variation of 6% and 21% for 1 µm and 10 µm particles, respectively. While expected
and recorded variations greatly overlap for 10 µm size particles, there is a
considerably big discrepancy between expected and recorded parameters in the case
of 1 µm size particles. This can be attributed to difference of Brownian Force acting
on the particles. The Brownian motion greatly increases the speed-spread in 1 µm
case; however, for 10 µm particles there is no significant effect of the Brownian
Force. Hence, for the worst case of 1 µm beads, it can be inferred that the output
speed variation is 20%, corresponding to a size variation of 10%.
Quantization Resolution: To define the resolution, the worst case of output
variation, that is, the 1 µm bead experimental results, is taken into account. The
device has shown around 20% coefficient of variation in speed, which can be
assumed as a standard deviation of the speed introduced by device. It is defined that
two successive peaks (Figure 4.9) are discriminable if they are approximately 2
standard deviations apart. This definition can be interpreted as two different size
beads with radii R1 and R2 are discriminable under proposed experimental condition
if R1 ≤ 0.81 R2 or equivalently 1.21 R1 ≥ R2.
Accuracy: While the actual size ratio of the input beads are 1:10, the device output
suggests that the speed ratio is 1:119, corresponding to a 1:10.9 size ratio. Hence, the
accuracy of size extraction from experimental data within 1 µm to 10 µm range can
be calculated as ±10%.
77

The devices other than DSC2.5 type device haven’t provided consistent speed
information; therefore, only comparison of test results and simulation results of
DSC2.5 device is presented. Possible reasons for failure in the remaining devices are
insufficient force due to less | | , adhesion of polymeric beads to the channel
walls, capacitive sharing of applied voltage between channel walls and medium, and
therefore inefficient voltage usage.
Consequently, here, a direct dielectrophoretic device with reduced operational cost
and complexity and moderate separation accuracy and resolution is presented. This is
primarily achieved by spiral channel architecture with coaxial electrodes keeping the
device footprint minimum, while keeping the functional separation length maximum,
and, hence, decreasing the costs. This architecture also proportionally decreases the
other instantaneous effects while keeping enough channel length for distinguishing
close parameter particles. Next, injection of the sample fluid to the channels by
capillary action eliminates the need for external fluidic equipment and
interconnections. The proposed device also capable of working with single power
supply, which has also was become common laboratory equipment due to gel-
electrophoresis kits. The experiments have shown moderate device performance
with 10% accuracy and 20% of radius resolution with a simple stereo microscope.
78

Figure 4.9: Comparative histogram of extracted speeds of 1 µm and 10 µm beads, where data
bars show the number of bead counts for given speed interval and the straight lines show the
best Gaussian fits for normalized amplitude. Please note the break in the horizontal axis.
79

CHAPTER 5
5 CONCLUSIONS AND FUTURE RESEARCH
OBJECTIVES
In this thesis, design, simulation, fabrication, and experimentation of a novel
dielectrophoretic particle separation system have been performed. A direct
dielectrophoresis based particle separation device capable of producing versatile
chromatograms is developed. Device is novel with spiral channels and concentric
electrodes, and requires only external voltage supplies for operation.
Separation techniques in the literature have been investigated, and methods are
compared to each other in terms of practical applications. As a result, direct
dielectrophoresis, which is an electrical separation method, has been chosen to be
applied. Dielectrophoresis is a method which works with neutral particles under AC
and DC voltages independent of voltage polarity. Thus, various separations become
possible due to its versatile nature.
After examining the theory of dielectrophoresis deeply, requirements and expected
results are defined for particle separation applications. Depending on these
parameters, designs reported in the literature have been examined and advantages
and disadvantages of these designs have been extracted. On this theoretical
background a design has been initialized and verified using simulation tools utilizing
finite element method. The first design, of course, has some disabilities; therefore,
successive modifications have been performed on the first draft. Finally, a design
80

overcoming dielectrophoretic traps, fabrication related problems, testing problems
has been proposed.
The final device is fabricated using parylene suspended channel process with 3D
electrode geometries. Process developed for dielectrophoretic spiral chromatography
requires just 3 masks. Various process steps are optimized and possible problems
regarding fabrication are discussed. Fabricated devices are ready to use without
additional post-processing such as surface coating or labeling protocols.
Dielectrophoretic particle separator requires a simple test setup consisting of a power
supply and a microscope connected to a PC to record the experimentation on-line.
Experimentation procedure has been introduced step-by-step in order to generate
repeatable experiments in the future. During the experimentation satisfactory results
have been achieved and discussions on separation performance based on resolution
and accuracy have been presented. Moreover, simulation results have been compared
with experimental results, and a great matching has been observed.
Up to now, what has been performed and achieved is introduced. Of course, it has
related future works as all scientific studies. Future works concentrate on the
optimization of the device design with respect to the difficulties during testing,
optimization of experimentation, and conducting extensive tests for different cell
samples to observe which biological agents are suitable for separation in this device.
Design should be modified to allow standard fluidic connections and to enhance the
dielectrophoretic force. Note that basic method to enhance the force is to decrease
the radius of the inner electrode, however, it directly causes resolution problems due
to shorter separation distance, and therefore there is a trade-off that should be
considered while enhancing the dielectrophoretic force. For the experimentation
phase, buffer solutions employed should be optimized such that neither the
dielectrophoretic force nor the living cells is affected negatively. As the ultimate
goal, an electrical detection system should be integrated such that dielectrophoretic
particle separation device will be a stand-alone portable device.
81

82
This chapter has explained the checkpoints reached in this thesis study and the
targets to be reached have been set. Another aspect of this chapter is to explain the
values added to the literature and possible practical applications of the proposed
dielectrophoretic particle separator.
First of all, the design concept of spiral microchannels confined between concentric
electrodes is introduced. With this design a method to convert radial electric field
gradient into theta direction has been developed and regarding scientific articles have
been published. On top of that using 3D electrodes in the design, non-uniformity in
the xy-plane and uniformity in the z-axis have been achieved in terms of electric
field. This development has added a new fabrication method into the inventory of
METU BioMEMS Research Group.
As mentioned previously, proposed dielectrophoretic particle separator is aimed to be
employed in clinical applications. Since all the materials that will be in touch with
biological agents are biocompatible, there are various application areas for the
fabricated devices. Here, some of them are introduced. First of all, separation of
blood cells is used widely in the diagnosis of almost all illnesses. Moreover
separation of sub-populations of a certain blood cell such as lymphocytes is crucial in
differential diagnosis.
Another application area is to separate fertilizable and non-fertilizible eggs by means
of the differences in cytoplasmic conductivities, and hence, the differences in
Clausius-Mossotti factors. Finally, dielectrophoresis is utilized in separation of dead
and alive cells from each other. This application is commonly useful in primary tests
of new generated drugs on certain cell cultures which reveal the side effects of the
drug on alive cells.

REFERENCES
[1] K. C. Cheung and P. Renaud, "BioMEMS in medicine: Diagnostic and therapeutic systems," Proceedings of Essderc 2005: 35th European Solid-State Device Research Conference, pp. 345-350,2005.
[2] M. Bao, Analysis and Design Principles of MEMS devices, 2005.
[3] R. Bashir, An Introduction to BioMEMS and Bionanotechnology, 2005.
[4] N. Pamme, "Continuous flow separations in microfluidic devices," Lab on a Chip, vol. 7, pp. 1644-1659, 2007.
[5] M. Kersaudy-Kerhoas, et al., "Recent advances in microparticle continuous separation," IET Nanobiotechnology, vol. 2, pp. 1-13, Mar 2008.
[6] T. Laurell, et al., "Chip integrated strategies for acoustic separation and manipulation of cells and particles," Chemical Society Reviews, vol. 36, pp. 492-506, 2007.
[7] J. J. Shi, et al., "Continuous particle separation in a microfluidic channel via standing surface acoustic waves (SSAW)," Lab on a Chip, vol. 9, pp. 3354-3359, 2009.
[8] K. Smistrup, et al., "Magnetic separation in microfluidic systems using microfabricated electromagnets-experiments and simulations," Journal of Magnetism and Magnetic Materials, vol. 293, pp. 597-604, May 2005.
[9] N. Xia, et al., "Combined microfluidic-micromagnetic separation of living cells in continuous flow," Biomedical Microdevices, vol. 8, pp. 299-308, Dec 2006.
[10] M. Prince, et al., "The development of a novel Bio-MEMS filtration chip for the separation of specific cells in fluid suspension," Proceedings of the Institution of Mechanical Engineers Part H-Journal of Engineering in Medicine, vol. 221, pp. 113-128, Feb 2007.
[11] X. Cheng, et al., "Cell detection and counting through cell lysate impedance spectroscopy in microfluidic devices," Lab on a Chip, vol. 7, pp. 746-755, Jun 2007.
[12] B. Cetin, "Microfluidic Continuous Separation of Particles and Cells by AC-Dielectrophoresis," PhD, August 2009.
[13] T. B. Jones, "Basic theory of dielectrophoresis and electrorotation," IEEE Engineering in Medicine and Biology Magazine, vol. 22, pp. 33-42, Nov-Dec 2003.
83

[14] S. Sukas, et al., "A parylene-based dual channel micro-electrophoresis system for rapid mutation detection via heteroduplex analysis," Electrophoresis, vol. 29, pp. 3752-3758, Sep 2008.
[15] K. L. Chan, et al., "Cellular characterisation and separation: Dielectrophoretically Activated Cell Sorting (DACS)," Proceedings of the 20th Annual International Conference of the IEEE Engineering in Medicine and Biology Society, vol. 20 , pp. 2953-2956,1998.
[16] K. Kaler and H. A. Pohl, "Continuous Biological Cell Separation Using Dielectrophoresis," Bulletin of the American Physical Society, vol. 23, pp. 285-285, 1978.
[17] A. T. Ciftlik, "Design and implementation of a dielectrophoretic separator and a gravimetric detector for mems based cytometry applications," MSc, METU, 2008.
[18] E. G. Cen, et al., "A combined dielectrophoresis, traveling wave dielectrophoresis and electrorotation microchip for the manipulation and characterization of human malignant cells," Journal of Microbiological Methods, vol. 58, pp. 387-401, Sep 2004.
[19] H. Morgan, et al., "Large-area travelling-wave dielectrophoresis particle separator," Journal of Micromechanics and Microengineering, vol. 7, pp. 65-70, Jun 1997.
[20] J. Gimsa, et al., "Dielectrophoresis and Electrorotation of Neurospora Slime and Murine Myeloma Cells," Biophysical Journal, vol. 60, pp. 749-760, Oct 1991.
[21] E. B. Cummings and A. K. Singh, "Dielectrophoresis in microchips containing arrays of insulating posts: Theoretical and experimental results," Analytical Chemistry, vol. 75, pp. 4724-4731, Sep 2003.
[22] C. Iliescu, et al., "Dielectrophoretic separation of biological samples in a 3D filtering chip," Journal of Micromechanics and Microengineering, vol. 17, pp. S128-S136, Jul 2007.
[23] P. Y. Chiou, et al., "Massively parallel manipulation of single cells and microparticles using optical images," Nature, vol. 436, pp. 370-372, Jul 2005.
[24] C. H. Kua, et al., "Dynamic cell fractionation and transportation using moving dielectrophoresis," Analytical Chemistry, vol. 79, pp. 6975-6987, Sep 2007.
[25] M. Cristofanilli, et al., "Automated electrorotation to reveal dielectric variations related to HER-2/neu overexpression in MCF-7 sublines," Clinical Cancer Research, vol. 8, pp. 615-619, Feb 2002.
[26] J. Yang, et al., "Dielectric properties of human leukocyte subpopulations determined by electrorotation as a cell separation criterion," Biophysical Journal, vol. 76, pp. 3307-3314, Jun 1999.
[27] T. B. Jones, Electromechanics of Particles: Cambridge University Press, 1995.
84

[28] C. P. Jen, et al., "Hydrodynamic separation of cells utilizing insulator-based dielectrophoresis," Microsystem Technologies-Micro-and Nanosystems-Information Storage and Processing Systems, vol. 16, pp. 1097-1104, Jul 2010.
[29] P. R. C. Gascoyne and J. V. Vykoukal, "Dielectrophoresis-based sample handling in general-purpose programmable diagnostic instruments," Proceedings of the IEEE, vol. 92, pp. 22-42, Jan 2004.
[30] J. Voldman, et al., "Holding forces of single-particle dielectrophoretic traps," Biophysical Journal, vol. 80, pp. 531-541, Jan 2001.
[31] J. A. Schwartz, et al., "Droplet-based chemistry on a programmable micro-chip," Lab on a Chip, vol. 4, pp. 11-17, 2004.
[32] P. Gascoyne, et al., "Microsample preparation by dielectrophoresis: isolation of malaria," Lab on a Chip, vol. 2, pp. 70-75, 2002.
[33] F. F. Becker, et al., "Separation of human breast-cancer cells from blood by differential dielectric affinity," Proceedings of the National Academy of Sciences of the United States of America, vol. 92, pp. 860-864, Jan 1995.
[34] X. Y. Hu, et al., "Marker-specific sorting of rare cells using dielectrophoresis," Proceedings of the National Academy of Sciences of the United States of America, vol. 102, pp. 15757-15761, Nov 2005.
[35] G. Yilmaz, et al., "A dielectrophoretic cell/particle separator fabricated by spiral channels and concentric gold electrodes," Solid-State Sensors, Actuators and Microsystems Conference (TRANSDUCERS) 2009, pp. 73-76, 2009.
[36] G. Yilmaz, et al., "Charged particle/cell manipulation in spiral microchannels with concentric electrodes," 15th National Biomedical Engineering Meeting (BIYOMUT) 2010, pp. 1-4, 2010.
[37] G. Yilmaz, et al., "A MEMS-based spiral channel dielectrophoretic chromatography system for cytometry applications," Biotechnology Journal, doi:10.1002/biot.201000204, 2010.
[38] S. B. Asokan, et al., "Two-dimensional manipulation and orientation of actin-myosin systems with dielectrophoresis," Nano Letters, vol. 3, pp. 431-437, Apr 2003.
[39] N. Demierre, "Continuous-flow separation of cells in a lab-on-a-chip using "liquid electrodes" and multiple frequency dielectrophoresis," PhD, EPFL, 2008.
[40] S. Park, et al., "Particle Trapping in High-Conductivity Media with Electrothermally Enhanced Negative Dielectrophoresis," Analytical Chemistry, vol. 81, pp. 2303-2310, Mar 2009.
[41] C. H. Kua, et al., "Modeling of dielectrophoretic force for moving dielectrophoresis electrodes," Journal of Electrostatics, vol. 66, pp. 514-525, Sep 2008.
85

86
[42] J. R. Webster, et al., "Electrophoresis system with integrated on-chip fluorescence detection," in The Thirteenth Annual International Conference on Micro Electro Mechanical Systems (MEMS, pp. 306-310,2000.
[43] Microchemicals. November 01, 2010. Image Reversal Photoresists. Available: http://www.microchemicals.com/photoresist/photoresist_image_reversal_resists_eng.html
[44] I. F. Sbalzarini and P. Koumoutsakos, "Feature point tracking and trajectory analysis for video imaging in cell biology," Journal of Structural Biology, vol. 151, pp. 182-195, Aug 2005.
[45] P. R. C. Gascoyne and J. Vykoukal, "Particle separation by dielectrophoresis," Electrophoresis, vol. 23, pp. 1973-1983, Jul 2002.
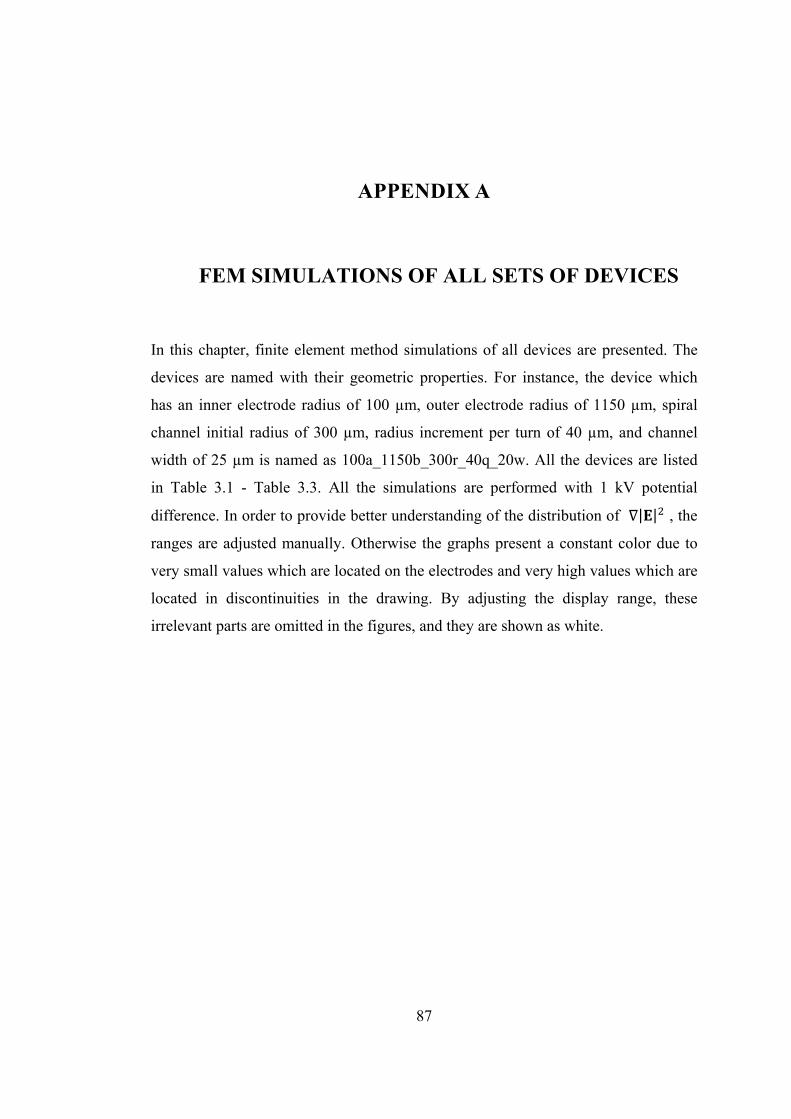
APPENDIX A
A. FEM SIMULATIONS OF ALL SETS OF DEVICES
In this chapter, finite element method simulations of all devices are presented. The
devices are named with their geometric properties. For instance, the device which
has an inner electrode radius of 100 µm, outer electrode radius of 1150 µm, spiral
channel initial radius of 300 µm, radius increment per turn of 40 µm, and channel
width of 25 µm is named as 100a_1150b_300r_40q_20w. All the devices are listed
in Table 3.1 - Table 3.3. All the simulations are performed with 1 kV potential
difference. In order to provide better understanding of the distribution of | | , the
ranges are adjusted manually. Otherwise the graphs present a constant color due to
very small values which are located on the electrodes and very high values which are
located in discontinuities in the drawing. By adjusting the display range, these
irrelevant parts are omitted in the figures, and they are shown as white.
87

88
Figure A.1: | | distribution of the device 100a_550b_300r_20q_10w.
Figure A.2: | | distribution of the device 100a_550b_300r_20q_18w.

Figure A.3: | | distribution of the device 100a_550b_300r_40q_20w.
Figure A.4: | | distribution of the device 100a_900b_400r_40q_20w.
89

Figure A.5: | | distribution of the device 100a_900b_400r_40q_35w.
Figure A.6: | | distribution of the device 100a_1150b_400r_50q_25w.
90

Figure A.7: | | distribution of the device 100a_1150b_400r_50q_45w.
Figure A.8: | | distribution of the device 100a_1200b_400r_80q_40w.
91

Figure A.9: | | distribution of the device 100a_1200b_400r_80q_75w.
Figure A.10: | | distribution of the device 100a_1700b_400r_160q_150w.
92
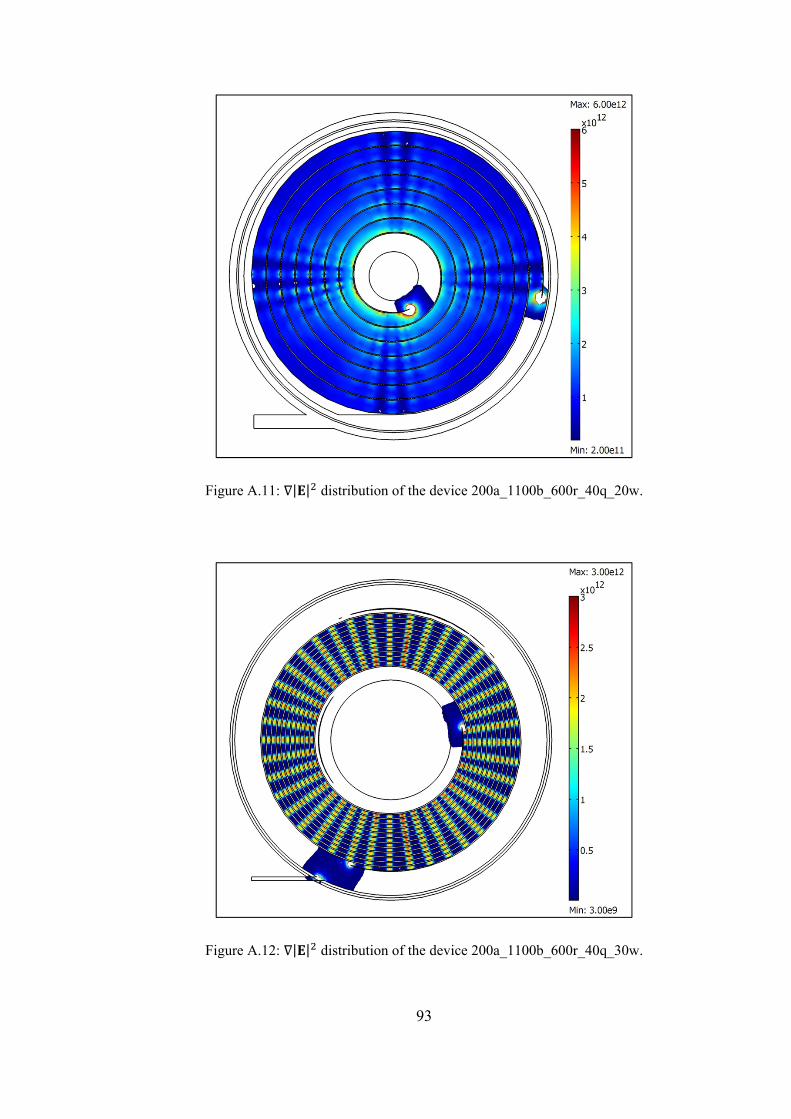
Figure A.11: | | distribution of the device 200a_1100b_600r_40q_20w.
93
Figure A.12: | | distribution of the device 200a_1100b_600r_40q_30w.