design and development of higher temperature membranes for
TRANSCRIPT

Design and Development of Higher Temperature Membranes for PEM Fuel Cells
By
TONY M. THAMPAN
A Dissertation
Submitted to the Faculty
Of the
WORCESTER POLYTECHNIC INSTITUTE
In partial fulfillment of the requirements for the
Degree of Doctor of Philosophy
Chemical Engineering
By
_________________________
MAY 2003
APPROVED:
____________________________________
PROF. RAVINDRA DATTA, MAJOR ADVISOR
HEAD OF DEPARTMENT
____________________________________
PROF. SATYA S. SHIVKUMAR, COMMITTEE MEMBER
____________________________________
PROF. ROBERT W. THOMPSON, COMMITTEE MEMBER

i
Abstract
Proton-Exchange Membrane (PEM) fuel cells are extremely attractive for
replacing internal combustion engines in the next generation of automobiles. However,
two major technical challenges remain to be resolved before PEM fuel cells become
commercially successful. The first issue is that CO, produced in trace amounts in fuel
reformer, severely limits the performance of the conventional platinum-based PEM fuel
cell. A possible solution to the CO poisoning is higher temperature operation, as the CO
adsorption and oxidation overpotential decrease considerably with increasing
temperature. However, the process temperature is limited in atmospheric fuel cells
because water is critical for high conductivity in the standard PEM. An increase in
operating pressure allows higher temperature operation, although at the expense of
parasitic power for the compressor. Further the conventional PEM, Nafion®, is limited to
120°C due to it’s low glass transition temperature.
Thus, the design of higher temperature PEMs with stable performance under low
relative humidity (RH) conditions is considered based on a proton transport model for the
PEM and a fuel cell model that have been developed. These predictive models capture
the significant aspects of the experimental results with a minimum number of fitted
parameters and provides insight into the design of higher temperature PEMs operating at
low RH.
The design of an efficacious high temperature, low RH, PEM was based on
enhancing the acidity and water sorption properties of a conventional PEM by
impregnating it with a solid superacid. A systematic investigation of the composite
Nafion®/inorganic PEMs comprising experiments involving water uptake, ion-exchange
capacity (IEC), conductivity and fuel cell polarization is presented in the work. The most
promising composite is the nano-structured ZrO2/Nafion® PEM which exhibits an
increase in the IEC, a 40% increase in water sorbed and a resulting 24% conductivity
enhancement vs. unmodified Nafion® 112 at 120°C and at RH < 40%.

ii
Acknowledgements
I would like to thank Professor Ravindra Datta for the opportunity to attain a
Ph.D. under his guidance. His personal contribution towards my professional
development cannot be overstated. His eagerness to publish and present our work and
the associated investment in my career has been marvelous. The most impressive parts of
my thesis are a direct result of his unfailing support and encouragement.
I would also like to thank my committee for their time and suggestions in
developing my thesis. Their insightful suggestions have significantly improved the
quality of this work.
I would also like to thank the dedicated staff of the WPI Chemical Engineering
department including Jack Ferraro, Douglas White, Joe Kaupu and Sandra Natale, who
have helped make my stay in the department a thoroughly enjoyable experience. I would
also to express my thanks towards the entire staff at WPI, who have make WPI the
wonderful place it is.
I would also like to express my sincere thanks to the many friends I have made
during my stay at WPI, including co-workers and other students. Their good humor in
pushing towards the PhD has made the experience all the more enjoyable.
I would also like to thank my friends and family. I will simply say that words
cannot express my appreciation for the understanding and sacrifice that you have all
made that has helped me come this far. I must thank the entire Worcester County Church
of Christ who have been my home away from home. I must especially thank my fiancé,
Rachel Terpsma for her patience, understanding and support. I would also like to my
parents who have financially, emotionally and unconditionally supported my education
and me. I hope I can do as much for my children as they have done for us. Also thank
you to my brother, Ronnie, and sister, Sarah, who have always provided a kind ear for me
to vent. I have finally finished!
Finally, I must thank Him for allowing me the chance of a lifetime and enabling
me to do the little that I was able to do.

iii
TABLE OF CONTENTS
ABSTRACT i
ACKNOWLEDGEMENTS ii
LIST OF FIGURES vi
LIST OF TABLES ix
LIST OF SYMBOLS x
I BACKGROUND
Introduction 1
Fuel Reforming 2
CO Poisoning 3
O2 Bleeding 4
CO Tolerant Catalysts 4
Higher Temperature Operation 5
Motivation for Development of Higher Temperature and Low RH PEMs 5
Thesis Objectives 7
References 16
II MODELING OF CONDUCTIVE TRANSPORT IN PROTON EXCHANGE MEMBRANES FOR FUEL CELLS
Abstract 18
Introduction 19
Theory 22
General Transport Model for Ion-Exchange Membranes 22
Proton Transport in Ionomeric Membranes 26
Conductivity of Proton-Exchange Membranes 27

iv
Membrane Hydration and Swelling 29
Results and Discussion 30
Water Uptake by Nafion® 30
Conductivity in Liquid Water-Equilibrated Membrane 33
Conductivity in Water Vapor-Equilibrated Nafion® 35
Conclusions 36
Acknowledgement 37
References 38
III PEM FUEL CELL AS A MEMBRANE REACTOR
Abstract 49
Introduction 50
MEA Nanostructure 52
Constitutive Relations 54
Dusty-Fluid Model 55
Transport of Gases in Gas-Diffusion Backing (Layers D and E) 57
Transport of Protons in Proton-Exchange Membrane (Layer B) 58
Electrocatalysis: General Considerations 60
Hydrogen Oxidation Reaction (HOR) 64
Oxygen Reduction Reaction (ORR) 66
MEA Analysis 67
Model With No Diffusion Limitations In The Catalyst Layer 68
Overall Fuel Cell Performance 70
Reaction-Diffusion Model (Diffusion In The Catalyst Layer Is Considered) 71
Comparison of Theory and Experiments 74
Conclusion 79
Acknowledgement 80
References 87

v
IV RATIONAL DESIGN OF HIGHER TEMPERATURE COMPOSITE PROTON EXCHANGE MEMBRANES
Abstract 91
Introduction 91
Review of Previous Higher Temperature PEM Development 92
Development of alternate polymer/inorganic protonic materials 95
Modification of existing PEMs 96
Theoretical Basis of Design of Higher Temperature Composite PEMs 97
Potential Inorganic Additives 99
Experimental 100
Results/Discussion 106
Conclusion 111
References 130
V CONCLUSIONS AND RECOMMENDATIONS
Introduction 134
Synthesis and Evaluation Of Composite PEMs 134
Sol-Gel Synthesis Of Metallic Oxides 135
Design and Simulation of Higher Temperature PEMs 137
References 149

vi
LIST OF FIGURES
FIGURE PAGE
I-1 Block diagram showing possible production routes for H2. 9
I-2 Block diagram showing various stages in a PEMFC fuel processor. 10
I-3 CO poisoning of Pt electrocatalyst in a PEMFC operated at 3 atm. 11
I-4 The effect of temperature on anode polarization with 20 ppm CO / H2.
for Pt/C, PtRu/C and PtSn/C at several different temperatures. 12
I-5 Loss of performance at higher temperature. 13
I-6 Nafion 117 equilibrated in water vapor vs. water vapor activity at
different temperatures and simulation results. 14
I-7 (a) The chemical structure for Nafion®. (b) Model proposed for the
Nafion® membrane showing the potential structure of the hydrophobic,
hydrophilic and intermediate regions 15
II-1 A “dusty fluid model” depiction of a PEM. 43
II-2 Adsorption isotherm for water uptake by Nafion®117 from water vapor. 44
II-3 Experimental σmax for Nafion®115 immersed in liquid water versus
inverse temperature along with theoretical predictions. 45
II-4 Predicted equilibrium fractional dissociation of sulfonic acid groups.
in Nafion® as a function of the water uptake at different temperatures. 46
II-5. The experimental results σ of Nafion®117 equilibrated in water vapor
versus RH or water vapor activity at different temperatures along with
theoretical predictions. 47
II-6. Effect of temperature on conductivity of Nafion®117 at a fixed partial
pressure of water (2.0 x 10⁴ Pa, i.e., humidifier temperature = 333K). 48
III-1 A schematic representation of the PEM fuel cell cross-section
consisting of gas-diffusion backing,catalyst layers and the PEM. 82

vii
FIGURE PAGE
III-2 Comparison of overall fuel cell model (diffusion neglected in catalyst
layer) and experimental results. Current density versus voltage plot. 83
III-3 Comparison of overall fuel cell model (diffusion neglected in
catalyst layer) and experimental results. Power density versus voltage
plot for a 5 cm2 fuel cell. 84
III-4 Sensitivity analysis of fuel cell model (diffusion neglected in catalyst
layer) model. 85
III-5 Comparison of Reaction-Diffusion model (diffusion included in the
catalyst layer) vs. experimental results. 86
IV-1a Structure of Nafion®. 114
IV-1b Structure of Ballard Advanced Materials Third Generation (BAM3G)
Membrane. 115
IV-1c Random sulfonated poly(arylene ether sulfone)s. 115
IV-2 A Dusty-Fluid formalism was utilized to describe proton conductivity
through the Nafion® polymer matrix. 116
IV-3 The design objective of increasing the sorption isotherm of Nafion®. 117
IV-4 The effect of particle size is shown. 118
IV-5 The surface area normalized water uptake of the powder at 120ºC. 119
IV-6a The water uptake of composite membranes and Nafion® 112 at 25ºC. 120
IV-6b The water uptake of composite membranes and Nafion® 112 at 90ºC. 121
IV-6c The water uptake of composite membranes and Nafion® 112 at 120ºC. 122
IV-7 The measured and theoretical water uptake of composite
PEMs at 120ºC. 123
IV-8a The conductivity of the PEMs at 10% RH and 40% RH at 90ºC. 124
IV-8b The conductivity of the PEMs at 10% and 40% RH at 120ºC. 125
IV-9a The conductivity of loaded composites PEMs at 90ºC. 126
IV-9b The conductivity of loaded composite PEMs at 120ºC. 127

Chapter I 8
and relative humidity on PEM conductivity, and provides a useful beginning for the
rational design of higher temperature PEMs.
Chapter III31 is a membrane reactor model of the entire PEMFC. This model
includes the PEM transport model to account for the ohmic loss of the membrane, the
DFM formalism to treat diffusion in the electrode, and the Butler-Volmer kinetic
equation to treat kinetics of the catalyst layer. Simulation results are presented and the
model is used to understand the various aspects of higher temperature and low relative
humidity, PEM conductivity, low catalyst layer conductivity and reactant pressure.
Chapter IV details the previous work on higher temperature PEMs and the various
approaches used so far. The design and the characteristics of a higher temperature
composite PEM are described. The experimental work on the combination of Nafion
and superacidic additives to fabricate PEMs is also provided, as well as water uptake,
conductivity and fuel cell test results. This chapter demonstrates the promising potential
of these composites as higher temperature PEMs.
Chapter V provides a conclusion of the work and the future potential research
directions. This section also includes preliminary new experimental results and the
subsequent research necessary for the development of superior performance, low RH,
high temperature PEMs.

Chapter I 9
NUCLEAR ENERGY
HYDROGEN
WIND
WATER
BIOMASS
FOSSIL FUELS
FUEL PROCESSING
ELECTRICITY
GASOLINE, DIESEL,
ALCOHOLS, ETC.
NON-HYDROCARBON H2 FUEL
(AMMONIA, HYDRAZINE)
Figure I-1: Block diagram showing possible production routes for H22. Although there are
numerous sources of H2, the lack of demand has resulted in insignificant H2 production and
no national distribution system.
STORAGE / DISTRIBUTION
ELECTROLYSIS
SOLAR
WATER

Chapter I 10
Air
Compressor Water
Air
Steam
Air
Air
Exhaust
Expansion
Turbine
Figure I-2: Block diagram showing various stages in a PEMFC fuel processor2.
Gasoline
Storage
Burner /
Fuel
High Temp. Shift
POX Reactor
Low Temp. Shift
Preferential
Oxidation (PROX)
Air
Products:
CO + H2
Are reacted with:
(CO2, H2O, N2)
Products:
(H2 + 0.5%CO)
Are reacted with:
(CO2, H2O, N2)
Products:
~40% H2 + ppm. CO
Are Reacted with
(CO2, H2O, N2)
H2 Rich
Anode
Exhaust
PEM Stack

Chapter I 11
0.3
0.4
0.5
0.6
0.7
0.8
0.9
1
0 200 400 600 800 1000 1200 1400
H2
100 ppm. CO / H2 feed
H2 (After 100 ppm CO)
I (mA/cm2)
E (V
)
Figure I-3: CO poisoning of Pt electro-catalyst in a PEMFC operated at 3 atm. (O2/H2) at
80°C with Nafion® 117 MEA. Anode setpoint 90°C, Cathode setpoint 90°C. S.S. ELAT®
electrode with 0.34 mg/cm2 Pt. loading and 0.7 mg/cm2 Nafion® loading. Polarization
measurements are made before, during and after CO poisoning.

Chapter I 12
Figure I-4: The effect of temperature on anode polarization with 20 ppm CO / H2
for Pt/C, PtRu/C and PtSn/C at several different temperatures: ● 40°C, ■ 55°C,
▲70°C, ○ 85°C, □ 100°C, ∆ 115°C 16.

Chapter I 13
0
0.2
0.4
0.6
0.8
1
0 200 400 600 800 1000
TFUELCELL
= 80 0C
TFUELCELL
= 110 0C
E (V
)
I (mA/cm2)
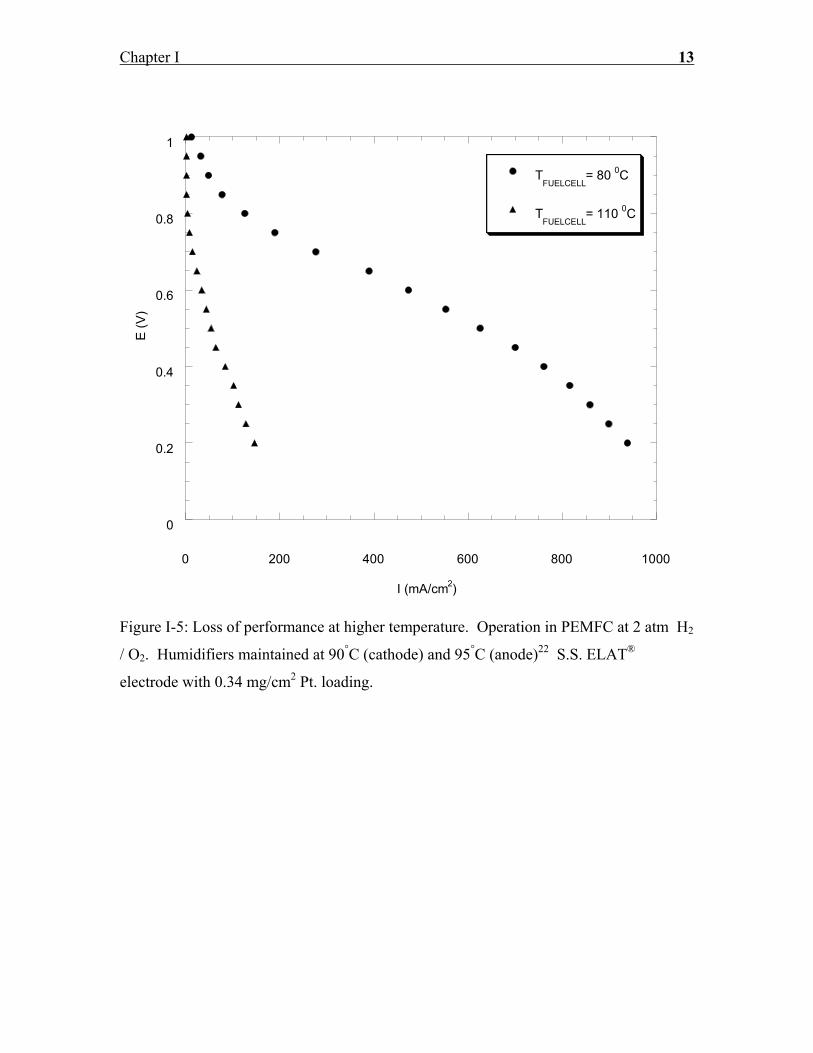
Figure I-5: Loss of performance at higher temperature. Operation in PEMFC at 2 atm H2
/ O2. Humidifiers maintained at 90°C (cathode) and 95°C (anode)22 S.S. ELAT®
electrode with 0.34 mg/cm2 Pt. loading.

Chapter I 14
Figure I-6: Nafion 117 equilibrated in water vapor vs. water vapor activity at different
temperatures and simulation results30.
0.0001
0.001
0.01
0.1
0 20 40 60 80 100
Theo., T = 343 KTheo., T = 333 KTheo., T = 318 KExp., T = 343 KExp., T = 333 KExp., T = 318 Kσ
RH %
(S/c
m)

Chapter I 15
-(CF2)n-CF-(CF2)n-
-(CF2)n-CF-(CF2)n- -(CF2)n-CF-(CF2)n-
-3SO
Hydrophobic PTFE
backbone
−[(CF 2−CF 2)m − CF−CF 2]n −
O
CF 2
CF−CF 3 x
O
(PTFE backbone)
C
F
FCF
F
S
O
O
O H
(a)
(b)
Figure I-7: (a) The chemical structure for Nafion®. (b) Model proposed for the Nafion®
membrane showing the potential structure of the hydrophobic, hydrophilic and
intermediate regions26.
Hydrophilic
ionic region
-(CF2)n-CF-(CF2)n-
H2O H2O
Intermediate
zone

Chapter I 16
REFERENCES
1 P. Patil, J. Power Sources, 49, 169 (1994).
2 L. Carrette, K.A. Friedrich and U. Stimming, Fuel Cells 1, 1(5) (2001).
3 B.C.H. Steele, J. Mat. Sci., 36, 1053 (2001).
4 M. Jacoby, Chem. & Eng, News 81(3), 32 (2003).
5 Ch. N Borrani-Bird, J. Power Sources 61, 33 (1996).
6 Mercatox Project, EC Contract JOE3-CT96-002 (Final Report, 1999).
7 S.G. Chalk, J.F. Miller and F.W. Wagner J. Mat. Sci., 86, 40 (2000).
8 A. Heinzel, R. Nolte, K. Ledjeff-Hey and M. Zedda, Electrochimica Acta 43, 3817
(1998).
9 S. Gottesfeld, J. Pafford, J. Electrochem. Soc. 135, 2651 (1988).
10 H.-F. Oetjen, V.M. Schmmidt, U. Stimming and F. Trila, J. Electrochem. Soc. 143,
3838 (1996).
11 N. M. Markovic, C. A. Lucas, B. N. Grgur and P. N. Ross, J. Phys. Chem., B, 103,
9616 (1999).
12 M. S. Wilson, T.E. Springer, T.A. Zawodzinski, S.Gottesfeld Proc. 28th
Intersociety Energy Conversion Engineering Conf., Atlanta, Georgia, Vol. 1,
pp1203-1208 (1993)
13 V.M. Schmidt, H.-F. Oetjen and J. Divisek, J. Electrochem. Soc. 144, L237 (1997).
14 R. Iannielo, V.M. Schmidt, U. Stimming, J. Strumper, A. Wallau, Electrochimica
Acta 39, 1863 (1994).
15 S.J. Lee, S.Mukerjee, E.A Ticianelli,,J. McBreen, B.N. Grgur, N.M. Markovic, P.N.
Ross, J.R. Giallombardo and E.S. De Castro, Electrochemical and Solid State
Letters 2(1), 12 (1999).
16 S.J. Lee, S.Mukerjee, E.A Ticianelli, and J. McBreen, Electrochimica Acta 44,
3283 (1999).
Chapter I 17
17 S. Gottesfeld and T. A. Zawodzinski, Polymer Electrolyte Fuel Cells, in R. Alkire,
H. Gerischer, D. Kolb, C. Tobias, eds., Advances in Electrochemical Science and
Engineering, 5, 197 (1998).
18 M. Watanabe and S. Motoo, J. Electroanal Chem. 60, 267 (1975).
19 J. Zhang, T. Thampan and R. Datta, J. Electrochem. Soc. 149, 6 A765 (2002).
20 J.H. Hirschenofer, D.B. Stauffer, R.R. Engleman and M.G. Klett, Fuel Cell 4th
Edition Nov. 1998 DOE/FETC-99/1076.
21 M. Mathias, Proton Exchange Membrane Nanocomposites for Fuel Cells,
Advances in Materials for Proton Exchange Membrane Fuel Cell Systems, ACS,
Pacific Grove, CA Feb. 23-27 (2003).
22 S.Malhotra and R. Datta, J. Electrochem. Soc. 144, L23 (1997).
23 Bernardi, D. M., J. Electrochem. Soc., 137, 3344 (1990).
24 Y. Sone, P. Ekdunge and D. Simonsson, J. Electrochem. Soc., 143, 1254 (1996).
25 P. Choi and R. Datta, In Press.
26 T. D. Gierke, G. E. Munn, and F.C. Wilson, J. Polym. Sci., 19, 1687 (1981).
27 P.L. Antonucci, A.S. Arico, P. Creti, E. Ramunni and V. Antonucci , Solid Sate
Ionics 125, 431 (1999).
28 N. Miyake, J.S. Wainright and R.F. Savinell J. Electrochem. Soc., 148, 8 A905
(1996).
29 D.H. Jung, S.Y. Cho, D.H. Peck, D.R. Shin and J.S. Kim, J. Power Sources 106,
173 (2002).
30 T. Thampan, S. Malhotra, H. Tang and R. Datta, J. Electrochem. Soc., 147, 1 3242
(2000).
31 T. Thampan, S. Malhotra, J. Zhang and R.Datta, Catalysis Today, 67, 15 (2001).

Chapter II 18
II. MODELING OF CONDUCTIVE
TRANSPORT IN PROTON-EXCHANGE
MEMBRANES FOR FUEL CELLS#,*
Abstract
An adequate understanding of the conductivity of polyperfluorosulfonic acid
(PFSA) membranes as a function of water content, or relative humidity, and temperature
is necessary for an analysis of the functioning of proton-exchange membrane (PEM) fuel
cells. Although, much work has been done towards elucidating the microstructure and
conduction mechanism in PFSA, a satisfactory theoretical model with a minimum of
fitted parameters is not yet available. Such a model is developed here for the conduction
of protons in hydrated Nafion® or like membranes based on the dusty-fluid model for the
transport and percolation model for the structural aspects. Further, thermodynamics of
dissociation of the acid groups in the presence of polar solvents such as water is included.
The sorption of solvent from vapor is modeled using a finite-layers Brunauer-Emmett-
Teller (BET) model. With the only fitted parameters employed being the BET constants,
determined independently, and the ratio of diffusion coefficients representing the
interaction of the protonated solvent molecules with solvent and that with the membrane,
the model provides excellent correlation with a variety of experimental data.
# This work was published in J. Electrochem. Soc., 147 1 (2000) 3242. * The contributions of S. Mahotra, H. Tang and R. Datta are gratefully acknowledged.

Chapter II 19
Introduction
The proton-exchange membrane (PEM) fuel cell has lately emerged as a highly
promising power source for a wide range of applications. The solid polymer electrolyte
utilized in these fuel cells is typically a polyperfluorosulfonic acid (PFSA) membrane
(e.g., Nafion, manufactured by Dupont), that provides excellent performance in the
presence of water by virtue of its strong acidity, low permeability of hydrogen and
oxygen, and good electrochemical stability in the presence of electrocatalysts. This has
allowed the development of low temperature PEM fuel cells with impressive current
densities. These membranes have also been widely utilized in the chlor-alkali industry.
However, an understanding and modeling of the transport of ionic species through these
ion-exchange membranes is not yet adequately developed, especially for proton transport,
which is the focus of this paper.
There are numerous studies on the nanostructural aspects of the Nafion
membranes.1-15 The unique properties of these PFSA membranes are attributable to their
polymer structure that consists of a fluorocarbon, Teflon-like, backbone with side-chains
terminating in –SO3H groups. In the presence of water or other polar solvents, these
sulfonic acid groups dissociate, protonating the solvent molecules and forming a
hydrophilic phase that also includes the solvated −SO3− ions tethered to the hydrophobic
backbone through the side-chains.1 Based on small angle X-ray and other studies,2–4
Gierke and co-workers2,15 proposed in their “cluster–network model” that the
incompatibility of the fluorocarbon and the ionic/solvent component leads to the
formation of inverted micelles, existing as near-spherical aggregates, 3-5 nm in diameter,
depending upon the level of hydration. These are interconnected through short narrow
channels, 1-2 nm in diameter, to provide a network for diffusion interspersed throughout
the fluorocarbon matrix. The extent of the solvent uptake and membrane swelling is
controlled by a balance between the internal osmotic pressure of solvent in the pores and
the elastic forces of the polymer matrix,16 which, in turn, depend upon the temperature
and membrane pretreatment. The cluster–network model provides a suitable structural
framework for the development of ionic transport models in these membranes akin to
those in porous media, e.g., the parallel-pore model, or the percolation model.

Chapter II 20
There is, of course, substantial literature on the modeling of transport through ion-
exchange membranes,17–20 although the majority of the work deals with the transport of
electrolytes, i.e., salt/acid/base solutions, rather than with proton transport. The interest
in diffusion of electrolytes through ion-exchange membranes stems mainly from their
chlor-alkali and electro-dialysis applications. A theoretical model of ion-exchange
membranes involves: 1) a structural model, and 2) a transport model. The cluster-
network, the parallel-pore, and the percolation models referred to above belong to the
former. As to the latter, there are three alternate approaches: 1) phenomenological
models based on nonequilibrium thermodynamics;21,22 2) models based on the Nernst-
Planck equations;19,23,24 and 3) those based on the generalized Stefan-Maxwell (GSM)
equations,25–27 or equivalently, the frictional formalism of Spiegler.20,28 The last two are
of a similar form, the former involving diffusion coefficients and the latter incorporating
frictional coefficients. The transport model of choice is suitably adapted to the chosen
structural model to provide an overall description of ion transport in a membrane.
Fairly sophisticated capillary pore models incorporating the Nernst-Planck
equations to describe diffusion, the Navier-Stokes equations for convective flow, and the
Poisson-Boltzmann equation to describe the radial potential profile within individual
pores have been developed,23,24,29,30 that adequately simulate the transport of alkali metal
ions through the membrane. However, the GSM equations, or equivalently Spiegler’s
frictional model, represent a more general starting point, the Nernst-Planck equations
being strictly applicable to dilute solutions.31 The GSM equations have been utilized
with a fair degree of success by Spiegler,28 Meares et al.,20 Pintauro and Bennion,27
Wesselingh et al. (1995),32 and van der Stegen et al.,33 for describing the transport of
alkali electrolytes in ion-exchange membranes. The main limitation, however, is that
many of the necessary GSM diffusion coefficients are not independently available in the
literature, requiring their treatment as fitted parameters.33
The status of the modeling of transport of protons in hydrated PFSA membranes
is less satisfactory, although there is much of relevance in the electrolyte transport
literature. A number of experimental studies have, however, been performed under a
variety of conditions.10,15-18 These conductivity data show that at very low water uptake,
i.e., for number of water molecules per –SO3H group, λ < 2, the Nafion® membrane

Chapter II 21
behaves essentially as an insulator, the conductivity σ being of the order of 10−7 S/cm.34
Beyond a critical hydration level uptake (λ ≈ 2), or a “percolation” threshold, σ rises
dramatically with water uptake reaching a plateau in the semiconductor range, of the
order of about 10−1 S/cm, for a membrane immersed in water. In general, σ also rises
with temperature, although the data of Sone et al.35 indicate a low temperature range with
anamolous behavior. Since the water uptake is determined by relative humidity (RH),
temperature and membrane pretreatment, these are the key factors affecting membrane
conductivity.
Fadley and Wallace36 developed an absolute rate model for conduction in PEMs,
in which the effect of hydration was included by assuming that it affected the Gibbs free
energy of activation. The model agreed with data in the range of 0 < λ < 5, but not
beyond that. Hsu et al.10 developed a percolation model to describe the effect of water
uptake on conductivity, i.e., σ = σ0(ε − ε0)q . The expression fitted the data well with the
following parameters q = 1.5, σ0 = 0.16 S/cm, and ε0 = 0.1. No attempt, however, was
made to predict σ0 in terms of more fundamental transport parameters. Morris and Sun37
also found the percolation model to be accurate but with different fitted parameters,
namely, q = 1.95, σ0 = 0.125 S/cm, and ε0 = 0.06. Springer et al.38 developed an
empirical model to linearly relate the conductivity to λ, instead of to ε, and used the
Arrhenius equation to describe temperature dependence of conductivity. In turn, λ was
fitted to RH through a third-order polynomial. Eikerling et al.,39 extended the percolation
model by considering two different types of pores, those with only surface water and
others containing additional bulk-like water, and ascribed different conductivities to each.
Then by connecting the pores randomly within the framework of the random network
theory, they predicted conductivity as a function of hydration level. Bernardi and
Verbrugge40 utilized the Nernst-Planck equation along with a parallel pore model to
describe membrane conductivity within a larger model to predict PEM fuel cell
performance. However, a direct comparison of the model with conductivity data was not
provided. More recently, there have been attempts to do molecular simulation of proton
transport within pores of Nafion®.41,42

Chapter II 22
The model developed here is based on the assumption that the diffusion
mechanism in hydrated PEMs is similar to that in the liquid, i.e., protons are transported
as hydronium ions via mutual diffusion, Grotthus mechanism, and flow through pores
containing water within the ionomer,34 rather than, e.g., through surface site-hopping.
The hydronium ions in the liquid phase result from dissociation of the acid groups. The
obstruction presented by the polymer matrix to the diffusion of hydronium ions is
modeled as an additional frictional, or diffusional, interaction with the large “dust”
particles (Fig. 1), representing the polymer species in the spirit of the “dusty-fluid model”
(DFM),43 with a molecular weight equal to the polymer equivalent weight (EW). The
space filling aspects and tortuosity of the polymer matrix are accounted through the DFM
structural constants, which also include provision for the absence of conduction below a
percolation threshold. Thermodynamics of sulfonic acid group solvation and water
sorption isotherm are included as well, as is the swelling of the membrane. Since it has
been the subject of considerable study,44 the model is utilized for hydrated Nafion.
However, it should be applicable to other PEMs as well as to solvents other than water.
Theory
General Transport Model for Ion-Exchange Membranes.-We start with the generalized
Stefan-Maxwell equations with the electrochemical potential gradient as the driving force
for describing diffusional velocity of species i, v iD , in a continuum fluid26,31
1( )
ni je D Di
T i i jj ijj i
c ccRT cD
µ=≠
− ∇ = −∑ v v (i = 1,2,…,n) (1)
In Eq. 1, the electrochemical potential gradient at constant temperature is composed of
chemical and electrical potential gradients:
( )ln lneT i T i i i i i iz F RT c RT V p z Fµ µ γ∇ = ∇ + ∇Φ = ∇ + ∇ + ∇ + ∇Φ (2)
Equation 1 may alternatively be written as per the frictional formalism of Spiegler28
1( )
ne D D
i T i i j ij i jjj i
c c cµ ζ=≠
− ∇ = −∑ v v (i = 1,2,…,n) (3)
where the frictional coefficients and the diffusion coefficients are interrelated via
Chapter II 23
ijij
RTcD
ζ ≡ (4)
where ζ ij is the frictional coefficient for the interaction between species i and j, defined
by assuming that the frictional force Fij* (N/mol i) between species i and j, the latter
being present in the mixture at unit concentration, is given by, * ( )D Dij ij i jζ≡ − −F v v .
These, in turn, are related to Spiegler’s28 frictional coefficient fij by cj ζ ij = fij. When
applied to diffusional transport within an ion-exchange membrane, itself considered
simply as an additional, albeit a large molecular weight “dust” species (j = M), within the
framework of the dusty-fluid model (DFM),43 constrained by external clamping forces to
be stationary ( vMD = 0 . In addition, of course, v = 0), Eq. 1 results in
1( )
ni je D D Di i
T i i j ie ej ij iMj i
c cc cRT cD D
µ=≠
− ∇ = − +∑ v v v (i=1,2,…,n) (5)
where the continuum diffusion coefficients Dij have been replaced by their “effective”
counterparts, Dije , to account for space-filling aspect and tortuosity of the membrane, the
latter reducing the effective driving force gradient. Further, DiMe , or equivalently e
iMζ ,
accounts for the frictional interaction between species i and the matrix, or dust particles.
It is to be noted again that each sulfonic acid group along with its associated PTFE
backbone is treated as the dust species M, with an EW ≈ 1100 for Nafion®. The effective
and contiuum diffusion coefficients are interrelated through45
1eij ijD K D= (6)
where K1 is the DFM structural constant for molecular diffusion coefficient. Frequently,
the relation K1 = εq suffices, where ε is the volume fraction of the phase through which
the diffusion is occurring. A common value for the so-called Bruggeman exponent, q =
1.5.31,32 Alternatively, if one adopts the percolation model for this,15 which includes a
percolation threshold ε0 below which the diffusion is improbable owing to the lack of
connectivity of phase through which the diffusion occurs, then
1 0( )qK ε ε= − (7)

Chapter II 24
where the critical exponent q is a universal constant predicted to be about 1.5,15 although
it is frequently used as a fitted parameter.37 The threshold value ε0 is best determined
from experiments as a fitted parameter. This model, with q = 1.5, is adopted here in view
of the well-known percolation behavior of conductivity in proton-exchange membranes.15
The effective membrane diffusion coefficient may similarly be written as
0eiM iMD K D= (8)
where K0 is the DFM constant for matrix diffusion coefficient. Unlike for K1, however,
no general relationship is available to relate K0 to the structural properties of the
membrane for the case of liquid-phase diffusion, although for gaseous diffusion, relations
are available for the corresponding effective Knudsen diffusion coefficient in terms of the
porosity, tortuosity factor, and the mean pore radius.45 As a result, there is little choice
but to treat it as a fitted parameter here, as commonly done.32,33
The total species velocity, in general, comprises a convective component v in
addition to the diffusive component, i.e., Di i= +v v v (except for matrix M, for which
there is no convective velocity as well). The convective velocity resulting from a
pressure gradient and/or potential gradient may be given by Schlögl’s equation23
0
1
n
j jj
B p c z Fη =
= − ∇ + ∇Φ
∑v (9)
where the term in the parenthesis accounts for all charged species in the liquid phase,
which for the case of proton transport in fuel cells is only hydronium ion, but would
involve other species for electrolyte transport. Implicit in equation (9) is the assumption
of radial uniformity of charged species within the pores. In case radial non-uniformity is
accounted, e.g., in terms of the double-layer theory, the effective d’Arcy permeability for
pressure-driven flow B0 and that for electro-osmosis BΦ would not be the same.40, 46 This
difference is ignored here. Utilizing Eq. 9 in Eq. 5, thus, DFM takes the following form
in terms of the total species fluxes Ni ≡ civi:
0
1 1
1 ( )
( 1, 2,..., )
n nei i i
T i j i i j j je e ej jij iM iMj i
c c Bc c p c z FRT cD D D
i n
µη= =
≠
− ∇ = − + + ∇ + ∇Φ
=
∑ ∑NN N (10)
Summing this over all species, the Stefan-Maxwell terms cancel out, resulting in
Chapter II 25
1 1
n nj
j j ej j jM
RTp c z FW D= =
∇ + ∇Φ = −
∑ ∑
N (11)
where the term
0
11
nhe
h hM
B cRT xWDη =
≡ + ∑ (12)
An alternate form of Eq. 10 is, thus, obtained by using Eq. 8 to eliminate the convection
driving force in the brackets
0
1 1
1 ( )
( 1, 2,..., )
n njei i i
T i j i i je e e ej jij iM iM jMj i
c c B RTc cRT cD D D W D
i n
µη= =
≠
− ∇ = − + −
=
∑ ∑NNN N
(13)
which may alternately be written in the more compact form
1
ne ei
T i ij jj
c HRT
µ=
− ∇ = ∑ N (i=1,2,…,n) (14)
with the effective frictional coefficients incorporating the convective terms being
0 02
1
1( 1)( )
ne i i h iij ij ije e e e e e
hij iM jM iM ih iMh i
x cRTB x x cRTB xHD WD D D D W D
δ δη η=
≠
= − + + + − ∑ (15)
where, as usual, the Kronecker delta function
0 ( )
1 ( )ij
j ij i
δ =
≠ =
(16)
If desired, Eq. 14 may be formally inverted to yield an expression that is explicit in
species flux
1
1 ne e
i ij j T jj
cRT
κ µ=
= − ∇∑N (i=1,2,…,n) (17)
where the effective Onsager diffusional coefficients κ ije are the elements of the matrix
[He]−1, with elements of the effective frictional coefficient matrix [He] being given by Eq.
15. The current density is then obtained from
n
i iF z= ∑i Ni=1
(18)

Chapter II 26
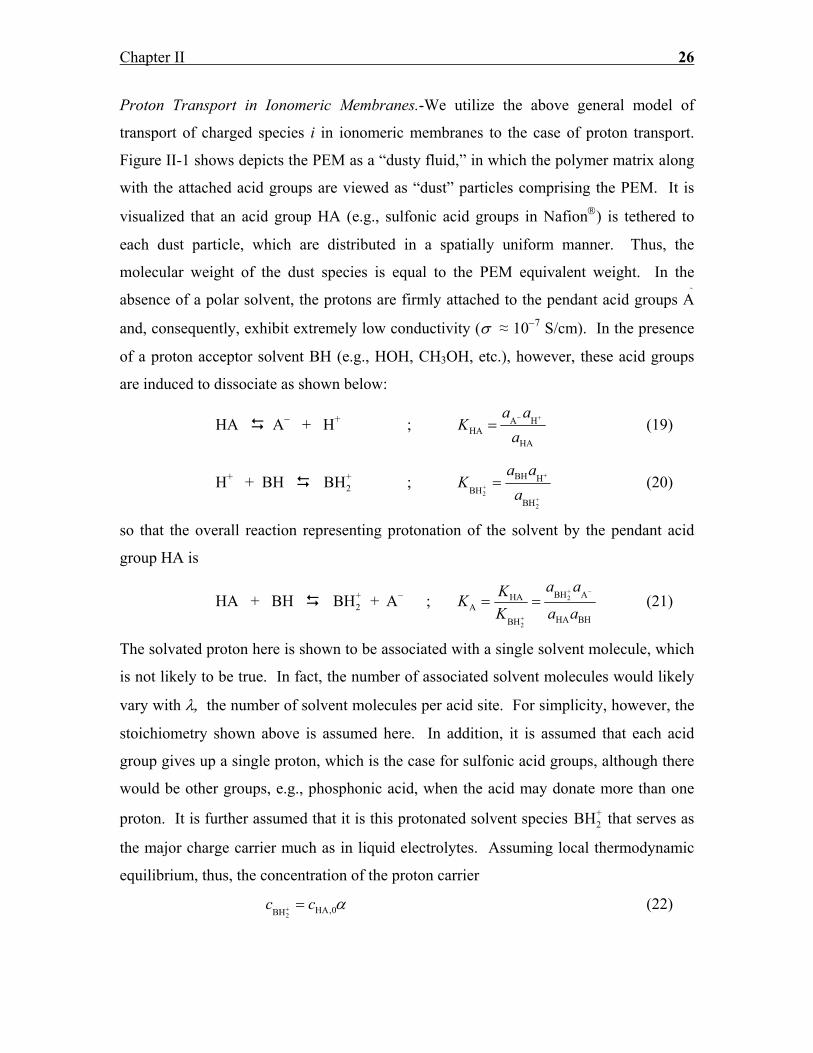
Proton Transport in Ionomeric Membranes.-We utilize the above general model of
transport of charged species i in ionomeric membranes to the case of proton transport.
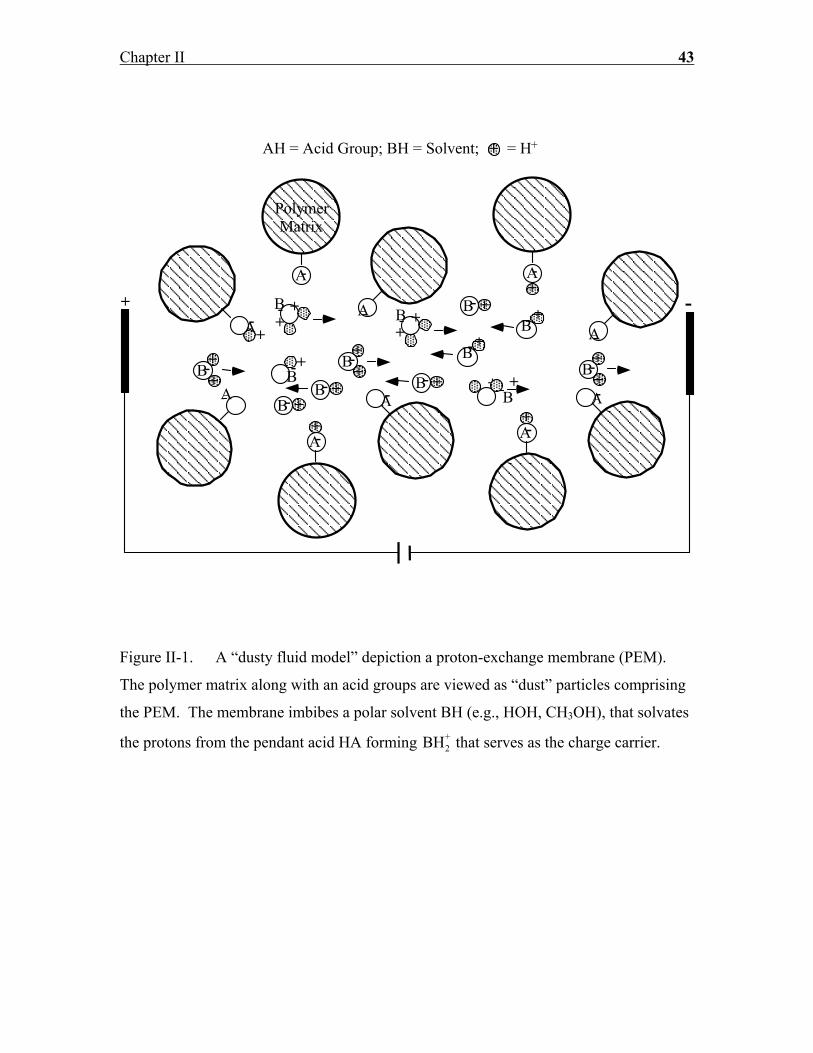
Figure II-1 shows depicts the PEM as a “dusty fluid,” in which the polymer matrix along
with the attached acid groups are viewed as “dust” particles comprising the PEM. It is
visualized that an acid group HA (e.g., sulfonic acid groups in Nafion) is tethered to
each dust particle, which are distributed in a spatially uniform manner. Thus, the
molecular weight of the dust species is equal to the PEM equivalent weight. In the
absence of a polar solvent, the protons are firmly attached to the pendant acid groups A
and, consequently, exhibit extremely low conductivity (σ ≈ 10−7 S/cm). In the presence
of a proton acceptor solvent BH (e.g., HOH, CH3OH, etc.), however, these acid groups
are induced to dissociate as shown below:
HA A− + H+ ; A HHA
HA
a aK
a− +
= (19)
H+ + BH BH2+ ; +
2+2
BH HBH
BH
a aK
a+
= (20)
so that the overall reaction representing protonation of the solvent by the pendant acid
group HA is
HA + BH BH2+ + A− ;
+2
+2
BH AHAA
HA BHBH
a aKKK a a
−
= = (21)
The solvated proton here is shown to be associated with a single solvent molecule, which
is not likely to be true. In fact, the number of associated solvent molecules would likely
vary with λ, the number of solvent molecules per acid site. For simplicity, however, the
stoichiometry shown above is assumed here. In addition, it is assumed that each acid
group gives up a single proton, which is the case for sulfonic acid groups, although there
would be other groups, e.g., phosphonic acid, when the acid may donate more than one
proton. It is further assumed that it is this protonated solvent species BH2+ that serves as
the major charge carrier much as in liquid electrolytes. Assuming local thermodynamic
equilibrium, thus, the concentration of the proton carrier
2HA,0BH
c c α+ = (22)
Chapter II 27
where cHA,0 is the concentration of the pendant acid groups per unit volume of pore
solution. The degree of dissociation, α , assuming ideal solution is obtained by solving
+2
2BH A
A,HA BH (1 )( )C
c cK
c cα
α λ α−
≡ =− −
(23)
where λ is the number of solvent molecules per acid site = BH,0 HA,0/c c . The solution to
Eq. 23 provides
2
A,
A,
( 1) ( 1) 4 (1 1/ )2(1 1/ )
C
C
KK
λ λ λα
+ − + − −=
− (24)
Thus, the extent of dissociation depends upon KA,C, i.e., on the relative proton
affinities of A and BH, or in other words on the strength of the acid group (KHA) and the
nature of the solvent (2BH
K + ), as well as solvent uptake, λ. It is shown below that the acid
dissociation is not complete, in general, even for superacidic membranes such as
Nafion.
Conductivity of Proton-Exchange Membranes.-For the case of a proton-exchange
membrane consisting of water as the solvent, denoting water as species 2 and the
protonated solvent, i.e., hydronium ion (H3O+) as species 1, Eq. 13, or equivalently Eq.
14, for this binary case (n = 2) reduces to
11 1 1
1 01
1 12 1 1 2
( )1 ( 1)1 1 T
e e e e eM M M M
xc z FRT cx B RTx
D D WD D D
µν ν
η
= − ∇ + ∇Φ + − + − −
N (25)
where the flux ratio, 2 1/ν ≡ −N N , and from Eq. 12
0 1 1
1 2
11 e eM M
cB RT x xWD Dη
−= + +
(26)
We shall restrict the following discussion to conductivity measurements in a
closed conductivity cell, i.e., the case of equimolar counter-diffusion, so that ν = 1. In
the case of a fuel cell, of course, this would not hold, and then either ν would be specified
by fuel cell reaction stoichiometry (e.g., ν = 3/2 for 2 hydronium ions diffusing to
cathode to produce 1 water molecule plus releasing 2 water molecules that served as
proton carriers) or it be appropriate to write another flux equation for species 2 (water) in

Chapter II 28
terms of its chemical potential gradient. Due to the similarity in species 2 (water) and 1
(hydronium ion), it is further assumed here that 1 2e eM MD D≈ . Actually, this along with
equimolar counter-diffusion is tantamount to the assumption that there is no convection
(Eq. 11). Furthermore, the concentration gradient of hydronium ions (species 1) is zero
owing to the assumption of spatial uniformity of the sulfonic acid groups coupled with
electroneutrality.40 This is further assumed to imply lack of chemical potential gradient
for the hydronium ions, although due to the existence of a water concentration gradient,
non-uniform proton activity coefficients, and hence non-zero chemical potential gradient
through the membrane is possible. With the above assumptions, Eq. 25 reduces to the
particularly simple form
1
1 1 11 12
1 1e eM
F c zD D RT
−
= − + ∇Φ
N (27)
Further, from the use of this expression in Eq. 18, the current density
1 2
21212 1 1
1
1e
eeM
D FD c zD RT
σ−
= − + ∇Φ ≡ − ∇Φ
i (28)
assuming hydronium ions are the only charge carrying species. Furthermore, from the
definition of conductivity in Eq. 28, z1 = +1, and Eq. 22 for the concentration of the
hydronium ions
12
1212 HA,0
1
1e
eeM
DF D cRT D
σ α−
= +
(29)
Finally, the use of Eq. 7 and defining 12 1 1 12 1 0 12 1/ / ( / )( / )e e e eM M MD D K K D Dζ ζ δ= = ≡
results in
2
120 HA,0( )
1q DF c
RTσ ε ε α
δ = − +
(30)
Alternatively, in terms of the equivalent conductance of hydronium ions in water, 0 2 0
1 1 12 /F z D RTλ ≡ ,31
0
10 HA,0( )
1q cλσ ε ε α
δ
= − + (31)

Chapter II 29
Strictly, the numerator of Eq. (27) should include 012 12/D DΓ ≡ , the ratio of the diffusion
coefficient of hydronium ion to that at infinite dilution. However, Γ is expected to be
only slightly concentration dependent,31 and is, consequently, assumed to be unity. The
equivalent conductivity of hydronium ions, of course, is unusually high, i.e., 01 349.8λ =
S.cm2/equiv in water at 25ºC, or D120 = 9.312 x10⁻⁵ cm2/s,31 and is explained in terms of
the Grotthus diffusion mechanism in addition to the usual en masse diffusion.47
Some comments are also in order on the magnitude of δ. In addition to structural
effects represented by K1/K0, which depends upon ε or RH, δ depends upon the ratio
D12/D1M, which in turn depends upon the difference in collision frequencies of species 1
and 2 and that of 1 and M, as well as the molecular weights of species 2 and M.48 The
difference in collision frequencies in turn depend upon the size difference between
species 2 and M. Thus, the ratio D12/D1M is expected to be >1. On the other hand, the
ratio K1/K0 would be expected to have inverse dependence on ε or λ, being large at low
water loading and reducing at higher loadings. Thus, δ would be a relatively large
number at low water loadings and would reduce as ε increases, when a diffusing
hydronium ion would encounter a water molecule more frequently than it would
encounter the polymer matrix. Unfortunately, it is difficult to be more quantitative at this
stage. Thus, δ is treated as a fitted parameter here, with its value depending upon the
level of hydration.
Membrane Hydration and Swelling.-The equivalent weight (EW) of the membrane (g dry
polymer/mol acid groups) and the partial molar volume of the membrane are interrelated
0
EWMV
ρ≈ (32)
where ρ0 is density of the dry membrane. For Nafion® 117, 115, or 112, membranes of
interest here, the EW = 1100, and ρ0 = 2.05 g/cm.3,37 Thus, 3537 cm /molMV = . The
other properties of Nafion® required for the use in Eq. 31 include acid group
concentration, defined on the basis of per unit volume of pore solution
HA,02
1cVλ
= (33)
Chapter II 30
where 2V is the partial molar volume of water, roughly 18 cm3/mol. The volume fraction
of water in swollen Nafion® corresponding to a water loading λ
2
MVV
λελ
=+
(34)
In addition, a relationship is needed for correlating the water uptake to RH. Recently,
Futerko and Hsing49 utilized a modified version of the Flory-Huggins model for this.
Springer et al.,38 and Hinatsu et al.,50 on the other hand, simply used a 3rd order
polynomial to empirically fit λ versus water vapor activity, a2. We find, however, that
the water sorption characteristics of Nafion® can be well-modeled by an n2-layer
Brunauer-Emmett-Teller (BET) equation51 with physically meaningful parameters, and is
hence adopted here
2 2
2
12 2 2 2 2 2
12 2
[ /(1 )][1 ( 1) ]1 ( 1)
n n
nm
Ca a n a n aC a Ca
λλ
+
+
− − + +=
+ − − (35)
where the RH or the water vapor activity, 2 2 2/ oa p p= , mλ is the water loading at
monolayer coverage, and n2 is the total number of water layers in the pores at saturation,
which is roughly equal to the maximum number of water molecules per sulfonate divided
by mλ , i.e., 2 sat / mn λ λ≈ for parallel plate pore geometry.
Results and Discussion
Water Uptake by Nafion®.- The conductivity of Nafion® and other proton-exchange
membranes is highly dependent upon their water content, the highest conductivity, σsat,
corresponding to water-equilibrated membranes, which have the highest water uptake,
λsat, for a given imbibition temperature and membrane pretreatment procedure.50 It is
useful to recall that three different Nafion pretreatment protocols have been described in
the literature:52 1) boiling the membrane in water, which results in the so-called E
(expanded)-form; 2) drying at 80ºC, which produces N (normal) form; and 3) drying at
105ºC, which produces the S (shrunken) form. Hinatsu et al.50 report that the E-form of
Nafion®117 absorbs more water ( λsatliq = 23, at 25ºC) than the N− or S− forms, which
Chapter II 31
absorb liqsatλ = 13.5 and liq
satλ = 11, respectively, at 25ºC. However, this increases with the
temperature of immersion, except for the E-form membranes, for which it remains
independent of temperature. Drying of the membranes at elevated temperatures
apparently results in pore shrinkage due to polymer creep, which can be reversed only by
exposure to water at elevated temperatures.
Curiously, the water uptake in membranes equilibrated with saturated water vapor
at otherwise identical conditions is significantly lower than in those immersed in water.
Thus, Zawodzinski et al.53 observed that at 30ºC the water content of Nafion®117
equilibrated with liquid water, liqsatλ ≈ 22, while for membrane equilibrated with saturated
water vapor, vapsatλ ≈ 14. Further, when liquid water equilibrated membrane was removed
and suspended over saturated water vapor, λsat dropped from 22 to 14, indicating that the
two states are thermodynamically stable. This phenomenon, sometimes known as
Schroeder’s paradox, is apparently not uncommon in polymer systems, and is discussed
briefly by Zawodzinski et al.53
Figure II-2 shows the equilibrium sorption from water vapor on Nafion®117 as a
function of water vapor activity, or RH, taken from the experimental data of Zawodzinski
et al.52 at 30ºC as well as those of Morris and Sun37 at 25ºC. These data are also similar
to those reported by Pushpa et al.,54 although the data of Hinatsu et al.50 at the higher
temperature of 80ºC are somewhat different. Although there is some scatter in Fig. 2, it
can be seen that Eq. (35) represents the data well with physically realistic values of
parameters ( λm= 1.8, n2 = 13.5, C = 150) as listed in Table II-1. The monolayer coverage
λm was estimated from knowledge of the specific pore surface area S and by using
0 2
EWm
A
SN A
λρ
=
(36)
where the surface area occupied by an adsorbate molecule on the pore surface was
estimated from55 23
22
2
1.091A
MWANρ
=
(37)

Chapter II 32
For Nafion® 117, S = 210 (m2/cm3),56 and these expressions provide λm= 1.8, which was
adopted here. However, as indicated in Table II-1, C and n2 were used simply as fitted
parameters, but their values utilized are not entirely unreasonable. Thus, 2 mn λ× ≈ 24,
which is certainly more than vapsatλ ≈ 14, but is of the order of liq
satλ . The parameter C,
generally >> 1, represents the ratio of the adsorption equilibrium constant of the first
layer to that of the subsequent layers
1exp LQ QC mRT− =
(38)
where Q1 is the enthalpy of adsorption of first layer, while QL is that of the succeeding
layers, usually assumed to be constant and equal to the latent heat of condensation of the
adsorbate. Thus, assuming m = 1, the C = 150 implies a (Q1 − QL) ≈ 12 kJ/mol, i.e., at
25ºC, Q1 ≈ 56 kJ/mol. In comparison, Escoubes and Pineri,57 based on microcalorimetric
studies, found the heat of adsorption of water vapor in Nafion® to vary from 16.7 to 52.3
kJ/mol, the higher values corresponding to lower water uptake (λ < 4). Of course, the
assumption of the heat of adsorption of second and higher layers being equal to the heat
of condensation (≈ 44 kJ/mol at 25ºC for water) may not be true in Nafion® due to the
strongly hydrophobic nature of the polymer backbone. At any rate, for (Q1 − QL) ≈
constant, Eq. (38) shows that C would decline with temperature, which appears to be
consistent with the adsorption isotherms measured at higher temperatures,50 having a
more rounded “knee” at low RHs. Of course, one would also expect n2 to vary with
temperature and the membrane pretreatment procedure. It appears, in short, that the
finite-layers BET adsorption isotherm, with C and n2 dependent upon temperature and
pretreatment procedure, is a suitable representation of adsorption on Nafion®.
Finally, it is noteworthy from Fig. 2 that there is a relatively small change in λ
over a rather broad range of RH, i.e., from about 10 to 70%. At higher RH, however, the
increase in λ is more pronounced, particularly as saturation is approached. This has
important implications in the range of RHs required for effective conduction and fuel cell
performance, where it is found that there is a precipitous decline in performance at RH
substantially less than 100%. This point is further discussed later on.

Chapter II 33
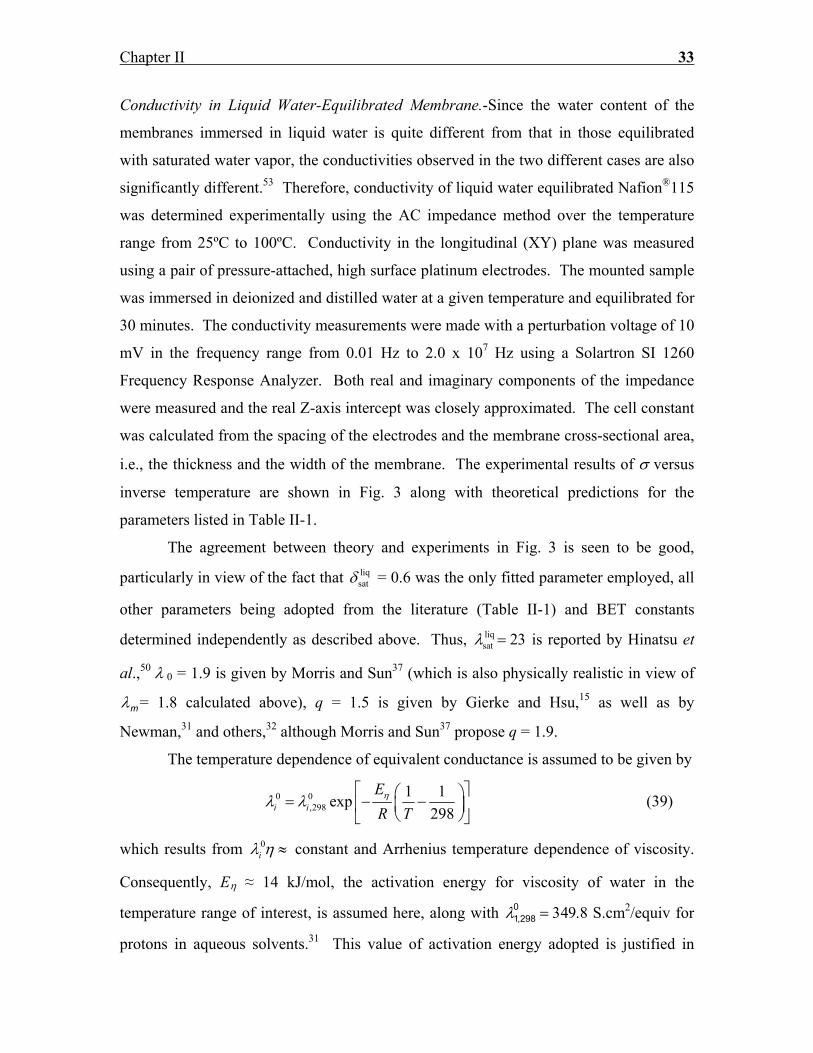
Conductivity in Liquid Water-Equilibrated Membrane.-Since the water content of the
membranes immersed in liquid water is quite different from that in those equilibrated
with saturated water vapor, the conductivities observed in the two different cases are also
significantly different.53 Therefore, conductivity of liquid water equilibrated Nafion®115
was determined experimentally using the AC impedance method over the temperature
range from 25ºC to 100ºC. Conductivity in the longitudinal (XY) plane was measured
using a pair of pressure-attached, high surface platinum electrodes. The mounted sample
was immersed in deionized and distilled water at a given temperature and equilibrated for
30 minutes. The conductivity measurements were made with a perturbation voltage of 10
mV in the frequency range from 0.01 Hz to 2.0 x 10⁷ Hz using a Solartron SI 1260
Frequency Response Analyzer. Both real and imaginary components of the impedance
were measured and the real Z-axis intercept was closely approximated. The cell constant
was calculated from the spacing of the electrodes and the membrane cross-sectional area,
i.e., the thickness and the width of the membrane. The experimental results of σ versus
inverse temperature are shown in Fig. 3 along with theoretical predictions for the
parameters listed in Table II-1.
The agreement between theory and experiments in Fig. 3 is seen to be good,
particularly in view of the fact that liqsatδ = 0.6 was the only fitted parameter employed, all
other parameters being adopted from the literature (Table II-1) and BET constants
determined independently as described above. Thus, liqsatλ = 23 is reported by Hinatsu et
al.,50 λ 0 = 1.9 is given by Morris and Sun37 (which is also physically realistic in view of
λm= 1.8 calculated above), q = 1.5 is given by Gierke and Hsu,15 as well as by
Newman,31 and others,32 although Morris and Sun37 propose q = 1.9.
The temperature dependence of equivalent conductance is assumed to be given by
0 0,298
1 1exp298i i
ER T
ηλ λ = − −
(39)
which results from 0iλ η ≈ constant and Arrhenius temperature dependence of viscosity.
Consequently, Eη ≈ 14 kJ/mol, the activation energy for viscosity of water in the
temperature range of interest, is assumed here, along with λ1,2980 = 349.8 S.cm2/equiv for
protons in aqueous solvents.31 This value of activation energy adopted is justified in
Chapter II 34
view of the following, even though there is a large variation in activation energies for σ
reported in literature, i.e., from 2 kJ/mol to 16 kJ/mol.4,35,52 For ordinary liquid-phase
diffusion, the relation 0iλ η ≈ constant stems directly from the well-known relation
/iD Tη ≈ constant,31 along with the relation between equivalent conductance and
diffusivity, 0 2 0 /i i iF z D RTλ ≡ . However, it is well known that for the case of
hydronium ions, ordinary diffusion is supplemented with Grotthus hopping.47 It turns
out, nonetheless, that the activation energy for Grotthus conduction is also of the same
order (14 - 40 kJ/mol),35 so that Eη = 14 kJ/mol seems to be a reasonable estimate.
As shown below, however, the temperature dependency of conductivity is also
affected by the degree of acid group dissociation, α, which varies with temperature owing
to the temperature dependence of the acid dissociation constant
A,C A,C,2981 1exp
298
oHK KR T
∆ = − −
(40)
which is based on the assumption that the heat of solvation, ∆Ho ≈ constant.
Unfortunately, however, the KA,C,298 value for Nafion® is not available in the literature,
although the study of Twardowski et al.,58 indicates a pKa < 1, suggesting strong acidity.
Further, the Hammett acidity function of Nafion® is reportedly similar to that for 100%
sulfuric acid. 59 Consequently, it was decided to use the thermodynamics of the liquid
solvation reaction
2 4 2 3 4H SO H O H O HSO+ −+ ⇔ + (41)
to simulate that of the sulfonic acid groups in Nafion®. For H2SO4 , the reported KA,C,298
values range from 1.2 to 50.60 Based on the data of Vinik and Zarakhani,61 thus, KA,C,298
= 6.2 was adopted for Nafion®. Further, it may be recalled that the study of Escoubes
and Pineri57 found the heat of adsorption of water vapor in Nafion® to be 52.3 kJ/mol at
λ < 4. Consequently, ∆Ho = −52.3 kJ/mol in Eq. 40 was adopted. With the above
parameters thus chosen from the literature, a choice of δ = 0.6 provides a good fit
between the theoretical model and the experimental data as shown in Fig. 3. Particularly
noteworthy is that the model captures the decrease in slope, or the effective activation
energy, at higher temperatures. This is due to incomplete acid dissociation at the higher

Chapter II 35
temperatures as discussed below, and may account for some of the discrepancy in
activation energies reported in the literature. Interestingly, as a result of this, the
theoretical model predicts a maximum in conductivity at higher temperatures, which
needs to be experimentally confirmed.
It is of interest to investigate, assuming of course that the acid dissociation
constant adopted above is reasonable, whether the sulfonic acid groups are completely
dissociated, as usually assumed, under different conditions of water uptake and
temperature. Thus, using Eq. (40) in (24), the degree of dissociation is plotted in Fig. 4
versus λ at different temperatures. It is noteworthy that even at low temperatures, the
dissociation is not complete for λ < 10. Further, as expected for an exothermic reaction,
the dissociation at higher temperatures typical of PEM fuel cells is incomplete even under
saturation conditions. At higher temperatures, thus, higher water contents are required
for adequate dissociation. These considerations are clearly of practical significance in
view of current efforts to develop higher temperature proton-exchange membranes.62
Conductivity in Water Vapor-Equilibrated Nafion®.-A predictive model for the dramatic
effect of RH on the conductivity of Nafion is, of course, crucial in studying and
optimizing the fuel cell performance. Figure II-5 compares the model developed here
with the data of Sone et al.35 for conductivity of Nafion®117 versus RH for water vapor
equilibrated membrane at three different temperatures. The agreement is seen to be very
good over 2 orders of magnitude, providing confidence in the soundness of the theoretical
approach. Further, the model predicts the effect of temperature on σ adequately in this
range. It is noteworthy that the parameter values determined as described above and
listed in Table II-1 remain unchanged, except for δ, which takes on a value of 5.5 for
water vapor equilibrated Nafion®. It may be recalled from a discussion of this parameter
that it would be expected to increase as the water content of the membrane declines. It
turns out, however, that a single value of for δ = 5.5 is adequate for fitting the data over
the entire range of RHs. As expected, its value is greater than that for the case of liquid
water equilibrated membrane. Although it is not yet possible to determine if this value
of δ is reasonable, it compares well to the value of δ = 3.7 for the case of Na+ cation
transport through the membrane, used by van der Stegen33 as a fitted parameter. Finally,
Chapter II 36
it is clear from this figure that RH has a very pronounced effect on the membrane
conductivity, and explains the precipitous drop in fuel cell performance at lower RHs.62
Effect of Temperature on Conductivity of Vapor-Equilibrated Nafion®.-The conductivity
of Nafion is strongly dependent upon temperature for a given partial pressure of water.
This aspect is important due to the current efforts to develop higher temperatures (≥
120ºC) PEM fuel cells that operate at or around ambient pressure,61 which would clearly
require membranes that perform adequately at lower RHs. Such is not the case, of
course, for conventional PFSAs such as Nafion®. Thus, Fig. 6 shows the data of Sumner
et al.34 for the conductivity of Nafion®117 as a function of temperature at a fixed partial
pressure of water (2.0 x 10⁴ Pa, i.e., a humidifier temperature of 60ºC) along with the
model predictions based on the parameters listed in Table II-1, with no additional fitted
parameters employed. It may be gleaned from this figure that if the temperature of a fuel
cell operating at 60ºC were raised, for instance, to around 100ºC, with the humidifier
temperature remaining at 60 ºC, its performance would drop hopelessly corresponding to
a decline in membrane conductivity of about two orders of magnitude. Malhotra and
Datta62 found this indeed to be the case, which is a major impediment in the development
of higher temperature ambient pressure fuel cells based on conventional PEMs.
Conclusions
A predictive transport model is proposed here for the conductivity of proton-
exchange membranes based on the dusty-fluid model founded on the generalized Stefan-
Maxwell equations and including diffusion and convection, the latter resulting from a
pressure and/or potential gradients. The theoretical model also incorporates
thermodynamic equilibrium analysis for dissociation of the pendant acid groups in the
presence of polar solvents such as water. Further, the physicochemical characteristics of
the membrane are included, as is a finite-layers BET model for the sorption isotherm of
the solvent by the membrane from vapor phase. The result is a robust model that is able
to provide reliable predictions for the membrane conductivity under a variety of
conditions of relative humidity and temperature, as well as for water-equilibrated
membranes. All the parameters employed in the calculations were obtained from the
Chapter II 37
literature, with only the BET parameters C and n2, as well as δ, the ratio of diffusion
coefficients representing interaction of the hydronium ion with water and that with the
membrane, employed as fitted parameters. Further, these fitted parameters have values
that appear justifiable. The described model should be useful in predicting and
optimizing the performance of PEM fuel cells.
Acknowledgement
The financial support for this work provided by the H Power Corp. under Naval
Surface Warfare Center (NSWC) Contract No. N00167-99-C-0002 is gratefully
acknowledged.

Chapter II 38
References 0 W. Grot, in Encyclopedia of Polymer Science and Engineering, 16, 2nd. ed. (1989).
1 T. D. Gierke, G. E.. Munn and F. C.Wilson, J. Polym. Sci., Polym. Phys. Ed. 19, 1687
(1981).
2 S. W. Yeo and A. Eisenberg, J. of Applied Polymer Science, 21, 875 (1977).
3 J. Halim, F. N. Buchi, O. Haas, M. Stamm and G. G. Scherer, Electrochimica Acta,
39, 8/9 (1994).
4 B. Rodmacq, J. M. D. Coey, M. Escoubes, E. Roche, R. Duplessix, A. Eisenberg and
M. Pineri, in Water in Polymers, S. P. Rowland, Editor, Chapter 29, ACS Symposium
Series 127, ACS (1980).
5 H. L. Yeager and A. Steck,, J Electrochem Soc., 128, 1880 (1981).
6 K. A. Mauritz, C. J. Hora, A. J. Hopfinger, in Ions in Polymers, A. Eisenberg, Editor,
Chapter 8, Advanced Chemistry Series 187, American Chemical Society,
Washington, DC (1980).
7 S. R. Lowry and K. A. Mauritz, J.Am. Chem. Soc., 102, 4665 (1980).
8 T. D. Gierke, J Electrochem. Soc., 124, 319(C) (1977).
9 W. Y. Hsu, J. R. Barley and P. Meakin, Macromolecules, 13, 198, (1980).
10 V. K. Dayte, P. L. Taylor and A. J. Hopfinger, Macromolecules, 17, 1704 (1984).
11 K. A. Mauritz and C. E. Rogers, Macromolecules, 18, 483 (1985).
12 P. Aldebert, B. Dreyfus, G. Gebel, N. Nakamura, M. Pineri and F. Volino, J. Phys.
France, 49, 2101 (1988).
13 M. Falk, Can. J. Chem. 58, 1495 (1980).
14 T.D. Gierke and W.Y. Hsu, Perfluorinated Ionomer Membrane, A. Eisenberg and H.
L. Yeager, Editors, American Chemical Society, Washington, DC (1982).
15 W. Y. Hsu and T. D. Gierke, Macromolecules, 15, 101 (1982).
16 F. Helfferich, Ion Exchange, McGraw-Hill, New York (1960).
17 N. Lakshminarayanaiah, Transport Phenomena in Membranes, Academic Press, New
York (1969).
18 E. Riande, in Physics of Electrolytes, Vol. 1, J. Hladik, Editor, p. 401, Academic
Press, New York (1972).

Chapter II 39
19 P. Meares, J. F. Thain, and D. G. Dawson, in Membranes. A Series of Advances, G.
Eisenman, Editor, p. 55, Marcel Dekker, New York (1972).
20 O. Kedem and A. Katchalsky, Trans. Faraday Soc., 59, 1918 (1963).
21 A. Katchalsky and P. F. Curran, Nonequilibrium Thermodynamics in Biophysics,
Harvard University Press, Cambridge (1965).
22 M. Verbrugge, and R. Hill, J. Electrochem. Soc., 137, 886 (1990).
23 E. H. Cwirko and R. G. Carbonell, J. Membrane Sci., 67, p. 227 (1992).
24 M. A. Scattergood and E. N. Lightfoot, Trans. Faraday Soc., 64, 1135 (1968).
25 E. N. Lightfoot, Transport Phenomena and Living Systems, Wiley, New York (1974).
26 P. N. Pintauro and D. N. Bennion, Ind. Eng. Chem., Fundam., 23, 230 (1984).
27 K. S. Spiegler, Trans. Faraday Soc., 54, 1408 (1958).
28 A. G. Guzmán-Garcia, P. N. Pintauro, M. W. Verbrugge and R. Hill, AIChE Journal,
36, 1061, (1990).
29 P. Pintauro and Y. Yang, in Tutorials In Electrochemical Engineering- Mathematical
Modeling, R. F. Savinell, J. M. Fenton, A. West, S. L. Scanlon, J. Weidner, Editors,
PV 99-14 p.178 The Electrochemical Society Proceeding Series, Pennington , NJ
(1999).
30 J. S. Newman, Electrochemical Systems, 2nd ed., pp. 255, 299, 461, Prentice Hall,
Englewoods Cliffs, NJ (1991).
31 J. A. Wesseling, P. Vonk, G. Kraaijeveld, Chem. Eng. J., 57, 75, (1995).
32 J. H. G. van der Stegen, A. J. van der Veen, H. Weerdenburg, J.A. Hogendoorn and
G.F. Versteeg, Chem. Eng. Sci., 54, 2501 (1999).
33 J. J. Sumner, S. E. Creager, J. J. Ma, and D. D. DesMarteau, J. Electrochem. Soc.,
145, 107 (1998).
34 Y. Sone, P. Ekdunge and D. Simonsson, J. Electrochem. Soc., 143, 1254 (1996).
35 C. S. Fadley and R. A. Wallace, J. Electrochem. Soc., 115, 1264 (1968).
36 D. Morris and X. Sun, J. Applied Polymer Science, 50, 1445 (1993).
37 T. E. Springer, T. A. Zawodzinski, S. Gottesfeld, J. Electrochem. Soc., 136, 2334
(1991).
38 M Eikerling, A. A. Kornyshev, and U. Stimming, J. Phys. Chem. B, 101 1997.
39 D. M. Bernardi and M. W. Verbrugge, AIChE J., 37, 1151 (1991).

Chapter II 40
40 S. J. Paddison., R. Paul, and T. A. Zawodzinski Jr., J. Electrochem. Soc., 147, 617
(2000).
41 X.-D. Din and E. E. Michaelides, AIChE J., 44, 35 (1998).
42 E. A. Mason and A. P. Malinauskas, Gas Transport in Porous Media: The Dusty-Gas
Model, p. 142, Elsevier, Amsterdam (1983).
43 A. Eisenberg, and J. S. Kim, Introduction to Ionomers, Wiley-Interscience, (1998).
44 R. Jackson, Transport in Porous Catalysts, Elsevier, Amsterdam (1977).
45 R. Datta, and V. R. Kotamarthi, AIChE J., 36, 916, (1990).
46 T. A. Zawodzinski, M. Neeman, L. O. Sillerud, and S. Gottesfeld, J. Phys. Chem., 95,
6040 (1991).
47 F. A. Williams, Am. J. Phys., 26, 467 (1958).
48 P. Futerko and I.-M. Hsing, J. Electrochem. Soc., 146, 2049 (1999).
49 J. T. Hinatsu, M. Mizuhata, and H. Takenaka, J. Electrochem. Soc., 141, 1493 (1994).
50 A. W. Adamson and A. P. Gast, Physical Chemistry of Surfaces, 6th ed., p.622, Wiley
Interscience, New York (1997).
51 R. S. Yeo and H. L. Yeager, in Modern Aspects of Electrochemistry, No. 16, B. E.
Conway, R. E. White, and J.O’M. Bockris, Editors, p. 437, Plenum Press, New York
(1985).
52 T. A. Zawodzinski, C. Derouin, S. Radzinski, R. J. Sherman, V. T. Smith, T. E.
Springer and S. Gottesfeld, J. Electrochem. Soc., 140, 1041 (1993).
53 K. K. Pushpa, D. Nandan, and R. M. Iyer, J. Chem. Soc., Faraday Trans. I, 84(6),
2047 (1988).
54 J. J. F. Scholten, Studies in Surface Science and Catalysis, 79, (1993).
55 J. Divisek, M. Eikerling, V. Mazin, H. Schmitz, U. Stimming and Yu. M. Volfkovich,
J. Electrochem. Soc., 145, 2677 (1998).
56 M. Escoubes and M. Pineri, in Perfluorinated Ionomer Membranes, A. Eisenberg and
H. L. Yeager, Eds. ACS Symposium Series No. 180, p. 9, American Chemical
Society, Washington, DC (1982).
57 Z. Twardowski, H. L. Yeager, and B. O’Dell, J. Electrochem. Soc., 129, 328 (1982).
58 M. Misono and T. Okuhara, Chemtech., 23, November, (1993).

Chapter II 41
59 M. Liler, Reaction Mechanisms in Sulphuric Acid, Academic Press, New York
(1971).
60 M. I. Vinnik and N. G. Zarakhani, Dokl. Akad. Nauk SSSR, 152, 1147 (1963).
61 S. Malhotra and R. Datta, J. Electrochem. Soc., 144, L23-L26, (1997).

Chapter II 42
Table II-1. Parameter Values Employed in Model for Nafion® Membrane
Parameter Value Units Comments/Reference
EW 1100 g/equiv. Morris and Sun37
ρ0 2.05 g/cm3 Morris and Sun37
S 210 m2/cm3 Divisek et al.56
λm 1.8 Calculated from Eq. (36) and S
C 150 Fitted for BET adsorption isotherm, Fig. 2
n2 13.5 Fitted for BET adsorption isotherm, Fig. 2
λ 0 1.9 Morris and Sun37
q 1.5 Gierke and Hsu15; Newman31 p. 461
λsatliq 23 Hinatsu et al.50
KA,C,298 6.2 Vinik and Zarakhani61
∆Ho −52.3 kJ/mol Escoubes and Pineri57
Eη 14 kJ/mol Activation energy for viscosity of water
λ1,2980 349.8 S.cm2/equiv. Newman,31 p. 255
δsatliq 0.6 Fitted for liquid-equilibrated conductivity
δsatvap 5.5 Fitted for vapor-equilibrated conductivity

Chapter II 43
Figure II-1. A “dusty fluid model” depiction a proton-exchange membrane (PEM).
The polymer matrix along with an acid groups are viewed as “dust” particles comprising
the PEM. The membrane imbibes a polar solvent BH (e.g., HOH, CH3OH), that solvates
the protons from the pendant acid HA forming BH2+ that serves as the charge carrier.
-A
-+
+
-A+
- A +
- A
- A +
-A
-A
-A+
-A
- A
- B + +
+ - B
-B ++
-B+ +
+ - B
+-B +-B-B ++
-B++ - B
+ + +-B +-B
+-B
PolymerMatrix
AH = Acid Group; BH = Solvent; = H+
Chapter II 44
Figure II-2. Adsorption isotherm for water uptake by Nafion®117 from water vapor.
The finite layers BET isotherm is compared with the data of Zawodzinski et al.53 at 30ºC
and that of Morris and Sun37 at 25ºC for parameters listed in Table II-1.
0
5
10
15
0 20 40 60 80 100
BET Finite Layers Model25 ºC, Morris and Sun (1993)30 ºC, Zawodzinski et al. (1993)
RH %
λ

Chapter II 45
Figure II-3. Experimental σmax for Nafion®115 immersed in liquid water versus
inverse temperature along with theoretical predictions for parameters listed in Table II-1.
0.1
0.15
0.2
0.25
0.3
0.0026 0.0028 0.003 0.0032 0.0034
Exp.Model
σS/
cm
1/T (K-1)

Chapter II 46
Figure II-4. Predicted equilibrium fractional dissociation of sulfonic acid groups in
Nafion® as a function of the water uptake at different temperatures.
0
0.2
0.4
0.6
0.8
1
0 5 10 15 20
T = 298 K
T = 323 K
T = 353 K
α
λ
Chapter II 47
Figure II-5. The experimental results of Sone et al.35 for σ of Nafion®117 equilibrated
in water vapor versus RH or water vapor activity at different temperatures along with
theoretical predictions for parameters listed in Table II-1.
0.0001
0.001
0.01
0.1
0 20 40 60 80 100
Theo., T = 343 KTheo., T = 333 KTheo., T = 318 KExp., T = 343 KExp., T = 333 KExp., T = 318 Kσ
RH %
(S/c
m)

Chapter II 48
Figure II-6. Effect of temperature on conductivity of Nafion®117 at a fixed partial
pressure of water (2.0 x 10⁴ Pa, i.e., humidifier temperature = 333K). The data of
Sumner et al.34 are plotted along with model predictions for parameters listed in Table II-
1.
0.0001
0.001
0.01
0.1
320 330 340 350 360 370 380 390
Sumner et. al. (1998)Model Prediction
σ
T (K)
(S /
cm)

Chapter III 49
III. PEM FUEL CELL AS A MEMBRANE
REACTOR#,‡
Abstract
The H2-O2 proton exchange membrane (PEM) fuel cell, among numerous other potential
applications now slated to provide the motive power for the next generation of highly efficient
and largely pollution-free automobiles, is an incomparable membrane reactor, comprising an
exquisitely designed membrane-electrode-assembly (MEA), a five-layer composite of two gas-
diffusion layers, two supported-catalyst layers, and a proton-exchange membrane. The device
allows catalytic reaction and separation of hydrogen and oxygen as well as protons and
electrons. This paper describes the structure and performance of the PEM fuel cell considered as
a membrane reactor and develops an analytical transport-reaction model that, despite some
assumptions, captures the essential features of the device very well. The key assumptions are
that transport resistance as well as ohmic drop are negligible in the catalyst layer. While the
latter is defensible, the former causes deviations at high current densities. Nonetheless, the
model predicts the fuel cell performance well with parameter values reported in the literature.
# Paper presented at ICCMR-2000, Zaragoza, Spain and published in Catalysis Today, 67 (2001) 15.
‡ The Contributions of S. Malhotra, J. Zhang, and R. Datta are gratefully acknowledged.

Chapter III 50
Introduction
Fuel cells offer the potential of revolutionizing electrical energy production by affording
highly efficient and largely pollution-free power generation systems for both transportation and
stationary applications1,2. Proton-exchange membrane (PEM) fuel cells3, operating on H2 and O2
(from air), are the focus at this time, although other fuel cells, namely, molten carbonate fuel
cells (MCFCs), solid-oxide fuel cells (SOFCs) and direct methanol fuel cells (DMFCs) also hold
promise for various applications4,5. The PEM fuel cell is particularly attractive because of mild
operating conditions (50 - 80 ºC temperature, 1 - 3 atm. pressure), low Pt loadings, relative
robustness, long life, and the fact that all of its components are solid. It comprises an intricate
membrane-electrode-assembly (MEA), a five-layer composite of two gas-diffusion layers that
allow simultaneous transport of gases and water while collecting current, two three-phase
supported-catalyst (typically Pt/C) layers, and a proton-exchange membrane, typically a
perfluorosulfonic acid (PFSA) polymer such as Nafion®. It is, in fact, a superb example of a
catalytic membrane reactor performing a variety of reactions and separations. The MEA
nanostructure has evolved over a considerable period of time to now provide exceptional
performance. Thus, many of the fabrication issues for attaining superior performance have been
resolved. However, before wide-spread usage of PEM fuel cells becomes a reality, there still are
a number of technical/cost challenges that remain to be addressed.
A key limitation is that the proton conductivity of the PEM is strongly dependent upon its
water content, calling for elaborate water management and limiting the practical operating
temperature to 80 ºC to avoid membrane drying6. At these low operating temperatures, however,
the Pt anode is particularly susceptible to poisoning by even traces of CO in the anode H2 feed7.
However, since the storage and transportation of H2 fuel at this time is impractical, conventional

Chapter III 51
hydrocarbon or alcohol fuels must be locally reformed into a H2 rich reformate gas that cannot
be completely rid of CO. These catalytic processes, while well-developed for the industrial
scale, have special requirements for fuel cell applications, thus offering innumerable challenges
and opportunities in catalysis and reaction engineering8,9. Further, while the field of membrane
reactors is of relatively recent vintage10, fuel cells that possess many of the characteristics of
membrane reactors have been around for well over a century. Thus, the field of membrane
reactors can glean much from a careful study of this intriguing device.
The transport-kinetic modeling of fuel cell viewed as a catalytic membrane reactor52 can
shed further light on its design and operational factors, which is our objective here. Theoretical
modeling of transport and reaction in fuel cells is challenging due to the complexity of the device
and the numerous design and operating parameters that can influence its performance. Models
describing gas-diffusion electrodes and processes therein have been in development since the
1960s11,12,13,34. Theoretical models of fuel cell performance tend to be either rather complex
requiring considerable numerical effort, e.g., the comprehensive model of Bernardi and
Verbrugge14,15 or semi-empirical16, or empirical17. The former are useful for a detailed
mechanistic understanding of the factors that influence the fuel cell performance, while the latter
are useful for simply predicting the overall performance of individual fuel cells in a stack18. Fuel
cell models of varying degrees of detail and complexity are also given by Leddy and
Vanderborgh19, Ridge et al.36, Fuller and Newman20, Nguyen et al.21, Springer et al.22,23,24,
Weisbrod et al.37 and Perry et al.25. Our objective here is to develop an analytical model for
PEM fuel cells by drawing parallels with membrane reactors and incorporating transport and
reaction details coupled with judicious assumptions to provide an analytical model that is both
simple to use as well as quite complete. Some aspects, e.g., MEA structure and electrocatalysis,

Chapter III 52
are described in sufficient detail to introduce the catalytic membrane reactor technologist to the
PEM fuel cell.
MEA Nanostructure
The MEA structure comprising of gas-diffusion layer/anode catalyst/electrolyte/cathode
catalyst/gas-diffusion layer composite is shown in Figure III-1. In a nutshell, H2 is split into
protons and electrons at the anode electrocatalyst. Protons find their way to the cathode through
the proton-exchange membrane, while the electrons arrive at the cathode via the external circuit
after performing useful work. Here, aided by electrode potential, the protons and electrons
recombine with O2 at the catalyst surface to form water. The MEA is sandwiched between two
graphite plate current collectors, with machined microchannels, as in microchannel reactors26 for
gas distribution.
The gas-diffusion backing (GDB) (layers D and E) serves as the electron collector and a
permeator for reactant gases as well as for liquid water. The proton-exchange membrane (PEM)
(layer B) requires water for effective proton transport, which limits the practical operating
temperature of atmospheric fuel cells to about 80 ºC (when water vapor pressure is roughly half
an atm). However, if the pores of the gas-diffusion layers get filled with liquid water, transport
of oxygen and hydrogen to the catalyst layers is impeded, severly limiting the fuel cell
performance. This is avoided by imparting hydrophobicity to the gas-diffusion layers to allow
gas and liquid phases to co-exist within pores. The gas-diffusion backing typically involves a
carbon cloth, about 350 µm in thickness and woven from carbon fibers, on the one side of which
the catalyst layer is deposited. The carbon cloth is treated with 40 - 70 wt.% poly-
tetrafluoroethylene (PTFE, e.g., Teflon®) mixed with 10 - 20 nm carbon particles followed by

Chapter III 53
sintering to melt the PTFE and coat the carbon fibers27 and rendering it quite hydrophobic. The
initial porosity of the carbon cloth is 70 - 80%, but its finished porosity is 55 - 65%.
The catalyst layer is 5-50 µm in thickness and contains Pt microcrystallites, roughly 2 - 4
nm in diameter, supported on the surface of largely non-porous carbon black particles, around 30
nm in diameter, at a Pt/C loading of about 20 - 40 wt.% and ≤ 0.4 mg Pt/cm2 of MEA area. The
interstitial spaces among the carbon particles are filled with an ionomer (e.g., Nafion®) solution
to allow proton transport28, and occasionally with some PTFE, although the latter may not be
necessary for thin catalyst layers29. The deposition of the catalyst layer on the gas-diffusion
electrode is accomplished by painting, spraying, or filtration, of the catalyst/ionomer dispersion.
A polymer electrolyte membrane (e.g., Nafion® 115 or 117), 50-175 µm thick, is hot-pressed at a
temperature slightly above its glass-transition temperature between the two electrodes such that
the catalyst layers are on either side of the membrane. Alternate fabrication procedures are also
employed29.
The electrons produced at the anode catalyst surface are conducted via the carbon
catalyst support and the carbon fibers of the gas-diffusion backing to the current collector and
thence to the external circuit. The protons diffuse through the ionomer solution within the
catalyst layer and then through the proton-exchange membrane to arrive at the cathode. The
catalyst layer is, thus, designed to maximize the interfacial area among the its various phases,
namely, the catalyst crystallites, the carbon support, the hydrophilic region consisting of
ionomer, and any hydrophobic region containing Teflon®. In addition to good interfacial contact
among the layers, the continuity of the respective phases for electronic and protonic conduction
is also essential. If there is too little ionomer, for instance, the proton conduction pathway will

Chapter III 54
be fragmented. On the other hand, too much ionomer could compromise electronic conductivity
by further distancing the carbon particles and increasing the path length for proton conduction.
The PFSA membranes such as Nafion produced by Du Pont (and similar membranes
produced by Dow, W. L. Gore, and Asahi Glass) consist of a fluorocarbon, Teflon®-like,
backbone with side-chains culminating in –SO3H groups. In the presence of water, these
sulfonic acid groups dissociate, forming hydronium ions30 responsible for proton conduction.
There are many studies on the nanostructural aspects of the Nafion membranes. Based on small
angle X-ray diffraction and other characterization studies, Gierke and co-workers31,32 proposed
in their “cluster–network model” that the incompatibility of the fluorocarbon and the hydrophilic
phase leads to the formation of inverted micelles, 3 - 5 nm in diameter, which are interconnected
through short narrow channels, 1 - 2 nm in diameter, to provide a network for proton diffusion
interspersed throughout the fluorocarbon matrix. The conductivity of Nafion® is extremely
sensitive to relative humidity (RH), being essentially an insulator below a threshold of about
10% RH and rising through several orders of magnitude to about 0.07 Siemens/cm at 80 ºC and
100% RH6. The mechanism involving ordinary diffusion and Grotthus chain conduction
explaining high proton conductivity in aqueous solutions is discussed by Glasstone et al.33 and
Bockris and Reddy 34. Nafion® also deters short-circuiting of electrons, as well as cross-over of
reactants, its permeability of H2 and O2 being of the order of only 10−10 mol/cm2 s atm3.
Constitutive Relations
The mass balance equations for species i (i=1,2,…,n)
1
q
i irρ ρρ
ν=
∇ ⋅ = ∑N [1]

Chapter III 55
need to be solved subject to appropriate boundary conditions in the various layers of the fuel cell
MEA (Figure III-1), for which flux relations for the different layers are needed as well as the
kinetics of the anode and cathode reactions. Since the constitutive relations used here are
somewhat different from those used conventionally, these are first discussed. Once the species
fluxes are determined, the current density is obtained from
n
i ii
F z= ∑i N=1
[2]
Dusty-Fluid Model
The flux model for Ni in a porous layer α is assumed here to be the dusty-fluid model
(DFM)35 (Mason and Malinauskas, 1983), written in the form (Thampan et al., 2000)6
0
1 1
1 ( )
( 1, 2,..., )
n nei i i
T i j i i j j je e ej jij iM iMj i
c c Bc c p c z FRT cD D D
i n
µ φµ= =
≠
− ∇ = − + + ∇ + ∇
=
∑ ∑NN N [3]
where the electrochemical potential gradient on the left-hand side represents the driving force for
an electrochemical system, eT i T i iz Fµ µ φ∇ = ∇ + ∇ . The DFM includes ordinary diffusion
represented by Dije , membrane diffusion represented by DiM
e that accounts for the friction
between i and the membrane, as well as convective flux represented by the last term on the right-
hand side (rhs) of Eq. 3, which includes contributions both due to a pressure gradient (d’Arcy
term) as well as a potential gradient (electroosmosis). The d’Arcy permeability and the effective
diffusion coefficients in the DFM for layer α are given by the relations
1 0( )e qij ij ijD K D Dα α αε ε= = − ; 0
eiM iMD K Dα= ; 2
0 0( ) / 8qB aα α α αε ε= − [4]

Chapter III 56
where εα is the void fraction of layer α, εα0 is the corresponding percolation threshold, and the
critical (or Bruggeman) exponent q = 1.56 and aa is the mean pore radius. Summing Eq. 3 over
all species, the Stefan-Maxwell terms cancel out, resulting in
1 1
n nj
j j ej j jM
RTp c z FW D= =
∇ + ∇Φ = −
∑ ∑
N [5]
where
0
11
nhe
h hM
B cRT xWDµ =
≡ + ∑ [6]
Using Eq. 5 in Eq. 3 to eliminate the convective driving force on its right-hand side, the DFM
may be written in the following alternate form
0
1 1
1 ( )
( 1, 2,..., )
n njei i i
T i j i i je e e ej jij iM iM jMj i
c c B RTc cRT cD D D W D
i n
µµ= =
≠
− ∇ = − + −
=
∑ ∑NNN N
[7]
This form of DFM contains the driving force for i on the left-hand side, and fluxes of all species
on the right-hand side. It may, of course, be inverted to alternately provide flux of species i in
terms of the driving forces of all species6. However, if the flux ratios Nj/Ni of the various
species j with respect to the key species i are known, as, e.g., through reaction stoichiometry (as
in the case for fuel cells), the following Fickian form for flux may be obtained
1 e ei i i T iD c
RTµ= − ∇N ; (i=1,2,…,n) [8]
where the effective diffusivity is
0
1 1
1 1 1 1
( 1, 2,..., )
n nj ji
j ie e e e ej ji ij i iM iM jM ij i
c B RTc cD cD D D W D
i n
µ= =≠
= − + −
=
∑ ∑N NN N [9]

Chapter III 57
These results are used to obtain permeability of the gas-diffusion layers as well as the
conductivity of the proton-exchange membrane.
Transport of Gases in Gas-Diffusion Backing (Layers D and E)
Although it has been conventional to use Stefan-Maxwell equations to describe the gas-
phase diffusion in GDB36,22,14,37, these equations include only the molecular diffusion and are, in
general, incomplete for description of transport of gases in porous media. Thus, the dusty-gas
model (DGM)38,35, obtained simply from the DFM described above specialized to the case of
gases is utilized here. For the case of gaseous transport, the driving force in DFM reduces simply
to ei T i ic pµ∇ = ∇ . Further, the membrane diffusion coefficient DiM
e simply becomes the familiar
Knudsen diffusion DiKe coefficient for gases. Actually, the effective diffusivity in a partially
liquid-filled porous layer α is appropriately given by39
1(1 ) (1 )e q e q q ei w iG w iL iL w iGD q D q K D q Dα κ= − + ≈ − [10]
where DiL is the liquid-phase diffusivity, and DiGe is the effective gas-phase diffusivity for the
dry porous layer. Equation 10 accounts for the simultaneous transport of species i through the
residual gas pore space as well as any through the liquid phase. The approximation on the right-
hand side of Eq. 10 is made here, however, assuming that the flux contribution of the aqueous
phase within the gas-diffusion layers is unimportant due to the low solubility (small partition
coefficient, κiL) of the gases. The gas-phase diffusivity in Eq. 10 is obtained from Eq. 9, written
in terms of partial pressures, however, rather than concentrations
0
1 1
1 1 1 1n nj ji
j ie e eo e ej jiG iK ij i iK i jKj i
p Bp pD D D WD Dµ= =
≠
= + − −
∑ ∑
N NN N
[11]

Chapter III 58
Here the pressure-independent ordinary diffusivity and the effective Knudsen diffusivity40
1eo eij ij ijD pD pK D≡ = ; 0
8eiK
i
RTD KMπ
= [12]
where the dusty-gas structural parameters for the dry porous layer for Knudsen diffusion is
0 0( ) (2 / 3)qK aα α αε ε= − .
As done by others13, it is next assumed that due to the presence of liquid water in the
pores of the gas-diffusion backing, the gas phase is saturated with water vapor, i.e., the partial
pressure of water is equal to its vapor pressure at the fuel cell temperature ( ow wp p= ). Thus,
under isothermal conditions, there is no partial pressure gradient of water vapor in GDB.
Although this does not necessarily imply that the water vapor flux in the gas phase is zero, for
simplicity it is further assumed here that Nw = 0. In other words, water transport is assumed to
occur entirely through the liquid phase. Further, for N2 in the case of cathode and CO2 in the
case of anode, denoted as the diluent species d, Nd = 0. Using this in Eqs. 11 and 6, the effective
diffusivity of i (H2 in the case of anode, or O2 in the case of cathode)
0
0
11 1
1
w de ewK dKw d
e eo eo eiG iw id iK i w d
e e eiK wK dK
B p pD Dp p
D D D D B p p pD D D
µ
µ
+ +
= + + + + +
[13]
Transport of Protons in Proton-Exchange Membrane (Layer B)
We have recently shown6 that for binary case of proton transport in a PEM consisting of
water as the solvent (species w), and the hydronium ion (H3O+), denoted as species H+, as the
charge carrier, and for spatially homogeneous sulfonic acid groups within PEM coupled with
local electroneutrality, the electrochemical potential gradient simply becomes potential gradient.

Chapter III 59
Further, for equimolar counter-diffusion and for +He e
wMMD D≈ due to the similarity between w
(water) and H+ (hydronium ion), the effective diffusivity (Eq. 9) reduces to
+ + +
eH H H
1 1 1e e
w MD D D
≈ + [14]
namely, the Bosanquet equation40. Further, with + +2 e
H H( / )F RT D cσ = , and + HA,0H
c c α= , and in
terms of the equivalent conductance, + + +0 2H H H
/w
F z D RTλ ≡ , the conductivity of PEM becomes
+
0H ,298
0 HA,01 1( ) exp
1 298q
B B
Ec
R Tµλ
σ ε ε αδ
= − − − + [15]
where the ratio + +H H/e e
MwD Dδ ≡ , and the degree of dissociation in terms of the equilibrium
constant KA,C for the protonation reaction, AH + H2O H3O+ + A− , is
2
A,
A,
( 1) ( 1) 4 (1 1/ )2(1 1/ )
C
C
KK
λ λ λα
+ − + − −=
− [16]
where
A,C A,C,2981 1exp
298
oHK KR T
∆ = − −
[17]
The volume fraction of water in PEM is related to the number of water molecules sorbed per –
SO3H group, λ,
BM
w
VV
λελ
=+
[18]
where 0/MV EW ρ≈ = 537 cm3/mol, and V w = 18 cm3/mol. The water molecules sorbed are
given in terms of relative humidity (RH, or aw), by nw–layer Brunauer-Emmett-Teller (BET)
equation41 (Adamson and Gast. 1997)

Chapter III 60
w
1
1
[ /(1 )][1 ( 1) ]1 ( 1)
w wn nw w w w w w
nm w w
Ca a n a n aC a Ca
λλ
+
+
− − + +=
+ − − [19]
where the RH or the water vapor activity, / ow w wa p p= , mλ is the water loading at monolayer
coverage, and nw is the total number of water layers in the pores at saturation. We have recently
shown that the above model for proton conduction in PEM provides an excellent correlation with
a variety of experimental data6.
Electrocatalysis: General Considerations
Some of the general characteristics of electrocatalytic reactions are first presented,
including how their rates are influenced by potential. Consider the electrode surface reaction ρ
1
A e 0i
nz
i i eii e
vρ ρν −
−
−
=≠
+ =∑ [20]
among n species, Aizi , carrying a charge zi, where
eρν − is the stoichiometric coefficient of the
electron in reaction ρ. Thus, e
nρρν − = + for an anodic reaction while
enρρ
ν − = − for a cathodic
reaction, where nρ is the number of electrons involved in the reaction ρ. There is, of course,
overall charge balance in the electrode reaction, i.e.,
1
n
i i eii e
zρ ρν ν −
−=≠
=∑ [21]
For an elementary electrode reaction ρ, the net rate of reaction per unit supported metal
catalyst surface area, rρ* (e.g., mol/ cm2 Pt. s), from the thermodynamic formulation of the
transition-state theory (TTST)42 is
* * * * *
1 1
i ir n
i ii i r
r r r k a k aρ ρν νρ ρ ρ ρ ρ
−
= = +
= − = −∏ ∏ [22]

Chapter III 61
where the first r of the total of n species are assumed to be the reactants while the remaining are
products. For surface species, the activity in Eq. 22 corresponds to surface activity, which for an
ideal surface is just the fractional surface coverage. The potential dependence of the rate
constants
0
* *, exp e
Fk k
RTρ ρ
ρ ρ
β ν η−
Φ
=
; 0
* *,
( 1)exp e
Fk k
RTρ ρ
ρ ρ
β ν η−
Φ
− =
[23]
where k ρ, Φ0
* is the rate constant at the equilibrium electrode potential Φ 0, i.e.,
, 0
0
0
, 0 0 ,*, exp exp
oT
oST eB R
H F Ek Tk e Ah RT RT
ρρ ρ ρρ
ρ ρ
β νκ
γ
±Φ=
−±∆
Φ= ΦΦ ±
∆ − Φ = − ≡ −
[24]
and similarly for k ρ, Φ0. These equations clearly show that the potential has a powerful effect on
the Gibbs free energy of activation and hence the rate constants of electrodic reactions, in
addition, of course, to the strong effect of temperature. In the above, 0Φ is a function of
composition as given by the Nernst equation, 0η ≡ Φ − Φ is the electrode overpotential, and βρ
is the so-called symmetry factor for the reaction ρ, also referred to as the transfer coefficient
resulting from the application of linear free energy relationship, universally assumed to be one-
half for elementary reactions42. The second form of the rate constant Φ 0 in Eq. 24 is the usual
Arrhenius form, for which the pre-exponential factor and activation energy may be obtained by
comparison with the TTST form. It may be noted that the effect of potential on the forward and
reverse rate constants is such that one increases while the other reduces with overpotential. The
ratio, /K k kρ ρ ρ= , namely the equilibrium constant for the elementary reaction ρ
0, exp e
FK K
RTρ
ρ ρ
ν η−
Φ
=
[25]

Chapter III 62
is also greatly influenced by potential.
Under open-circuit conditions for the given composition, η = 0, rρ* = 0, and, thus, from
Eqs. 22 and 23,
0 0
* * * *0 , 0 ,
1 1
i ir n
i ii i r
r k a r k aρ ρν νρ ρ ρ ρ
−Φ Φ
= = +
= = =∏ ∏ [26]
i.e., the cell potential assumes the equilibrium value Φ 0, corresponding to the given composition
and temperature, so that the forward and reverse reactions rates are equal and a dynamic
equilibrium is established. This may be rearranged into the well-known Nernst equation,
00
11
lnn
ii
ie i
RT aF
ρν
ρν − =
≠
Φ = Φ + ∏ [27]
where Φ 0o is the standard equilibrium electrode potential corresponding to unit species activities.
The above kinetic equations may be written in the form of the Butler-Volmer equation as
follows. Using Eqs. 23 and 26, Eq. 22 may be written as
* *0
*0
( 1)exp exp
( 1)exp exp
e e
e e
F Fr r
RT RT
F Fr
RT RT
ρ ρρ ρρ ρ
ρ ρρ ρρ
β ν η β ν η
β ν η β ν η
− −
− −
− = − − = −
[28]
or in a pseudo-irreversible form
* *
1
ir
ii
r k a ρνρ ρ
−
=
= ∏ [29]
where the effective rate constant is given by the Butler-Volmer form
0
* *,
( 1)exp expe e
F Fk k
RT RTρ ρρ ρ
ρ ρ
β ν η β ν η− −
Φ
− = − [30]
For the common value βρ = 1/2, this may be written in the more convenient alternate form

Chapter III 63
0
* *, 2sinh
2e
Fk k
RTρ
ρ ρ
ν η−
Φ
= [31]
The corresponding current density of i* (A/cm2 catalyst surface) is obtained from
* * * *
1 1
n n
i i i i ei ii e i e
i F z N Fr z F rρ ρ ρρν ν −
− −= =≠ ≠
= = =∑ ∑ [32]
where the current direction is determined by the stoichiometric coefficient of electrons. The
second equality in Eq. 32 stems from the assumption of the absence of diffusional limitations,
while the third equality utilizes Eq. 21. Similarly, the exchange-current density, namely the
current in the forward and reverse direction under open circuit conditions, * *0 0ei F rρρ
ν −= , which
depends upon temperature and composition.
The current density i in terms of A/cm2 of geometric (MEA) area is *Mi iγ= and
i0 = γ Mi0* . Here, the ratio of electrochemically active metal catalyst surface area to the geometric
MEA area (cm2 Pt/cm2 geometric MEA area)56, also frequently referred to as the roughness
factor61.
γ M = ϕ I mM
6ϕ M
ρM dM
[33]
where ϕM accounts for the part of the metal crystallite of diameter dM which is not accessible for
reaction, e.g., the side which is in contact with the support, and ϕI is the fraction of the available
metal surface participating in electrocatalysis. This would be less than unity, e.g., if not all of
the available metal area is in contact with the ionomer, and hence depends upon ionomer loading
mI. Using the above, the current density is related to exchange-current density and over-
potential by

Chapter III 64
*
*0 0
2sinh2
eFi i
i i RTρ
ν η− = = [34]
For large overpotential η, this reduces to the familiar Tafel equation
0
exp2
eFi
i RTρ
ν η− ≈
[35]
whereas for small overpotential η, may be approximated by a linear form
0
eFi
i RTρ
ν η−
≈ [36]
Hydrogen Oxidation Reaction (HOR)
The catalytic hydrogen electrode reaction
H2 2H+ + 2e [37]
has been much studied43, but its mechanism and kinetics are still uncertain44,47. The two most
common mechanisms are the so-called Tafel-Volmer mechanism and the Heyrovsky-Volmer
mechanism44. The former constitutes a Tafel step, namely, the dissociative chemisorption of
hydrogen, which is usually assumed to be the rate determining step (rds), followed by a Volmer
step involving dissociation of the adsorbed hydrogen atom to produce an electron and a solvated
proton, i.e.,
(Tafel step) 2S + H2 2S•H (rds) [38]
(Volmer step) S•H S + H+ + e− [39]
where S represents a catalyst site. A rate expression for the HOR is45
2
* * * 2exp expA A A AA A H A H
F Fr k c k cRT RT
α η α η+
= − −
[40]

Chapter III 65
The lack of an adsorption term in the denominator of this expression may be justified in view of
θS•H <<1. Following the development in the above section, for the effective transfer coefficient
of the overall HOR, 1/ 2A Aα α= = , this may be written in the pseudo-irreversible form
2
* *A A Hr k c= [41]
where
0
* *, 2sinh A A
A AFk k
RTα η
Φ
=
[42]
Further, from * *,0 0A AAe
i F rν −= with 2Ae
ν − = + (reaction 37), the reference exchange current
density, 0 2
*,0, , ,2 ( )A ref A ref H refi Fk T cΦ= . The reaction is very rapid, particularly as compared with
the oxygen reduction reaction at the cathode, with an exchange current density iA,0,ref* ≈ 1
mA/cm2 Pt3 at standard conditions, so that the overpotential due to the HOR is relatively small.
Even though the HOR reaction is very facile on Pt, the many species emanating from the
reformer can successfully compete with it for Pt sites. In particular, for reformed hydrocarbons,
anode feed may contain roughly 100 ppm CO, which adsorbs on Pt
S + CO CO•S [43]
Since the adsorption enthalpy of CO on Pt (−32 kcal/mol) is much higher than that for the other
species present, it may be considered as the most abundant surface species57. For instance, at
100 ppm, roughly 80% of the sites are occupied by CO. Under such conditions, therefore, the
rate of HOR must be modified to include (1 −θCO•S)2 on its right-hand side46. Thus, with
iA,0 = γ MAiA,0* , the exchange-current density
02
2
,2 *,0 , CO S ,0,
,
1 1(1 ) exp AHA M A A ref
H ref ref
Eci i
c R T Tγ θ Φ
•
= − − − [44]