design and development of a liquid piston stirling engine€¦ · · 2014-07-08design and...
TRANSCRIPT

Design and Development of
a Liquid Piston Stirling Engine
E90 Senior Design Project
Report May 2 2006.
BY: FRANK KYEI-MANU ALOYSIUS OBODOAKO
Advisor: Professor Carr Everbach
1

Abstract An alpha-type Liquid Piston Stirling engine with a maximum power output of 23W and an efficiency of 3.4% was designed, built and instrumented for demonstration purposes. Based on in-depth research and design optimization, engine parameters were determined and a particular design was drafted. All the engine parts were manufactured in the Engineering Department’s machine shop. The design was modified following initial testing and modified to improve performance. During the final two weeks of the project different sensor types were added to enable real-time data collection and processing. Furthermore, sufficient data was taken to characterize the fluidyne system. There is still a lot of work to be done in order to realize our initial project goals and it is our hope that the engine will be improved upon extensively in the coming years.
2

Acknowledgements
We owe Professor Carr Everbach a great deal of gratitude for his expertise, support
and advice during the entire process but more especially during the initial stages of
the project in getting us onto the right track. Secondly, we would like to thank Mr.
Grant Smith ‘Smitty’ for his help in machining several system components, in
ordering several system parts and directing us when it came to using the machines in
the departmental shop. Professor Fred Orthlieb was also very invaluable in moving
the project forward and his help in machining some of the system pieces when Smitty
was away is very much appreciated. To our E14 students, Paul Agyiri ’07 and Lauren
’07, we say thank you for testing the regenerative materials in order suggest what the
best material is for the purposes of our project. Finally to our peers, engineering
faculty members and friends who kept pushing us on, we say thank you.
3
Table of Contents
1. Introduction …………………………………………………………….. 6
1.1 Background Information …………………………………………….. 6
1.2 Project Objectives & Goals …………………….…………………….. 6
1.3 Why a Liquid Piston Stirling Engine……………………………………8
1.4 Liquid Piston Stirling Engines- A Historical Overview ..........................8
1.5 Basic Operation of a Stirling Engine……………………………………9
1.6 Basic Operation of the liquid piston Fluidyne Engine………………….13
1.7 Effects of Evaporation and Mean Pressure……………………………...14
1.8 Applications……………………………………………………………...15
1.9 Report Organization……………………………………………………..16
2. Theory …………………………………………………………………….. 16
2.1 Working Fluid and Pressure …………………………………….. 16
2.2. Operating Temperatures ........................…………………………….. 16
2.3 Displacer Frequencies……………………………………………….. 17
2.3.1. Derivation of Operating Frequencies…................................ 17
2.4 Tuning of Liquid Columns…………………….…………………….. 18
2.4.1. Derivation of Tuning Column length given Frequency………18
2.5 Power Output…………………………………………………………...21
2.6 Losses…………………………………………………………………...22
2.6.1. Viscous Losses………………………………………………..22
2.6.2. Power Losses in Fluid Flow…………………………………..23
2.6.3. Kinetic Flow Losses…………………………………………..23
2.6.4. Heat Losses……………………………………………………24
2.6.5 Shuttle Losses………………………………………………….25
2.6.6 Other Losses that could affect System………………………...25
2.7 The Regenerator and its Operation……………………………………...26
3. Design Process …………………………………………………………………...28
3.1 Our Design……………………………………………………………….28
3.1.1 Engine System Parameters………………………………………30
3.2 Components of the System………………………………………………32
4

3.2.1 Heat Exchanger…………………………………………………32
3.2.2 PVC…………………………………………………………….33
3.3.3 Displacer………………………………………………………..33
3.3.4 Pumping Column……………………………………………….34
3.3.5 Regenerator……………………………………………………..34
3.3.6 Connections…………………………………………………….34
3.3.7 Tuning Column…………………………………………………36
3.3.8 Unistrut Structure………………………………………………36
3.3.9 Summary of Design and Parameter sizes……………………....36
4. Construction and Assembly …………………………………………….. 38
4.1. Introduction …………………………………………………….. 38
4.2. Machine Shop Work Details …………………………………….. 38
4.2.1. Displacer……………..…………………………………….. 39
4.2.2. Six inch to three quarter inch end caps………………….........40
4.2.3. The Tuning Column …………………………………….. 40
4.2.4. The Regenerator …………………………………….. 40
4.2.5. The Heat Exchanger……………………….. ………………. 42
4.2.6. Carbide Silicate/Fibre Funnels……………………………… 43
4.2.7 Unistrut………………………………………………………..43
4.2.8 Insulating Float………………………………………………..44
4.2.9 Modifications…………………………………………………45
4.3. Data Acquisition System…………………………………………….. ..46
4.3.1. The Pressure Transducer……………………………...……...46
4.3.2 Thermocouples. .……………………………………..............47
4.3.3 Proximity Sensor……………………………………………..47
5. Results and Discussion…………………………………………………………47
6. Conclusions……………………………………………………………………..57
7. Further Work…………………………………………………………………...58
8. References………………………………………………………………………62
5

1. INTRODUCTION
1.1 Background Information
There is an ongoing campaign for the need for alternative energy sources to meet the
demands of today’s world. The abundance of solar energy especially in sub-Saharan
African is a resource that cannot be overlooked. This ever-present energy source is
however underutilized despite the many uses to which it can be put. It is with this in mind
that we intend to address one of the pressing needs in developing countries.
Residents in developing countries often cannot count on the availability of clean
drinking water due to the pollution of surface water sources such as rivers and lakes. (see
fig 1.1 overleaf). Thousands of deaths occur every year from water-borne diseases alone.
In countries with plentiful sunlight, heat energy powered by a constant supply of solar
energy could be used to pump well water. In addition, the water that is pumped could be
boiled by the same focused sunlight, thereby providing a continuous source of clean
water.
The purpose of this project is to design and implement a liquid piston Stirling engine
that outputs enough power to pump water from a depth of at least 7 feet. We also intend
to include a parabolic collecting mirror that will focus the sun’s energy to heat the
system. The system we plan to implement will use fluidyne technology, which is
currently underappreciated.
1.2 Project Objectives & Goals
The primary objectives of the project are:
• To build a liquid piston Stirling engine with a power output of at least 5W,
capable of pumping water to a height of at least 7 feet.
• To boil the water that has been pumped using focused sunlight.
• To choose a suitable design that incorporates mechanical simplicity with
sustainability within the limitations of a third-world society.
• To raise awareness about fluidyne technology as an alternative, low cost energy
source.
6
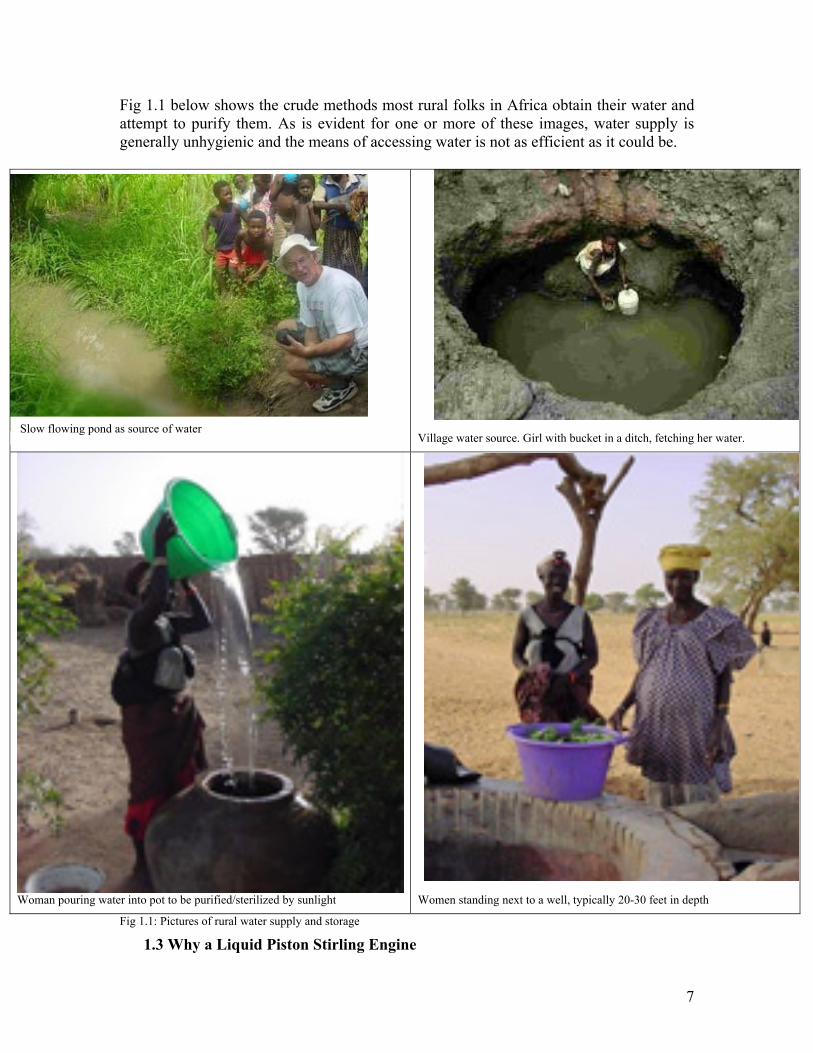
Fig 1.1 below shows the crude methods most rural folks in Africa obtain their water and attempt to purify them. As is evident for one or more of these images, water supply is generally unhygienic and the means of accessing water is not as efficient as it could be.
Village water source. Girl with bucket in a ditch, fetching her water. Slow flowing pond as source of water
Woman pouring water into pot to be purified/sterilized by sunlight Women standing next to a well, typically 20-30 feet in depth
Fig 1.1: Pictures of rural water supply and storage
1.3 Why a Liquid Piston Stirling Engine
7

A very important objective of this project, as was mentioned in the goals section in
this report, is to design and develop a system that can easily be constructed given the
limitations of a developing society. With this in mind, there is the need to choose a
design that incorporates constructional simplicity; a fluidyne system provides this. It
can be constructed using relatively simple and inexpensive materials. In our case,
PVC tubing, which are primarily cheap and also come in different standard sizes, can
sufficiently accommodate the needs of a Fluidyne System. A liquid piston Stirling
engine can therefore be built without the need for sophisticated machining which is
definitely a plus.
A second major advantage of liquid piston Stirling engines is that they are silent
during operation. Compared to mechanical-piston Stirling engines as well as other
pumps, fluidynes are extremely silent during operation which is an added benefit.
One does not have to concern themselves with losses as a result of moving parts
(mechanical pistons). In fact the only predominant losses that lower the efficiencies
considerably of fluidyne systems are viscous losses. The oscillating liquid must be
viscous enough to be able to sustain oscillations got a long period of time. The
engines’ efficiency ranges from 3-6%. Despite the low efficiency, the constant
supply of solar energy all year round will be enough to power the engine to serve the
needs of villages in a typical rural setting.
1.4 Liquid Piston Engines: A Historical Overview
Internal-combustion liquid pistons have been built and sold since the early 1900’s. The
first of these, popularly referred to as the Humphrey pump, is more-or-less an internal
combustion engine, using either a two- or four-stroke cycle in which the conventional
solid pistons are replaced with a liquid column. Inlet and outlet valves for the water, as
well as a high-grade fuel to provide the energy to power the engine - usually petroleum –
are used.
The major advantage of liquid pistons is clearly depicted by the aforementioned engine:
its simplicity. Liquid pistons do not require accurately dimensioned cylinders and they
permit great flexibility in mechanical design with relatively simple construction. For most
fluidyne systems, the engine and the pump can be made as a single system. The use of a
8
liquid-output piston avoids the need for a sliding mechanical seal, which has been a
continuing problem for crankshaft Stirling engines.
Most of the early interest has centered around the use of Fluidyne machines to pump
water. Like any other Stirling engine, the liquid piston engine can also be operated as a
refrigerator or a heat pump and several people have proposed exploiting this.
1.5 Basic Operation of the general Stirling Engine
The basic principle of the Stirling engine is a simple one: it relies only on the fact that
when a gas is heated, it tends to expand or, if confined, to a rise in pressure. There are
currently three configurations of the Stirling engines – alpha, beta and gamma – available
in the market. Our choice will depend on the power output we expect as well as on
efficiency.
Stirling engines work by the repeated heating and cooling of a sealed amount of
working gas which in our case will be air. The gas follows the behaviour described by the
gas laws which describe how a gas’ pressure, temperature and volume are related. When
the gas is heated, because it is in a sealed chamber, the pressure rises and this then acts on
the power piston to produce a power stroke. When the gas is cooled, the pressure drops
and this means that less work needs to be done by the piston to recompress the gas on the
return stroke, giving a net gain in power available on the shaft. The working gas flows
cyclically between the hot and cold heat exchangers.
The Stirling cycle is an idealized thermodynamic cycle that involves two isothermal and
two isochoric (constant volume) processes. The ideal Stirling cycle is shown below, and
proceeds in the same direction - from 1 2 3 4 1.
9

P
V
QC
QH
1
3
2
4
T1
3
2
4
s
Actual engine operation
Ideal engine operation
TH
TC
Figure 1.4.1: Stirling cycle Pressure-Volume and Temperature-Entropy diagrams
1 – 2: Isothermal Expansion
The working gas (air in our case) expands as heat QH is transferred to the
expansion space of the engine. The gas expands and does work (usually work is
done on a power piston), causing the engine volume to increase and the pressure
to decrease. Assuming isothermal conditions (T=TC), the heat transferred to the
working gas is exactly QH=WE, where WH is the work done on the power piston.
2 – 3: Isochoric Displacement (Cooling)
The working gas is moved through the regenerator at the maximum engine
volume. Heat is transferred from the working gas to the regenerator, causing the
pressure, temperature and entropy of the gas to decrease.
3 – 4: Isothermal Compression
The cooled working gas is compressed (usually by a power piston) in the
compression space, and heat QC is sunk to the cold reservoir at constant
temperature TC. Consequently, the engine volume decreases, while the engine
pressure increases. Assuming isothermal conditions (T=TC), the heat sunk to the
surroundings is exactly QC=WC, where WC is the work done by the power piston
on the working gas.
10

4 – 1: Isochoric Displacement (Heating)
The working gas is moved through the regenerator at the minimum engine
volume. Heat is transferred from the regenerator to the working gas, causing the
pressure, temperature and entropy of the gas to increase.
Types of Stirling Engines
The Stirling cycle can be implemented in practice through various types of engines. A
breakdown of the key parts of a typical engine follows. The key parts of the engine are
the pistons, connection rods, the crankshaft assembly, the heat source and heat sink, and
the regenerator. All engines contain at least one power piston, which must have very low
friction and near-perfect sealing for satisfactory engine operation. The engine output per
cycle is the net work that the power piston does on the working gas over a cycle (i.e. one
rotation of the engine shaft). The linear motion of the power piston is transformed into
rotational motion by a drive mechanism. Usually the drive mechanism consists of
connection rods. However, other configurations such as Ross yokes are possible1.
The three basic types of Stirling engines are alpha, beta and gamma. Figure 3.1
contains basic schematics of each type. Alpha engines have two power pistons, while
beta and gamma engines have a power piston and a displacer. Beta engines have a power
piston with a coaxial displacer; while gamma engines consist of a power piston and
displacer in separate cylinders. The three basic types are well described in the literature
[1,4], and we will outline only their main characteristics here.
Figure 3.1.a) A typical alpha-type Stirling engine. b) A typical beta-type Stirling engine.
1 The Ross yoke drive mechanism is discussed at http://www.ent.ohiou.edu/~urieli/stirling/engines/engines.html
11

source: http://www.ent.ohiou.edu/~urieli/stirling/engines/engines.html Figure 3.1. c) A typical gamma-type engine. Each of the three engine types has certain advantages and disadvantages. The
primary disadvantage of alpha type is a requirement for perfect sealing for two pistons.
Also, the configuration of the two pistons at an angle to each other can be cumbersome
for construction, especially for demonstration engines.
Beta engines offer potential significant advantages, especially in terms of
efficiency and size, but are technically complex. The requirement of a coaxial displacer
and power piston makes for difficult machining of the engine. This requirement also
increases friction in the engine because the displacer necessarily slides in and out of the
power piston. Moreover, the mechanical drive mechanism used to convert translation of
the pistons into rotation of the output shaft is a difficult design problem to say the least.
Finally, while a beta demonstration engine would be interesting, the coaxial piston
motion and regenerator position make it difficult to see Stirling cycle principles at work.
Gamma engines are best equipped for educational purposes. With two parallel
cylinders attached to a common crankshaft (see Figure 3.2 below), it is relatively easy to
discern the four stages of the Stirling cycle, and to study the functions of the displacer,
power piston and regenerator in each thermodynamic process.
12

1.6 Basic Operation of the Liquid Piston Fluidyne Engine
The liquid piston Stirling operates quite differently from the generic Stirling engine
described above. The most obvious is the fact that the mechanical pistons are replaced by
water. Therefore, as the hot side is heated, the increased air pressure raises water on the
cold side and lowers water on the hot side. The left-hand U tube which has one end
heated and the other end cold functions as a displacer; and the right-hand tube, which has
one end open to the atmosphere, works as the output, or power, piston; this configuration
is generally known to be the gamma configuration.
When the water in the displacer is set oscillating- by manually rocking the system to
jumpstart-from one limb of the U tube into the other limb and back, it is obvious that at
one point in the cycle, top dead air in the cold end will correspond to bottom dead air in
the hot end; this situation is illustrated in the left hand part of fig 1.5.1 overleaf, in which
most of the air trapped above the water in the displacer is in the hot left-hand limb. Most
of the air is therefore hot, so its pressure will rise, which tends to force the tube to move
from right to left as the arrow indicates in the figure below;
Cold
Displacer Output
Hot
Fig 1.5.1: Basic schematic of a fluidyne
13

Half a period later, the displacer water will have swung back into the other limb, so that
the cold surface is at the bottom dead center, which is the situation at the right hand side
of fig 1.5.1. Most of the air is therefore in the cold side of the machine, so its pressure
will fall, pulling the water in the output column back from left to right.
Cold
Displacer Output
Hot
The most important factor in Stirling engine design is the efficiency losses due to non-
idealities. Due to imperfections, the efficiencies of Stirling engines are significantly
lower than the ideal ones. The non-idealities include adiabatic losses and heat losses from
mechanical components.
1.6 Effects of Evaporation and Mean Pressure
An implication of evaporation is to increase the heat input required since latent heat must
be supplied, which also leads to an increase in the power output. However, the water
system may be limited to efficiency of 1 percent or less or less at these high temperatures.
It has been observed that evaporation has a marked effect at high temperatures in
Fluidyne systems leading to lower efficiencies. By suppressing evaporation, at least 10
times greater efficiency can be achieved. To deal with this problem, we intend to increase
14

the mean pressure of the working fluid to increase the pump’s pumping capability and its
efficiency and minimize the evaporation by designing a float which will rest on top of the
liquid column in the hot side of the engine.
1.7 Applications
t power has been extracted and used for pumping, including
n as series coupling which simply requires a T piece placed at the
lacing the
The engine outpu
irrigation pumping. Three simple ways to use the Fluidyne output to pump water have
been identified.
The first is know
end of the output column and two non-return valves. On the inward stroke of the
output liquid when the gas pressure inside the engine is low, liquid is drawn in
through the lower non-return valve. On the outward stroke, liquid is forced out
through the upper valve. However, the presence of the T piece (pumping line) in
series with the output column of the non-return valves may upset the tuning of the
system because with the non-linearities associated with the valves, the behavior of
the output tube as a resonant, oscillating system may be seriously affected.
The drawbacks that have just been highlighted could be remedied by p
pumping system in parallel with the output column. The volume of liquid moving in
the output tube can be greater than the volume passing through the pump, so that
there need not be a close correlation between the pumped volume and the engine
stroke which in the series configuration, has to be the case. Secondly, nonlinearities in
the flow through the pump will have relatively small effects on the oscillation of the
larger amount of liquid in the output line. In this case, the output line does not do any
work directly, except to overcome its own losses, but merely oscillates at a frequency
tuned to that of the displacer, thus giving rise to relatively large pressure variations
within the engine for pumping purposes. For this reason, the “output tube” is usually
referred to as the “tuning line” or the “tuning column” highlighting the fact that its
main function is to have a large, resonant oscillation and not to provide a direct output
mechanism.
15

1.8 Report Organization.
n down into several sections. This first part has been a
2. THEORY
.1 Working Fluid and pressure
To reach our target our target performance, there is the need to keep evaporation at a
e with evaporation, a float, made from an insulating
.2 Operating Temperatures
irling engines typically operate with the heat exchanger at
e of less that 1º C.2
The report has been broke
general introduction to the broader topic of Stirling engines and has narrowed our
scope focus to Fluidynes. The theory section (section 2) explains the theory
underlying our design as well as the model equations and concepts that are pertinent
to our system .The next section (section 4) discusses the design process and the
considerations that were important in arriving at our system’s parameters. Section 5
discusses the construction and assembly of the different parts of the engine after
which this paper presents and discusses our results, draws relevant conclusions and
recommends ways to improve on the existing design. The appendices then follow.
2
minimum and the working fluid must always be in the gaseous phase. To this end, and for
constructional simplicity, air is usually used at a mean pressure equal to that of
atmospheric pressure (0.1Mpa).
To suppress the losses that com
material is used. If this is done, the displacer liquid is largely isolated from the heater and
the working gas. It should be strong enough to withstand the hot side temperatures.
2
High powered, high-pressure St
700 to 800 º C, but more sophisticated materials are needed for this.
An ideal fluidyne would be able to run with a temperature differenc
However, for real machines, there are flow and power losses which require that the hot
end be kept as hot as possible, while the cold end be kept cold; that is, to maintain a steep
temperature gradient.. With that said, a convenient upper temperature figure should be
2 Elrod, 1974; Geisow, 1976.
16

between 120 - 300 º C for a machine which incorporates design simplicity like ours and
uses relatively available and inexpensive materials for construction, insulation and
jointing. The cold side temperature can be maintained at water’s ground level
temperature of about 10 º C.
2.3 Displacer Frequencies
itude of oscillation in the liquid columns, the flow losses
erivation of the operating frequency
To get the maximum ampl
should be low and the frequency of operation should be close to the natural, or resonant,
frequency of the columns themselves.
D
lacer alone: in this case, we can imagine
gravity and
To illustrate this, let us first consider the disp
both ends of the column to be open to the atmosphere. To start the oscillation going, we
raise the level slightly in one arm of the tube- for example by blowing on the other end. If
the liquid surface rises by a distance x on one end, it must fall by the same amount on the
other. One end of the liquid column now has more weight of liquid than the other, by an
amount 2χAdρ where: χ = the amount by which the liquid is displaced; Ad = the cross
sectional area of the U-tube; ρ = density of the liquid. (see fig 2.3.1 below).
The pressure arising from this is 2χρg, where g is the acceleration due to
hence the resulting force is 2χAdρ. The mass of the liquid column is AdρLd and so the
acceleration induced by this force (in a direction to reduce χ) is given by
2d D dA L A gρ χ χ ρ= − (2.3.1). 2
D
gxL
χ −=
This is the equation for undamped simp d the natural frequency
(2.3.2)
le harmonic motion an
omega, ω, is given as:
2
D
gL
ω = rad/s (2.3.3)
or 1 22 D
gfLπ
= Hz (2.3.4)
17
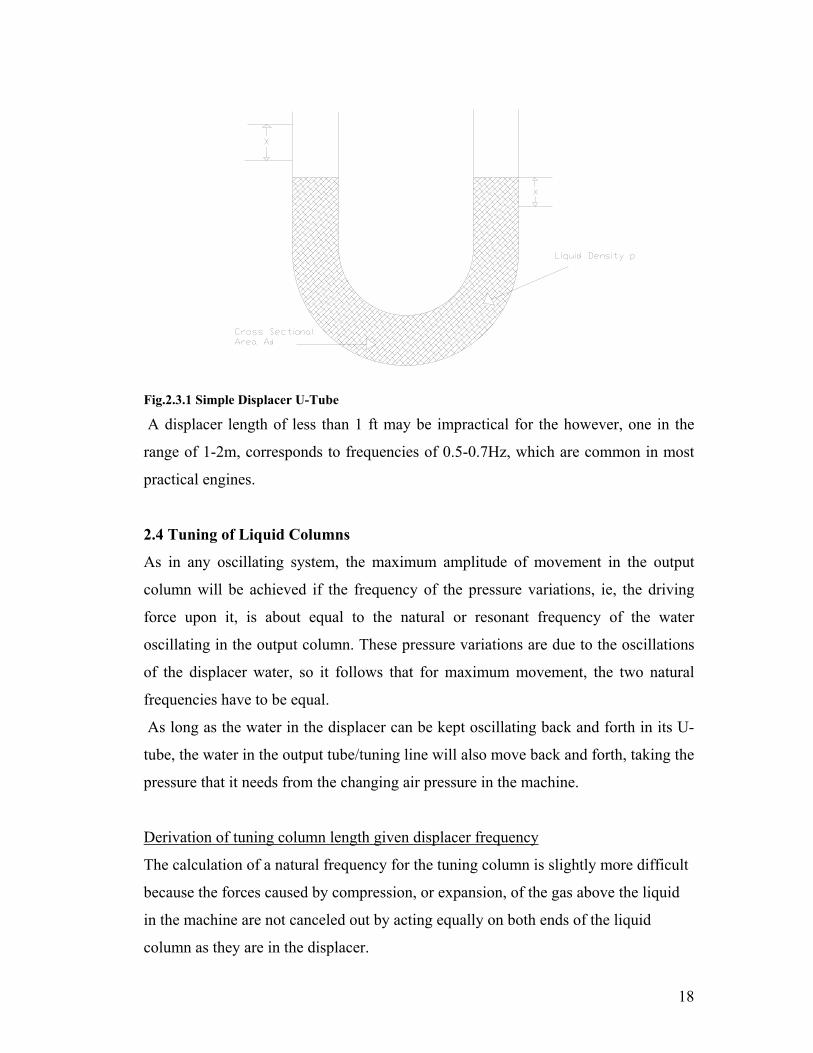
Fig.2.3.1 Simple Displacer U-Tube A displacer length of less than 1 ft may be impractical for the however, one in the
range of 1-2m, corresponds to frequencies of 0.5-0.7Hz, which are common in most
practical engines.
2.4 Tuning of Liquid Columns
As in any oscillating system, the maximum amplitude of movement in the output
column will be achieved if the frequency of the pressure variations, ie, the driving
force upon it, is about equal to the natural or resonant frequency of the water
oscillating in the output column. These pressure variations are due to the oscillations
of the displacer water, so it follows that for maximum movement, the two natural
frequencies have to be equal.
As long as the water in the displacer can be kept oscillating back and forth in its U-
tube, the water in the output tube/tuning line will also move back and forth, taking the
pressure that it needs from the changing air pressure in the machine.
Derivation of tuning column length given displacer frequency
The calculation of a natural frequency for the tuning column is slightly more difficult
because the forces caused by compression, or expansion, of the gas above the liquid
in the machine are not canceled out by acting equally on both ends of the liquid
column as they are in the displacer.
18

Fig 2.4.1: Tuning column configuration with merged cylinders Fig 2.4.1 shows a representation of the tuning column that represents a merged cylinder
machine. It has liquid length Lt and a cross-sectional area, At. One end is open to the
atmosphere. The other end terminates in the displacer.
Displacing the water in the open end of the tuning column downward by an amount χ
does two things. First, it raises the liquid at the other end by an amount χ. Secondly, it
reduces the value of gas above the working space by an amount At χ. Both effects give
rise to a pressure difference across the tuning column tending to force it back toward
equilibrium position.
If the gas is initially at a pressure Pm and at a volume where the tuning column is at a
mid-stroke, Vm, the space above the liquid is isothermal as we would like it to be in an
ideal Stirling engine, then the pressure will rise by an amount p, where:
PmVm = (Pm + p)(Vm - At χ) (2.4.1)
according to the ideal gas law. Therefore,
Vmp = (Pm + p)At χ (2.4.2)
Stirling engines usually have a relatively low compression ratio, so that p is generally
fairly small compared to Pm. Consequently, an approximation for p = At Pm χ/Vm.
For a merged cylinder configuration as has been shown in Fig. 2.4.1, the pressure
difference between the liquid surface in the displacer and the open end of the tuning
column is:
19

2
m t t
m d
P A g AP gV A
χ ρ χρ χ= + + (2.4.3)
Tuning liquid level lowered
Gas compression
Displacer liquid level raised
Most of the pressure difference will act across the tuning column, generating an angular
velocity which is equal to
[1 / 2 ]( )t m t d
m t t
A P A A g rad sV L L
ωρ
+= + / (2.4.4)
Or
[1 / 2 ]1/ 2 ( )t m t d
m t t
A P A A gf HzV L L
πρ
+= + (2.4.5)
The compressibility of a perfectly isothermal gas is equal to Vm/ Pm where Vm and Pm are,
respectively, the initial volume and pressure. The compressibility of a perfectly adiabatic
gas is Vm/ γPm , where γ is the specific ratio of the gas. For a mixed isothermal-adiabatic
volume, we can simply calculate the overall compressibility of the working gas from the
weighted average of the mean isothermal and adiabatic volumes, Vi and Va.
m
ai
PPVV V γ
−Δ=
Δ + (2.4.6)
Substituting equation 2.4.6 into equation 2.4.5 gives an approximate formula for the
natural frequency of the tuning line in a Fluidyne machine with mixed isothermal and
adiabatic spaces.
2 2
2
1(1/ 2 ) [ (1 )]2(
t m tt
at di
R P Rf gVL RV
ππρ γ
= ++
+ (2.4.7)
Where Rd is the diameter of the displacer and Rt, the diameter of the tuning column.
Equation 2.4.7 can be rearranged to give a simple relation between the tuning column
length, Lt and its radius Rt for any given frequency of operation f.
20

2 20
2
2 2
{ } [12[ ]
4
t t
a di
t
]R P RgV RVL
f
π
ρ γπ
+ ++
= (2.4.8)
2.5 Power Output
For a machine with separate displacer and tuning column cylinders, the power output, as
approximated by Cook and Yarbor3, is given by:
0 sin4
e e cm o
m e c
V T TW P V fV T T
π θ−=
+ (2.4.9)
where = volume swept out by the surface of the tuning column. oV = volume swept out by either surface of the displacer. eV = mid-stroke volume. mV = mean pressure. mP
eT and = temperatures of the hot and cold spaces respectively. cT θ = phase angle between the displacer and tuning column f = frequency of operation. Ideally, the goal is to get the two movements fairly near to 90˚ out of phase, i.e θ = 90˚,
in order to maximize the value of sinθ . Data collected on solid piston Stirling engines
suggests that the actual net power (i.e after losses) is usually 0.3 to 0.4 times the output
calculated ideally. The very limited experience available with well designed liquid piston
Stirling engines is consistent with this. We therefore use the figure 0.3 as a suitable
correction factor, recognizing that at lower temperatures or for small machines, where
various losses become more important, the formula will tend to overestimate the power
available. Therefore a more accurate equation for the power output is given as:
0.34
e e cnet m o
m e c
V T TW P V fV T T
π −+
(2.4.10)
To realize an increased power output without the need for a proportionately high input
power to overcome the latent heat of evaporation, an insulating float is necessary as was
briefly discusses in section 1.6 of this report In addition the need for an extremely high
input power should again be taken care since heat losses will be accounted for by using
3 By West, 1971.
21
thermal insulation around the heat-exchanger as well as other system parts that are good
thermal conductors.
2.6 Losses
The liquid piston Fluidyne engine has no rotating or sliding solid parts, and therefore no
mechanical friction. It, however, suffers from the viscous and other losses associated with
flowing fluids, especially flowing liquids and air. In addition, just like in the more
conventional Stirling engines, it suffers from the fact that the gas spaces are, in general,
neither perfectly isothermal nor perfectly adiabatic.
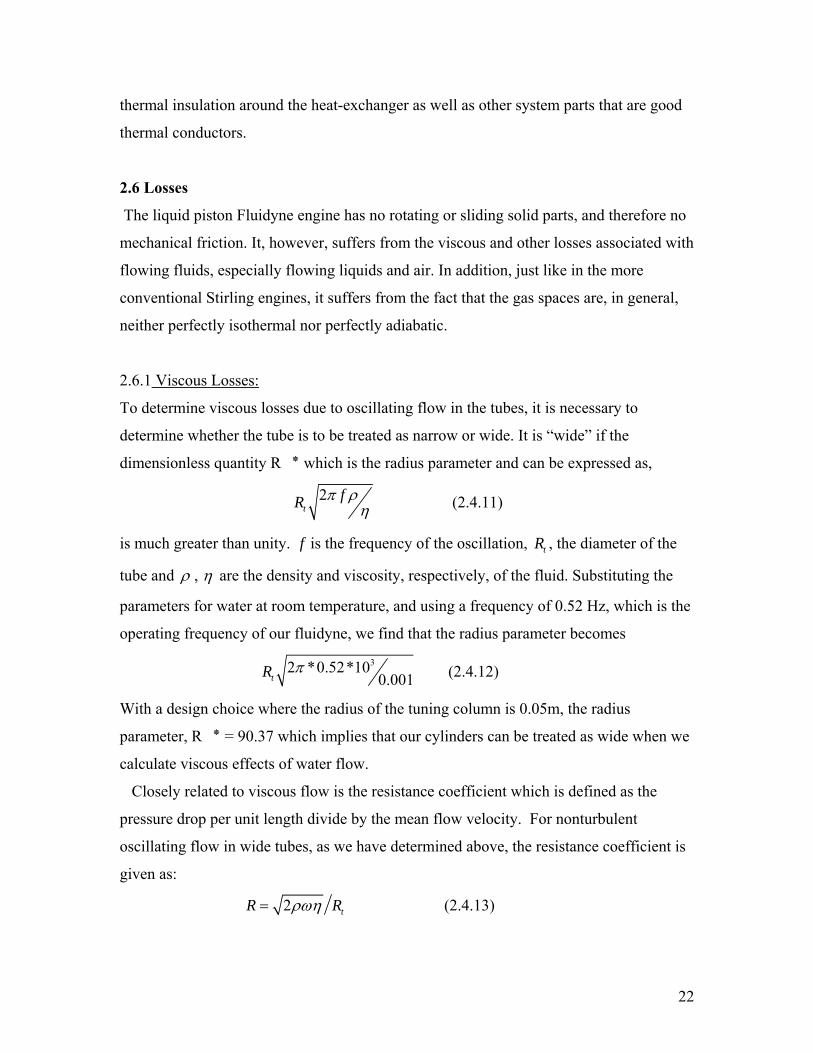
2.6.1 Viscous Losses:
To determine viscous losses due to oscillating flow in the tubes, it is necessary to
determine whether the tube is to be treated as narrow or wide. It is “wide” if the
dimensionless quantity R ,which is the radius parameter and can be expressed as ٭
2t
fR π ρη (2.4.11)
is much greater than unity. f is the frequency of the oscillation, tR , the diameter of the
tube and ρ , η are the density and viscosity, respectively, of the fluid. Substituting the
parameters for water at room temperature, and using a frequency of 0.52 Hz, which is the
operating frequency of our fluidyne, we find that the radius parameter becomes
32 *0.52*10
0.001tR π (2.4.12)
With a design choice where the radius of the tuning column is 0.05m, the radius
parameter, R which implies that our cylinders can be treated as wide when we 90.37 = ٭
calculate viscous effects of water flow.
Closely related to viscous flow is the resistance coefficient which is defined as the
pressure drop per unit length divide by the mean flow velocity. For nonturbulent
oscillating flow in wide tubes, as we have determined above, the resistance coefficient is
given as:
2 tR Rρωη= (2.4.13)
22

It is obvious, therefore, that the pressure drop for a given flow rate increases only as the
square root of the viscosity η .
2.6.2 Power Losses in Fluid flow:
The instantaneous rate of power loss in the flow is equal to the volume flow rate
multiplied by the pressure drop. The volume flow rate is equal to the mean flow velocity
multiplied by the cross-sectional area of the tube. The rate of power loss can easily be
calculated from the resistance coefficient given that, by definition, the resistance
coefficient is the pressure drop per unit length. Therefore:
.2.
32 t
t
L VPVR
ρωηπ
Δ = (2.4.14)
Equation 2.4.14 shows that the instantaneous value of the rate of power loss is
proportional to the square of the volume flow rate.
In developing the afore-derived equations, the implicit assumption has been that the
flow is not turbulent. At higher Reynold’s number, the transition may take place from
laminar to turbulent flow and there is therefore the need to determine a critical Reynolds
number which we can express as:
2 2
3( ) 375( )te
RR critical ωρη
(2.4.15)
2.6.3 Kinetic Flow Losses
In addition to viscous losses, there are minor pipe losses that occur when the fluid must
change speed or direction, for example at a bend or a pipe exit. The pressure drop caused
by a minor pipe loss can be expressed as a factor which depends on the type of
obstruction multiplied by the velocity:
212
P K ρυΔ = (2.4.16)
Where K represents the minor pipe loss coefficients. Table 2.4.1 presents K values for
different types of bends and exits:
23
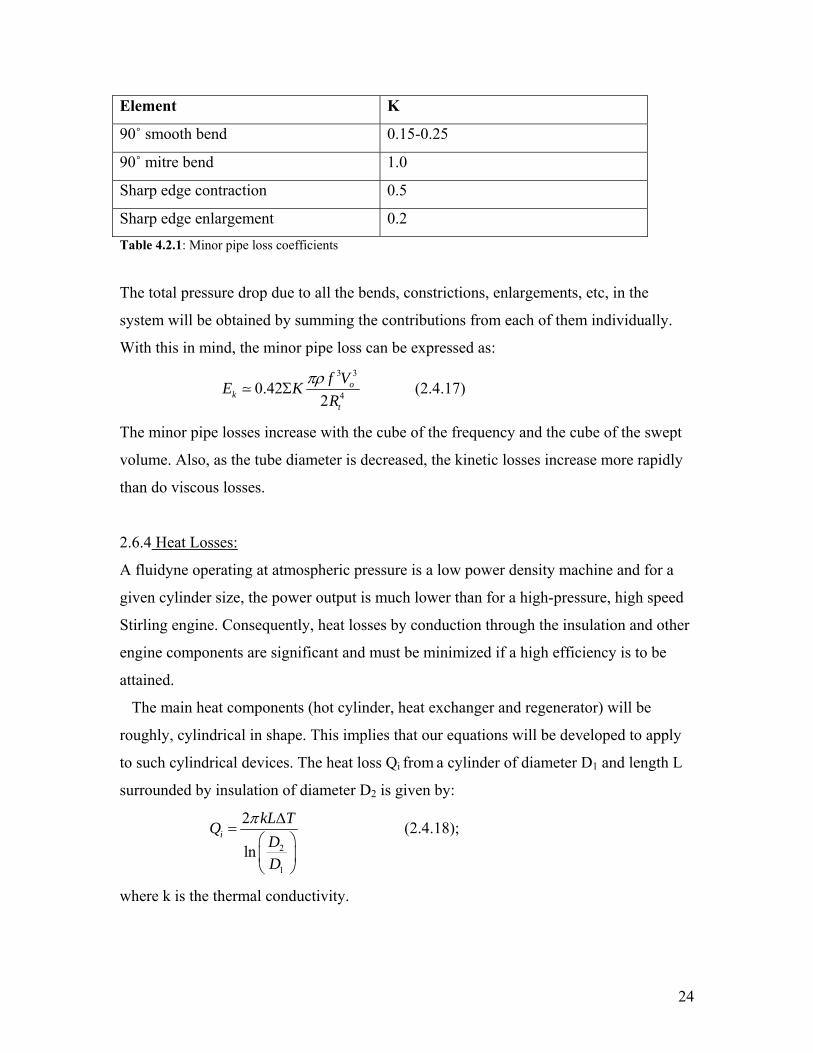
Element K
90˚ smooth bend 0.15-0.25
90˚ mitre bend 1.0
Sharp edge contraction 0.5
Sharp edge enlargement 0.2 Table 4.2.1: Minor pipe loss coefficients
The total pressure drop due to all the bends, constrictions, enlargements, etc, in the
system will be obtained by summing the contributions from each of them individually.
With this in mind, the minor pipe loss can be expressed as:
3 3
40.422
ok
t
f VE KR
πρΣ (2.4.17)
The minor pipe losses increase with the cube of the frequency and the cube of the swept
volume. Also, as the tube diameter is decreased, the kinetic losses increase more rapidly
than do viscous losses.
2.6.4 Heat Losses:
A fluidyne operating at atmospheric pressure is a low power density machine and for a
given cylinder size, the power output is much lower than for a high-pressure, high speed
Stirling engine. Consequently, heat losses by conduction through the insulation and other
engine components are significant and must be minimized if a high efficiency is to be
attained.
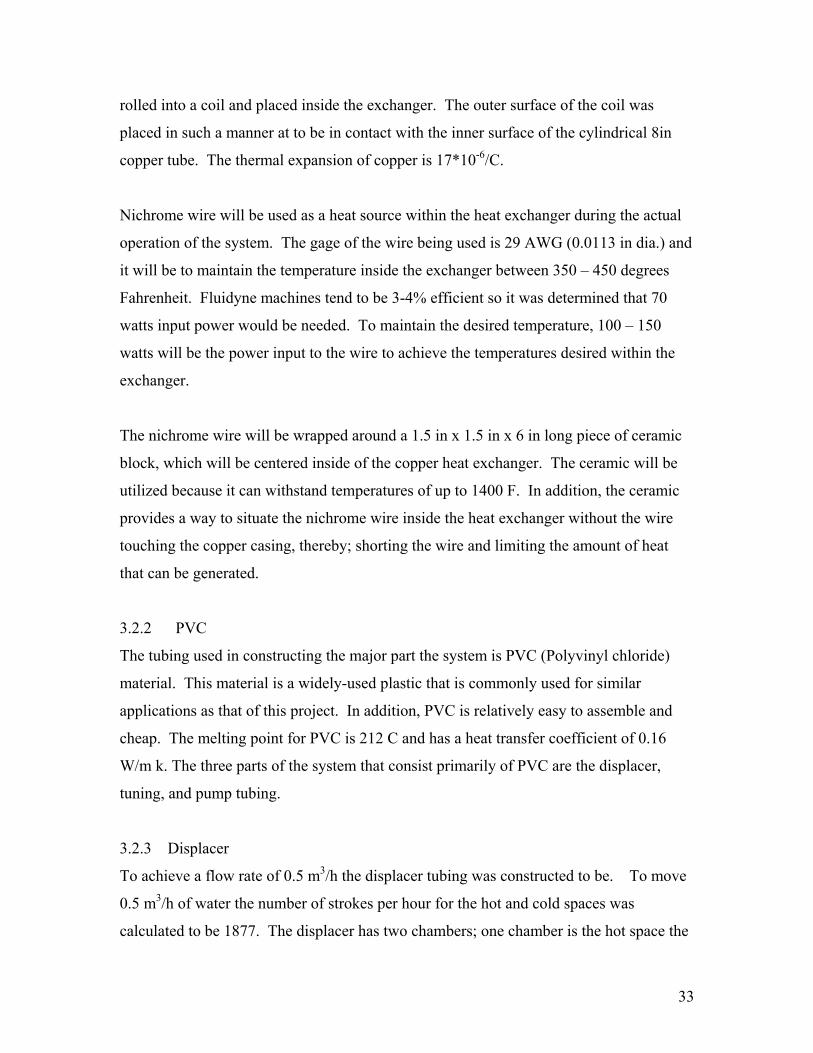
The main heat components (hot cylinder, heat exchanger and regenerator) will be
roughly, cylindrical in shape. This implies that our equations will be developed to apply
to such cylindrical devices. The heat loss Qi from a cylinder of diameter D1 and length L
surrounded by insulation of diameter D2 is given by:
2
1
2
lni
kL TQDD
π Δ=
⎛ ⎞⎜ ⎟⎝ ⎠
(2.4.18);
where k is the thermal conductivity.
24

2.6.5 Shuttle Losses
This is the heat loss due to the motion of the displacer piston. In the stationary state, the
temperature of the piston will be approximately equal to that of the adjacent cylinder
wall. When the piston moves, each section of its surface moves to confront a new part of
the cylinder wall, at a different temperature. Heat is transferred between the two adjacent
surfaces at different temperatures. The formula for calculating the shuttle losses4 is:
2
8ss k TDQ
Lgπ Δ
= (2.4.19);
where s = stroke
k = thermal conductivity of the gas between the piston and cylinder
= temperature difference between the hot and cold end of piston TΔ
D = piston diameter (or cylinder insider diameter)
L = Length of piston
g = gap between piston and cylinder
It is evident that this equation is frequency-independent. The reason is that if the
frequency is, for example, increased, the time available for heat transfer is during each
motion of the piston is proportionally reduced. Therefore, the amount of heat transferred
during each cycle is inversely proportional to the frequency. The total amount of heat
transferred per unit time is therefore equal to the amount transferred per cycle multiplied
by the number of cycles. One of these factors varies inversely with frequency, and the
other, directly with frequency. The overall effect is therefore independent of the
frequency.
2.6.6 Other Losses that could affect system functionality
The loss parameters that have been described above represent the more significant losses
we expect to encounter with our design. However, there are a few other avenues for
losses which we will neglect because we do not think they will significantly affect our
systems performance. An example refers to pumping losses, which comes about as a
result of the fact that with a solid float on the surface on the liquid surface in the hot side
of the machine, the gap between the cylinder wall and the lower end of the liquid
4 Equation is discussed in Martini’s Design Manual, (1978)
25

meniscus is close while the gap is open at the top. As the pressure in the cylinder varies,
gas flows into and out of this volume. Since the lower end of the gap is kept cold by the
oscillating liquid column, extra heat must be added to this gas as it leaves the space. This
loss is however pretty small in Fluidyne machines; we will therefore ignore it for the
purposes of our design.
Another minor heat loss source comes from the fact that extra heat input may be needed
because of the inefficiency of the regenerator. The regenerator, as it will be explained
shortly, reheats the gas as it returns to the hot cylinder. Since there is a great possibility
that it will not be perfectly effective, extra heat must be supplied from the heater which
could lead to the system being less efficient.
Finally, the heat that is stored in the hot components of the engine must be supplied by
the heat source which means that if it does not go into heating the air but rather the hot
pieces of the device, then it represents a lost energy source which could make the system
a less efficient.
2.7. The Regenerator and its Operation5
Although not absolutely necessary for engine operation, the regenerator is a key
element of the Stirling engine, and it distinguishes the Stirling engine from other external
combustion engines. The action of the regenerator can be described in simple terms as
that of a ‘thermal sponge’ – it absorbs and releases heat during different stages of the
cycle. The idea of regeneration is that if some of the heat added to an engine can be
stored within the system between the heating and cooling stages, the efficiency can be
significantly increased. Thus, if there is an element in the engine that absorbs heat during
the cooling stage and releases it during the heating stage, the compression space will cool
faster and less heat will need to be added to the hot space in order to keep the engine
running.
There are different ways of making regenerators in practice, and most of them
employ significant surface area to enhance the heat transfer rates and thus the amount of
heat stored and released by the regenerator during a cycle while minimizing the
5 Description of the regenerator adapted from external source. E90 Report by Milos Ilak’04 and Jesse Hartigan ’04.
26

impedance to the flow of the working gas through the regenerator itself. This is usually
achieved by using arrays of tubes, wire meshes, or by using porous materials with high
heat capacity through which the flow of the working gas is forced. In practical engines,
there is often a significant tradeoff between the gains in efficiency due to the regenerative
action and the flow losses. The flow rate of the working gas can be reduced greatly,
which causes losses to the power output. For small engines, these losses can be higher
than the potential benefits of a regenerator. Also, the passages in the regenerator may add
to the dead space in the engine, reducing the power output and efficiency further.
However, even with no regenerator, some regenerative action will still be provided by
different engine elements. In the case of an engine that contains a displacer for example,
the thin annulus of air around the displacer can provide some regenerative action.
Figure 2.7.1 shows a sample regenerative displacer piston which would not cause
an increase in the dead space or flow losses, since the displacer would have to exist in
order to provide reciprocating motion to the power piston as described earlier in this
section. The temperature gradient is considered negligible in the longitudinal direction,
and high heat transfer rates to and from the regenerator are assumed in the radial
direction. One way of achieving this highly anisotropic thermal conductivity is to make
the regenerator matrix out of light plastic in which radial highly conductive wires are
embedded.
Air flow from hot side to cold side
Heat into regenerator
Thot Tcold
Air passage
Displacer movement
Figure 2.7.1. a) Heat transfer occurring from the hot air to the regenerator as the air moves towards the cold space.
27
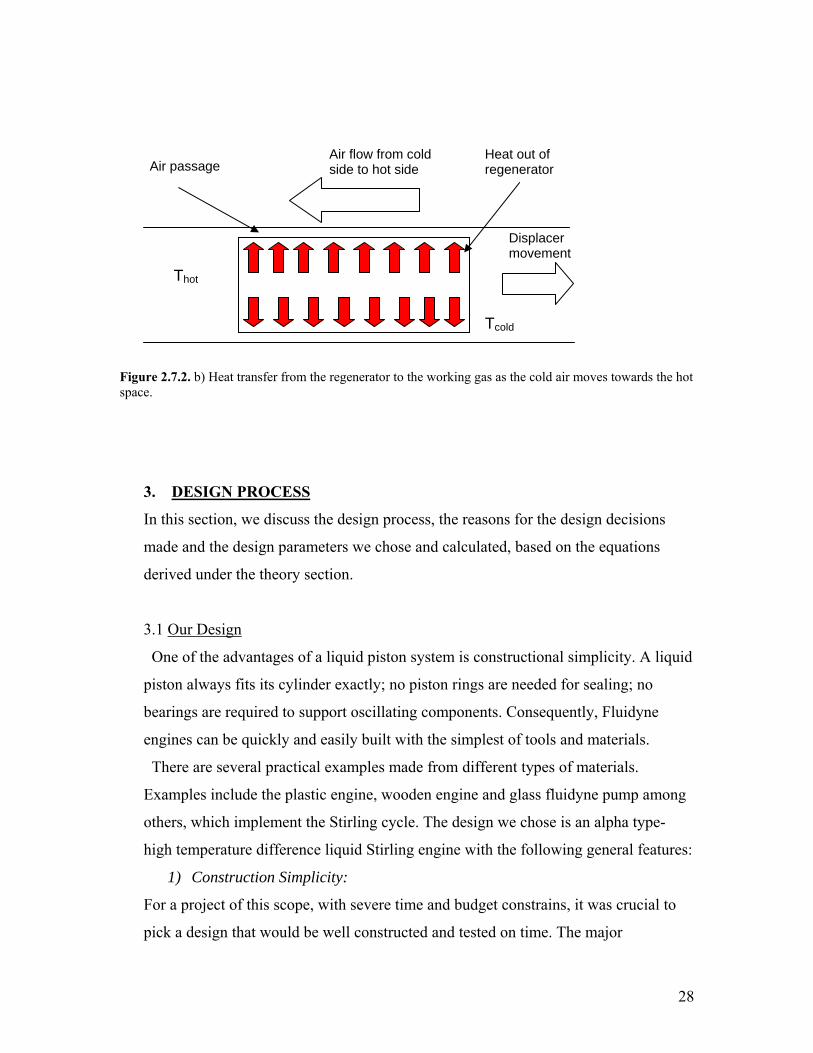
Thot
Tcold
Air passage Air flow from cold side to hot side
Heat out of regenerator
Displacer movement
Figure 2.7.2. b) Heat transfer from the regenerator to the working gas as the cold air moves towards the hot space.
3. DESIGN PROCESS
In this section, we discuss the design process, the reasons for the design decisions
made and the design parameters we chose and calculated, based on the equations
derived under the theory section.
3.1 Our Design
One of the advantages of a liquid piston system is constructional simplicity. A liquid
piston always fits its cylinder exactly; no piston rings are needed for sealing; no
bearings are required to support oscillating components. Consequently, Fluidyne
engines can be quickly and easily built with the simplest of tools and materials.
There are several practical examples made from different types of materials.
Examples include the plastic engine, wooden engine and glass fluidyne pump among
others, which implement the Stirling cycle. The design we chose is an alpha type-
high temperature difference liquid Stirling engine with the following general features:
1) Construction Simplicity:
For a project of this scope, with severe time and budget constrains, it was crucial to
pick a design that would be well constructed and tested on time. The major
28

components of our design include the displacer, tuning column, heat exchanger and
the regenerator, all of which can easily be constructed from relatively simple and
inexpensive materials
2) Machining Simplicity
As stated above, liquid pistons generally incorporate constructional simplicity which
implies that machining the various pieces in place is not necessarily a difficult task.
Unlike with Stirling engine designs which utilize mechanical pistons, there is really
no reason to achieve picture-perfect machining on any part of the system. In some
mechanical pistons for instance, it is imperative that the displacer and the output
piston be aligned perfectly so that no significant friction effects develop.
3) Instrumentation Easiness
Our design incorporates various testing devices that make it easy to collect relevant
data on our system as well as to characterize it. The design incorporates various
sensors as well as other analog measurement devices in order to realize the above
mentioned objective.
4) Ability to improve upon design
A feature of a great design is one that allows future work and improvements to be
performed on it. The materials and parts that are implemented in the system definitely
lend themselves to future improvements and further work. It is our hope, actually,
that future students will find it easy in developing the existing model; this factored
immensely into our design choice.
Fig 3.1.1 below shows a crude 2-D AutoCAD model of our system. The section
below discusses and obtains quantitative values for several system parameters.
29

Fig 3.1.1: Design diagram of our fluidyne pump
3.1.1 Engine System Parameters
For conveniently sized tubes/design, the frequency of fluid oscillation varies from 0.5 to
0.7 Hz. Thus a reasonable approximation for our design is 0.5 Hz. With is in mind, we
apply equation 2.3.4 to obtain the length of the displacer, LD.
2 22DgL
fπ= 3.1.1
LD = 183 cm (6 ft) long and 15.2 cm (6 in) inner diameter. With this diameter, the liquid
in the tube will theoretically oscillate at 0.5Hz.
Swept Volume
The next design parameter to determine is the engine-displacement, or swept , volume.
The Beale number6 Bn enables us to generate a fairly good estimate. It offers a simple
relationship between mean cycle pressure, operating frequency, engine displacement and
power output.
Power = Beale number * mean pressure * frequency * displacement
(3.1.2) nW B PfV= o
6 Walker, 1979
30

For our system, we have a target performance of . Therefore, with a
pumping arm of length 10 feet (3.05 metres), the theoretical power output through this
head for our system is given as:
30.5 /m hour
(3.1.3) 3 30.5 / *10 *3.05 *9.81/ 3600 4.16m hour m Watts=
Fluidyne machines tend to be approximately 4-6% efficient. We therefore expect to
provide an input power of approximately 70 watts.
The swept volume, from equation 3.1.2 is therefore expected to be:
34.16 1131.370.005*1*0.52
cm= (3.1.4)
This is the total volume change during each cycle of the engine. However, in the case of
an alpha configuration machine with the hot and cold pistons moving with approximately
equal strokes and about 90° out of phase, the total volume change is 2 * (the swept
volume of either piston). Therefore for our particular design, each piston should have a
displacement of 1131.4 cm3.The projected stroke, which is the amplitude of the
oscillations can then be expressed as
2
60.15 1131.37*104
sπ −= m3 (3.1.5)
This equation yields a stroke of 6.23cm.
Dead Volume
The optimum compression ratio in a Stirling engine is about 2:1. For an alpha
configuration machine, if both pistons have a swept volume V and differ in phase by 90°,
the total volume of the working gas in the cylinders, excluding clearance spaces is given
by:
1(1 cos( ))42
V t πω+ − (3.1.6)
If the unswept volume available for clearance space, heater and regenerator is VD, then the
compression ratio, i.e., the ratio of the maximum to the minimum is equal to 2 when VD =
1.12V. The unswept/dead volume of our system is therefore calculated to be
approximately 1267cm3.
31

Other miscellaneous design parameters
At a frequency of 0.52 Hz, the number of strokes per hour is expected to be 0.52*3600 =
1877/hour. To be able to pump 0.5m3/hour requires 0.5/1877 = 266cm3/stroke.
The pumping system is gas-coupled to the Fluidyne by means of an air-filled pipe. The
mean volume of air in this pipe must be at least 133cm3 because this is the anticipated
volume swept in each column during half cycle. To minimize dead volume so as to
maintain a relatively high compression ratio, the air-filled couple was designed to have a
volume close enough to 133cm3. The mean volume must be at least this value, rising to
266cm3 and falling to zero during each stroke. This implies that we have a remaining
dead volume of about 1134cm3 to allocate between the heat exchanger, regenerator as
well as for clearances and connecting pipes.
3.2 Components to the System
The fluidyne system is composed of five main parts. These component parts include the
heat exchanger, regenerator, tuning column, displacer column, and pump column. The
respective components of the system function in such a way as to bring about pressure
variations, thus allowing for the suction and pumping of water from some depth.
3.2.1 Heat Exchanger
The heat exchanger is the device in the system where the moving fluid, in our case air,
is heated. The exchanger is the device where heat transfer occurs between the heat
source, which is a coiled piece of nichrome wire and the air. Although the heat
exchanger is the means by which the system’s hot side is being heated, the moving fluid
is constantly entering and exiting the exchanger every cycle at different temperatures.
For testing purposes a gas powered torch will be used as a means to bring the
exchanger to an appropriate high temperature (350 – 450 F). The gas powered torch will
be utilized because it allows the heat exchanger to reach the desired temperatures in a
rather short period of time. Furthermore, it is a very simple apparatus to use for the
purposes of heating the exchanger, thus triggering oscillation. To improve the heat
transfer from the copper cylinder to the air inside, a 6 in long piece of thin copper was
32
rolled into a coil and placed inside the exchanger. The outer surface of the coil was
placed in such a manner at to be in contact with the inner surface of the cylindrical 8in
copper tube. The thermal expansion of copper is 17*10-6/C.
Nichrome wire will be used as a heat source within the heat exchanger during the actual
operation of the system. The gage of the wire being used is 29 AWG (0.0113 in dia.) and
it will be to maintain the temperature inside the exchanger between 350 – 450 degrees
Fahrenheit. Fluidyne machines tend to be 3-4% efficient so it was determined that 70
watts input power would be needed. To maintain the desired temperature, 100 – 150
watts will be the power input to the wire to achieve the temperatures desired within the
exchanger.
The nichrome wire will be wrapped around a 1.5 in x 1.5 in x 6 in long piece of ceramic
block, which will be centered inside of the copper heat exchanger. The ceramic will be
utilized because it can withstand temperatures of up to 1400 F. In addition, the ceramic
provides a way to situate the nichrome wire inside the heat exchanger without the wire
touching the copper casing, thereby; shorting the wire and limiting the amount of heat
that can be generated.
3.2.2 PVC
The tubing used in constructing the major part the system is PVC (Polyvinyl chloride)
material. This material is a widely-used plastic that is commonly used for similar
applications as that of this project. In addition, PVC is relatively easy to assemble and
cheap. The melting point for PVC is 212 C and has a heat transfer coefficient of 0.16
W/m k. The three parts of the system that consist primarily of PVC are the displacer,
tuning, and pump tubing.
3.2.3 Displacer
To achieve a flow rate of 0.5 m3/h the displacer tubing was constructed to be. To move
0.5 m3/h of water the number of strokes per hour for the hot and cold spaces was
calculated to be 1877. The displacer has two chambers; one chamber is the hot space the
33

other chamber is the cold space. The volumes of both chambers were derived to be 231
cm3. The hot and cold chambers are adiabatic and isothermal volume spaces,
respectively.
3.2.4 Pump column
The pumping column is 305 cm (10 ft) long and has a diameter 3.81 cm (1.5 in), thus the
volume of the tubing is 133 cm3 (8.11 in3). The pump is an adiabatic volume space. The
volume of water per stroke was determined to be 266 cm3/stroke. The total volume
change during each cycle of oscillation was derived to be 1131 cm3. The volume of
water drawn per stroke would be deposited in the air-filled couple. The air-filled couple
connects the pump to the rest of the system. The volume of the air-filled couple must be
at least half the volume of the max volume of water/stroke, 266 cm3/stroke, but for the
purposes of this project it was constructed to be 231 cm3/stroke or 86% of 266
cm3/stroke.
3.2.5 Regenerator
The liquid piston Stirling engine is a alpha configuration model; therefore, a regenerator
component will be included in the system operation. The regenerator typically consists
of a mass of wires and is located between the reservoirs (hot space and cold space). Two
types of regenerative material will be tested and analyzed and the most efficient of the
two materials will be in the final system operation. The materials being tested are small
rocks and steel brillo pads. When the air is moving between the hot and cold sides its
heat is transferred to and from the regenerator. The regenerator contributes to the
efficiency of the Stirling cycle by storing and releasing the heat to and from the air. The
regenerator has a volume of 1400 cm3 (85 in3) and will be situated above the cold space
and to the right of the heat exchanger. The regenerator is an isothermal volume space.
3.2.6 Connections
The volume for the tubing used to connect the respective components and the clearances
in the system was calculated to be 210 cm3 (12.8 in3). The total volume consisted of an
adiabatic space of 109 cm3 (6.62 in3) and an isothermal space of 101 cm3 (6.18 cm3).
34

Table 1: Mean Volume of Adiabatic and Isothermal Spaces
Component Parts Isothermal cm3 Adiabatic cm3
Hot Cylinder 266
Cold Cylinder 266
Regenerator 1400
Heater 925.8
Pump 133
Clearance/Connections 101.3 108.5
Total 2693.1 501.5
Isothermal Volumes
Regenerator
Heater
Cold CylinderConnections Cold Cylinder
Regenerator
Heater
Connections
Fig 3.1.2: Isothermal Volumes
Adiabatic Volumes
Hot Cylinder
Pump
Connections
Hot Cylinder
Pump
Connect ions
Fig 3.1.3: Adiabatic Volumes
35

3.2.7 Tuning/Output Column
The tuning line will reach it maximum amplitude of movement in output when the
frequency of the pressure variations is about equal to the natural or resonant frequency of
the water oscillating in the output column. To achieve the appropriate length of the
tuning line the total isothermal and adiabatic volume spaces, table 1, were used in
equation 2.4.8. The length of the tuning line was calculated to be 7.13 cm3 (23.4 in3).
3.2.8 Unistrut Structure
The fluidyne system was not designed to maintain its own weight, so a simple structure
was created to provide the needed support. The support structure is made of unistrut
metal framing material. The unistrut system is primarily used for mechanical support and
is designed to greatly simplify and reduce the cost of structural framing. The metal
support system has the advantage of being able to be adjusted and connected into
numerous different support structures. In addition, there are many different types of
mounting methods, accessories, and fittings that are used to construct the structure,
without necessarily using the methods of welding and/or drilling.
3.2.9 Summary of Design & Parameter sizes
Parameter Value
Working Fluid Air
Material for displacer, tuning column,
pump
Polyvinyl Chloride (PVC)
Support Frame Unistrut
Insulating Float Styrofoam
Oscillations Phase Angle 90°
Cold Cylinder Stroke TBA
Cold Cylinder Diameter 6 inches (isothermalized)
Hot Cylinder Stroke TBA
Hot cylinder diameter 6 inches (adiabatic)
Hot cylinder Float length 4 inches (above water level)
36

Float-cylinder gap 3.5mm
Tuning column diameter 50mm
Tuning column length (determined from
equation 2.4.8)
23 feet
Pump-arm mean volume 133cm3
Regenerator internal volume 1440 cm3
Heater inner volume 1440 cm3
Dead space Volume 3250 cm3
Swept volume 7000 cm3
Heater Temperature Max. 400 °C
Cold Temperature 10 °C
The Final Design
37

4. CONSTRUCTION & ASSEMBLY
4.1 Introduction
This section will provide details on the design, fabrication and construction process as
well as the decisions that we made to improve on the original design. A couple of pages
are been dedicated to explaining exactly how we constructed the various engine parts
because we believe there is the need to document this process should there be a desire, in
the future, to improve on the existing design. Please refer to the appendix to see the
various crude sketched, with dimensions, of the different engine parts.
The construction of the engine parts, after the design decisions had been made, took the
most time primarily because one member of the group had no prior experience with the
machine shop which meant that we needed to spend some time learning how to use the
machines in the shop. We got under way around the second the second week of the
semester and completed all the engine parts that constituted our initial design by mid
April. We are currently in the process of testing several engine parameters to see if there
are any design decisions we may have to alter. As an example, we have just decided to
set up a better and more effective heat exchanger and have machined pieces that enable
us to utilize a nichrome wire rather than our original idea which will be explained shortly.
We have also incorporated a pressure transducer into the design to enable us get a sense
of the pressure variations within the system. The circuitry for this device is however, yet
to be completed. Additionally, thin wire thermocouples have been placed in the hot and
cold spaces inside the system.
4.2 Machine Shop Work
The engine was constructed and the pieces assembled in the departmental machine shop
in Papazian with the help of Grant Smith, the machinist .We ordered almost all of our
polyvinyl chloride (PVC) pieces from outside. We also needed caps that would enable us
make the transition from higher diameter pipes to the smaller diameter ones. We
therefore ordered end caps which we machined to accommodate our desired PVC size.
There were several other pieces we had to order since they were not readily available in
the shop.
38

All the parts were fabricated using standard machinery – Bridgeport milling machines
and lathes, band-saws, drill presses, a belt sander, etc. For the more sophisticated parts,
we sought the assistance of Grant Smith and Professsor Orthlieb. However, for most of
the engine components, we made them and gained useful insights and experience in the
process.
The machinist, Mr. Grant Smith, ordered and or provided the materials that were
necessary in advancing the project. The table below shows the ordered system
components and the approximate cost.
Material/Part Cost/$7
PVC Tubes (6”, 2”, 1”,¾”) 70.00
Transparent PVC 10.00
Six inch T 15.00
Carbide Silicate Board 15.00
High Temp. RTV 15.00
Copper Foil 20.00
Nichrome Wire 15.00
Phenolic 20.00
Plastic End Caps 10.00
Pressure Transducers 10.00
Thermocouples 15.00
TOTAL 220.00 Table 4.2.1: Engine Part costs
4.2.1 Displacer
The displacer, U-tube, which is made of 6 in ID PVC was cut to the desired lengths using
the band saws, after which the ends were beburred with the belt sander. The length of six
inch tubing on the hot side is 3 ft while that on the cold side of the displacer is 2ft. A 6
inch ‘T’ connects from one of the two six inch elbows at the lower ends of the displacer,
7 The figures given here are all approximate.
39

which give the U-shape of the displacer, to the tuning line and the rest of the hot engine
column
4.2.2 Six inch to three quarter inch end caps
To minimize the dead space and to maintain consistency with our design calculations,
there was the need to transition from the six inch tubes to 3⁄4 inch tubes. To make this
transition, we machined two circular discs and center drilled them so the 1 inch OD
connecting tubes would fit in snugly. In addition, we had to ensure that the discs would
fit into the 6 inch ID of the bigger pipe and so half the thickness of the circular discs was
machined accordingly on the lathe. A third disc was machined in a similar fashioned with
the only difference being that, since it transitioned from 6 inches to the 2 inch tuning
column, the hole was made to accommodate the outside diameter of the pipe.
4.2.3 The tuning column
The length of the liquid column is about 23 ft. We therefore have a 21ft 2in PVC that
runs across horizontally. Through a 90 degree elbow, a 2-3ft long clear PVC was attached
vertically making it possible to view the oscillations. We also attached an outlet to the
tuning column which makes it easy to drain out the liquid in the machine after it has been
used.
4.2.4 The Regenerator
The regenerator was constructed and the material recommended by Paul Agyiri’08 and
Lauren ’08 with the help of Professors Orthlieb and Everbach as an E14/E90 project
collaboration. The goal of this collaboration was to have the E14 students recommend the
best regenerative material to use in our system. They setup an experiment which
consisted of using two blow-dryers; the one at the hope blowing hot air, while the one at
the bottom gave off cold air. They then designed 4 inch, diameter tube with end caps
threaded in so as to ease the opening and closing of it. The end caps were fitted around
the 4 inch long tube. In addition, steel trays were made to hold the regenerative materials
in place. The materials they tested included 4 pads steel wool, 2 pads steel wool, small,
medim and large pebbles, with screens and finally, with the regenerator empty. The e14
40
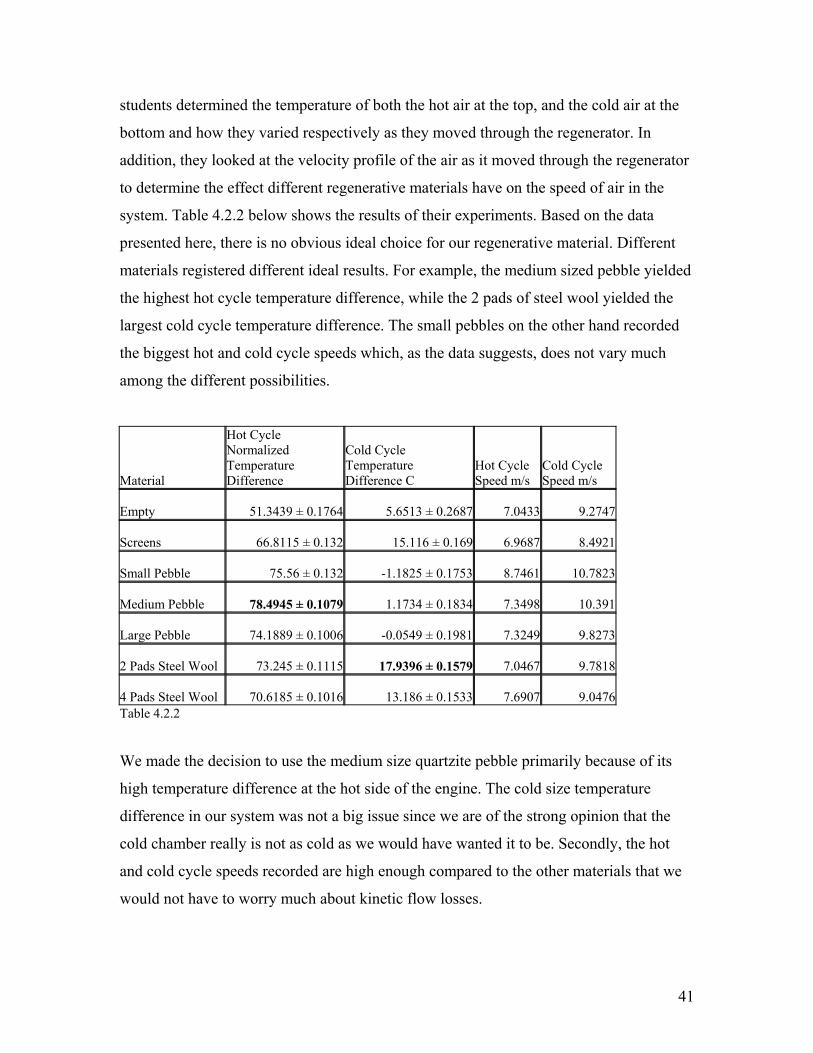
students determined the temperature of both the hot air at the top, and the cold air at the
bottom and how they varied respectively as they moved through the regenerator. In
addition, they looked at the velocity profile of the air as it moved through the regenerator
to determine the effect different regenerative materials have on the speed of air in the
system. Table 4.2.2 below shows the results of their experiments. Based on the data
presented here, there is no obvious ideal choice for our regenerative material. Different
materials registered different ideal results. For example, the medium sized pebble yielded
the highest hot cycle temperature difference, while the 2 pads of steel wool yielded the
largest cold cycle temperature difference. The small pebbles on the other hand recorded
the biggest hot and cold cycle speeds which, as the data suggests, does not vary much
among the different possibilities.
Material
Hot Cycle Normalized Temperature Difference
Cold Cycle Temperature Difference C
Hot Cycle Speed m/s
Cold Cycle Speed m/s
Empty 51.3439 ± 0.1764 5.6513 ± 0.2687 7.0433 9.2747
Screens 66.8115 ± 0.132 15.116 ± 0.169 6.9687 8.4921
Small Pebble 75.56 ± 0.132 -1.1825 ± 0.1753 8.7461 10.7823
Medium Pebble 78.4945 ± 0.1079 1.1734 ± 0.1834 7.3498 10.391
Large Pebble 74.1889 ± 0.1006 -0.0549 ± 0.1981 7.3249 9.8273
2 Pads Steel Wool 73.245 ± 0.1115 17.9396 ± 0.1579 7.0467 9.7818
4 Pads Steel Wool 70.6185 ± 0.1016 13.186 ± 0.1533 7.6907 9.0476 Table 4.2.2
We made the decision to use the medium size quartzite pebble primarily because of its
high temperature difference at the hot side of the engine. The cold size temperature
difference in our system was not a big issue since we are of the strong opinion that the
cold chamber really is not as cold as we would have wanted it to be. Secondly, the hot
and cold cycle speeds recorded are high enough compared to the other materials that we
would not have to worry much about kinetic flow losses.
41

The graph below therefore shows the relationship between air speed and the stage in the
cycle for the medium bebble. As is evident from it, the high temperature difference and
the approximately constant cold and hot cycle speed makes it an ideal regenerative
material for our system.
-2 0 2 4 6 8 10-100
-80
-60
-40
-20
0
20
40
60
80
100Air Speed and Normalized Temperature Difference for Medium Pebble
Time (s)
Spe
ed (m
/s) a
nd N
orm
aliz
ed T
empe
ratu
re D
iffer
ence
4.2.6 The Heat Exchanger
A lot of relevant information concerning the heat exchanger has been addressed in the
system design section of the report. For preliminary analysis, that is, to enable us test the
system, heating with a blow torch, we placed a copper foil, coiled a number of turns to
ensure that the air is heated through to the center of the tube. The tube is held in place to
the ¾ inch PVC by a material called phenolic, which has the property of being strong as
well as serve as a heat bridge between the copper tube and the PVC. The phenolic is
42

glued to the copper tube with high temperature RTV which has the advantage of being
able to withstand extremely high temperatures.
For the purposes of testing and empirically knowing the exact amount of heat input into
the system, we are going to replace the copper coil within the heat exchanger with
nichrome wire. This would be coiled around a rectangular block of carbide silicate
material 1.5 * 1.5 * 6 inches. A ½ inch hole was drilled through the center of the block
through which a solid rod which would be used to hold the block in place. To do this,
holes are drilled through the copper, screws are put through these holes which then press
firmly on the rod, to hold it in place.
phenolic
Copper tube
Fig 4.2.1: Picture of the heat exchanger 4.2.5 Carbide Silicate/Fibre Funnels
With the huge pipe losses that are associated with air moving from a tube to another tube
of different diameter, there was the need to minimize the losses and make the transition
less sudden and also to prevent turbulent flow. The phenolic, described above, was
machined to have a “funnel like” interior. Also, the carbide silicate material, which
provides strong inter-connecting fibre, was machined to funnel-like shapes to fit the
regenerator tube ends as well as at the entrance to the 2 inch tuning column.
4.2.6 Unistrut
Given the size of the system, as well as the fact that it will not stay put without a support
frame, we designed a Unistrut support frame to hold the displacer portion of the system in
43

place. The frame has two triangular truss-like members and a rectangular base. The
triangular members are separate by about 8 inches, giving enough room to hold the
machine in place. At the base, the rectangular cross section also provides enough room
for the lower portion of the engine. The entire frame is supported at the base by two
straight pieces that run across the ground as can be seen in Fig 4.2.2. One inherent
drawback of the current unistrut design is the face that it does not lend itself to being able
to move the machine around a whole lot which is an issue that could be addressed in the
future.
End Caps
Unitstrut Frame
Fig. 4.2.2: Picture with Unistrut frame
4.2.7 Insulating Float
A 4 inch Styrofoam insulating float was made with a height on 4 inches as well as a gap
of 1/8 inches between it and the cylinder wall. The gap width was kept at a minimum to
reduce the shuttle losses in that space.
44

4.2.8 Modifications
4.2.8a Heater
The initial heater used during the first run of the system was replaced with another heater
that was of similar design. The initial heater was taken from a blow dryer and contained
a built in cut-off switch as a safety precaution in case of over heating. The cut-off switch
did not allow for the heat exchanger to reach the necessary temperatures of 300-350oC
needed for operation. The blow dryer heater was replaced with a heater that was
composed of a nichrome coil wrapped around a ceramic base. The new heater was
powered by a veriac whose maximum input power was 664 watts.
4.2.8b Volume Changes
To accommodate for the change in the heating device the volume of the heat exchanger
was increased by 514 cm3 to a total volume space of 1440 cm3. The shifting of the heat
exchanger to the vertical position necessitated an increase in the ¾ connection volume by
160 cm3 to a total volume space of 370 cm3.
4.2.8c Transitions (entrance and exit losses)
Because their was significant frictional losses from the fluids entering and exiting
different size pipe diameters, smoother transitions were machined out of ceramic material
and placed at the entrance and exit locations to reduce losses due to friction.
Figure 4.2.8c Machined ceramic material used to smooth the transitions of the fluid in the pipe.
45

4.3 Data Acquisition System:
To be able to quantify and measure the system’s performance as well as the various
parameters, it has been equipped with pressure transducers, thermocouples and very soon,
will incorporate anemometers. These will be used in conjunction with some data
acquisition system in order to observe the engine’s operation.
4.3.1 Pressure Transducers
A standard differential pressure transducer is to be used to monitor the engine
pressure. The transducer is attached to the engine via the end cap in the dead volume
block, at the hot end column. Another one will be fixed at the gas-filled couple where the
pressure variations will lead to water being pumped. The output voltage of the transducer
is proportional to the pressure difference between its two ports. The transducer will be
powered by about 1.5mA power supply. Using a voltage-regulated power supply is
recommended, since the transducer produces accurate data as a result of the fact that the
voltage can always be set to the desired one. The pressure sensor pictured below was
used to measure the pressure variations in the hot cylinder. The calibration that was used
in converting the analog voltages into Pascal values was: 1mV = 1820 Pa.
46
Fig. 4.3.1: 316L Pressure Transducer
4.3.2 Thermocouples
The thermocouples are to be used to monitor the engines temperature. These highly
sensitive thermocouples are attached to the system via the heat exchanger. They are also
put into the dead spaces in the hot chamber. They rely on the voltage differential between
the wires to provide a temperature reading. The calibration has been programmed into the
reader to the extent that the output voltage, i.e., the voltage difference between the two
wires translates directly to a temperature value.
4.3.3 Proximity Sensor
A distance measuring sensor was installed inside the hot cylinder to output analog
voltages as the liquid oscillates. It has a dynamic range of 10 to 80cm. The output was
ier and has a gain of 10 v/v. A low-pass circuit
as built to filter out high frequency noise. The proximity sensor gives us a sense of the
ing the system, a process that is
quired, before free-oscillation is sustainable, for the operation of many stirling engines.
age during operation after the forces used to jumpstart the system
amplified using a 741 Operational amplif
w
amplitude of operation.
5. Results and Discussion
5.1 Initial Trial Run
While using the heating device from the hairdryer for the initial test run of the system, the
maximum pressure experienced by the system was observed to be 8kPa. The pressure
value was due to the manual attempt of jumpstart
re
Free oscillation is the st
has stopped. The initial test run did not sustain oscillation for a number of reasons, of
which include leakage, friction, and heat transfer problems.
47

Figure 5.1 Picture of system; the red arrows show where leakage occurred; the white arrow show where
frictional losses were observed.
The leakage of the moving fluid, in our case air, was observed to have occurred at the top
and bottom of the heat exchanger and the top of the hot cylinder. The red arrows in
figure 5.1 indicate the locations where air was observed to leak. The manner in which the
leakage was detected was through hearing whistling sounds at the stated locations during
the operation of the system. The leakage of air could be a result of the following:
in exchanger
2. pressure variations in the system – the forces due to the pressure could have
ulty
are
mo
transiti
1. large temperature changes in the heat exchanger – may have opened sealed holes
created small openings at the connections
3. inadequate method and application of sealing material – because of the diffic
in determining where the leakages were some openings may have been omitted
Not only did the leakages contribute to the system’s inability to sustain oscillation, the
frictional losses were a second set of problems. The frictional losses in the system
stly due to fluid flow. The system contains many entrances and exit losses at the
ons between:
48

1. displacer and the tuning column
the displacer and ¾ connections 2.
The loc
er used during the initial testing was taken from a hair dryer device.
Thi that intermittently cut on and off during
ope oved to be a problem because not enough input
pow f ld temperature, an
ystem requires a certain amount of power throughout the operation and the
eater device did not prove to suit the application.
3. the ¾ connections and the heat exchanger and regenerator
ations of where the frictional losses took place in the system could be viewed in
figure 5.1.
5.1.1 Pressure Variations
Furthermore, the heat
s heater consisted of two sets of coils
ration. The operation of the heater pr
er or operation was achieved. Upon reaching a certain thresho
integrated safety switch would become operational and trigger the device to shot off.
Again, the s
h
During the initial test run the peak pressure during free oscillation was observed to be
2.5kPa.
Figure 5.1.1 Using heat device from hair dryer the maximum pressure recorded was 8kPa and the
maximum pressure during free oscillation was 2.5kPa; the decay time constant was 5 seconds.
49
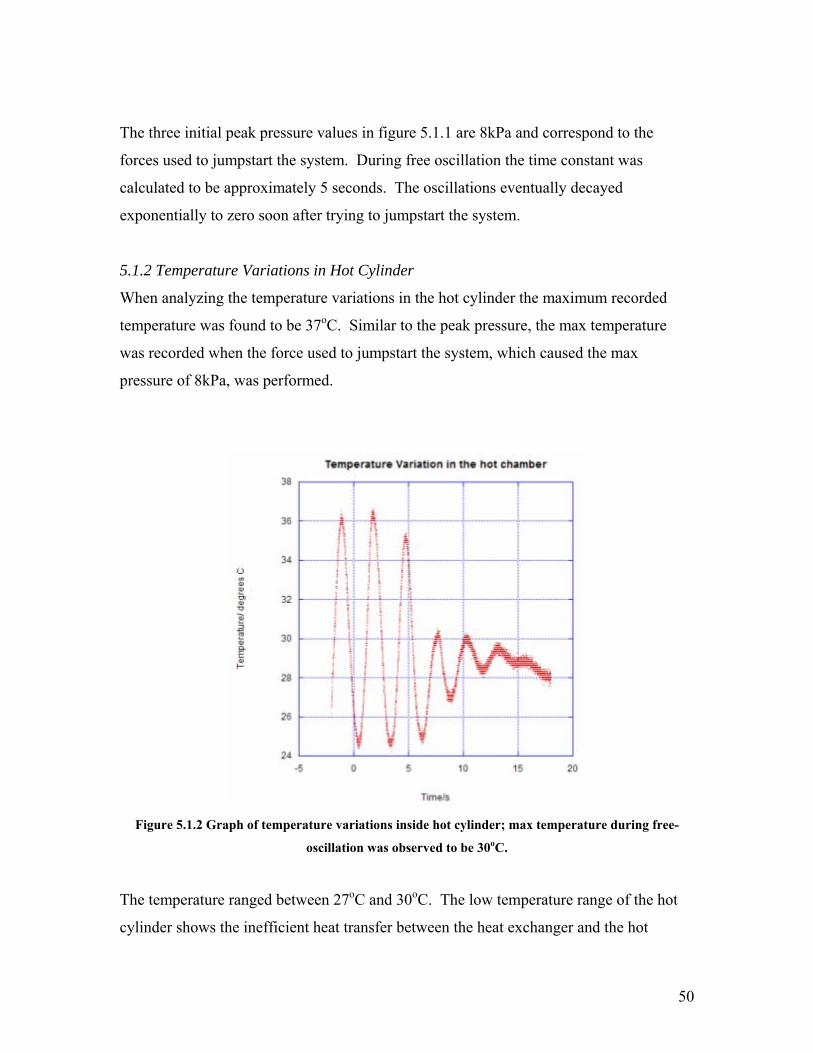
The three initial peak pressure values in figure 5.1.1 are 8kPa and correspond to the
forces used to jumpstart the system. During free oscillation the time constant was
calculated to be approximately 5 seconds. The oscillations eventually decayed
exponentially to zero soon after trying to jumpstart the system.
5.1.2 Temperature Variations in Hot Cylinder
When analyzing the temperature variations in the hot cylinder the maximum recorded
temperature was found to be 37oC. Similar to the peak pressure, the max temperature
was recorded when the force used to jumpstart the system, which caused the max
pressure of 8kPa, was performed.
Figure 5.1.2 Graph of temperature variations inside hot cylinder; max temperature during free-
oscillation was observed to be 30oC.
The temperature ranged between 27oC and 30oC. The low temperature range of the hot
cylinder shows the inefficient heat transfer between the heat exchanger and the hot
50

cylinder. Although the thermo-couple in the heat exchanger did not work during the
initial run we have assumed the temperature in the heat exchanger to have greatly
exceeded 37oC and thus the temperature range of the hot cylinder should have reached a
maximum temperature far greater than the recorded temperature shown in figure 5.1.2.
As stated earlier, the heater device inside the heat exchanger cut off when it reached a
certain threshold temperature and may have contributed to the low heat transfer between
the exchanger and the hot cylinder. The cutting off of the heater made the heat transfer
highly inefficient.
5.1.3 Reducing Losses
To reduce the losses in the system as well as improve of the components that were not
operational, we made a number of changes to the system.
1. To reduce the losses due to leakage of air a silicon rubber, room
s
were observed peration of the system.
2. To reduce the frictional losses in the system ceramic material were used to
t
nd
e
the improvements. During the final run the pressure variations vs.
time show peak amplitude of 7kPa, near 8kPa. This max pressure value is due to the
mpstart the oscillations. But unlike the initial run, the free
temperature vulcanite (RTV), was applied to the locations where leakage
to have occurred during the first o
smooth out the entrance and exits in the system making the transition of
the fluids to be smoother.
3. Because the heater was inefficient it was replaced by another heater tha
was composed of a nichrome wire wrapped around a ceramic base a
mounted in the heat exchanger.
5.2 Final Run
5.2.1 Pressure Variation
The changes to the system improved the operation performance and thus the results of th
final testing illustrate
input force needed to ju
oscillation pressure variation was sustained for a significant period of time, see figure
5.2.1.
51
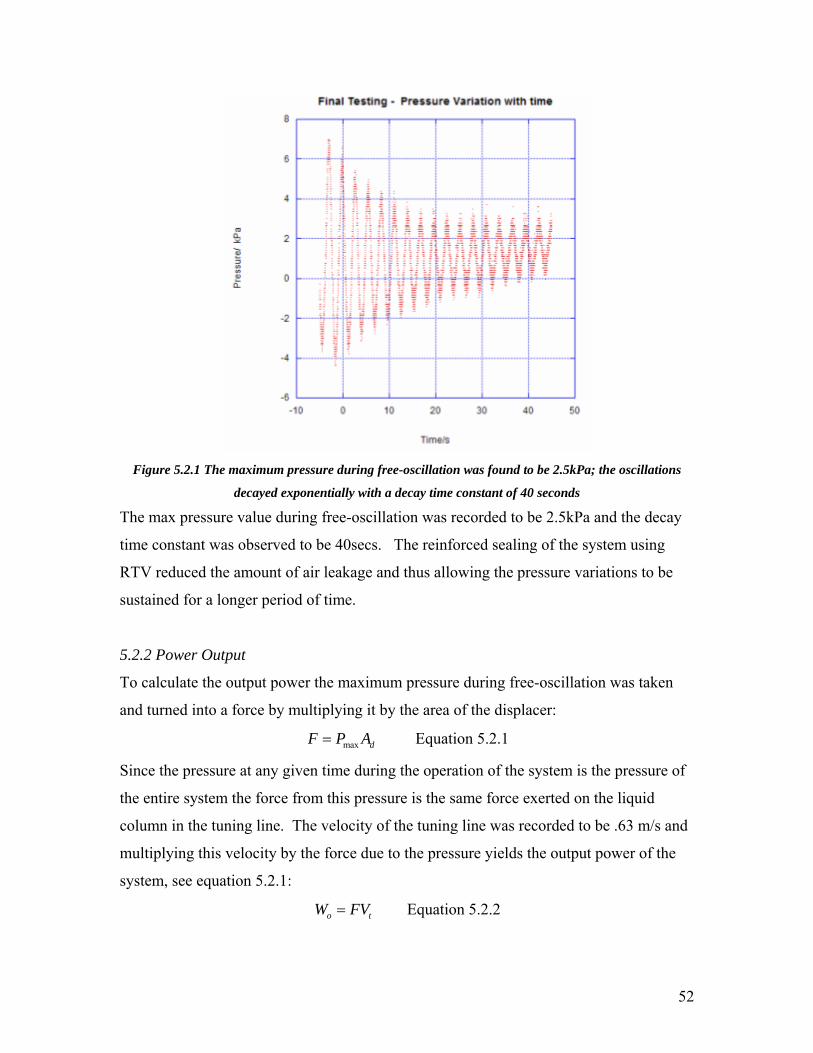
Figure 5.2.1 The maximum pressure during free-oscillation was found to be 2.5kPa; the oscillations
decayed exponentially with a decay time constant of 40 seconds
The max pressure value during free-oscillation was recorded to be 2.5kPa and the d
time constant was observed to be 40secs. The reinforced sealing of the system using
RTV re
ecay
duced the amount of air leakage and thus allowing the pressure variations to be
stained for a longer period of time.
5.2.2 Power Output
To calculate the output power the maximum pressure during free-oscillation was taken
and turned into a force by multiplying it by the area of the displacer: Equation 5.2.1
Since the pressure at any given time during the operation of the system is the pressure of
the entire system the force from this pressure is the same force exerted on the liquid
column in the tuning line. The velocity of the tuning line was recorded to be .63 m/s and
multiplying this velocity by the force due to the pressure yields the output power of the
system, see equation 5.2.1:
su
max dF P A=
o tW FV= Equation 5.2.2
52

The maximum output power was calculated to be 23 watts. The oscillations of the
system during the final run were sustained much longer than the oscillations of the initial
test run.
5.2.3 Temperature Variation in Heat Exchanger
The temperature variations inside the heat exchanger illustrates that air is moving into
and out of the component at different temperatures, see figure 5.2.3. During the final test
run the temperatures of the heat exchanger ranged from 125 oC – 400 oC. The thermo-
couple in the heat exchanger recorded the maximum temperature of 400 oC during the
process of jumpstarting the oscillations.
Figure 5.2.3 Heat exchanger temperatures varied between 125oC and 400oC.
During the period of free-oscillation the maximum temperature recorded was 375oC
the minimum temperature recorded was observed to be 125oC. The wide swing in the
temperature inside the heat exchanger shows that the heater was effective in delivering
the desired amount of power
and
and thus the temperature range between 300 – 350oC, target
temperature range, was achieved.
53
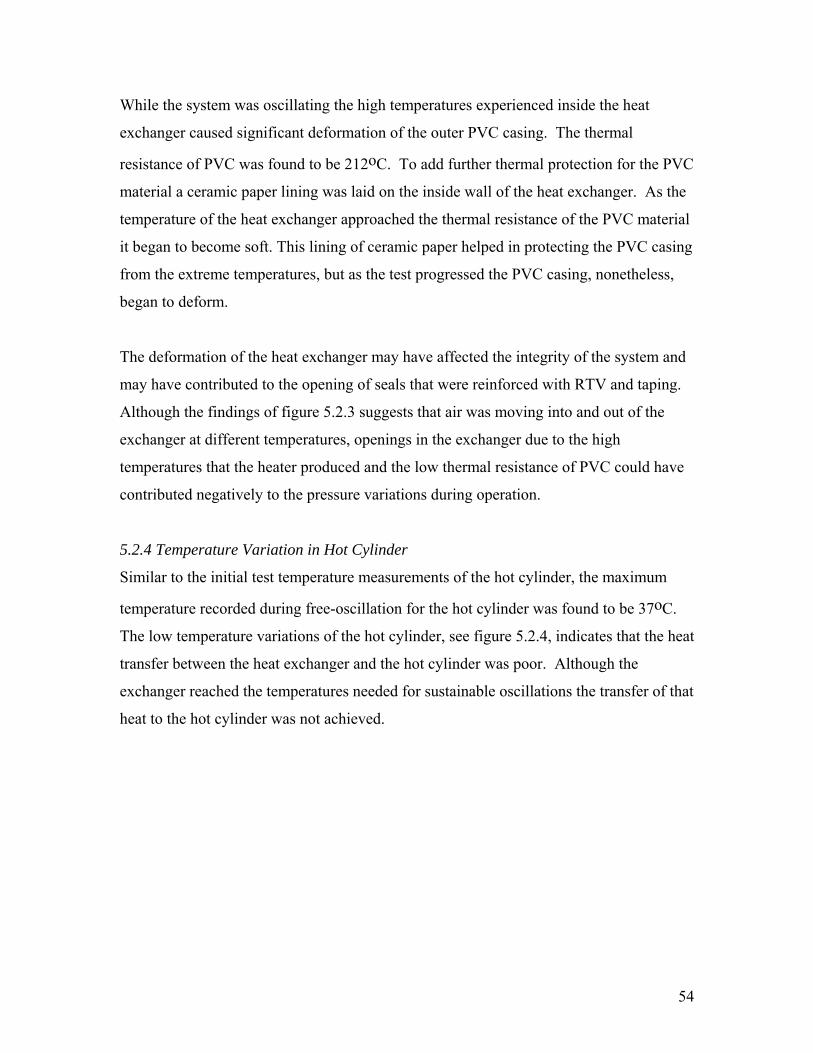
While the system was oscillating the high temperatures experienced inside the heat
exchanger caused significant deformation of the outer PVC casing. The thermal
resistance of PVC was found to be 212oC. To add further thermal protection for the PVC
aterial a ceramic paper lining was laid on the inside wall of the heat exchanger. As the
al resistance of the PVC material
ng
ay have affected the integrity of the system and
ay have contributed to the opening of seals that were reinforced with RTV and taping.
Although the findings of figure 5.2.3 suggests that air was moving into and out of the
exchanger at different temperatures, openings in the exchanger due to the high
temperatures that the heater produced and the low thermal resistance of PVC could have
contributed negatively to the pressure variations during operation.
5.2.4 Temperature Variation in Hot Cylinder
Similar to the initial test temperature measurements of the hot cylinder, the maximum
temperature recorded during free-oscillation for the hot cylinder was found to be 37oC.
The low temperature variations of the hot cylinder, see figure 5.2.4, indicates that the heat
transfer between the heat exchanger and the hot cylinder was poor. Although the
exchanger reached the temperatures needed for sustainable oscillations the transfer of that
heat to the hot cylinder was not achieved.
m
temperature of the heat exchanger approached the therm
it began to become soft. This lining of ceramic paper helped in protecting the PVC casi
from the extreme temperatures, but as the test progressed the PVC casing, nonetheless,
began to deform.
The deformation of the heat exchanger m
m
54
Figure 5.2.4 Temperature varied between 23oC and 37oC in the hot cylinder.
As air moved in and out of the hot cylinder temperature variations were recorded. The
ccurrence of temperature differences during free-oscillation in the hot cylinder shows
e entering the component. Because the
With an input power of 664 watts and an output power of 23 watts the efficiency of the
system was computed to be 3.5% using the equation 5.2.5 below:
o
that air at room temperature and warm air wer
temperatures entering the cylinder were not close to the temperatures in the heat
exchanger, the air in the heat exchanger did not reach the maximum temperatures that the
heater in the exchanger reached. In other words, the air circulating in the system did not
reach the maximum temperatures of 300-350oC.
5.2.5 Efficiency Calculation
power outpower in
η −=
− Equation 5.2.5
This efficiency corresponds to the efficiencies of stirling engines commonly found in
literature, which ranges from 3 - 6 %.
55

The poor heat transfer between the heat exchanger and the hot cylinder may be due to a
number of reasons, of which is the most probable cause for the inefficient heat transfer is
the low dead space volume. By increasing the dead space volume the mass of air moving
in the system could be increased; thereby, allowing more air to be heated by the heater at
any given time in the system. The increased air volume would thus allow for the
temperature increase in the hot cylinder. Thus, the heat transfer between the heat
exchanger and the system would be improved. The dead space volume could be
increased by increasing the diameter of the connections, from ¾ inch PVC piping to 1 or
even 2 inch PVC piping.
Additionally, the transitional elements used to smooth the transition from the different
diameter piping contributed to the improvement of the system operation. The transition
elements, made from ceramic material, were placed at the entrance and exit between the
displacer a ger.
stem would decrease and increase the
olume of the hot cylinder. The increase hot cylinder volume would decrease the system
r of heat into the volume space was not ideal, as shown by
Furthermore, the cold water bath on the cold side did not provide a proper heat sink for
the space. Because PVC is a bad thermal conductor the heat entering the cold chamber
e
fferences in the liquid stirling engine the greater
e efficiency of the system during operation.
nd tuning column and between the ¾ connections and the heat exchan
More transition elements could have been placed between the displacer and the ¾
connection piping, which may further cut down the frictional losses in the system.
A foam float was placed inside the hot cylinder above the water level to minimize
evaporation of the water. The foam helped in keeping the water from entering the
connections and thus into the heat exchanger, a situation that would negatively effect the
system operation because the water level in the sy
v
efficiency because the transfe
the low temperature range of the hot cylinder, see figure 5.2.4.
was not removed and thus did not provide a more extreme temperature difference in th
system. The greater the temperature di
th
56

5.2.6 Tuning Column
The data collected from the tuning column can be viewed in table 5.2.6. The flow
column was observed to be laminar with a fluid velocity of .63 m/s.
Table 5.2.6 Tuning Column Parameters
in the
Tuning Column Parameters
Velocity .63 m/s
Frequency .4 Hz
Amplitude .25 m
Reynolds Number 14200
Critical Reynolds Number 56000
Flow Type Laminar
6. Conclusions
reatly
take
rcome them
rought about many success and setbacks. Our interest and analysis of the liquid piston
f the stirling engine, more specifically the
quid piston stirling engine. Hopefully, the experience gained working on this project
Given our project objectives we feel that the opportunity to work on this endeavor g
enhanced our appreciation and awareness of the resources and technologies that we
for granted daily. Our goal of developing a liquid piston stirling engine that was capable
of producing and output power of 5 watts or 3.5 % efficiency was somewhat realized.
The design and materials used to construct the system were kept to a mechanical
simplistic model to allow for better integration in developing societies. Although certain
aspects of the system proved to be difficult problems the attempts to ove
b
stirling engine may inspire future work on the system which would advance our last
objective, which was to raise greater awareness of fluidyne engines as a low cost energy
source for applications found in developing societies.
We have learned a great deal on the operation o
li
57

will affect our futures in regards to advancing technologies that would benefit the most
nderprivileged our communities and societies. We also enjoyed working along side our
dvisor Prof. Carr Everbach, and technician Grant Smith. In addition, we learned a great
rthlieb, who was very instrumental in helping us acquire many of
7. Further Work
To enhance the performance of its efficiency, further
improvements could be made to the e ngine. These improvements will
compliment the successes of this project to m ke the
1. Improvement of the c s
As explained in the results sectio s report, the current heater
does not protect against heat losses to the surroundings at. The vast temperature
difference between the heat exchanger and the hot cylinder confirms this
on. Furthermore, during engine operation heat losses through the
he heat
op a
e
One
e high temperatures. A second
would be to use a much thicker and better insulation material which will
be
u
a
deal from Prof. Fred O
the materials and parts needed.
the engine and improve on
xisting e
a
urrent heat exchanger de ign
/discussion n of thi
observati
insulation – a quarter inch thick ceramic paper - which goes to deform the PVC
tube can be clearly observed. This could be seen at the end of testing; the PVC
tube had changed shape. The reason for this heat loss is that the insulation used is
not thick enough to adequately prevent heat transfer to the PVC tube.
There are a variety of ways to counter the inefficiency between t
exchanger and the hot cylinder. To begin with, the focus of this project was not on
heat exchanger design. The project’s main focus was to design and devel
working liquid piston Stirling engine. It has however become apparent that th
heat exchanger design requires a considerable amount of time and effort.
idea would be to replace the current PVC tube that contains the heater with an
inexpensive material that is able to withstand th
solution
prevent heat exchange between the hot air inside and its surroundings. Lastly the
heat energy transfer between the heat exchanger and the hot cylinder should
58

improved. One way to achieve this is by possibly placing the heater insider th
hot chamber. This will ensure that the air in the hot cylinder is heated directly.
Alternatively, heat transfer could be improved by placing thermal fins to facilitate
conduction.
e
2. Experimentation with pressurization
Equation (2.4.9) on p.20 of the report indicates that the net work per cycle
ortional to the mean pressure Pm. This means that a greater
r output.
he engine.
ssor to a pressure port on the dead
volume space to increase the pressure. If pc is the pressure at the outlet to the
d is the original mean pressure
of the engine is prop
mean pressure will increase net work per cycle, and thus the engine powe
One simple way to increase the mean pressure would be to pressurize t
This could be done by applying an air compre
compressor (inlet to the pressure port), and pmean_ol
in the engine, then the compressor would act to offset pressure fluctuations in the
engine by an amount equal to
_ _mean new mean old cp p p= + , (0.1)
where all pressures are gage pressures. The pressure increase in the engine would
increase as well, increasing the work per cycle.
The main drawback of pressurization is leakage of the working gas (air in our
case) due the greater effect of imperfect sealing at higher pressures. Sealing
imperfections not evident currently may appear if a compressor is used to raise
3.
The
osc
acc
sen
the mean pressure. In addition, caution should be exercised in pressurizing since
both the PVC tubes could crack.
Replacement of the proximity sensor with one of appropriate dynamic range
distance sensor was not that useful to us in this project since the amplitudes of
illation were outside its dynamic range. It was therefore not possible to get an
urate figure for the amplitudes of oscillation inside the cylinder. A proximity
sor with a larger dynamic range will be much more useful in this regard.
59

4.
To e engine, additional sensors should be incorporated into the
system. In addition to the thermocouples that have been placed in the heat exchanger
ced inside the cold cylinder to monitor the
temperatur
sys
col
wh
wil
5.
On
connections. On the one hand a bigger size PVC for the connections would ensure
at a greater mass of air was flowing between the hot
gen
hig illating liquid and therefore
gre
con
rati
that
effi ay have to be replaced with bigger size diameter
tubes, 2 inch for example. Even though they contribute to the dead volume in the
as to be
ble to pump water over a height of about 10 feet. To successfully incorporate the
Addition of thermocouples inside the cold cylinder as well as velocity sensors in
connecting tubes
better characterize th
and in the hot cylinder, one should be pla
es there. Secondly, to get an accurate sense of the speed of air flow in the
tem during each cycle, velocity sensors should be implemented inside the hot and
d chambers. This will be useful in providing the speed of the air flow in the system
ich is necessary for fluid dynamics’ analysis. Knowledge of the speed of air flow
l also be useful in determining kinetic flow losses in the engine.
Use bigger diameter PVC tubes for connections
e of the major decisions we had to make was what size PVC tubes to use in our
th and cold chambers. This would
erate large pressure variations which means that, on the hot side for instance, the
h pressure would lead to greater forces on the osc
ater amplitudes in oscillations. On the other-hand, smaller PVC tubes for the
nections would minimize the dead space and generate a favourable compression
o. Our design choice was the latter. However, as it was observed during testing
the oscillations could not be sustained permanently coupled with the low
ciencies, the ¾ inch PVC tubes m
design, the bigger sized tubes contain a greater mass of air, needed to provide the
force to drive the liquid pistons.
6. Incorporate the pumping line into the system
The pumping arm should be incorporated into the design. The original goal w
a
60
pumping line and measure performance, the engine design must be improved upon to
7. ject goal
function more efficiently.
Fulfill primary pro
The end product for this project should be a solar-powered water pump, with the
water that has been pumped, heated with focused sunlight. It is our hope that this
objective will be pursued in the near future to ensure that all the goals/objectives of
this project are met.
61
8. R
- W ton Stirling Engines. Van Nostrnad Reinhold Publishing.
- Ila esign and Development of a small Stirling Engine.
- U
eferences
est, C.D. 1983. Liquid Pis
k Milos, Hartigan Jesse, 2004, D
RL: <www.wikipedia.com>
62