design and analysis of air distributors and bed materials...
TRANSCRIPT

International Journal of Fluid Mechanics & Thermal Sciences 2016; 2(4): 22-36
http://www.sciencepublishinggroup.com/j/ijfmts
doi: 10.11648/j.ijfmts.20160204.11
ISSN: 2469-8105 (Print); ISSN: 2469-8113 (Online)
Design and Analysis of Air Distributors and Bed Materials of Fluidized Bed Boiler
Ishan Kafle*, Sajesh Bhochhibhoya, Lokesh Paudel, Pradeep Parajuli, Sojan Prajapati,
Pratisthit Lal Shrestha
Department of Mechanical Engineering, Kathmandu University, Dhulikhel, Kavre, Nepal
Email address:
[email protected] (I. Kafle), [email protected] (S. Bhochhibhoya), [email protected] (L. Paudel),
[email protected] (P. Parajuli), [email protected] (S. Prajapati), [email protected] (P. L. Shrestha) *Corresponding author
To cite this article: Ishan Kafle, Sajesh Bhochhibhoya, Lokesh Paudel, Pradeep Parajuli, Sojan Prajapati, Pratisthit Lal Shrestha. Design and Analysis of Air
Distributors and Bed Materials of Fluidized Bed Boiler. International Journal of Fluid Mechanics & Thermal Sciences.
Vol. 2, No. 4, 2016, pp. 22-36. doi: 10.11648/j.ijfmts.20160204.11
Received: October 31, 2016; Accepted: December 1, 2016; Published: December 30, 2016
Abstract: This research deals with the design and analysis of the nozzle and bed materials required for fluidized bed boiler.
The design parameters (Diameter of the bed particle, Range of the terminal velocities, Minimum Fluidization /Bubbling
velocities, Maximum amplitude and steady velocities) were calculated using Microsoft Excel by interpreting and solving
various formulas. Best bed material was selected on the basis of their various characteristics like porosity, adhesive or cohesive
properties, resistance to flow etc. An important characteristic change of air distributor velocity with combustion chamber
temperature has been established. ANSYS was used as a simulation tool for the analysis. Static Structural solver was used to
carry out the strength analysis of the designed wind box. Likewise, computational fluid dynamics (CFD) was carried out using
FLUENT solver. Air flow inside the wind box and fluidization phenomena was verified using FLUENT. Furthermore, the
designed system was checked for its validity by comparing the results from the Excel sheets and theoretical calculations with
simulation results. Lastly, correlation between temperature and velocity inside combustion temperature were determined to
identify their relationship with each other.
Keywords: CFD, Fluidization, Fluidized Bed Boiler, Wind Box
1. Introduction
Coal accounts for one of the major fuels utilized in Nepal
and is almost exclusively consumed mainly by industrial
sectors for heating and boiling processes in bricks, cement,
steel production. Apart from fewer coal reserves, coal for
industrial usage is imported from other countries, primarily
India. Statistically, only eighteen hundred thousand tons are
produced within the country as compared to five hundred and
fifty hundred thousand tons that are being imported [1].
Despite this, problem occurred due to low quality, low
calorific value and undesirably high ash content in the
brought-in coal. It is uneconomical to use such qualities coal
in the traditional grate systems. Hence, the concept of
fluidized bed combustion has been emerged as a promising
alternative in order to address the above issues. It bears
substantial advantages over conventional firing system as it
offers multiple benefits such as fuel flexibility, higher
combustion efficiency, compact boiler design and reduced
emission of noxious pollutants such as SOx and NOx [1].
Coal, rice husk and agricultural wastes are burnt in these
boilers. These boilers have industrial scale size and are not
available in any universities of Nepal. So, there is a need of a
design of a laboratory test rig for detail and practical study of
“Fluidized bed combustion Boilers”. The research is focused
in designing a “Circulatory Fluidized Bed Boiler” with the
optimum design of air distribution system, selection of
suitable bed materials and computational study of movement
of bed materials.
23 Ishan Kafle et al.: Design and Analysis of Air Distributors and Bed Materials of Fluidized Bed Boiler
2. Theory Background
2.1. History and Background
Not quite long ago, on December 16, 1921 Fritz Winkler
[3] initiated the process of fluidization i.e. the art of making
granular solids behave like a liquid. In early 1960s, Douglas
Elliott [4] promoted bubbling fluidized bed using the idea of
burning instead of gasifying fuel and focused on the
advantages of burning coal in fluidized beds by immersing
boiler tubes in it. Lurgi [5] developed an aluminum calcining
process based on laboratory-scale work in their
Metallgesellschaft laboratories. Calcination, being an
endothermic process, burning of gas or oil was required. The
combustion heat was recovered in a multistage bubbling
fluidized bed cooler, where waste gases exchanged heat with
feed materials. This allowed the uniform control of the
calcining temperature within required limits with use of the
circulating fluidized bed process. Several companies used
high-ash coal to engender heat for the calcination of
limestone, especially for the pre-calcining stage of the
cement clinkering process, thereby demonstrating the
efficacy of CFB combustion for utilization of low-grade coal
[6].
2.2. Fluidized Bed Combustion System
Due to the limitations in conventional grate fuel firing
systems and its inability to meet the standards of future
techno-economically, there is the need of an alternative that
can address this issue and as a result, fluidized bed
combustion has evolved as promising one. Its significant
advantages over traditional firing system and other multiple
benefits like compact boiler design, fuel flexibility, higher
combustion efficiency and reduced emission of obnoxious
pollutants such as SOx and NOx make it a favorable
substitute. In these boilers, the fuels burnt include coal, rice
husk, bagasse and other agricultural wastes. Such boilers
have a wide capacity range of 0.5 T/hr to over 100 T/hr [7].
2.3. Mechanism of Fluidized Bed Combustion
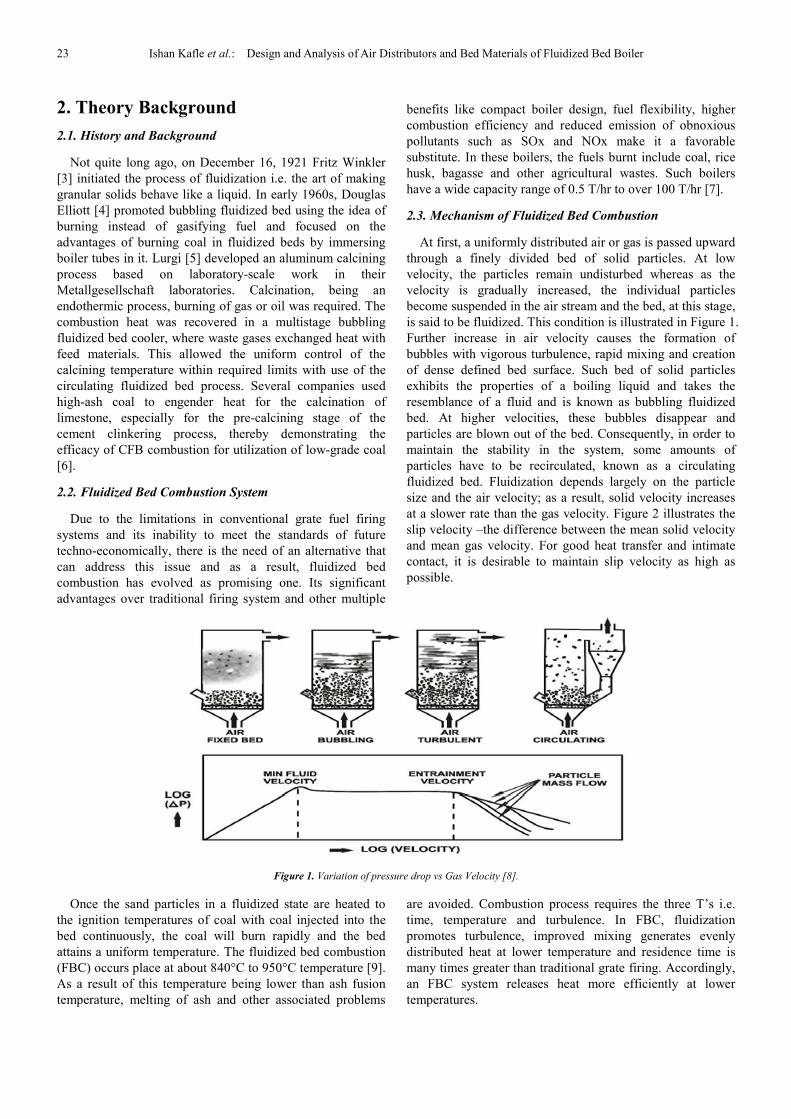
At first, a uniformly distributed air or gas is passed upward
through a finely divided bed of solid particles. At low
velocity, the particles remain undisturbed whereas as the
velocity is gradually increased, the individual particles
become suspended in the air stream and the bed, at this stage,
is said to be fluidized. This condition is illustrated in Figure 1.
Further increase in air velocity causes the formation of
bubbles with vigorous turbulence, rapid mixing and creation
of dense defined bed surface. Such bed of solid particles
exhibits the properties of a boiling liquid and takes the
resemblance of a fluid and is known as bubbling fluidized
bed. At higher velocities, these bubbles disappear and
particles are blown out of the bed. Consequently, in order to
maintain the stability in the system, some amounts of
particles have to be recirculated, known as a circulating
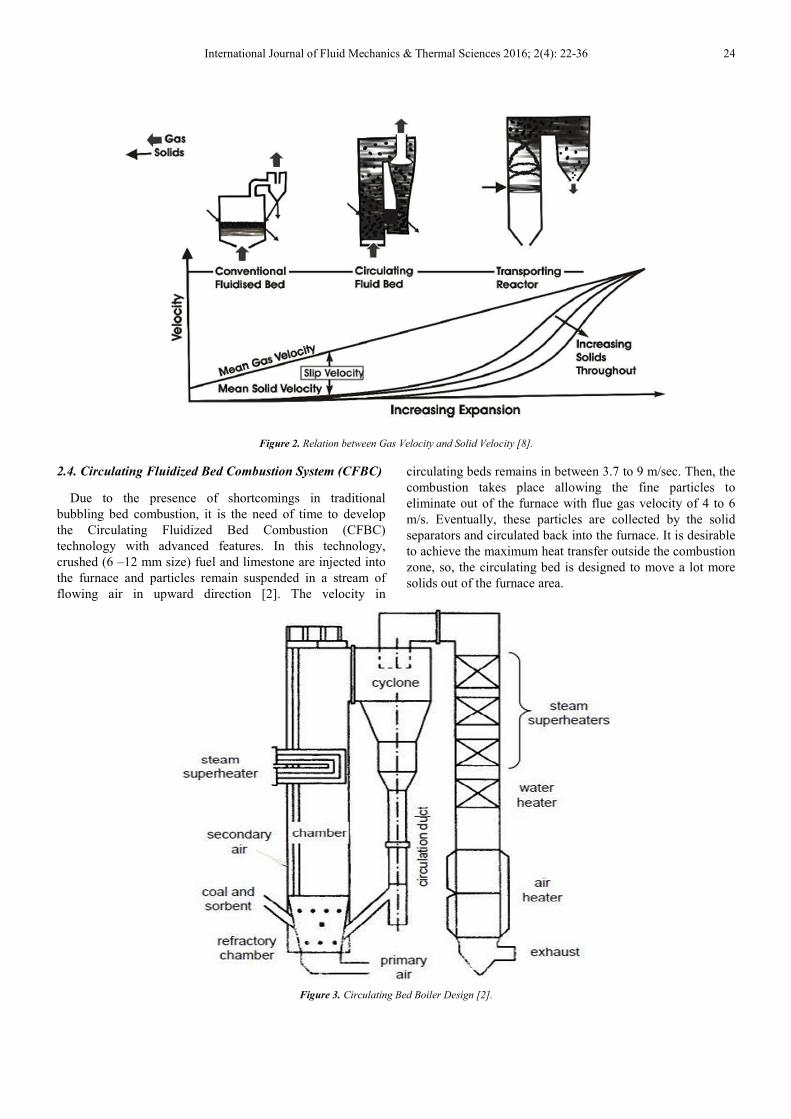
fluidized bed. Fluidization depends largely on the particle
size and the air velocity; as a result, solid velocity increases
at a slower rate than the gas velocity. Figure 2 illustrates the
slip velocity –the difference between the mean solid velocity
and mean gas velocity. For good heat transfer and intimate
contact, it is desirable to maintain slip velocity as high as
possible.
Figure 1. Variation of pressure drop vs Gas Velocity [8].
Once the sand particles in a fluidized state are heated to
the ignition temperatures of coal with coal injected into the
bed continuously, the coal will burn rapidly and the bed
attains a uniform temperature. The fluidized bed combustion
(FBC) occurs place at about 840°C to 950°C temperature [9].
As a result of this temperature being lower than ash fusion
temperature, melting of ash and other associated problems
are avoided. Combustion process requires the three T’s i.e.
time, temperature and turbulence. In FBC, fluidization
promotes turbulence, improved mixing generates evenly
distributed heat at lower temperature and residence time is
many times greater than traditional grate firing. Accordingly,
an FBC system releases heat more efficiently at lower
temperatures.
International Journal of Fluid Mechanics & Thermal Sciences 2016; 2(4): 22-36 24
Figure 2. Relation between Gas Velocity and Solid Velocity [8].
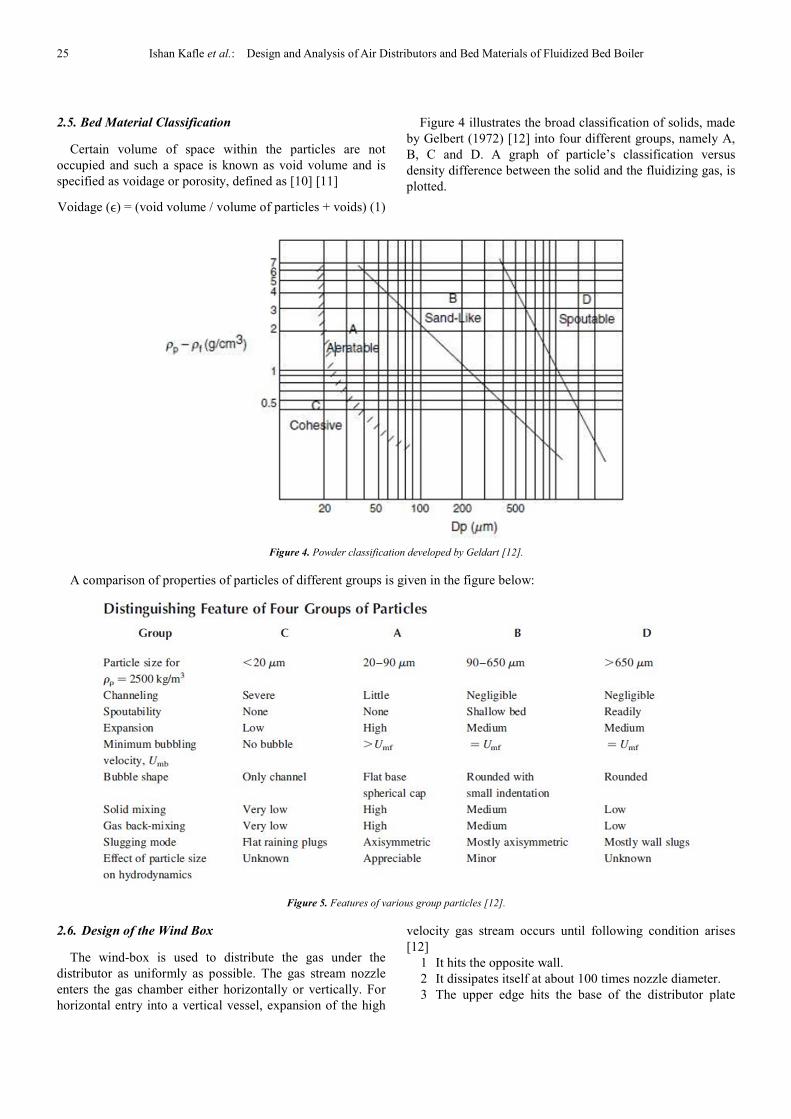
2.4. Circulating Fluidized Bed Combustion System (CFBC)
Due to the presence of shortcomings in traditional
bubbling bed combustion, it is the need of time to develop
the Circulating Fluidized Bed Combustion (CFBC)
technology with advanced features. In this technology,
crushed (6 –12 mm size) fuel and limestone are injected into
the furnace and particles remain suspended in a stream of
flowing air in upward direction [2]. The velocity in
circulating beds remains in between 3.7 to 9 m/sec. Then, the
combustion takes place allowing the fine particles to
eliminate out of the furnace with flue gas velocity of 4 to 6
m/s. Eventually, these particles are collected by the solid
separators and circulated back into the furnace. It is desirable
to achieve the maximum heat transfer outside the combustion
zone, so, the circulating bed is designed to move a lot more
solids out of the furnace area.
Figure 3. Circulating Bed Boiler Design [2].
25 Ishan Kafle et al.: Design and Analysis of Air Distributors and Bed Materials of Fluidized Bed Boiler
2.5. Bed Material Classification
Certain volume of space within the particles are not
occupied and such a space is known as void volume and is
specified as voidage or porosity, defined as [10] [11]
Voidage (ϵ) = (void volume / volume of particles + voids) (1)
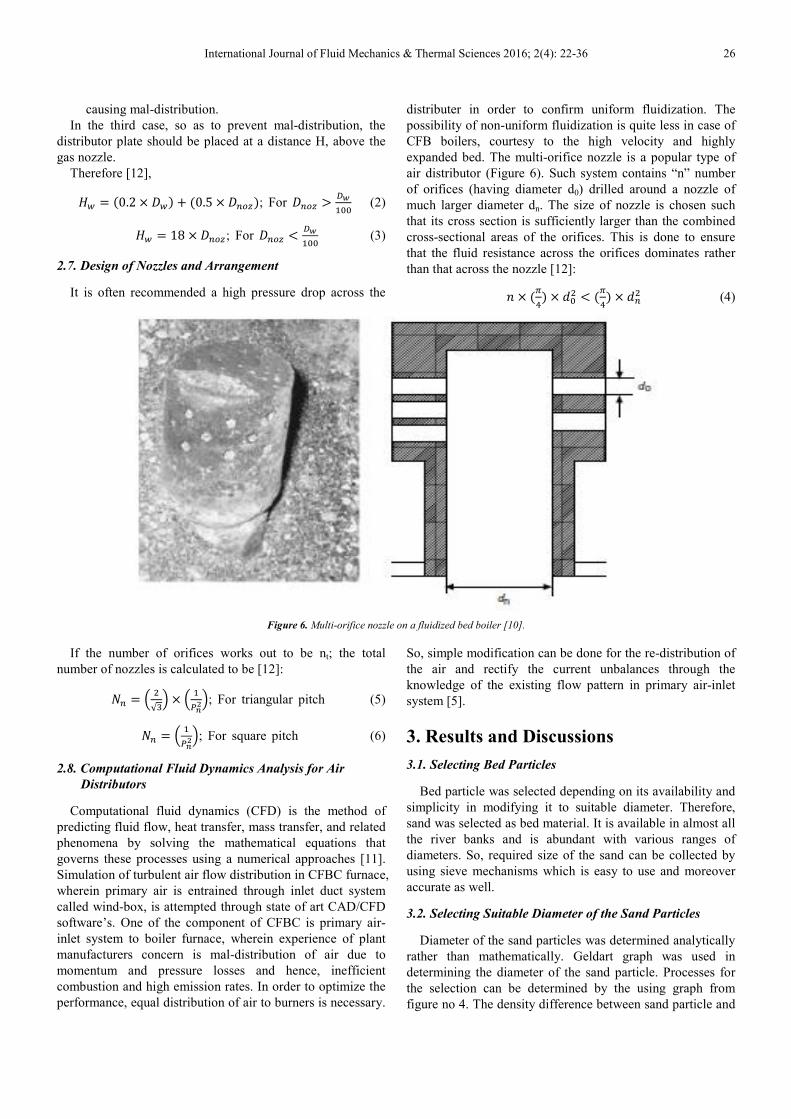
Figure 4 illustrates the broad classification of solids, made
by Gelbert (1972) [12] into four different groups, namely A,
B, C and D. A graph of particle’s classification versus
density difference between the solid and the fluidizing gas, is
plotted.
Figure 4. Powder classification developed by Geldart [12].
A comparison of properties of particles of different groups is given in the figure below:
Figure 5. Features of various group particles [12].
2.6. Design of the Wind Box
The wind-box is used to distribute the gas under the
distributor as uniformly as possible. The gas stream nozzle
enters the gas chamber either horizontally or vertically. For
horizontal entry into a vertical vessel, expansion of the high
velocity gas stream occurs until following condition arises
[12]
1 It hits the opposite wall.
2 It dissipates itself at about 100 times nozzle diameter.
3 The upper edge hits the base of the distributor plate
International Journal of Fluid Mechanics & Thermal Sciences 2016; 2(4): 22-36 26
causing mal-distribution.
In the third case, so as to prevent mal-distribution, the
distributor plate should be placed at a distance H, above the
gas nozzle.
Therefore [12],
�� � �0.2 �� � �0.5 ����; For ��� � ����� (2)
�� � 18 ���; For ��� � ����� (3)
2.7. Design of Nozzles and Arrangement
It is often recommended a high pressure drop across the
distributer in order to confirm uniform fluidization. The
possibility of non-uniform fluidization is quite less in case of
CFB boilers, courtesy to the high velocity and highly
expanded bed. The multi-orifice nozzle is a popular type of
air distributor (Figure 6). Such system contains “n” number
of orifices (having diameter d0) drilled around a nozzle of
much larger diameter dn. The size of nozzle is chosen such
that its cross section is sufficiently larger than the combined
cross-sectional areas of the orifices. This is done to ensure
that the fluid resistance across the orifices dominates rather
than that across the nozzle [12]:
� ���� ��� � ���� ��
� (4)
Figure 6. Multi-orifice nozzle on a fluidized bed boiler [10].
If the number of orifices works out to be nt; the total
number of nozzles is calculated to be [12]:
�� � � �√!" ��#$%"; For triangular pitch (5)
�� � � �#$%"; For square pitch (6)
2.8. Computational Fluid Dynamics Analysis for Air
Distributors
Computational fluid dynamics (CFD) is the method of
predicting fluid flow, heat transfer, mass transfer, and related
phenomena by solving the mathematical equations that
governs these processes using a numerical approaches [11].
Simulation of turbulent air flow distribution in CFBC furnace,
wherein primary air is entrained through inlet duct system
called wind-box, is attempted through state of art CAD/CFD
software’s. One of the component of CFBC is primary air-
inlet system to boiler furnace, wherein experience of plant
manufacturers concern is mal-distribution of air due to
momentum and pressure losses and hence, inefficient
combustion and high emission rates. In order to optimize the
performance, equal distribution of air to burners is necessary.
So, simple modification can be done for the re-distribution of
the air and rectify the current unbalances through the
knowledge of the existing flow pattern in primary air-inlet
system [5].
3. Results and Discussions
3.1. Selecting Bed Particles
Bed particle was selected depending on its availability and
simplicity in modifying it to suitable diameter. Therefore,
sand was selected as bed material. It is available in almost all
the river banks and is abundant with various ranges of
diameters. So, required size of the sand can be collected by
using sieve mechanisms which is easy to use and moreover
accurate as well.
3.2. Selecting Suitable Diameter of the Sand Particles
Diameter of the sand particles was determined analytically
rather than mathematically. Geldart graph was used in
determining the diameter of the sand particle. Processes for
the selection can be determined by the using graph from
figure no 4. The density difference between sand particle and

27 Ishan Kafle et al.: Design and Analysis of Air Distributors and Bed Materials of Fluidized Bed Boiler
fluid i.e. air is 2646.84 kg/m3. Moreover, circulating
fluidized bed boiler uses group B materials (ex: sand) so this
leaves us with diameter range from (100-500) micrometer.
Since we are designing for a small scale CFBC we limited
our diameter to 100 micrometer so that we could limit our
velocities to minimum as possible.
3.3. Determination of Different Velocities
3.3.1. Minimum Fluidization Velocity
If the gas-flow rate through the fixed bed is increased, the
pressure drop due to the fluid drag continues to rise until the
superficial gas velocity reaches a critical value known as the
minimum fluidization velocity, Umf. At the velocity where
the fluid drag is equal to a particle’s weight less its buoyancy,
the fixed bed transforms into an incipiently fluidized bed. In
this state the body of solids behaves like a liquid. There are
different fluidization velocities at different temperatures. The
ranges of these velocities were found out. Calculation
showed that at 25°C velocity was 0.0105 m/s and at 825°C
velocity was 0.00433 m/s.
3.3.2. Maximum Amplitude Velocity and Steady Velocity
The pressure drop across a turbulent bed fluctuates rapidly.
As the velocity is increased, the amplitude of fluctuation
increases, reaching a peak at the velocity Uc. It then reduces
to a steady value as the fluidizing velocity is increased
further to the velocity Uk. The transition from a bubbling to
turbulent bed does not take place sharply at one velocity. The
onset of this transition begins at the velocity Uc and is
completed at the velocity Uk. The transition appears to start
at the upper surface of the bed and move downward. Result
of our calculation showed that maximum amplitude velocity
will be 1.23 m/s and steady velocity will be 1.93 m/s at 25°C.
At 825°C maximum amplitude velocity will be 2.58 m/s and
steady velocity was 4.024 m/s.
3.3.3. Terminal Velocity
It is the velocity attained by the falling particle when the
weight of particle is balanced by the drag force. Terminal
velocities will be different at different temperatures due to
the variation of densities of gas. Our calculations showed that
terminal velocity at 25°C was 0.823m/s and at 825°C was
0.946 m/s.
3.4. Design of Wind Box
The diameter of the wind box is in accordance with the
diameter of the boiler which is 0.85 m i.e. 850 mm and the
length being 420 mm. The diameter of the feed nozzle is
determined to be 210 mm. Then the height below the wind
box where the feed nozzle is attached is determined. It was
found to be 275 mm i.e. the feed nozzle is located at a
distance of 275 mm below the distributor plate. It also lies in
the mid-point of the wind box breadth i.e. 425 mm from the
edge of the wind box.
Figure 7. 3D model of Wind Box with sectional views.
3.5. Design of Air Nozzles
We use a multi orifice type of air nozzles. Various values
were taken for the no of orifices, their diameter and the
diameter of the air nozzle. Much iteration was performed and
the validity of the design was checked. After much iteration
the values were determined as the no of orifices was found
out to be 6, orifice diameter was determined as 3mm, and
finally diameter of air nozzle was found out to be 16 mm.
Figure 8. 3D design of Nozzle.
3.6. Determination of the Pitch and Arrangement of
Nozzles (Final Assembly)
At first the superficial velocity was determined at 1770 C
to be 0.85612 m/s. Then the no of air nozzles in a square
meter of a distributor was calculated to be 570.22. Then the
no of air nozzles in the wind box area (0.85*.42) m2 were
calculated to be nearly equal to be 233 After this the
triangular pitch was calculated to be 50mm. We divided these
nozzles into 8 rows of 7 nozzles between which 7 rows of
fifteen nozzles are placed. The distance from the center of
distributor is taken as 30mm thus giving us
15*50+2*50=850mm wind box diameter. Also the
lengthwise arrangement was calculated as 7*50

International Journal of Fluid Mechanics & Thermal Sciences 2016; 2(4): 22-36 28
+2*35=420mm. The center to center distance between
nozzles of any two rows is 50/2=25mm.
3.7. Wind Box Simulation in ANSYS-Fluent and Results
The simulation was carried out in order to find outlet
velocity from the outlet nozzles and compare with
fluidization velocity that has been calculated from the Excel
sheet. If both velocities are similar then the velocity is valid
i.e. design is valid. A new geometry where boundary
conditions are to be added was created. This geometry is the
Boolean of the actual wind-box as it represents the boundary
region where air passes throughout the wind-box, from single
inlet to 1498 outlets. Wall, outlets and inlet were defined in
the geometry. Then an automatic mess was generated.
Automatic mesh was selected because the 1498 nozzle holes
with just 3mm diameter were very small in comparison with
850*420 mm2 wind-box.
Figure 9. New Mesh to apply Boundary Condition.
3.7.1. Setup and Assumptions
� Inlet velocity = 0.428m/s provided by the blower
normal to the face, Turbulent Intensity=5%
� Pressure in wind box = 1 atm
� Energy equation off
� Material=Air
� Cell Zone Condition = Solid
3.7.2. Results
The velocity at the outlet of the wind-box (nozzles) ranges
from 0m/s at the edge of each nozzle hole to 2.402 m/s at the
center point of each nozzle hole as shown in figure below.
This result shows that the outlet velocity is in the range of
fluidization velocity (minimum fluidization velocity 0.7m/s)
and wind-box will be able to perform the fluidization process
on the bed materials.
Figure 10. Outlet velocity in the nozzle holes.

29 Ishan Kafle et al.: Design and Analysis of Air Distributors and Bed Materials of Fluidized Bed Boiler
Figure 11. Velocity Vector showing direction of air velocity.
The streamlines result highlights that most of the air that
passes through the domain boundary moves directly from the
inlet to outlet holes. This is significant and is positive point
for the wind-box design. A negligible amount of streamlines
flow downwards which eventually reach the nozzles.
There were 1000 equally spaced streamlines that started
from inlet, analyzed to provide the result.
Figure 12. Streamlines and velocity volume rendering result.
Figure 13. Volume rendering result.
International Journal of Fluid Mechanics & Thermal Sciences 2016; 2(4): 22-36 30
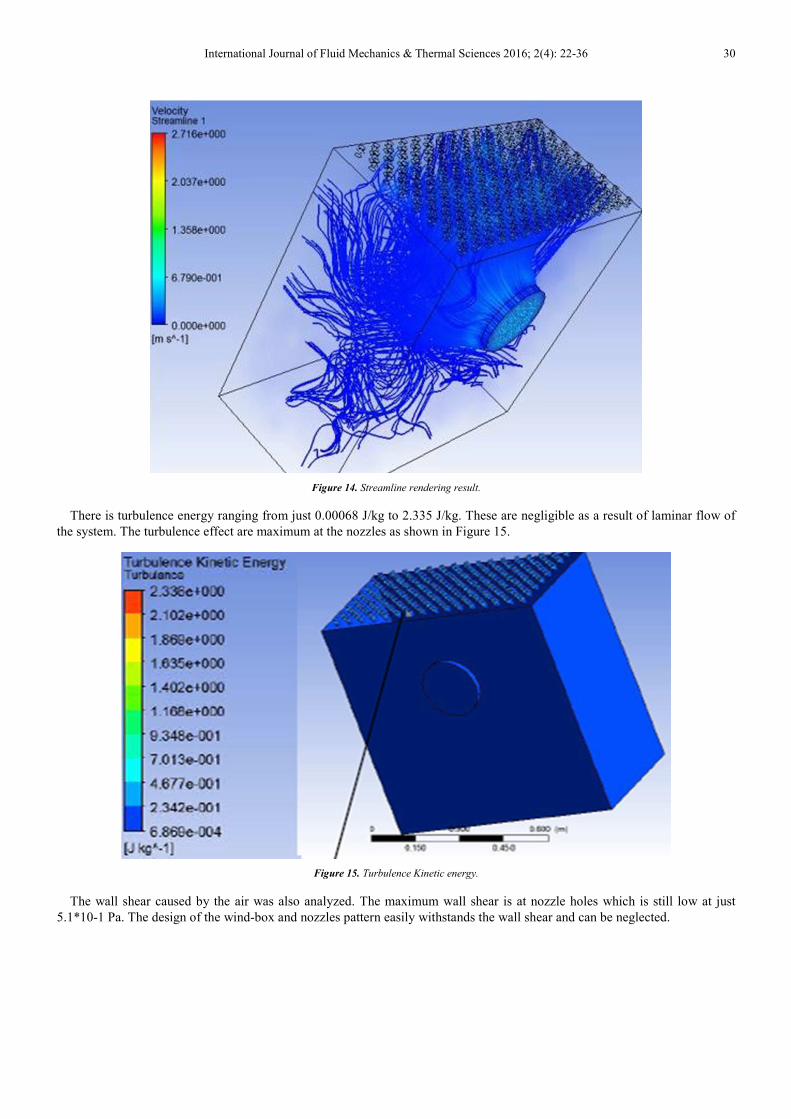
Figure 14. Streamline rendering result.
There is turbulence energy ranging from just 0.00068 J/kg to 2.335 J/kg. These are negligible as a result of laminar flow of
the system. The turbulence effect are maximum at the nozzles as shown in Figure 15.
Figure 15. Turbulence Kinetic energy.
The wall shear caused by the air was also analyzed. The maximum wall shear is at nozzle holes which is still low at just
5.1*10-1 Pa. The design of the wind-box and nozzles pattern easily withstands the wall shear and can be neglected.

31 Ishan Kafle et al.: Design and Analysis of Air Distributors and Bed Materials of Fluidized Bed Boiler
Figure 16. Wall shear caused by air.
3.7.3. Results in Modified Wind-Box
A new modified geometry and mesh was created. The walls are chamfered to an angle of 30 degrees instead of straight wall
in previous design. Though the wall in which inlet was present remains unchanged. Wall, outlets and inlet were defined in the
geometry. Then an automatic mesh was generated.
Figure 17. Modified geometry meshing.
The velocity at the outlet of the wind-box ranges from 0m/s at the edge of each nozzle hole to 2.243 m/s at the centre point
of each nozzle hole as shown in figure below. The velocity is above minimum fluidization velocity so fluidization occurs.
Figure 18. Velocity in nozzle(outlet).

International Journal of Fluid Mechanics & Thermal Sciences 2016; 2(4): 22-36 32
Figure 19. Velocity vector showing direction and speed of air.
The maximum velocity may be less than in previous
design (straight wall), but the average velocity within a
nozzle is more than in previous design. This is a positive
result.
The main improvement caused by this modification is the
flow of air from inlet to outlet. All the 2500 streamlines that
were examined during the simulation reached the outlet holes
without much deviation than in the previous wind-box. Few
streamlines that went at bottom face of the wind-box circled
towards the outlet. This pattern was rarely shown by
streamlines in previous wind-box.
Figure 20. Turbulence Kinetic energy increase but still negligible.
Figure 21. Velocity volume rendering result.
33 Ishan Kafle et al.: Design and Analysis of Air Distributors and Bed Materials of Fluidized Bed Boiler
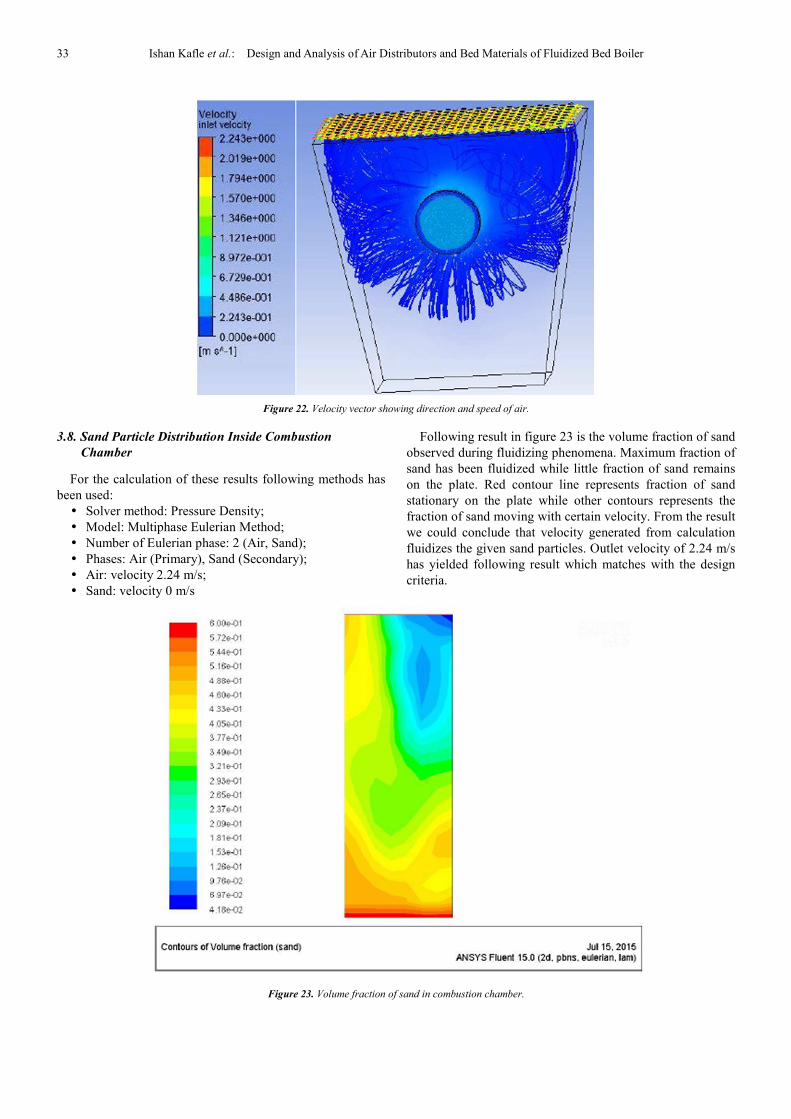
Figure 22. Velocity vector showing direction and speed of air.
3.8. Sand Particle Distribution Inside Combustion
Chamber
For the calculation of these results following methods has
been used:
� Solver method: Pressure Density;
� Model: Multiphase Eulerian Method;
� Number of Eulerian phase: 2 (Air, Sand);
� Phases: Air (Primary), Sand (Secondary);
� Air: velocity 2.24 m/s;
� Sand: velocity 0 m/s
Following result in figure 23 is the volume fraction of sand
observed during fluidizing phenomena. Maximum fraction of
sand has been fluidized while little fraction of sand remains
on the plate. Red contour line represents fraction of sand
stationary on the plate while other contours represents the
fraction of sand moving with certain velocity. From the result
we could conclude that velocity generated from calculation
fluidizes the given sand particles. Outlet velocity of 2.24 m/s
has yielded following result which matches with the design
criteria.
Figure 23. Volume fraction of sand in combustion chamber.
International Journal of Fluid Mechanics & Thermal Sciences 2016; 2(4): 22-36 34
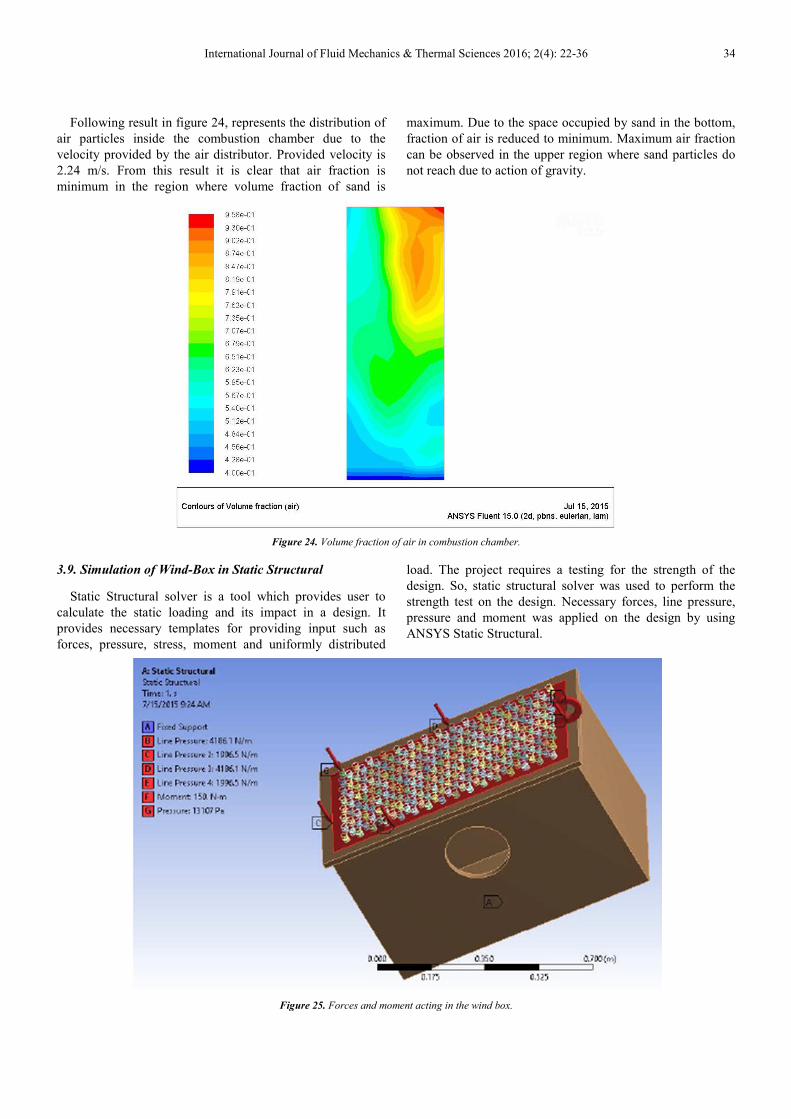
Following result in figure 24, represents the distribution of
air particles inside the combustion chamber due to the
velocity provided by the air distributor. Provided velocity is
2.24 m/s. From this result it is clear that air fraction is
minimum in the region where volume fraction of sand is
maximum. Due to the space occupied by sand in the bottom,
fraction of air is reduced to minimum. Maximum air fraction
can be observed in the upper region where sand particles do
not reach due to action of gravity.
Figure 24. Volume fraction of air in combustion chamber.
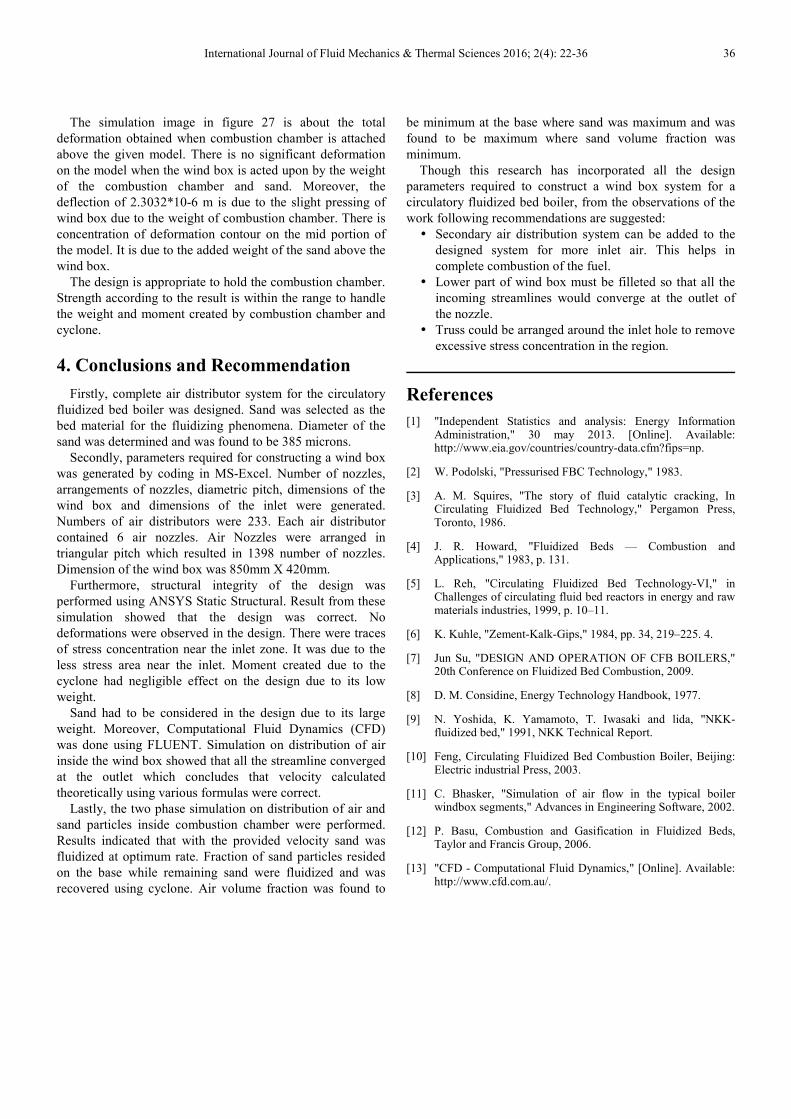
3.9. Simulation of Wind-Box in Static Structural
Static Structural solver is a tool which provides user to
calculate the static loading and its impact in a design. It
provides necessary templates for providing input such as
forces, pressure, stress, moment and uniformly distributed
load. The project requires a testing for the strength of the
design. So, static structural solver was used to perform the
strength test on the design. Necessary forces, line pressure,
pressure and moment was applied on the design by using
ANSYS Static Structural.
Figure 25. Forces and moment acting in the wind box.

35 Ishan Kafle et al.: Design and Analysis of Air Distributors and Bed Materials of Fluidized Bed Boiler
Following forces were applied on the surface of the model.
Lower plane was fixed which is denoted by A. B, C, D and E
are the uniformly distributed load around the perimeter. F
indicates the moment created due to the weight of the
cyclone. G indicates the pressure over the surface due to the
weight of sand particles. Above image shows the force
distribution along with its magnitude.
Following simulation result in figure 26 indicates the static
structural analysis of stress exerted in the air distributor
model. Maximum stress is exerted on the upper mid side of
the model. Maximum stress is 4.5866*106 Pa which is
indicated by a red contour line in the figure. Minimum stress
is indicated by blue contour whose stress value is 295.64 Pa.
From this analysis it is concluded that deflection at the point
of maximum stress. So, necessary attention should be paid at
that point. Stress concentration is reasonably high around the
hole due to its low stress area. Maximum concentration in the
upper mid portion is due to the weight of sand. Slight
concentration of stress in the upper right side is due to the
moment created by weight of the cyclone.
Figure 26. Equivalent stress in wind box.
Figure 27. Forces and moment acting in the wind box.
International Journal of Fluid Mechanics & Thermal Sciences 2016; 2(4): 22-36 36
The simulation image in figure 27 is about the total
deformation obtained when combustion chamber is attached
above the given model. There is no significant deformation
on the model when the wind box is acted upon by the weight
of the combustion chamber and sand. Moreover, the
deflection of 2.3032*10-6 m is due to the slight pressing of
wind box due to the weight of combustion chamber. There is
concentration of deformation contour on the mid portion of
the model. It is due to the added weight of the sand above the
wind box.
The design is appropriate to hold the combustion chamber.
Strength according to the result is within the range to handle
the weight and moment created by combustion chamber and
cyclone.
4. Conclusions and Recommendation
Firstly, complete air distributor system for the circulatory
fluidized bed boiler was designed. Sand was selected as the
bed material for the fluidizing phenomena. Diameter of the
sand was determined and was found to be 385 microns.
Secondly, parameters required for constructing a wind box
was generated by coding in MS-Excel. Number of nozzles,
arrangements of nozzles, diametric pitch, dimensions of the
wind box and dimensions of the inlet were generated.
Numbers of air distributors were 233. Each air distributor
contained 6 air nozzles. Air Nozzles were arranged in
triangular pitch which resulted in 1398 number of nozzles.
Dimension of the wind box was 850mm X 420mm.
Furthermore, structural integrity of the design was
performed using ANSYS Static Structural. Result from these
simulation showed that the design was correct. No
deformations were observed in the design. There were traces
of stress concentration near the inlet zone. It was due to the
less stress area near the inlet. Moment created due to the
cyclone had negligible effect on the design due to its low
weight.
Sand had to be considered in the design due to its large
weight. Moreover, Computational Fluid Dynamics (CFD)
was done using FLUENT. Simulation on distribution of air
inside the wind box showed that all the streamline converged
at the outlet which concludes that velocity calculated
theoretically using various formulas were correct.
Lastly, the two phase simulation on distribution of air and
sand particles inside combustion chamber were performed.
Results indicated that with the provided velocity sand was
fluidized at optimum rate. Fraction of sand particles resided
on the base while remaining sand were fluidized and was
recovered using cyclone. Air volume fraction was found to
be minimum at the base where sand was maximum and was
found to be maximum where sand volume fraction was
minimum.
Though this research has incorporated all the design
parameters required to construct a wind box system for a
circulatory fluidized bed boiler, from the observations of the
work following recommendations are suggested:
� Secondary air distribution system can be added to the
designed system for more inlet air. This helps in
complete combustion of the fuel.
� Lower part of wind box must be filleted so that all the
incoming streamlines would converge at the outlet of
the nozzle.
� Truss could be arranged around the inlet hole to remove
excessive stress concentration in the region.
References
[1] "Independent Statistics and analysis: Energy Information Administration," 30 may 2013. [Online]. Available: http://www.eia.gov/countries/country-data.cfm?fips=np.
[2] W. Podolski, "Pressurised FBC Technology," 1983.
[3] A. M. Squires, "The story of fluid catalytic cracking, In Circulating Fluidized Bed Technology," Pergamon Press, Toronto, 1986.
[4] J. R. Howard, "Fluidized Beds — Combustion and Applications," 1983, p. 131.
[5] L. Reh, "Circulating Fluidized Bed Technology-VI," in Challenges of circulating fluid bed reactors in energy and raw materials industries, 1999, p. 10–11.
[6] K. Kuhle, "Zement-Kalk-Gips," 1984, pp. 34, 219–225. 4.
[7] Jun Su, "DESIGN AND OPERATION OF CFB BOILERS," 20th Conference on Fluidized Bed Combustion, 2009.
[8] D. M. Considine, Energy Technology Handbook, 1977.
[9] N. Yoshida, K. Yamamoto, T. Iwasaki and lida, "NKK- fluidized bed," 1991, NKK Technical Report.
[10] Feng, Circulating Fluidized Bed Combustion Boiler, Beijing: Electric industrial Press, 2003.
[11] C. Bhasker, "Simulation of air flow in the typical boiler windbox segments," Advances in Engineering Software, 2002.
[12] P. Basu, Combustion and Gasification in Fluidized Beds, Taylor and Francis Group, 2006.
[13] "CFD - Computational Fluid Dynamics," [Online]. Available: http://www.cfd.com.au/.