descriptive report on site study results: city of...
TRANSCRIPT

1 of 42 ©
Project Acronym: eHealth IMPACT Project Title: Study on Economic Impact of eHealth:
Developing an evidence-based context-adaptive method of evaluation for eHealth
Contract Number: 2004 / S159-137695 Starting date: January 01, 2005 Ending date: December 31, 2005
Deliverable Number: D3.1c Title of the Deliverable: Descriptive report on site study results: City of
Bucharest Ambulance Service, Romania – DISPEC tele triage and dispatch system
Task/WP related to Deliv.: WP 3
Type: Internal
Authors: empirica, TanJent, project team
Partners: empirica Gesellschaft fuer Kommunikations- und Technologieforschung GmbH, Bonn, Germany
TanJent Consultancy, Hereford, UK
ESYS Consultancy, Guildford, UK
Jagiellonian University, Krakow, Poland
KADRIS Consultants, Paris, France
Project Co-ordinator Company name: empirica Gesellschaft fuer Kommunikations- und
Technologieforschung mbH
Name of representative: Simon Robinson
Address: Oxfordstr. 2, D-53111 Bonn, Germany Phone number: +49 (2 28) 9 85 30-0 Fax number: +49 (2 28) 9 85 30-12
E-mail: [email protected]
Project WEB site address: www.ehealth-impact.org

2 of 42 ©
Wendelin Schramm, empirica Communication and Technology Research
Bonn, February 2006
City of Bucharest Ambulance Service, Romania: DISPEC tele triage and dispatch system

3 of 42 ©
Part II: Table of contents
1. Policy background and context..................................................... 9
1.1 Background .............................................................................................. 9 1.1.1 Health system setting ..............................................................................9 1.1.2 EU policy context ...................................................................................10
1.2 Context.................................................................................................... 11 1.2.1 Organisation ...........................................................................................11 1.2.2 eHealth dynamic.....................................................................................16
2. The subject of the case study: DISPEC tele triage and dispatch system............................................................................ 17
2.1 The boundaries of the healthcare service............................................ 17
2.2 The process of using DISPEC............................................................... 17
2.3 Process change...................................................................................... 20 2.3.1 Change management resources...........................................................21 2.3.2 Training requirements............................................................................21
2.4 The citizens who benefit........................................................................ 21
2.5 The origin of the initiative to use an eHealth application and planned eHealth impact ......................................................................... 21
3. Case Analysis................................................................................ 21
3.1 Timeline................................................................................................... 21
3.2 Benefits ................................................................................................... 22 3.2.1 Citizens 24 3.2.2 Healthcare Provider Organisations (HPOs) .........................................24 3.2.3 Others 26
3.3 Costs 27 3.3.1 Costs of developing the application.....................................................28 3.3.2 Running costs of services.....................................................................28
3.4 Utilisation / demand ............................................................................... 28
3.5 Economic and productivity analysis .................................................... 31 3.5.1 First year of net benefits........................................................................31 3.5.2 First year of cumulative net benefits ....................................................32 3.5.3 Productivity.............................................................................................33

4 of 42 ©
3.5.4 Distribution of benefits ..........................................................................36 3.5.5 Sensitivity analysis ................................................................................37
4. Technical characteristics of the eHealth application ................ 37
5. Conclusions .................................................................................. 38
5.1 Lessons learned..................................................................................... 38
5.2 Transferability ........................................................................................ 39
6. Summary of eHI evaluation data ................................................. 40
7. Disclaimer...................................................................................... 42
8. Notes and references ................................................................... 42
List of tables Table 1: Important events in the development of SAMB ..................................................16 Table 2: Benefits indicators.................................................................................................23
List of figures Figure 1: Inflation rate for Romania 1991-2005....................................................................9 Figure 2: Number of passenger cars in Bucharest over time ..........................................10 Figure 3: Level C ambulance car ........................................................................................12 Figure 4: Number of ambulance cars for the emergency service in Bucharest .............13 Figure 5: Top-level and low-level ambulance in today’s routine use ..............................14 Figure 6: SAMB staff in 1991 ...............................................................................................14 Figure 7: SAMB staff in 1995 – one year before introducing DISPEC .............................15 Figure 8: SAMB staff in 2005 ...............................................................................................15 Figure 9: The eHealth dynamic of DISPEC.........................................................................17 Figure 10: SAMB phone operators at work........................................................................18 Figure 11: Matching emergency calls to available ambulance cars................................19 Figure 12: Screenshot for matching emergency cases and available
ambulance resources ..........................................................................................19 Figure 13: Completing emergency case report data sets with operation files ...............20 Figure 14: Response Times of the Service before and after introducing
DISPEC for emergency caregory 0 .....................................................................22 Figure 15: Response Times of the Service before and after introducing
DISPEC for emergency caregory 1 .....................................................................23
5 of 42 ©
Figure 16: Automated reports provide feedback for the emergency shifts and the controlling ......................................................................................................25
Figure 17: Average daily number of emergency calls per emergency physician ..........26 Figure 18: Cost for staff and DISPEC in realtion to total service cost ............................27 Figure 19: Total cost of SAMB with and without considering the inflation rates...........28 Figure 20: Average daily number of emergency calls per 10’000 inhabitants of
Bucharest..............................................................................................................29 Figure 21: Total number of emergency calls phone numbers 961 and 112 in
2005 .......................................................................................................................30 Figure 22: Emergency cases per 100'000 US$...................................................................34 Figure 23: Productivity, taking into account the loss of purchasing power in
Romania 1991 to 2004..........................................................................................35 Figure 24: DISPEC server ....................................................................................................38
List of charts Chart 1: Number of calls per year handled with DISPEC..................................................31 Chart 2: Estimated present value of annual cots and benefits in real terms –
1995 to 2008 ..........................................................................................................32 Chart 3: Estimated present value of cumulative costs and benefits in real
terms – 1995 to 2008 ............................................................................................33 Chart 4: Productivity – costs of DISPEC per call ..............................................................36 Chart 5: Distribution of benefits, showing the main beneficiaries. .................................37

6 of 42 ©
Part III: Executive Summary
Awards, key pres-entations, etc.
• eEurope award for eHealth 2003
Core impact o SAMB has been able to handle an increasing number of high level emergency calls with the same resources
o Waste of high level resources on low level emergency calls was reduced
o The internal response times dropped dramatically
o The time to arrive at the emergency sites dropped dramati-cally
o Taking into account the general loss of purchasing power of the Romanian Lei since 1991, SAMB has increased not only productivity, but also maintained the cost-effectiveness of the service.
Main beneficiaries
• Citizens in need can expect to receive timely and appropriate help, to the level of existing resources. All citizens in Bucha-rest, some 2.5m people, benefit from the knowledge that in case of emergency they will be provided with timely access to appropriate care
• SAMB benefits from time and other resource savings. The main benefit to the emergency service provider is the cost avoided in order to provide the same level of service without DISPEC.
Case Title: DISPEC tele triage and dispatch system Location: Bucharest, Romania Host Organisation: City of Bucharest Ambulance Service (SAMB)
7 of 42 ©
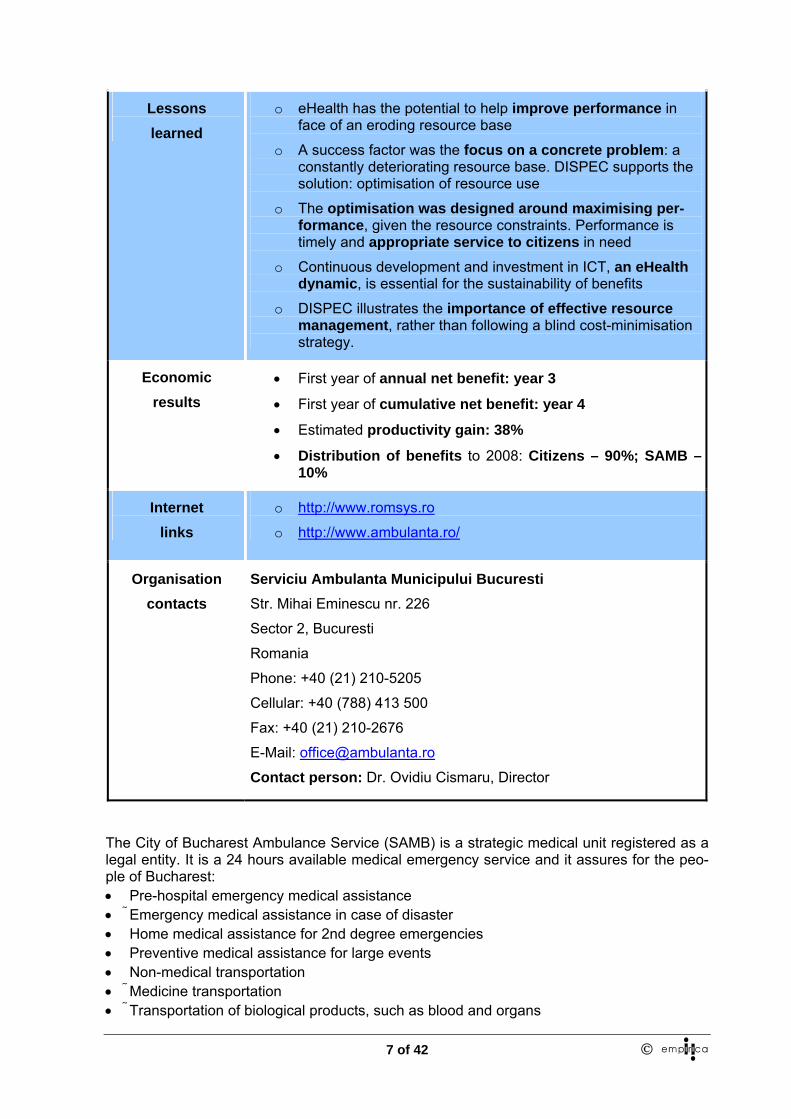
Lessons learned
o eHealth has the potential to help improve performance in face of an eroding resource base
o A success factor was the focus on a concrete problem: a constantly deteriorating resource base. DISPEC supports the solution: optimisation of resource use
o The optimisation was designed around maximising per-formance, given the resource constraints. Performance is timely and appropriate service to citizens in need
o Continuous development and investment in ICT, an eHealth dynamic, is essential for the sustainability of benefits
o DISPEC illustrates the importance of effective resource management, rather than following a blind cost-minimisation strategy.
Economic results
• First year of annual net benefit: year 3
• First year of cumulative net benefit: year 4
• Estimated productivity gain: 38%
• Distribution of benefits to 2008: Citizens – 90%; SAMB –10%
Internet links
o http://www.romsys.ro
o http://www.ambulanta.ro/
Organisation contacts
Serviciu Ambulanta Municipului Bucuresti Str. Mihai Eminescu nr. 226
Sector 2, Bucuresti
Romania
Phone: +40 (21) 210-5205
Cellular: +40 (788) 413 500
Fax: +40 (21) 210-2676
E-Mail: [email protected]
Contact person: Dr. Ovidiu Cismaru, Director
The City of Bucharest Ambulance Service (SAMB) is a strategic medical unit registered as a legal entity. It is a 24 hours available medical emergency service and it assures for the peo-ple of Bucharest: • Pre-hospital emergency medical assistance • Emergency medical assistance in case of disaster • Home medical assistance for 2nd degree emergencies • Preventive medical assistance for large events • Non-medical transportation • Medicine transportation • Transportation of biological products, such as blood and organs

8 of 42 ©
• Issuance of death certificates on Saturdays, Sundays, and legal holidays
Challenge: SAMB is facing rising costs and limited budgets and thus a constant need for productivity improvement.
eHealth application: In 1996, the DISPEC tele triage and dispatch system was introduced at SAMB. It represents a true Romanian development, where SAMB defined the contents to support internal work processes and the Bucharest software company ROMSYS developed the server-client application. Up to 1996 a paper-based system was in use. Untrained phone operators received emergency calls and filled paper slips with data of the emergency call. This paper slip was carried physically to a co-ordinating doctor, who then tried to identify adequate resources with the aid of radio operators.
Working with DISPEC means that trained phone operators enter the information from incom-ing emergency calls and attribute a presumed diagnosis together with one of four emergency levels. DISPEC then automatically generates the best match from the available rescue teams, which are scattered over the city area. Radio operators then direct the teams to the emergency sites. In routine care, the match is controlled by a coordinating physician.
9 of 42 ©
Part IV: Deliverable Content
1. Policy background and context
1.1 Background
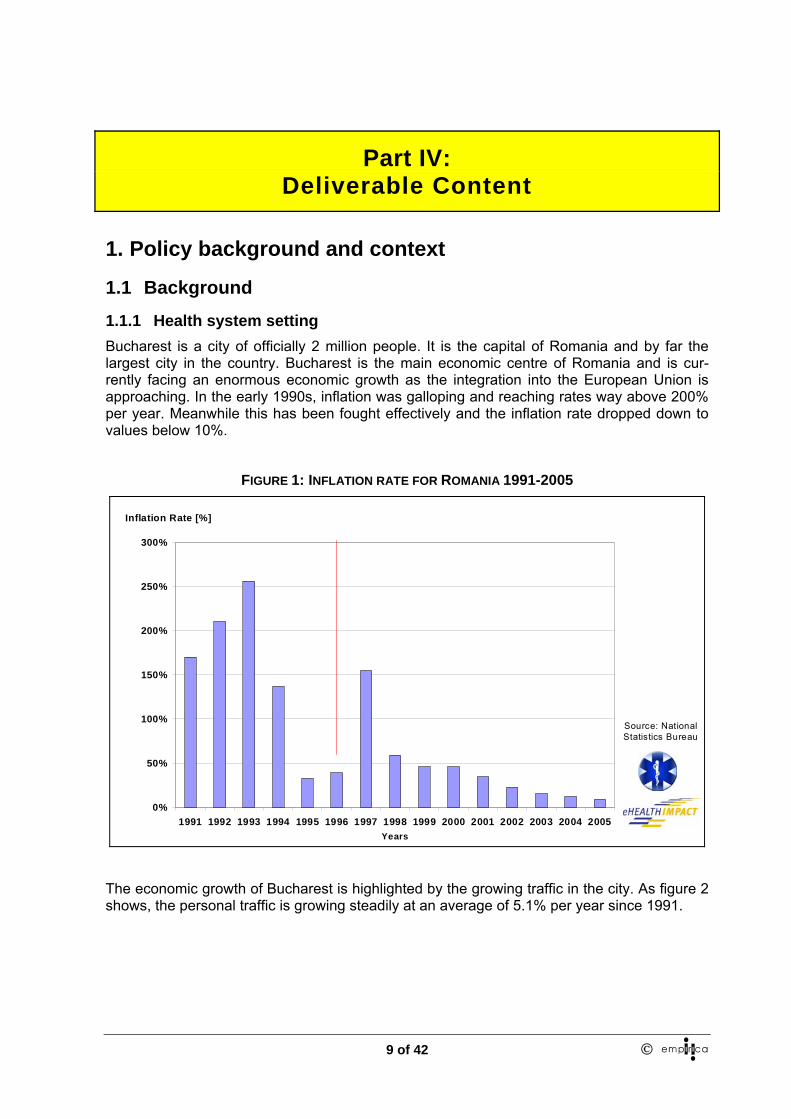
1.1.1 Health system setting Bucharest is a city of officially 2 million people. It is the capital of Romania and by far the largest city in the country. Bucharest is the main economic centre of Romania and is cur-rently facing an enormous economic growth as the integration into the European Union is approaching. In the early 1990s, inflation was galloping and reaching rates way above 200% per year. Meanwhile this has been fought effectively and the inflation rate dropped down to values below 10%.
FIGURE 1: INFLATION RATE FOR ROMANIA 1991-2005
0%
50%
100%
150%
200%
250%
300%
1991 1992 1993 1994 1995 1996 1997 1998 1999 2000 2001 2002 2003 2004 2005Years
Inflation Rate [%]
Source: National Statistics Bureau
The economic growth of Bucharest is highlighted by the growing traffic in the city. As figure 2 shows, the personal traffic is growing steadily at an average of 5.1% per year since 1991.

10 of 42 ©
FIGURE 2: NUMBER OF PASSENGER CARS IN BUCHAREST OVER TIME
-
100,000
200,000
300,000
400,000
500,000
600,000
700,000
800,000
900,000
1992 1993 1994 1995 1996 1997 1998 1999 2000 2001 2002 2003 2004 2005Years
Number of registered passenger cars
Source: Bucharest
Traffic Police
This rise in passenger cars leads to daily crowded streets and traffic jams. There are certain hotspots like downtown and the road to the airport where traffic is very intense. This situation leads to problems in the ambulance service as operation times are increasingly challenged by the traffic situation.
To assure a better solution for emergency requests, since 1994 the Ambulance Service of the City of Bucharest (SAMB) has organised sub-stations in the Bucharest districts 1,3,4,5, and 6, the headquarters also serves as a sub-station for the 2nd district.
The control and coordination of all the operative personnel in the field is made from the Cen-tral Station of SAMB. The requests are coming in from the population to the sole phone number with this destination in the country 961, and to the sole emergency phone number 112, a system assisted by the DISPEC ICT application. The 961 emergency number is de-signed for Bucharest ambulance services only. In 1994, the 112 number was introduced on a national level with the aim of gradually replacing the system of town-specific numbers and being the entry point for any kind of emergency – accidents, crime, fire, disasters etc.
SAMB collaborates with the Fire Service, the Police or Ministry of Defence (MoD) units, based upon agreements.
1.1.2 EU policy context Please use the following text to introduce this section:
“The EC action plan for a European eHealth area sets out several goals. These are set out at http://europa.eu.int/information_society/doc/qualif/health/COM_2004_0356_F_EN_ACTE.pdf This case study addresses the following action plan themes:”
− Assisting health professionals
− Supporting health authorities and health managers
− Enhancing infrastructure and technologies

11 of 42 ©
− Active involvement in achieving higher levels of interoperability and actions toward inte-grating health-related information systems.
1.2 Context 1.2.1 Organisation SAMB, the City of Bucharest Ambulance Service, is a strategic medical unit registered as a legal entity. It is a 24 hours available medical emergency service and it assures for the peo-ple of Bucharest: • Pre-hospital emergency medical assistance • Emergency medical assistance in case of disaster • Home medical assistance for 2nd degree emergencies • Preventive medical assistance for large events • Non-medical transportation • Medicine transportation • Transportation of biological products, such as blood and organs • Issuance of death certificates on Saturdays, Sundays, and legal holidays • Medical assistance and transportation to the hospital for social cases, when a social as-
sistance system lacks.
The ambulance service is under the control of the ministry of health. However, it has partial independence in organising the emergency care and is paid service fees for its operations. This payment covers only running cost but not investments, which are issued centrally by the ministry of health. This means that purchasing ambulance cars or buildings are not done by SAMB itself. The ambulance service hands in requests to the ministry and in return the au-thority grants the resources or not.
12 of 42 ©
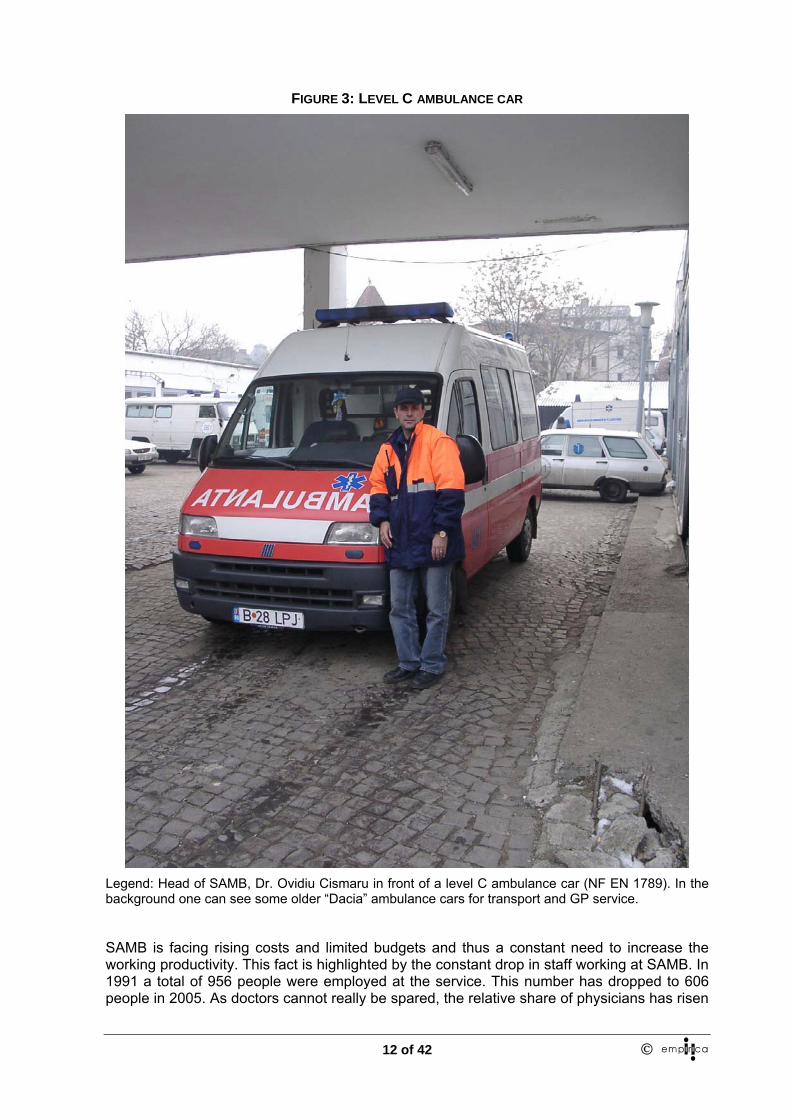
FIGURE 3: LEVEL C AMBULANCE CAR
Legend: Head of SAMB, Dr. Ovidiu Cismaru in front of a level C ambulance car (NF EN 1789). In the background one can see some older “Dacia” ambulance cars for transport and GP service.
SAMB is facing rising costs and limited budgets and thus a constant need to increase the working productivity. This fact is highlighted by the constant drop in staff working at SAMB. In 1991 a total of 956 people were employed at the service. This number has dropped to 606 people in 2005. As doctors cannot really be spared, the relative share of physicians has risen
13 of 42 ©
to 15% of the staff in 2005 compared to only 6% in 1991 (figures 6 to 8). It is mainly nurses/paramedics and drivers who lost their jobs at SAMB.
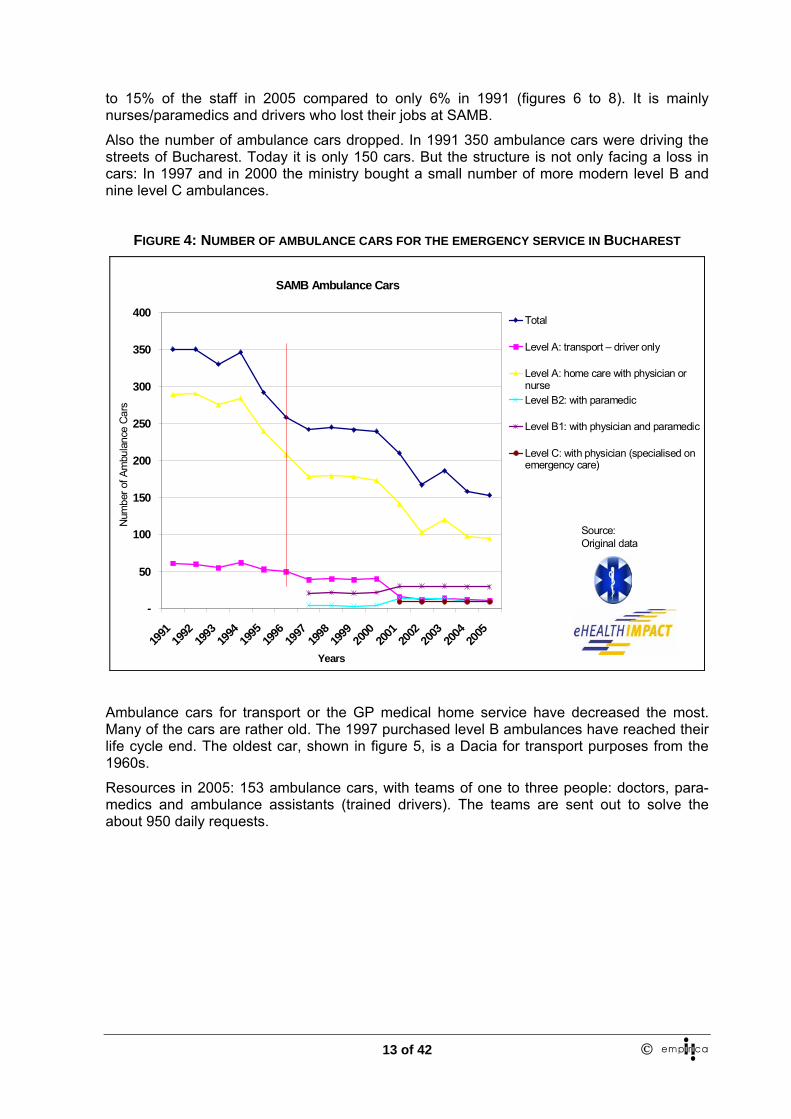
Also the number of ambulance cars dropped. In 1991 350 ambulance cars were driving the streets of Bucharest. Today it is only 150 cars. But the structure is not only facing a loss in cars: In 1997 and in 2000 the ministry bought a small number of more modern level B and nine level C ambulances.
FIGURE 4: NUMBER OF AMBULANCE CARS FOR THE EMERGENCY SERVICE IN BUCHAREST
SAMB Ambulance Cars
-
50
100
150
200
250
300
350
400
1991
1992
1993
1994
1995
1996
1997
1998
1999
2000
2001
2002
2003
2004
2005
Years
Num
ber o
f Am
bula
nce
Car
s
Total
Level A: transport – driver only
Level A: home care with physician ornurseLevel B2: with paramedic
Level B1: with physician and paramedic
Level C: with physician (specialised onemergency care)
Source: Original data
Ambulance cars for transport or the GP medical home service have decreased the most. Many of the cars are rather old. The 1997 purchased level B ambulances have reached their life cycle end. The oldest car, shown in figure 5, is a Dacia for transport purposes from the 1960s.
Resources in 2005: 153 ambulance cars, with teams of one to three people: doctors, para-medics and ambulance assistants (trained drivers). The teams are sent out to solve the about 950 daily requests.

14 of 42 ©
FIGURE 5: TOP-LEVEL AND LOW-LEVEL AMBULANCE IN TODAY’S ROUTINE USE
International data show that the resources spent for emergency care in Bucharest are low. Many countries command that one high-level ambulance car per 25’000 inhabitants is pro-videdi. In the case of Bucharest this would mean 77 high-level ambulance cars, which should comply with the European NF EN 1789 standard of December 1999. This is part of the re-source constraint that SAMB has to overcome.
The operative medical personnel in 2005 consisted of 94 doctors, 113 medical assistants, 77 emergency operators – registering clerks (prepared for the correct identification of the pre-sumptive diagnostic) and 232 ambulance assistants (drivers trained in order to be the third person to complete the team specialised in emergency interventions). Only 19 people are working in the administration and in management, making SAMB a rather lean organisation.
FIGURE 6: SAMB STAFF IN 1991
Doctors6%
Phone Operator+Radio Dispatcher
12%
Nurses21%
Drivers46%
Technicians + Administration
13%
Other1%
Management1%
ManagementDoctorsPhone Operator+Radio DispatcherNursesDriversTechnicians + AdministrationOther
Total Number Staff
1991:956
Source: Original data SAMB

15 of 42 ©
FIGURE 7: SAMB STAFF IN 1995 – ONE YEAR BEFORE INTRODUCING DISPEC
Doctors11%
Nurses15%
Drivers45%
Technicians + Administration
14%
Other1%
Phone Operator+Radio Dispatcher
12%
Management2%
ManagementDoctorsPhone Operator+Radio DispatcherNursesDriversTechnicians + AdministrationOther
Total Number Staff
1995:777
Source: Original data SAMB
FIGURE 8: SAMB STAFF IN 2005
Doctors15%
Drivers38%
Technicians + Administration
11%
Other1%
Phone Operator+Radio Dispatcher
12%Nurses
21%
Management2%
ManagementDoctorsPhone Operator+Radio DispatcherNursesDriversTechnicians + AdministrationOther
Total Number Staff 2005:
606
Source: Original data SAMB
16 of 42 ©
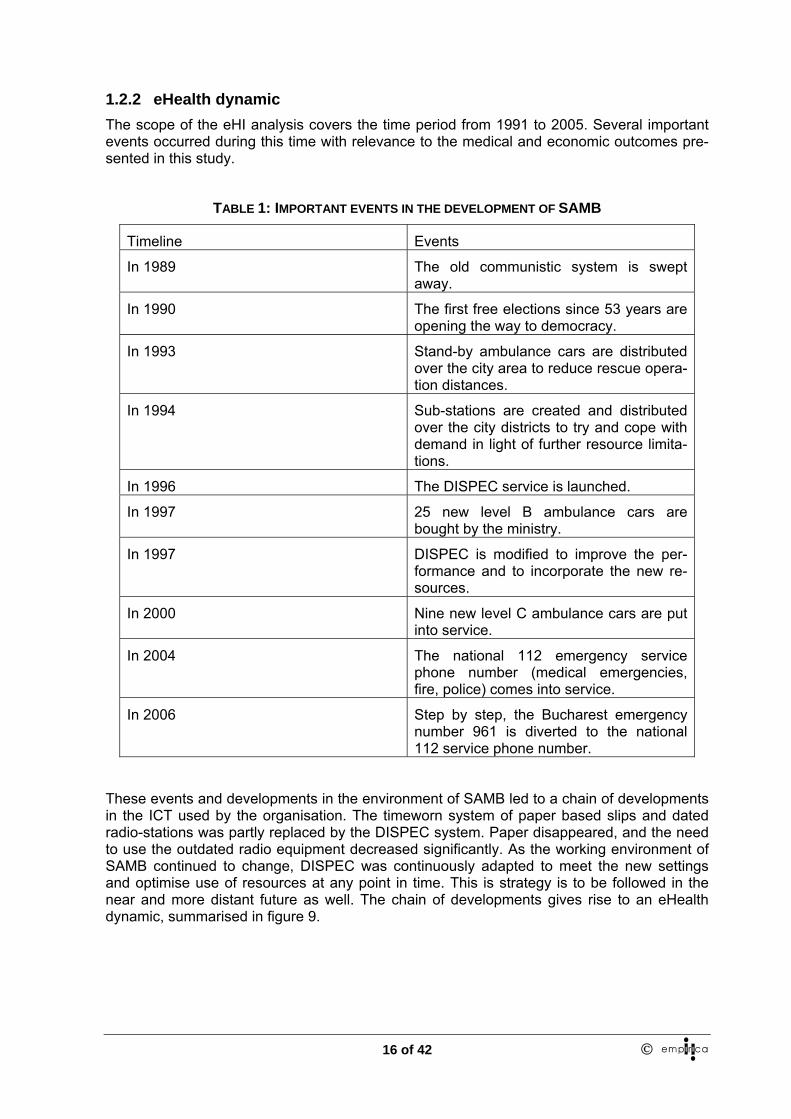
1.2.2 eHealth dynamic The scope of the eHI analysis covers the time period from 1991 to 2005. Several important events occurred during this time with relevance to the medical and economic outcomes pre-sented in this study.
TABLE 1: IMPORTANT EVENTS IN THE DEVELOPMENT OF SAMB
Timeline Events
In 1989 The old communistic system is swept away.
In 1990 The first free elections since 53 years are opening the way to democracy.
In 1993 Stand-by ambulance cars are distributed over the city area to reduce rescue opera-tion distances.
In 1994 Sub-stations are created and distributed over the city districts to try and cope with demand in light of further resource limita-tions.
In 1996 The DISPEC service is launched.
In 1997 25 new level B ambulance cars are bought by the ministry.
In 1997 DISPEC is modified to improve the per-formance and to incorporate the new re-sources.
In 2000 Nine new level C ambulance cars are put into service.
In 2004 The national 112 emergency service phone number (medical emergencies, fire, police) comes into service.
In 2006 Step by step, the Bucharest emergency number 961 is diverted to the national 112 service phone number.
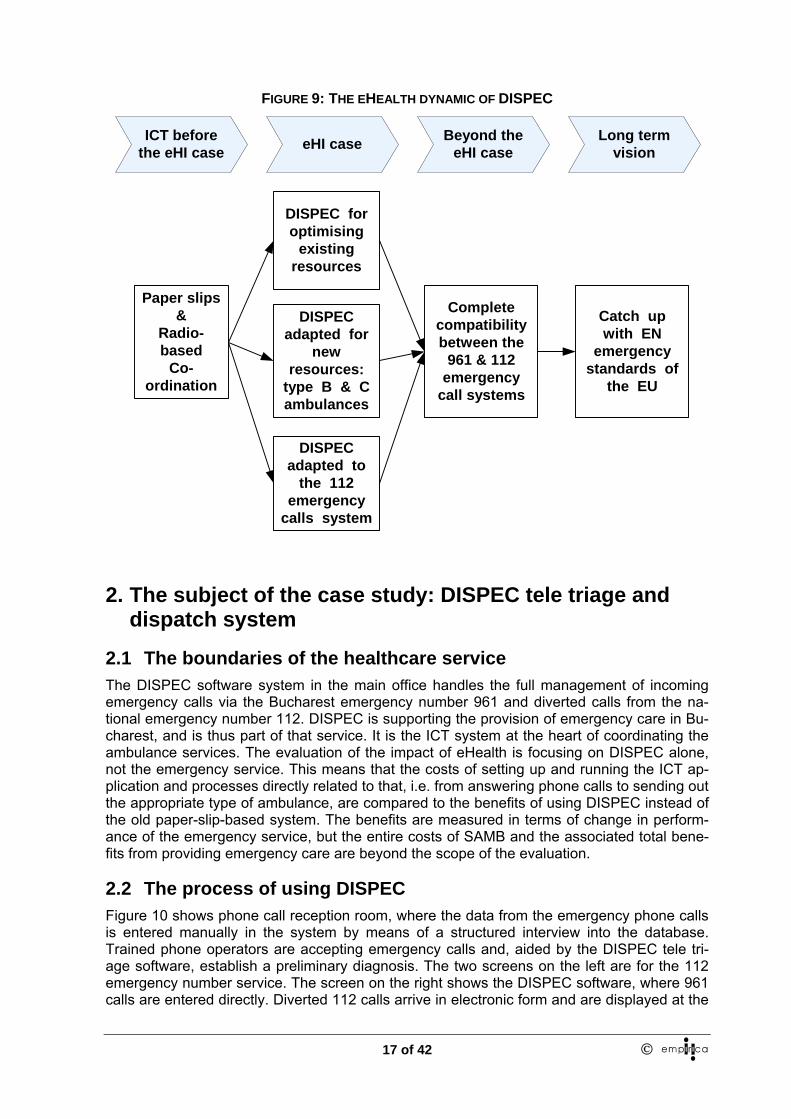
These events and developments in the environment of SAMB led to a chain of developments in the ICT used by the organisation. The timeworn system of paper based slips and dated radio-stations was partly replaced by the DISPEC system. Paper disappeared, and the need to use the outdated radio equipment decreased significantly. As the working environment of SAMB continued to change, DISPEC was continuously adapted to meet the new settings and optimise use of resources at any point in time. This is strategy is to be followed in the near and more distant future as well. The chain of developments gives rise to an eHealth dynamic, summarised in figure 9.
17 of 42 ©
FIGURE 9: THE EHEALTH DYNAMIC OF DISPEC
ICT beforethe eHI case
Beyond theeHI caseeHI case Long term
vision
Paper slips&
Radio-based
Co-ordination
DISPEC foroptimising
existingresources
DISPECadapted for
newresources:
type B & Cambulances
DISPECadapted to
the 112emergency
calls system
Catch upwith EN
emergencystandards of
the EU
Completecompatibilitybetween the
961 & 112emergency
call systems
2. The subject of the case study: DISPEC tele triage and dispatch system
2.1 The boundaries of the healthcare service The DISPEC software system in the main office handles the full management of incoming emergency calls via the Bucharest emergency number 961 and diverted calls from the na-tional emergency number 112. DISPEC is supporting the provision of emergency care in Bu-charest, and is thus part of that service. It is the ICT system at the heart of coordinating the ambulance services. The evaluation of the impact of eHealth is focusing on DISPEC alone, not the emergency service. This means that the costs of setting up and running the ICT ap-plication and processes directly related to that, i.e. from answering phone calls to sending out the appropriate type of ambulance, are compared to the benefits of using DISPEC instead of the old paper-slip-based system. The benefits are measured in terms of change in perform-ance of the emergency service, but the entire costs of SAMB and the associated total bene-fits from providing emergency care are beyond the scope of the evaluation.
2.2 The process of using DISPEC Figure 10 shows phone call reception room, where the data from the emergency phone calls is entered manually in the system by means of a structured interview into the database. Trained phone operators are accepting emergency calls and, aided by the DISPEC tele tri-age software, establish a preliminary diagnosis. The two screens on the left are for the 112 emergency number service. The screen on the right shows the DISPEC software, where 961 calls are entered directly. Diverted 112 calls arrive in electronic form and are displayed at the

18 of 42 ©
left screens. They have to be entered manually into DISPEC. This procedure explains the worsening operating times in 2004 and in 2005.
FIGURE 10: SAMB PHONE OPERATORS AT WORK
Based on the structured interview and key questions the medical call centre agent who oper-ates the DISPEC system is able to establish automatically: • A presumptive classified diagnosis • The most likely emergency category • The type of ambulance needed (emergency, non-medical transport, first or second re-
sponder, etc.).
After the input data is entered into DISPEC, the coordinating physician matches available ambulance cars to the reported emergency levels. DISPEC automatically suggests the opti-mal match and the man controls the process. The system is able to run fully automatically.

19 of 42 ©
FIGURE 11: MATCHING EMERGENCY CALLS TO AVAILABLE AMBULANCE CARS
FIGURE 12: SCREENSHOT FOR MATCHING EMERGENCY CASES AND AVAILABLE AMBULANCE RE-SOURCES
Legend: on the left of the split screen the waiting cases with the presumptive diagnoses are waiting for the matching of an ambulance car. On the right side, the available resources are visible. The coordi-

20 of 42 ©
nating physician of a shift can confirm the proposal of the DISPEC system or enter individual case-resource matches.
After an emergency operation, all paper files that document the case are entered manually into the DISPEC system for controlling and re-imbursement purposes (figure 13).
FIGURE 13: COMPLETING EMERGENCY CASE REPORT DATA SETS WITH OPERATION FILES
The innovative aspects of this eHealth approach are: • Full computerisation of emergency cases from the incoming call to the assignment of
resources. • Evaluation of all emergency cases from the incoming call until the closing of the case at
delivery of the patient at the appropriate care facility (after manual data collection of the ambulance reports from the rescue teams)
• Real-time tracking of all emergency calls until assignment of emergency resources • Establishing the presumptive diagnosis at the time of receiving an emergency call • Provision of first aid advice based on medical content integrated in the ICT system • Effective centralisation of emergency care entry points: Preventing abuse of the emer-
gency care resources by signalling double or triple requests • Maintaining an equilibrium between competence and distance by suggesting optimal
type of ambulance and distance to run (level of care) • Controlling of processes and resources on the basis of medical and activity statistics (by
shift, day, week, month and year)
2.3 Process change Up to 1996 a paper system was in use. Untrained phone operators received emergency calls and filled paper slips with data of the emergency call. This paper slip was carried physically to a coordinating doctor, who then tried to identify adequate resources with the aid of radio operators.

21 of 42 ©
In 1996 the old system was replaced by the DISPEC software platform. As experience was gathered with the new approach, and new, level B, ambulance cars were bought by the min-istry in 1997 the DISPEC system was adapted.
2.3.1 Change management resources The DISPEC system was installed at SAMB by the software developing company ROMSYSii.
The organisational change was driven by the SAMB management as part of their task to en-sure maximum quality of service at the given budget. The bulk of change management re-sources was consumed by training activities.
2.3.2 Training requirements Training is essential for the success of the system. First, the phone operators have to be trained in using the ICT. Further, they need a more than general understanding of medical terminology and conditions, as well as some knowledge about possible responses.
The software manufacturer, ROMSYS, provided train-the-trainer seminars as part of the ser-vice contract. The SAMB staff did the education of the phone operators, supported by the software manufacturer. As SAMB holds a training centre for emergency care, rooms, equip-ment and trainers are part of the SAMB resources.
2.4 The citizens who benefit Through the optimised use of resources ensured by DISPEC, citizens in need can expect to receive timely and appropriate, to the level of existing resources, help. This is of particular importance to those requiring urgent care. However, all citizens benefit from the knowledge that even if they do not have a problem at the moment, in case of an emergency they will be provided with timely access to appropriate care. This affects every person living in, or visit-ing, Bucharest – over 2.5m people.
2.5 The origin of the initiative to use an eHealth application and planned eHealth impact
The basic idea behind DISPEC was to speed up the internal processes by the use of ICT and to allow for an optimised matching of the limited available resources to the emergency levels of the incoming requests.
From the very beginning it was clear that the ICT solution should be a Romanian solution, meaning that SAMB determined the contents of the system that should match the work proc-esses. And, it also meant that the software should be a Romanian one, assuring optimal sup-port, short distances and lower cost compared to international available solutions from coun-tries with higher levels of resources and infrastructure.
3. Case Analysis
3.1 Timeline
− Planning & development stage: 1995 to 1996
− Implementation stage: 1996
− Running stage for routine operation, since 1996, forecast to 2008

22 of 42 ©
3.2 Benefits The introduction of DISPEC led to a reduction of rescue times. The average response time for all types of emergency calls in 1992 was about 72 minutes for an ambulance to arrive on site. This was cut down to an average of 24 minutes in 1997 and 18 minutes today.
In 2002 the arrival time was cut down to a little more than 12 minutes on average. For “code red” top-level emergency calls the maximum response time to assign an adequate ambu-lance car had been less than 60 seconds. Since then, an increase by 6 minutes per highest classified emergency case can be observed. Compared to international standards this in-crease represents a relevant and possibly life-threatening worsening of the service delivery. The analysis shows that three main factors are responsible:
1. Increasing car traffic in Bucharest 2. Increasing number of severe emergencies and decreasing SAMB resources 3. Higher response times in handling emergency calls after introduction of the 112 emer-
gency number
It should be stated though, that none of these reasons relate to the DISPEC system as such and are not in the focus of this research. DISPEC helped to reduce operation times funda-mentally and to avoid even worse performance given the factors listed above.
FIGURE 14: RESPONSE TIMES OF THE SERVICE BEFORE AND AFTER INTRODUCING DISPEC FOR EMERGENCY CAREGORY 0
00:00:00
00:14:24
00:28:48
00:43:12
00:57:36
01:12:00
01:26:24
01:40:48
01:55:12
1991
1992
1993
1994
1995
1996
1997
1998
1999
2000
2001
2002
2003
2004
2005
T3: Time to assigningappropriate resource
T6: Time to reachemergency site
T8: Total Time
Source: Original data SAMB
Years

23 of 42 ©
FIGURE 15: RESPONSE TIMES OF THE SERVICE BEFORE AND AFTER INTRODUCING DISPEC FOR EMERGENCY CAREGORY 1
00:00:00
00:14:24
00:28:48
00:43:12
00:57:36
01:12:00
01:26:24
1991
1992
1993
1994
1995
1996
1997
1998
1999
2000
2001
2002
2003
2004
2005
T3: Time to assigningappropriate resource
T6: Time to reach emergencysite
T8: Total Time
Source: Original data
Years
The changes in response times have in impact on citizens, as they receive more timely care, as well as SAMB, in form of productivity gains. These are described below.
The main estimated benefit – direct gains, not cash savings – indicators are summarised in Table 2.
TABLE 2: BENEFITS INDICATORS
Benefits Utilisation Unit cost Time Willingness to pay
Probability
Patients
Shorter waiting time Estimated number of patients
Mean time saving
Estimated value per minute
Reduction in deaths Estimated sustained reduction in deaths
Estimated value of a life
Estimated impact of ehealth on reduction in deaths
Healthcare Provid-ers
Time saving Number of staff
Mean cost of staff
Time saved with eHealth

24 of 42 ©
service
Reduced waste Number of doctors
Mean cost of doctors
Time saved with eHealth
Cost avoidance Estimated extra staff needed for the eHealth benefit, but with-out eHealth
3.2.1 Citizens Citizens benefit by the increased timeliness of service delivery. The standardised registration of the emergency calls by trained staff assures that all necessary information about the emergency and its location is stored. This helps identify the appropriate rescue team and find the correct location, improving timeliness and making the service more effective, also reduc-ing the risk form harm due to inappropriate equipment used, or timing of care.
Even more significant is the benefit from more appropriate allocation of medical resources, which results in a decrease in the number of incidents of death among the emergency cases. The number of deaths per emergency case decreased by 35% in 2005 compared to 1992. Many other factors influence the number of deaths in emergency cases, yet the general de-crease after the introduction of DISPEC is no coincidence. Nonetheless, in order to avoid potential overestimation of impact, only a proportion, 25%, of the credit has been assigned to DISPEC.
3.2.2 Healthcare Provider Organisations (HPOs) DISPEC was designed in order to facilitate the emergency healthcare provided by SAMB. The main source of benefits to SAMB, come from the improved efficiency due to optimisation of the workflow process between receiving a call and sending out an ambulance team. The workflow was optimised after introduction of the eHealth software. This includes: • Decrease of radio conversations by automatic transmission and printing of requests be-
tween main office and the district substations • Optimal distribution of the types of teams by shifts, by the requesting peaks and by se-
verity of cases • Facilitating the improvement of the service activity, based on current statistics and mor-
bidity studies.
This improvement in efficiency is measured in time savings for operators and comprises 81% of total HPO benefits to 2008.

25 of 42 ©
FIGURE 16: AUTOMATED REPORTS PROVIDE FEEDBACK FOR THE EMERGENCY SHIFTS AND THE CONTROLLING
Legend: Reports for every shift and aggregated over time periods allow an optimal planning of the resources needed. For instance, with regard to number of staff needed on weekends or high days.
A small, but significant proportion of the benefits to SAMB, 14% of total to 2008, come from cost avoidance. The number of calls increases by an average of 3% each year (1997 to 2005). By using DISPEC, SAMB avoid an annual cost increase of a similar magnitude in or-der to cope with the higher demand.
Up to 1996, the ambulance service was slow and it was not sure, whether the appropriate level of care was allocated to the cases. The low training level of the phone operators led to a certain waste of resources (see figure 17) as in many cases the doctors returned without having treated anyone. DISPEC assures that, from the very beginning, emergency calls are registered in a way that important emergencies are handled with priority and that the most appropriate available resource is allocated to the individual emergency case. DISPEC pre-vents the limited number of physicians going astray to lesser important operations, and en-sures that the addresses are registered better than before, thus assisting the rescue teams in finding the emergency site.

26 of 42 ©
FIGURE 17: AVERAGE DAILY NUMBER OF EMERGENCY CALLS PER EMERGENCY PHYSICIAN
1.3
0.9
3.5
1.6
3.6
0.0
0.5
1.0
1.5
2.0
2.5
3.0
3.5
4.0
1991 1992 1993 1994 1995 1996 1997 1998 1999 2000 2001 2002 2003 2004 2005Years
Total nr. ofcases (0and 1stdegree) in24h /numberphysicians
Nr. ofemergencycalls (0 and1st degree)/ numberphysicians
Source: Original data SAMB
Before introducing DISPEC, only 56% of classified 0 or 1st emergency category emergency calls led to an emergency operation / case (figure 17). This improves dramatically with the introduction of the new IT system and helps to make better use of the limited resources. After the adaptation of 1997 the use of trained DISPEC phone operators assures almost com-pletely that emergency crews are not sent out because of false alarms. The value of this re-duction in waste is estimated by calculating the avoided cost of physicians being sent in vain using full time equivalent employment cost numbers. This reduction in waste accounts to 4% of the total cumulative benefits to 2008.
In addition to the above, DISPEC facilitated a reduction in the number of phone lines re-quired for meeting incoming calls. In 1992, 230 phone lines were in use. This was decreased to 160 before the implementation of DISPEC due to lesser service activity. Today only 80 phones lines are in use as DISPEC reduces the call times. The associated reduction in costs to SAMB accounts for 2% of the benefits.
3.2.3 Others Bucharest is on its way from a national centre of importance to becoming a European capital of a modern democracy that will shortly enter the European Community. This rise in interna-tional importance of the city requires better standards in the basic services to citizens. Better healthcare is a challenge to Romania and in the case of medical emergencies first in the chain is the service of SAMB, which has improved by the aid of an eHealth application.
In addition to the concrete benefits of citizens and SAMB, DISPEC facilitates the provision of information requested by Police, Prosecutor’s Office, Ministry of Health, Public Health Direc-tion and other official requesters in a very short time, thus improving the efficiency and effec-tiveness of communication channels in Romania’s capital.
The impact on the city of Bucharest cannot be neglected. However, the benefits are of sec-ond order, stemming from the improved services with associated benefits already accounted

27 of 42 ©
for at their primary location of impact. Second order impact is not part of the economic evaluation of eHI and accordingly no monetary values have been assigned to the above-described benefits to the city of Bucharest.
3.3 Costs The cost for the DISPEC application varied between 1.5% of total SAMB cost in 2005 and 4.3% in the year 2001 (figure 18). This cost can be considered to be low in comparison to the vital importance for its function in the emergency care system and the ability to assure eco-nomic use of the available resources. As staff was reduced continuously over the years, the proportion of wages in relation to total cost dropped from 87% in the year 1997 to 56% in the year 2005. The total cost of SAMB rose remarkably to 5.78 million US$ in the year 2005.
FIGURE 18: COST FOR STAFF AND DISPEC IN REALTION TO TOTAL SERVICE COST
0%
20%
40%
60%
80%
100%
1991
1992
1993
1994
1995
1996
1997
1998
1999
2000
2001
2002
2003
2004
2005
0
1,000,000
2,000,000
3,000,000
4,000,000
5,000,000
6,000,000
7,000,000Proportion staff cost from SAMBtotal cost
Proportion DISPEC cost fromSAMB total cost
SAMB Cost in US$
Source: Original data SAMB
Years
The increase in total cost of SAMB goes in line with the inflation rates mentioned already. If one indexes the total cost of SAMB to the inflation rate, as illustrated in figure 19, it becomes clear that the cost indexed to the year 1991 are still lower than at the beginning of the obser-vation period. The introduction of DISPEC first didn’t change the cost perspective. After im-proving the system one can see a peak downwards indicating relevantly lower cost for the years 1997 and 1998.

28 of 42 ©
FIGURE 19: TOTAL COST OF SAMB WITH AND WITHOUT CONSIDERING THE INFLATION RATES
175,200
183
128137
145
160
203
160
134
128
128
80
151
168164
116
-
20,000
40,000
60,000
80,000
100,000
120,000
140,000
160,000
180,000
200,000
1991
1992
1993
1994
1995
1996
1997
1998
1999
2000
2001
2002
2003
2004
2005
Years
Cost
[Mio
. Leu
]
-
50
100
150
200
250 total costs [mio. Lei]
total costs indexed byinflation [mio. Lei]
Source: Original data SAMB
For the eHI evaluation, the relevant costs are those related to DISPEC, not the total SAMB costs. This includes costs of developing the application, as well as running costs of operating DISPEC.
3.3.1 Costs of developing the application DISPEC was developed by the software manufacturer called ROMSYS. The service charges to ROMSYS, including initial as well as continuous development, cover most of the ICT in-vestment. Together with the investment in hardware, this accounts to about 55% of total costs of DISPEC till 2008. Training is the main item in the organisational investment associ-ated with DISPEC and totals 5% of the total costs.
3.3.2 Running costs of services The remaining 40% of the total costs of DISPEC are the costs of running the service, the optimisation of which triggers the benefits – the employment costs for operators.
3.4 Utilisation / demand The number of daily calls was the highest in the early 1990s. This is explained by the old function of the SAMB operation. 961 at that time was a medical phone number for most medical problems of the population – not only emergency calls. Still today many operations are linked to the GP service of SAMB. In 1991 an average daily 1094 calls were handled. In 2005 this number was 975 calls per 24 hours. Ever since 1996 the number of 0 and 1st de-gree emergency calls have been increasing. In 1996, 0.6 of such cases were registered for 10’000 inhabitants of Bucharest. This number more than doubled to 1.7 category 0 & 1 emergency calls per 24 hours in 2005, whereas, the total number of emergency categories increased on a smaller scale: In 1996 a total of 3.7 cases were handled per 10’000 inhabi-tants and day versus 5.1 cases in 2005 respectively.

29 of 42 ©
FIGURE 20: AVERAGE DAILY NUMBER OF EMERGENCY CALLS PER 10’000 INHABITANTS OF BU-CHAREST
5.1
4.5
5.2
4.03.7
1.7
0.70.6
0
1
2
3
4
5
6
1991 1992 1993 1994 1995 1996 1997 1998 1999 2000 2001 2002 2003 2004 2005Years
Case
s / 1
0 00
0 po
pula
tion
Total nr. ofcalls in 24 h /10'000population
Nr. ofemergencycalls in 24h (0and 1stdegree) /10'000population
Source: Bucharest statistical office & original data SAMB
In 2004 the 112 emergency phone number, serviced by the STS special telecommunication service of Romania, was launched in order to combine medical emergencies, calls for police and the fire brigades under one central phone number. The share of 112 calls incoming at SAMB was 7.4% in 2005 and is rising as progressively mobile phone networks and in the near future all emergency calls to the Bucharest 961 emergency number are first diverted to the 112 call centre (figure 21). There, the addresses of the callers and the circumstances are registered and then the callers are diverted to the SAMB call centre. This leads to consider-able confusion, because callers reporting an emergency case have to give their information twice. At the moment, both systems are not compatible.
The analysis shows that the internal response times have become longer in 2004 and in 2005 for the working flow where calls are entered into the DISPEC system.

30 of 42 ©
FIGURE 21: TOTAL NUMBER OF EMERGENCY CALLS PHONE NUMBERS 961 AND 112 IN 2005
300832819228359 27804
34682 27110 29031 28942 29118 3025527080 28663
1419 1708 2275 2198 2877 2291 2713 2771 2487 2295 2161 2886
0%
20%
40%
60%
80%
100%
IAN FEB MAR APR MAI IUN IUL AUG SEP OCT NOV DEC
Months in 2005
Calls 112Calls 961
Total Calls 961: 349'319Total Calls 112: 28'081Ratio 112 / 961: 7.44%
DISPEC was introduced in 1996 and all calls were handled through the system since then. Chart 1 shows the increase in utilisation of DISPED. It surges up with implementation in 1996 and then it follows the trend of gradually increasing demand.

31 of 42 ©
CHART 1: NUMBER OF CALLS PER YEAR HANDLED WITH DISPEC
0
50.000
100.000
150.000
200.000
250.000
300.000
350.000
400.000
450.000
1994 1995 1996 1997 1998 1999 2000 2001 2002 2003 2004 2005 2006 2007 2008
Num
ber o
f em
erge
ncy
calls
goi
ng th
roug
h D
ISPE
C
3.5 Economic and productivity analysis Introductory remark: all cost in this case description are given in Romanian old Lei and/or in US$ as DISPEC was implemented years before the introduction of the Euro. The special situation of Romania, being one of the new democracies of Eastern Europe, includes dra-matic economic changes (e.g. 1993 inflation rate > 200%) that economic results expressed in Euro would be disputable.
3.5.1 First year of net benefits The present values of estimated benefits exceed the estimated costs of running DISPEC in 1997. Benefits only start being realised after DISPEC was implemented, in 1996. The eco-nomic value of benefits peaks in 1998. The decline thereafter is dew to changes in perform-ance resulting from factors different from DISPEC, already mentioned above. DISPEC none-theless manages to realise net benefits each year. The costs in 1995 and 1996 include the initial investment, which explains the significant difference to later years. The combined effect of the present value of costs and benefits is shown in Chart 2.

32 of 42 ©
CHART 2: ESTIMATED PRESENT VALUE OF ANNUAL COTS AND BENEFITS IN REAL TERMS – 1995 TO 2008
0
500
1.000
1.500
2.000
2.500
1995 1996 1997 1998 1999 2000 2001 2002 2003 2004 2005 2006 2007 2008
LEU
/ 10
0 00
0
PV of total costs PV of benefits
3.5.2 First year of cumulative net benefits Some four years after the start of the project, in 1998, which is about three years after live implementation, the cumulative benefits exceed cumulative costs. This leads to a sustained cumulative positive net benefit up to 2008. Chart 3 shows the impact after discounting.

33 of 42 ©
CHART 3: ESTIMATED PRESENT VALUE OF CUMULATIVE COSTS AND BENEFITS IN REAL TERMS – 1995 TO 2008
0
2.000
4.000
6.000
8.000
10.000
12.000
14.000
1995 1996 1997 1998 1999 2000 2001 2002 2003 2004 2005 2006 2007 2008
LEU
/ 10
0 00
0
PV of cumulative costs PV of cumulative benefits
3.5.3 Productivity In 1995 the, year before starting DISPEC, 15’965 patients could be treated with 100’000 US$ spent for emergency care. In 1997 the year of introducing DISPEC this number rose to 24’075 patients per 100’000 US$ and dropped down to 5’419 patients (figure 22) in 2005. One can conclude that DISPEC led to improvements improvement of the cost-effectiveness of the SAMB service, but other factors, in particular the inflation rate of 155% in 1997, fol-lowed by rates of about 50% in the late 1990s and early 2000s, contributed to the effects being only temporary.

34 of 42 ©
FIGURE 22: EMERGENCY CASES PER 100'000 US$
21125
1766615965
15843
10233
10971 10337
86988945
107771351313967
7285
24075
0
5000
10000
15000
20000
25000
30000
1991 1992 1993 1994 1995 1996 1997 1998 1999 2000 2001 2002 2003 2004Years
Number of cases
Cases per year /100'000 US$
Source: Original data SAMB
Nonetheless, the positive impact of DISPEC is not temporary. Without the system, SAMB’s performance would have deteriorated in face of the economic environment. DISPEC enabled real terms performance to be sustained. If one takes the value of the LEI in real terms, the sustained productivity improvement becomes more evident (figure 23). Taking the nominal LEI values into account one sees an exponential decrease of the number of patients to be treated with a million Lei. After indexing with the inflation rate, it becomes apparent that SAMB was able to maintain its productivity. After the introduction of DISPEC a spike can be seen: a sign of the immediate impact.

35 of 42 ©
FIGURE 23: PRODUCTIVITY, TAKING INTO ACCOUNT THE LOSS OF PURCHASING POWER IN ROMA-NIA 1991 TO 2004
1826
2022
1846
2349
17571661 1866
2007
2055
1659
1893
1797
1563
1736
1545
0
500
1000
1500
2000
2500
1991
1992
1993
1994
1995
1996
1997
1998
1999
2000
2001
2002
2003
2004
2005
Cases per year / 1million Lei
Cases per year / total costindexed by inflation
Source: Original data SAMB
Year
The unit cost of handling one emergency call with DISPEC drops by some 38% between the introduction of the service in 1996 and 2008. The relative increases in unit costs in 2000 and 2004 are explained by the need for adaptation at the introduction of new equipment, level C ambulances, in 2000, and the incorporation of 112 calls into the system.

36 of 42 ©
CHART 4: PRODUCTIVITY – COSTS OF DISPEC PER CALL
0
10000
20000
30000
40000
50000
60000
70000
80000
90000
1994 1995 1996 1997 1998 1999 2000 2001 2002 2003 2004 2005 2006 2007 2008
LEU
3.5.4 Distribution of benefits The distribution of benefits is shown in chart 5. On average between 1996 and 2008, the largest proportion of benefits, about 90%, goes to the citizens in need. Healthcare providers, i.e. SAMB, are the second largest beneficiaries with 10% of total benefits to 2008.

37 of 42 ©
CHART 5: DISTRIBUTION OF BENEFITS, SHOWING THE MAIN BENEFICIARIES.
Citizens90%
HPOs10%
3.5.5 Sensitivity analysis The results of the economic evaluation have been tested by increasing all costs by 50%, reducing all benefits by 50%, and changing the discount rate by the same amounts.
The effect of increasing costs by 50% does not have an impact on annual net benefits, and defers the first year of cumulative net benefits by one year, to year five. Reducing the bene-fits by 50% defers the first year of cumulative net benefits by six years to year ten, 2004. The benefit is nevertheless sustained.
Increasing the discount rate by 50% does not defer the first year of net benefit, neither an-nual, nor cumulative. Halving the discount rate does not change the first years of net benefit either.
The overall conclusion of benefits exceeding costs is not sensitive to the assumptions of the study. This gives an indication of the robustness of the results of the evaluation.
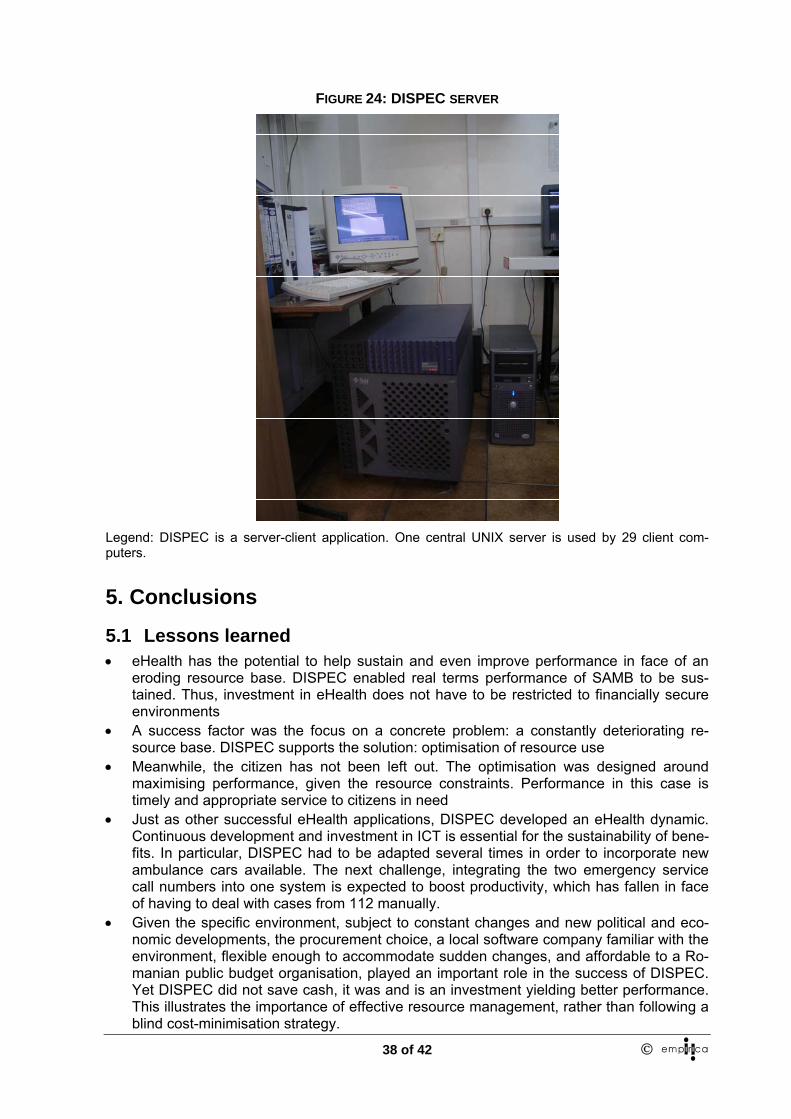
4. Technical characteristics of the eHealth application In simple terms, DISPEC consists of one emergency database hosted by a central server, which is continuously backed up (figure 24). In total, 29 client computers with stepwise regu-lated and role-dependant rights have access to the database.
On-line printers document any database operation on paper as a hardcover copy of the ser-vice operations.
38 of 42 ©
FIGURE 24: DISPEC SERVER
Legend: DISPEC is a server-client application. One central UNIX server is used by 29 client com-puters.
5. Conclusions
5.1 Lessons learned • eHealth has the potential to help sustain and even improve performance in face of an
eroding resource base. DISPEC enabled real terms performance of SAMB to be sus-tained. Thus, investment in eHealth does not have to be restricted to financially secure environments
• A success factor was the focus on a concrete problem: a constantly deteriorating re-source base. DISPEC supports the solution: optimisation of resource use
• Meanwhile, the citizen has not been left out. The optimisation was designed around maximising performance, given the resource constraints. Performance in this case is timely and appropriate service to citizens in need
• Just as other successful eHealth applications, DISPEC developed an eHealth dynamic. Continuous development and investment in ICT is essential for the sustainability of bene-fits. In particular, DISPEC had to be adapted several times in order to incorporate new ambulance cars available. The next challenge, integrating the two emergency service call numbers into one system is expected to boost productivity, which has fallen in face of having to deal with cases from 112 manually.
• Given the specific environment, subject to constant changes and new political and eco-nomic developments, the procurement choice, a local software company familiar with the environment, flexible enough to accommodate sudden changes, and affordable to a Ro-manian public budget organisation, played an important role in the success of DISPEC. Yet DISPEC did not save cash, it was and is an investment yielding better performance. This illustrates the importance of effective resource management, rather than following a blind cost-minimisation strategy.
39 of 42 ©
5.2 Transferability The DISPEC system is designed specifically for the ambulance services of the city of Bucha-rest. Nevertheless, from a technical point of view, the system can be transferred to emer-gency services in any other city. However, the most important feature of transferability is not the ICT component of the eHealth application, but the approach, attitude and culture of the team to the eHealth investment.

40 of 42 ©
DISPEC 1994 1995 1996 1997 1998 1999 2000
LEU 100,000,000 LEU 100,000,000 LEU 100,000,000 LEU 100,000,000 LEU 100,000,000 LEU 100,000,000 LEU 100,000,000
Estimated COSTSeHEALTH INVESTMENTICT application - 1.059 1.294 337 155 184 83 Organisational activities - - - - - 64 61 ANNUAL OPERATING COSTS of service 156 142 137 106 127 165 171 Total estimated costs 156 1.201 1.431 443 282 413 315PV of total costs 162 1.201 1.383 414 254 360 265PV of cumulative costs 162 1.201 2.584 2.997 3.252 3.611 3.876
Estimated BENEFITS Citizens 0 0 997 1.671 2.084 1.555 1.474HPOs 0 0 -3 109 114 92 1233rd party payerseHealth provider (if not one of the above)Total Estimated Benefits 0 0 994 1.780 2.198 1.648 1.596PV of benefits 0 0 961 1.662 1.982 1.436 1.344PV of cumulative benefits 0 0 961 2.623 4.605 6.041 7.385
Net benefitsNet benefits not discounted -156 -1.201 -437 1.337 1.916 1.235 1.281PV of net benefits -162 -1.201 -422 1.248 1.728 1.076 1.079PV of cumulative net benefits -162 -1.201 -1.623 -375 1.354 2.430 3.509
Unit costs: DISPEC cost per call - - 46.940 26.471 28.724 37.447 41.112
Service utilisation - Nr. of emergency calls 338.089 337.119 278.563 287.264 314.630 313.987 296.869Service utilisation - Nr. of calls going through dispec 0 0 208.922 287.264 314.630 313.987 296.869
6. Summary of eHI evaluation data

41 of 42 ©
DISPEC
Estimated COSTSeHEALTH INVESTMENTICT applicationOrganisational activitiesANNUAL OPERATING COSTS of serviceTotal estimated costsPV of total costs PV of cumulative costs
Estimated BENEFITS CitizensHPOs3rd party payerseHealth provider (if not one of the above)Total Estimated BenefitsPV of benefitsPV of cumulative benefits
Net benefitsNet benefits not discountedPV of net benefitsPV of cumulative net benefits
Unit costs: DISPEC cost per call
Service utilisation - Nr. of emergency callsService utilisation - Nr. of calls going through dispec
2001 2002 2003 2004 2005 2006 2007 2008
LEU 100,000,000 LEU 100,000,000 LEU 100,000,000 LEU 100,000,000LEU
100,000,000 LEU 100,000,000 LEU 100,000,000LEU
100,000,000
137 47 29 40 39 65 38 38 85 53 - 17 14 14 14 14
164 149 155 162 158 158 158 158 386 249 184 219 210 237 209 209314 196 140 160 149 162 139 134
4.190 4.386 4.526 4.686 4.835 4.997 5.136 5.270
441 460 629 784 762 776 790 80399 84 76 143 164 174 183 191
540 544 705 927 926 950 972 994439 428 536 680 656 651 644 635
7.824 8.252 8.788 9.468 10.125 10.776 11.419 12.055
154 295 521 709 716 714 763 784125 232 396 520 507 489 505 501
3.634 3.866 4.262 4.782 5.289 5.778 6.283 6.785
36.018 34.798 36.130 37.275 31.640 30.728 29.843 28.982
325.733 305.158 306.841 310.489 355.734 366.293 377.165 388.359
325.733 305.158 306.841 310.489 355.734 366.293 377.165 388.359

42 of 42 ©
7. Disclaimer This paper is part of a Study on the Economic Impact of eHealth (www.ehealth-impact.org) commissioned by the European Commission, Directorate General Information Society and Media, Brussels. This paper reflects solely the views of its authors. The European Commu-nity is not liable for any use that may be made of the information contained therein. We thank our colleagues at the European Commission, in our institutes and our partners in this study for their critical input and review.
8. Notes and references i Example Canada: “Concerning the determining of ambulance service zones and the maximum num-ber of ambulances per area and per zone, the standards for ambulance service subsidies, the stan-dards of transport by ambulance between establishments and rates of transport by ambulance”, Minis-terial Order, R.Q. c. L-0.2, r.2. Version available as of 2005-12-16 (Last update on CanLII: 2005-12-16). URL: http://www.canlii.org/qc/laws/regu/l-0.2r.2/20051216/whole.html ii http://www.romsys.ro