description of six sigma methodology. in this section, we will describe the six sigma methodology....
TRANSCRIPT

Description of Six Sigma Methodology
Description of Six Sigma Methodology
In this section, we will describe the Six Sigma methodology.
We’ll discuss:
– Historical context
– Role of variation
– What does the term “Six Sigma” refer to?
– The DMAIC process
– Key players, roles, and responsibilities

Introduction to Six Sigma
What is Six Sigma? Six Sigma is a business initiative started at Motorola by an engineer named Bill Smith in the 1980’s.
At the time, growth within Motorola was stagnant and the company was spending up to 20 percent of revenues correcting poor quality.
With up to $900 million each year going towards finding and correcting defects, executives at Motorola came to believe that higher quality products should actually cost less.
Six Sigma was initiated as an attempt to reduce the costs of poor quality that resulted from rejected material, rework, inspection processes, lost revenue, and other hidden costs associated with “not doing it right the first time”.

Introduction to Six SigmaSix Sigma is rooted in the work of W. Edwards Deming, whose
system of Profound Knowledge links four elements:
Systems Thinking: The focus is on the whole system, the interdependencies within it, and optimizing the system over time. All processes are a series of interconnected steps.
The Theory of Variation: Understanding and eliminating sources of variation (root causes) is the key improvement target.
The Theory of Knowledge: How people learn. Knowledge is seen in terms of useful models and theories.
Psychology: How to involve people in processes and in continuous improvement.
Six Sigma integrates these four elements.

Introduction to Six Sigma
A well structured continuous improvement process is vastly different from traditional problem solving methods.
ProcessImprovement
ProblemSolving

Introduction to Six SigmaTraditional problem solving methods, which often lead to fire
fighting, tend to:
Try to restore the status quo;
Address particular events - they are reactionary;
Encourage answers, not methods - no long-term learning, no long-term solutions.
Ignore large opportunities for improvement which have no obvious symptoms - squeaky wheel syndrome;
Deal with only part of the system;
Encourage a search for someone to blame, since something is “wrong”;

Introduction to Six SigmaIn contrast to traditional problem solving, the Six Sigma
Continuous Improvement Process provides an integrated and structured approach which focuses on:
Learning about customer expectations; Understanding sources of variability; Addressing root causes; Reduction of overall cost; Prioritization by either cost or customer effect; Elimination of problems by changing the process; The study of methods and whole systems; The use of data-based decision making rather than fire-
fighting or making decisions based on intuition.

Introduction to Six Sigma
The notion of a process is critical to Six Sigma:
A process can be defined as any activity or group of activities that takes an input or inputs, adds value, and provides an output to an internal or external customer:
Six Sigma can be used to address problems within manufacturing processes, or within any business process or system.
ProcessProduct
orService
PeopleM ateria ls
Environm entM ethodsM achines
Inputs Transformation Outputs

Introduction to Six Sigma
All process inputs vary to some extent.
Variation in outputs is the results of variation in the inputs (machine, materials, methods,…).
Sources of variation combine and interact within the process, and these interactions make it extremely difficult to understand cause-and-effect.
With traditional problem solving approaches, much effort is usually wasted on analyzing or “fixing” the outputs, without addressing the inputs.
Continuous improvement is an iterative process that focuses on minimizing variation to bring products and services ever closer to customers’ changing needs.

Introduction to Six SigmaSix Sigma’s paradigm for problem solving is the DMAIC cycle:
Define, Measure, Analyze, Improve, Control.
Six Sigma integrates basic problem solving tools as well as the sophisticated statistical methods that are needed in today’s business environment.
It places a heavy emphasis on:
Specific improvement projects, A team approach, Data-based decision making, and Tools that enable the understanding of process variation.

Understanding VariationAccording to Deming, most opportunities for improvement are
driven by the system. These are the result of predictable sources of variation, known as common causes.
Only a small proportion of the problems are the result of unpredictable influences on the system, which are driven by special causes of variation.
A stable process is one in which only common causes of variation are present. A stable process is said to be in control.
If a process is in control and on target, trying to improve the performance of the process by tweaking machines or work methods will only have detrimental effects on the process.
These efforts to improve a process are known as tampering.

Understanding Variation
Dr. W. Edwards Deming describes this experiment in “Rules of the Funnel” in his book, Out of the Crisis, pages 328-330.
Steps for conducting the Funnel Experiment:
1. Position a funnel over a target drawn on a piece of paper.
2. Drop a marble through the funnel 30 times.
3. Mark on the paper the final resting place of the marble after each drop.
4. Repeat these steps following the rules of the funnel.

Understanding Variation
Target

Understanding VariationRULE ONE: No adjustment. Leave the funnel fixed, and
aimed at the target. Do not adjust the funnel.
RULE TWO: Exact Compensation. After the marble lands a certain distance from the target, move the funnel an equal and opposite distance from its last position.
RULE THREE: Over Compensation. After the marble lands a certain distance from the target, move the funnel an equal and opposite distance from the target.
RULE FOUR: Consistency. After the marble lands a certain distance from the target, aim the funnel right over the spot where it came to rest.
In the simulations on the following slides, 200 points have been generated to demonstrate the four rules.

Understanding Variation
RULE ONE (No Adjustment): Leave the funnel fixed, aimed at the target (45), no adjustment.
The distribution has a mean of 45 and a standard deviation of 1.5.
1 21 41 61 81 101 121 141 161 18141
42
43
44
45
46
47
48
49
50

Understanding Variation
RULE TWO (Exact Compensation): After the marble lands a certain distance from the target, move the funnel an equal and opposite distance from its last position.
1 21 41 61 81 101 121 141 161 18138
40
42
44
46
48
50
52

Understanding VariationRULE THREE (Over Compensation): After the marble lands a
certain distance from the target, move the funnel an equal and opposite distance from the target.
1 21 41 61 81 101 121 141 161 18125
30
35
40
45
50
55
60
65

Understanding VariationRULE FOUR (Consistency): After the marble lands a certain
distance from the target, aim the funnel right over the spot where it came to rest.
1 21 41 61 81 101 121 141 161 18140
45
50
55
60
65
70
75

Rule 1: Rule 2:
Rule 3: Rule 4:

Understanding VariationTampering is the act of reacting to common cause variation as
if it were special cause variation.
The Rules of the Funnel demonstrate that even well intended applications of common sense can lead to tampering, which increases variation.
Making adjustments, without knowing cause-and-effect, will only make things worse.
The Six Sigma methodology attempts to bring processes into control and then to improve them by understanding the underlying cause system.
The focus is on removing common causes of variation.
To remove common causes, one must address the process!
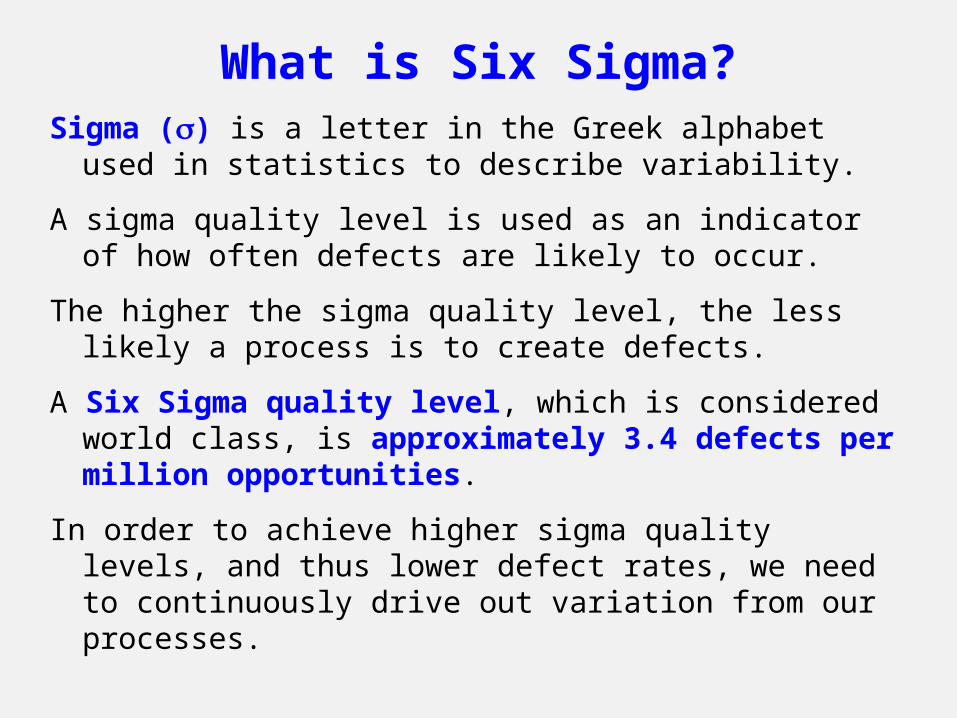
What is Six Sigma?Sigma () is a letter in the Greek alphabet used in statistics to
describe variability.
A sigma quality level is used as an indicator of how often defects are likely to occur.
The higher the sigma quality level, the less likely a process is to create defects.
A Six Sigma quality level, which is considered world class, is approximately 3.4 defects per million opportunities.
In order to achieve higher sigma quality levels, and thus lower defect rates, we need to continuously drive out variation from our processes.

What is Six Sigma?
Motorola came up with the recommendation that a process should be centered within its specification range, and that the process should be so consistent that the upper and lower specification limits were each 6 from the process target.
USLLSL
12
A quality level of 6 equates to 0.002 defective parts per million.

What is Six Sigma?Motorola further assumed that the process centering might vary in the long term by as much as 1.5.
If this shift occurs in a given direction, then defective product occurs at a rate of 3.4 parts per million.
This corresponds to a quality level of 4.5, or 3.4 parts per million, which is considered the Six Sigma definition of world class performance.
USLLSL
1.56 4.5

What is Six Sigma?Thus, the “six sigma” associated with a Six Sigma quality level
refers to a process that is so consistent that two normal distributions fit within the specification range.
In effect, the process standard deviation is so small that 12 standard deviations fit within the specification limits.
Even if such a process drifts by as much as 1.5 units in one direction, we are assured that the defective rate will not exceed 3.4 per million.
The whole point is to drive the occurrence of defects and defectives down to where they are extremely rare.
This requires extremely capable processes – the proportion of unacceptable occurrences must be extremely small.

The idea of Sigma quality levels can be generalized.
For a process that is on target and has a normal distribution, assuming that the process mean occasionally strays by 1.5in one direction, the worse case defect rate is:
What is Six Sigma?
3.499.99966 623399.9767 5
621099.379 46681193.32 3
30877069.13 269767230.23 1
ppm Defects
Percent In Spec.
Z = Distance to Spec. Limits

What is Six Sigma?
The goal of a Six Sigma quality level should not be taken literally.
The quality level required typically depends upon the business and the application.
For example, an airline crash rate of 3.4 per million flight hours would be unacceptable.
Likewise, if you make inexpensive plastic Easter eggs a quality level of 3.4 parts per million seems a bit like overkill.
Achieving higher quality levels must also reflect the cost of attaining them.
Are the benefits of reaching higher quality levels enough to justify the costs?

The DMAIC Process
Measure
Define
AnalyzeImprove
Control

The DMAIC Process
The DMAIC process directs energies towards identifying sources of variability, finding solutions, and verifying that process changes or improvements bring about the expected benefits to the process output or outputs.
Prior to the DMAIC process, there is recognition that an opportunity exists. The goals and objectives of the project are defined and a team is formed.
Define:
The project charter and project goal are reviewed and clarified,
The process is defined, and Key process inputs and outputs are identified.

The DMAIC ProcessMeasure:
Key process characteristics are measured,
Measurement systems are evaluated,
A baseline is established (this is a plot of the project KPI – key process indicator), and
Process capability is determined.
Analyze:
Data is analyzed using a variety of descriptive and analytic tools,
Root causes of problems are identified and studied, and
Opportunities for improvement are identified.

The DMAIC Process
Improve:
Potential solutions are identified and evaluated,
Selected solutions are tested,
An implementation plan is developed, and
Solutions are implemented.
Control:
The process is monitored to ensure that the expected improvements are obtained,
New methods and processes are standardized, and
Elements of the DMAIC process may be repeated to continue to improve the process.

The DMAIC ProcessThe DMAIC process focuses on continuous improvement of
existing processes.
The DMAIC process, per se, does not address design and redesign.
Six Sigma methodologies have been developed to address design or redesign. These are referred to as: IDOV (Identify, Define, Optimize, Validate), DMADV (Define, Measure, Analyze, Design, Validate) or DFSS (Design for Six Sigma)
Although Six Sigma was originally developed to drive improvement within manufacturing processes, the DMAIC process can also be effectively used within non-manufacturing processes (Transactional Six Sigma).
Key Players, Roles and ResponsibilitiesSix Sigma can be thought of as both a business strategy and a
method for attacking specific improvement opportunities.
The backbone of the Six Sigma Improvement Process is the focus on improvement projects, which are typically selected based on key business issues - issues with bottom line results.
A number of key players support the improvement process. In Six Sigma companies, these individuals are referred to as:
Champions Master Blackbelts Blackbelts Greenbelts Yellowbelts

Key Players, Roles and ResponsibilitiesChampions, or sponsors, are senior managers who oversee Six
Sigma initiatives and are ultimately responsible for the success of Six Sigma project teams.
Six Sigma Champions typically attend two days of training, and support the deployment of Six Sigma throughout the organization.
They identify and define Six Sigma projects, and ensure that projects will help achieve key business objectives.
They sponsor Six Sigma project teams, and help clear roadblocks and barriers that the team encounters.
Champions also work to ensure management support for the projects and the overall improvement process.

Key Players, Roles and Responsibilities
Master Blackbelts have completed Blackbelt training and at least five projects, and are involved full-time in Six Sigma efforts.
They conduct and coordinate training for Greenbelts and Blackbelts.
They lead project teams, and mentor and support other Six Sigma projects.
They help identify, select, and define Six Sigma projects.
Master Blackbelts are true change agents. They help coordinate the effort as a whole, and help drive the transformation throughout the organization.
In a Six Sigma company, there is approximately one Master Blackbelt for every ten Blackbelts.

Key Players, Roles and ResponsibilitiesBlackbelts have typically completed 120-160 hours of Six Sigma
training, have successfully completed at least two projects, and are involved full-time in Six Sigma activities.
Training is generally conducted in 4 or 5 blocks, spaced out over 4 or 5 months.
Blackbelts work on individual projects during training. Between training sessions, Blackbelts form and train teams to help carry out the work of the project.
Once certified, Blackbelts will lead 3-5 projects per year, and will mentor 5-10 Greenbelt projects per year.
Blackbelts may also become involved in supporting or conducting training for Greenbelt teams.

Key Players, Roles and ResponsibilitiesBlackbelts (continued):
In a Six Sigma company, approximately 1% of the workforce become Blackbelts.
Blackbelts are selected based on a number of criteria. For example:
Team leadership and mentoring skills
Project management and problem-solving experience
The ability to get things done
Communication and ‘soft’ skills
Technical and analytic skills
Change agents

Key Players, Roles and ResponsibilitiesGreenbelts complete approximately 80 hours of training, have
successfully completed a Six Sigma project, and are involved in Six Sigma on a part-time basis (approximately 25% of available time).
Training is typically conducted in three blocks, spaced over approximately 4 or 5 months.
Greenbelt teams work on specific projects during the training, which includes basic team and problem solving skills, and training in the core statistical tools and techniques.
In a Six Sigma organization, anywhere from 5% to 50% of the workforce become Greenbelts.
Upon completing training and the initial project, Greenbelts become members of other Six Sigma project teams.

Six Sigma projects are identified to support Key Business Initiatives (Big Ys and Little ys).
The objectives of the project are defined and a team is formed.
Each project is defined by a Project Charter, jointly developed by the Blackbelt and Sponsor, and refined by the project team.
The Charter defines the project, its structure, and the team’s goals and timeline.
During the Define phase of a Six Sigma project, the project’s Key Process Indicator (KPI) is defined.
This is the key measure that is tracked by the team. This is the measure used to assess the team’s success, and for which a baseline is constructed and maintained.
Key Players, Roles and Responsibilities

Six Sigma Tools and Techniques

Six Sigma teams utilize a variety of tools and techniques that are helpful in assessing process variability, and in identifying potential sources of variation.
Process Mapping and Value Stream Mapping are techniques typically used in the Define Phase of the DMAIC process to understand the current state process.
Six Sigma Tools and Techniques
InitiationStep 0
TerminationStep 4Step 1 Step 2 Step 3
Value Added Time
Value Added Time
Value Added Time
Value Added Time
Wait Time
Wait Time
Wait Time
Wait Time

Six Sigma Tools and TechniquesBasic problem solving tools are useful in identifying potential
sources of variation.
Cause-and-Effect Diagrams (5 Why’s!):
Problemor Effect
MethodMaterial
Machine Manpower
Cause
Cause
Cause
Cause
Cause Cause
Cause
Cause
Cause
Cause
Environment
Cause
Cause

Six Sigma Tools and TechniquesCause-and-Effect Matrices:
Poor Taste
Poor Texture
Wrong Shape
Too HardNot Moist Enough
Not Enough Chips
Weight 4 2 0.5 1.5 1 1 10
Butter 3 3 2 3 2 0 25.5
Chips 3 1 1 0 0 3 17.5
Eggs 1 2 1 3 2 0 15
Flour 1 3 1 2 2 0 15.5
Baking Soda 2 1 0 3 0 0 14.5
Sugar 2 1 0 0 0 0 10
Mixing 2 2 0 2 0 2 17
Extrusion 0 0 3 0 0 0 1.5
Baking 3 3 2 3 3 0 26.5
Cooling 0 1 2 2 2 0 8
Effects - Outputs Total by Input
(Weighted)
Causes - Inputs
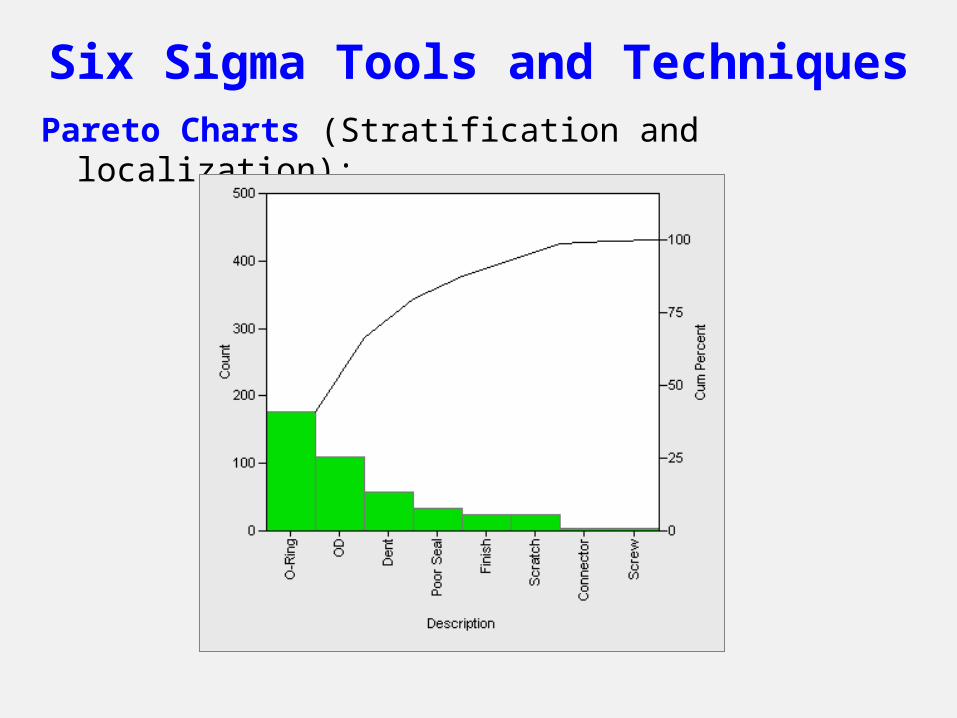
Six Sigma Tools and TechniquesPareto Charts (Stratification and localization):
Six Sigma Tools and Techniques
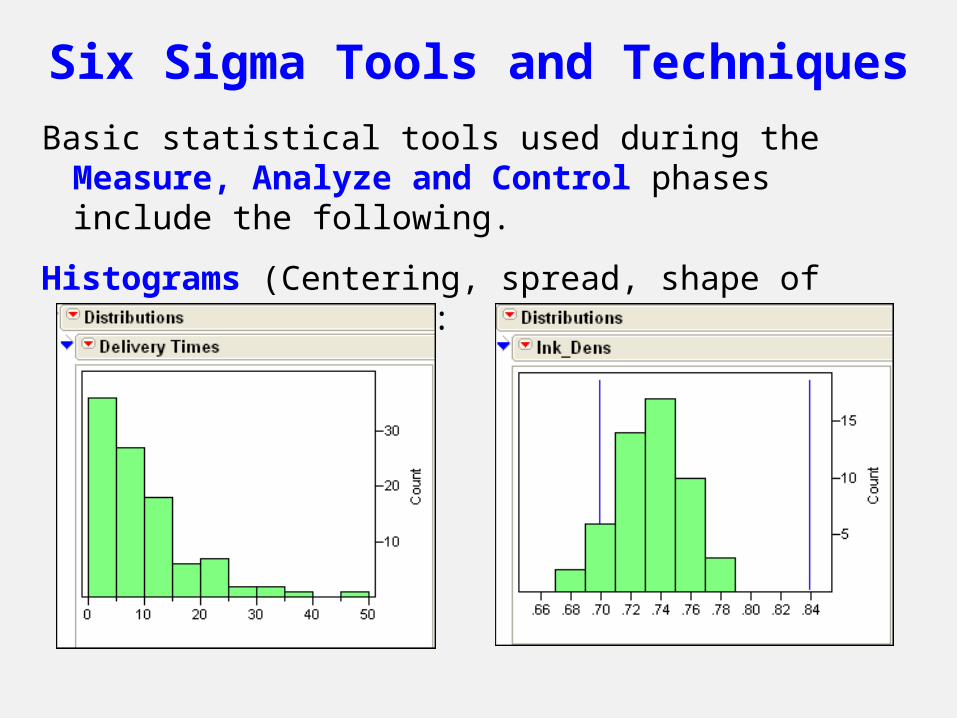
Basic statistical tools used during the Measure, Analyze and Control phases include the following.
Histograms (Centering, spread, shape of data distribution):

Six Sigma Tools and Techniques
Run Charts (View behavior over time):

Six Sigma Tools and Techniques
Control Charts: (Baseline, to verify improvement, control,
maintain gains):

Six Sigma Tools and Techniques
Statistical Process Control Charts, are used during the Measure and Control phases of the DMAIC process to track the behavior of the measure of interest (KPI).
In the Measure phase, the project KPI is monitored using a control chart. This establishes the baseline for the project.
Control charts of the KPI and other supporting measures are also used to understand whether the process is stable, to determine process capability, and to identify special causes.
During the Control phase, after a solution is implemented, the KPI continues to be plotted on a control chart for a period of time to ensure that the change has had the desired effect and that the improvement is maintained.

The control charts below confirm that substantial improvements have been made by a Six Sigma project team.
The team has reduced the proportion of errors, and has also made the process less variable.
Six Sigma Tools and Techniques

Six Sigma Tools and Techniques
Shows process level and daily variation prior to solution
Solution
Another example:

Six Sigma Tools and Techniques
Scatter Diagrams: (Relationship between two variables):

Six Sigma Tools and Techniques
Box Plots (Stratifying a continuous measurement by a categorical variable).

Six Sigma Tools and Techniques
Measurement System Analysis (MSA) and Gage R&R:
P/T Ratio is 46%

Six Sigma Tools and Techniques
Regression Analysis (To model and understand relationships between variables):

Six Sigma Tools and Techniques
Descriptive Statistics - To estimate process parameters.
Hypothesis Tests and Confidence Intervals - used for decision making in the presence of variability.
Reliability Testing - To understand the frequency of failure for a process, or the rate of failure for a part.
FMEA (Failure Mode and Effects Analysis) - To identify potential product or process failures.
Process Control Plans - Used during the Control Phase to monitor the process to ensure that improvements are sustained over time.