descartes – uniting business in commerce
TRANSCRIPT

P r o p r i e t a r y a n d C o p y r i g h t o f T h e D e s c a r t e s S y s t e m s G r o u p I n c . A l l r i g h t s r e s e r v e d .
Descartes – Uniting Business in Commerce
S e p t e m b e r 2 0 2 1

Safe Harbor StatementCertain statements to be made today and in this presentation, and that may be made in response to questions, constitute forward-looking information for the purposes of applicable securities laws (“forward-lookingstatements”), including, but not limited to: statements using the words “believe,” “plan,” “expect,” “anticipate,” “intend,” “continue,” “may,” “will,” “should” or the negative of such terms and similar expressions; orstatements in relation to any of the following topics: our assessment of the current and future potential impact of the COVID-19 pandemic on our business, results of operations and financial condition; addressing economicuncertainty; investment in areas of our business with high strategic value and growth potential; our future operating performance; software-as-a-service business model; strategy, market opportunity and vision; ourposition and opportunity to lead our industry with our business model; solution functionality and benefits derived therefrom; network penetration; ability to complete acquisitions and contribution of completedacquisitions to our operations; anticipated churn in revenues; competition; and forecasted environmental benefits of our products and solutions.
The material assumptions made in making these forward-looking statements include, but are not limited to, the following: global shipment volumes continuing to increase at levels consistent with those experiencedhistorically; the current COVID-19 pandemic not having a material impact on shipment volumes or on the demand for the products and services of Descartes by its customers and the ability of those customers to continueto pay for those products and services; countries continuing to implement and enforce existing and additional customs and security regulations relating to the provision of electronic information for imports and exports;countries continuing to implement and enforce existing and additional trade restrictions and sanctioned party lists with respect to doing business with certain countries, organizations, entities and individuals; our continuedoperation of a secure and reliable business network; the stability of general economic and market conditions, currency exchange rates, and interest rates; equity and debt markets continuing to provide us with access tocapital; our continued ability to identify and source attractive and executable business combination opportunities; our ability to develop solutions that keep pace with the continuing changes in technology, and ourcontinued compliance with third party intellectual property rights. While management believes these assumptions to be reasonable under the circumstances, they may prove to be inaccurate. In addition, the forecastedenvironmental benefits of our products and services are based on projections, reductions and savings derived from various third party modeling tools identified on our website at www.descartes.com and which rely onvarious assumptions in their calculations.
These forward-looking statements are also subject to risks, uncertainties and assumptions that may cause future results to differ materially from those expected. Factors that may cause such differences include, but are notlimited to: our ability to identify and successfully integrate acquired businesses; the impact of network failures, information security breaches or other cyber-security threats, disruptions in the movement of freight and adecline in shipment volumes including as a result of contagious illness outbreaks such as the current COVID-19 pandemic, a deterioration of general economic conditions or instability in the financial markets accompaniedby a decrease in spending by our customers; departures of key customers; the ability to attract and retain key personnel and transition when key personnel depart; variances in our revenues from quarter to quarter;fluctuations in international currency exchange rates; exposure to greater than anticipated tax liabilities; changes in electronic customs filing regulations and other factors discussed under the headings “Risk Factors” or“Certain Factors That May Affect Future Results” in documents filed with applicable securities regulatory authorities under our profile on SEDAR at www.sedar.com and on EDGAR at www.sec.gov, including the documentsincorporated by reference into such documents. If any of such risks actually occur, they could materially adversely affect our business, financial condition or results of operations. In that case, the trading price of ourcommon shares could decline, perhaps materially.
We provide forward-looking statements solely for the purpose of providing information about management's current expectations and plans relating to the future. You are cautioned that such information may not beappropriate for other purposes. In particular, we have not adjusted or revised any forward-looking statements in this presentation to account for the potential disruption to our business from the recent coronavirusoutbreak, the impact from which is not immediately known or quantifiable. Except as required by law, we do not undertake or accept any obligation or undertaking to release publicly any updates or revisions to anyforward-looking statements to reflect any change in our expectations or any change in events, conditions, assumptions or circumstances on which any such statement is based.
2

Investment Highlights
Automating and Optimizing the Increasingly Complex Logistics Market
Disciplined M&A Strategy
Highly-Experienced Management Team
Proven Record of Financial Success
Strong Market Position with Significant Competitive Barriers
World’s Largest Multi-Modal and Neutral Logistics Network
Cloud-Based Software Applications and Data Content
3
Industry-Leading Solutions Help Customers Reduce Environmental Footprint

Descartes at a Glance
Leader in providing SaaS solutions for logistics-intensive businesses
Proven ‘Total Growth’ model supported by disciplined acquisition strategy
High-recurring revenue profile
Delivering profitable growth and free cash flow generation
(1) See Reconciliation of Non-GAAP Financial Measures on slides 21 and 22 for our approach to reconciliation of adjusted EBITDA.
4
40 million +Routes
Managed / Year
160 +Countries
Served
18.6 billion +Messages
Processed / Year
20,000 +CustomersWorldwide
275
326 349
FY19 FY20 FY21
Revenues (US$ millions)
31.3 37.0 52.1
93.9
122.6
142.0
FY19 FY20 FY21
Net Income & Adj. EBITDA (US$ millions)(1)
Net Income Adj. EBITDA

G L O B A L L O G I S T I C S N E T W O R K
Forwarders& 3PLs
CustomsBrokers
FreightBrokers
Customs Regulators Associations
Ocean Air Ground RailRetailers Service
ProvidersManufacturers & Distributors
C A R R I E R S S H I P P E R S
G O V E R N M E N T S I N T E R M E D I A R I E SD E S C A R T E SG L N ™
5

SO L UTIO N S
Routing, Mobile & Telematics
TransportationManagement
Ecommerce, Shipping& Fulfillment
Customs & Regulatory Compliance
D E S C A R T E S G L N ™
Global Trade Intelligence Broker & Forwarder
Enterprise Systems
6

M ANU FAC TU RE RS
AIR
TRU CK
RE TAILE RS
DISTR IBUTO RS
INTE RM E DIARIES
O CEAN
Industry-Leading Customers

Leverages Descartes’ Advanced Home Delivery solution for:
Real-time delivery appointment scheduling
Route optimization and execution
Mobile resource management solutions
Leverages many Descartes solutions across multiple DHL operating groups:
Global Forwarding
DHL Express (Parcels)
Logistics and supply chain management
Descartes’ solutions help Delta Airlines meet a growing number of logistic challenges across the globe:
Numerous country-specific customs and security filings
Provide cargo tracking and ULD global visibility solutions
Operate air messaging network for Delta and its logistics partners
Customer Case Studies
8

Why We Win
9
Pure play logistics technology provider with compelling combination of network, applications and data content
Multi-modal
Global
NeutralNetwork

Content and Data
G lob a l Trade Complex i ty
Rea l - t ime V i s ib i l i t y
Fra gme nted In dust r y
e Comme rc e and L og i st i c s
C loud E nab les Automat ion
Market Drivers and Opportunities
Global Logistics Network offers operational excellence, increased digitization of freight and higher precision through cloud integration and automation
Heightened regulatory compliance requirements and shifting global trade patterns create favorable tailwinds
Descartes solutions help retailers and logistics service providers respond to the threat of Amazon, Google, eBay with real-time delivery route optimization and execution solutions
Real-time tracking and optimization made possible by ubiquitous mobile networks, internet-of-things and cloud-scale computing
Customs Info, MK Data, Datamyne and Visual Compliance acquisitions illustrative of the opportunity to leverage logistics and trade data content on the Global Logistics Network
Logistics and supply chain software markets remain highly fragmented, presenting a large consolidation opportunity
10
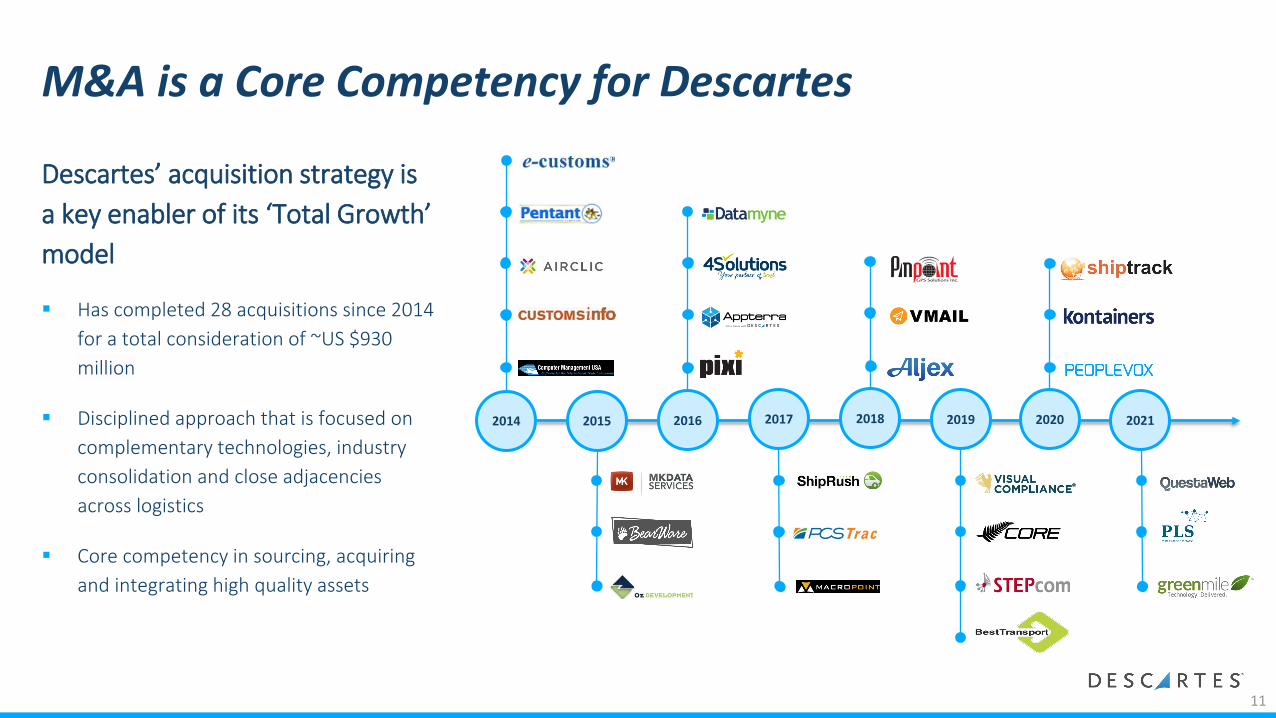
M&A is a Core Competency for Descartes
Descartes’ acquisition strategy is a key enabler of its ‘Total Growth’ model
Has completed 28 acquisitions since 2014 for a total consideration of ~US $930 million
Disciplined approach that is focused on complementary technologies, industry consolidation and close adjacencies across logistics
Core competency in sourcing, acquiring and integrating high quality assets
2016 201820152014 2019 2020
11
2017 2021
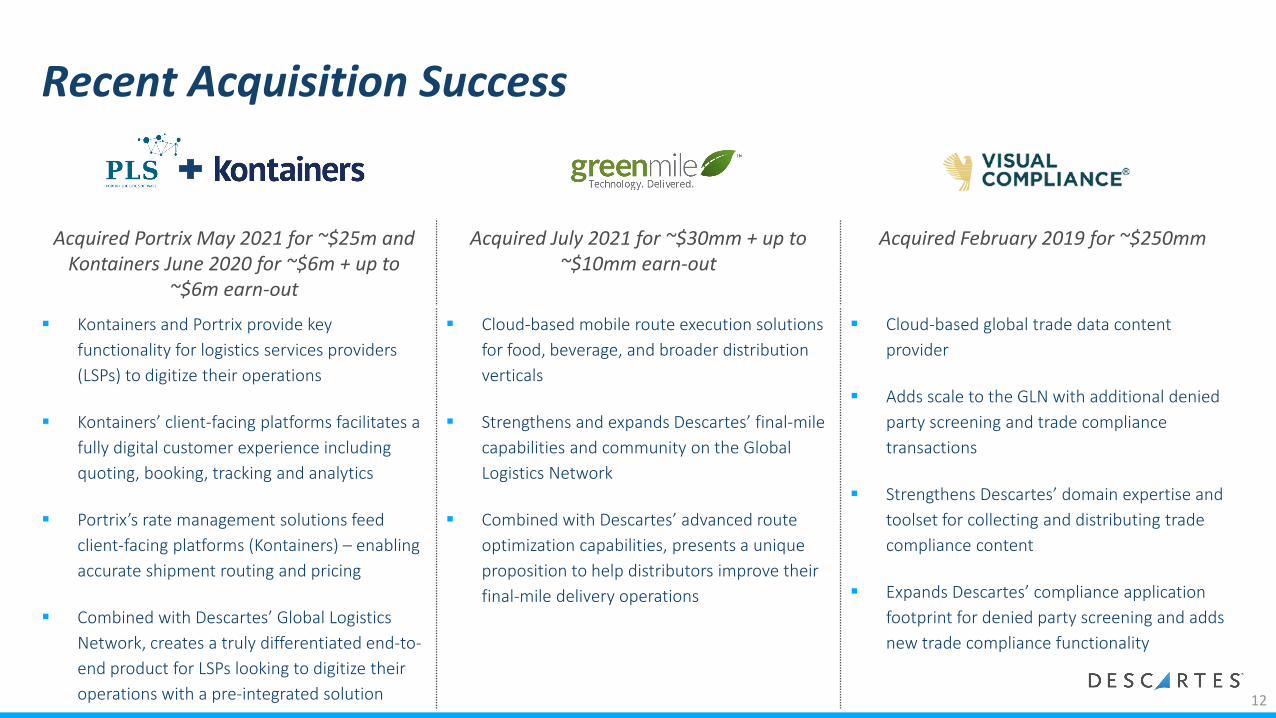
Recent Acquisition Success
Acquired Portrix May 2021 for ~$25m and Kontainers June 2020 for ~$6m + up to
~$6m earn-out
Acquired July 2021 for ~$30mm + up to ~$10mm earn-out
Acquired February 2019 for ~$250mm
Kontainers and Portrix provide key functionality for logistics services providers (LSPs) to digitize their operations
Kontainers’ client-facing platforms facilitates a fully digital customer experience including quoting, booking, tracking and analytics
Portrix’s rate management solutions feed client-facing platforms (Kontainers) – enabling accurate shipment routing and pricing
Combined with Descartes’ Global Logistics Network, creates a truly differentiated end-to-end product for LSPs looking to digitize their operations with a pre-integrated solution
Cloud-based mobile route execution solutions for food, beverage, and broader distribution verticals
Strengthens and expands Descartes’ final-mile capabilities and community on the Global Logistics Network
Combined with Descartes’ advanced route optimization capabilities, presents a unique proposition to help distributors improve their final-mile delivery operations
Cloud-based global trade data content provider
Adds scale to the GLN with additional denied party screening and trade compliance transactions
Strengthens Descartes’ domain expertise and toolset for collecting and distributing trade compliance content
Expands Descartes’ compliance application footprint for denied party screening and adds new trade compliance functionality
12
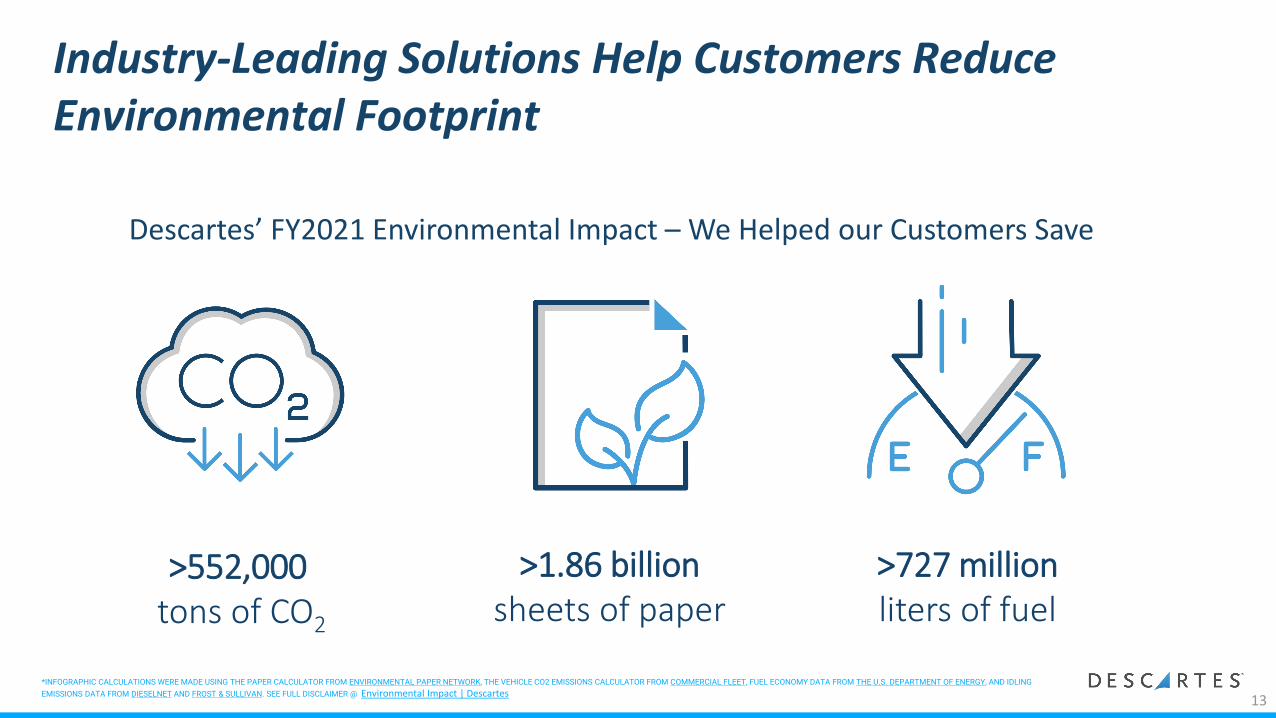
Industry-Leading Solutions Help Customers Reduce Environmental Footprint
>552,000tons of CO2
>1.86 billionsheets of paper
>727 millionliters of fuel
*INFOGRAPHIC CALCULATIONS WERE MADE USING THE PAPER CALCULATOR FROM ENVIRONMENTAL PAPER NETWORK, THE VEHICLE CO2 EMISSIONS CALCULATOR FROM COMMERCIAL FLEET, FUEL ECONOMY DATA FROM THE U.S. DEPARTMENT OF ENERGY, AND IDLING EMISSIONS DATA FROM DIESELNET AND FROST & SULLIVAN. SEE FULL DISCLAIMER @ Environmental Impact | Descartes
Descartes’ FY2021 Environmental Impact – We Helped our Customers Save
13

Financial Overview
14
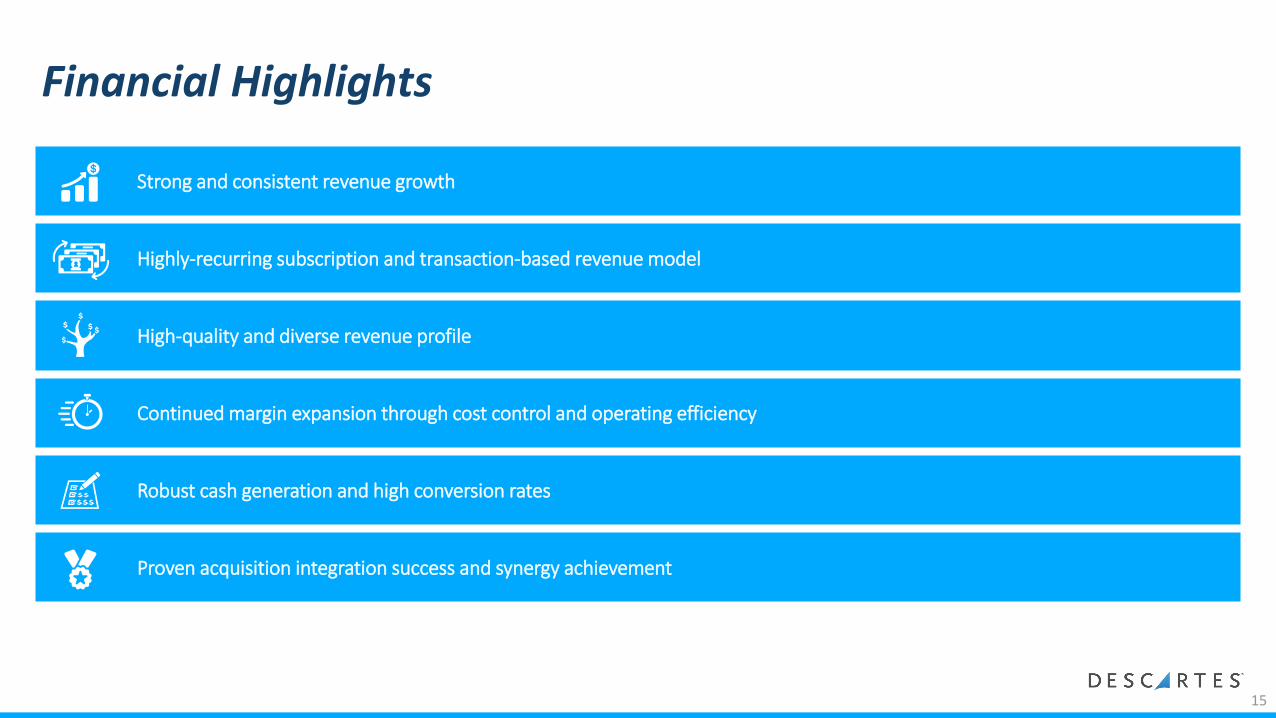
Financial Highlights
Strong and consistent revenue growth
Highly-recurring subscription and transaction-based revenue model
High-quality and diverse revenue profile
Continued margin expansion through cost control and operating efficiency
Robust cash generation and high conversion rates
Proven acquisition integration success and synergy achievement
15

$94
$123 $142
$34 $46
34.1%37.6% 40.7%
40.5% 43.9%
FY19 FY20 FY21 Q2-21 Q2-22
Adjusted EBITDA(1) and Adjusted EBITDA as a % of Revenues(1)
Adj. EBITDA Adj. EBITDA Margin %
$31 $37
$52
$11
$23
11.4% 11.4% 14.9%
12.5%22.2%
FY19 FY20 FY21 Q2-21 Q2-22
Net Income and Net Income as a % of Revenues
Net Income Net Income Margin %
$78
$104
$131
$34 $46
FY19 FY20 FY21 Q2-21 Q2-22
Cash Flow from Operations
$275
$326 $349
$84 $105
FY19 FY20 FY21 Q2-21 Q2-22
Revenue
Strong and Consistent Growth
16(1) See Reconciliation of Non-GAAP Financial Measures on slides 21 and 22 for a reconciliation of adjusted EBITDA and adjusted EBITDA as a percentage of revenues to net income.

11% 11%10%
11%10%
FY19 FY20 FY21 Q1-22 Q2-22
General and Administrative
17%16% 16%
15% 15%
FY19 FY20 FY21 Q1-22 Q2-22
Research and Development
13%12%
11% 11% 11%
FY19 FY20 FY21 Q1-22 Q2-22
Sales and Marketing
73% 74% 74% 76% 76%
FY19 FY20 FY21 Q1-22 Q2-22
Gross Margin
Efficient and Disciplined Operating Model
17

• Common shares• 84.6 million – Basic • 86.1 million – Fully diluted
• Mixed-Shelf filed on July 16, 2020 (up to $1 billion – currently unused)
• Cash and cash equivalents• $US 128.4 million
• Acquisition line of credit• $US 350.0 million with the potential to upsize to $US 500.0 million
• Undrawn as of July 31, 2021
Capital Structure – July 31, 2021
18

Baseline Calibration
Baseline revenues = visible, contracted and recurring revenues at the beginning of each quarter1. Baseline revenues is not a revenues projection as it excludes sales concluded in the period
Baseline Adjusted EBITDA2 = Baseline revenue less operating expenses (excluding investment income, interest expense, income tax expense, depreciation, amortization, stock-based compensation, restructuring expenses, acquisition related expenses and executive departure expenses)
[1] For a detailed description of baseline calibration, please see Management’s Discussion & Analysis (MD&A) dated September 8, 2021. Baseline calibration is typically calculated on the first day of the quarter unless adjusted to reflect the impact of any acquisitions completed after the first day of the quarter, but before the date of our corresponding MD&A in which that baseline calibration is disclosed.
[2] See Reconciliation of Non-GAAP Financial Measures on slides 21 and 22 for our approach to reconciliation of adjusted EBITDA.
Figures per Quarter Baseline Actual Actual % of Baseline
Q3’21 RevenueNet IncomeNet Income as a % of RevenuesAdj. EBITDAAdj. EBITDA % of Revenues
$80.5
$27.534.2%
$87.5$13.315.2%$36.441.6%
109%
132%
Q4’21 RevenueNet IncomeNet Income as a % of RevenuesAdj. EBITDAAdj. EBITDA % of Revenues
$83.0
$29.535.5%
$93.4$17.218.4%$38.641.3%
113%
131%
Q1’22 RevenueNet IncomeNet Income as a % of RevenuesAdj. EBITDAAdj. EBITDA % of Revenues
$86.8
$30.835.5%
$98.8
$41.542.0%
114%
135%
Q2’22 RevenueNet IncomeNet Income as a % of RevenuesAdj. EBITDAAdj. EBITDA % of Revenues
$92.0
$33.035.9%
$104.6
$45.943.9%
114%
139%
Q3’22 RevenueNet IncomeNet Income as a % of RevenuesAdj. EBITDAAdj. EBITDA % of Revenues
$95.0
$35.537.4%
19

Investment Highlights
Automating and Optimizing the Increasingly Complex Logistics Market
Disciplined M&A Strategy
Highly-Experienced Management Team
Proven Record of Financial Success
Strong Market Position with Significant Competitive Barriers
World’s Largest Multi-Modal and Neutral Logistics Network
Cloud-Based Software Applications and Data Content
20
Industry-Leading Solutions Help Customers Reduce Environmental Footprint
Reconciliation of Non-GAAP Financial Measures - Adjusted EBITDA and Adjusted EBITDA as a percentage of revenues – Q2-22
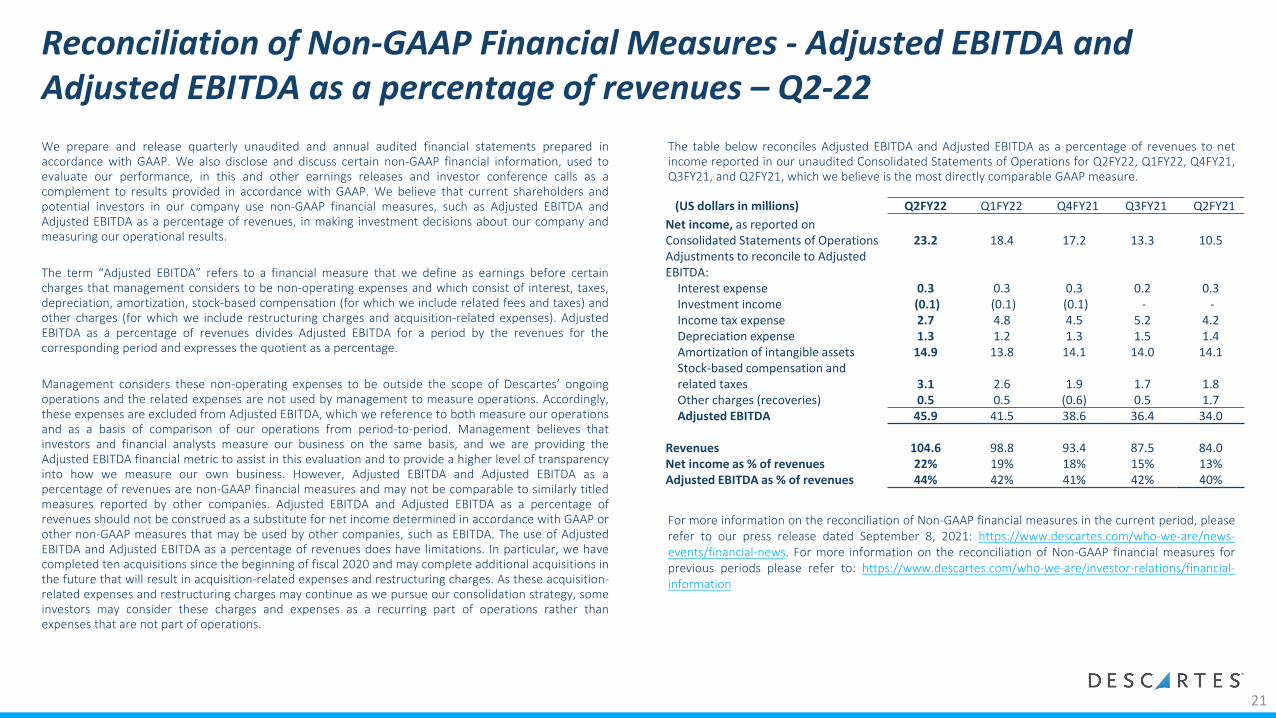
The table below reconciles Adjusted EBITDA and Adjusted EBITDA as a percentage of revenues to netincome reported in our unaudited Consolidated Statements of Operations for Q2FY22, Q1FY22, Q4FY21,Q3FY21, and Q2FY21, which we believe is the most directly comparable GAAP measure.
We prepare and release quarterly unaudited and annual audited financial statements prepared inaccordance with GAAP. We also disclose and discuss certain non-GAAP financial information, used toevaluate our performance, in this and other earnings releases and investor conference calls as acomplement to results provided in accordance with GAAP. We believe that current shareholders andpotential investors in our company use non-GAAP financial measures, such as Adjusted EBITDA andAdjusted EBITDA as a percentage of revenues, in making investment decisions about our company andmeasuring our operational results.
The term “Adjusted EBITDA” refers to a financial measure that we define as earnings before certaincharges that management considers to be non-operating expenses and which consist of interest, taxes,depreciation, amortization, stock-based compensation (for which we include related fees and taxes) andother charges (for which we include restructuring charges and acquisition-related expenses). AdjustedEBITDA as a percentage of revenues divides Adjusted EBITDA for a period by the revenues for thecorresponding period and expresses the quotient as a percentage.
Management considers these non-operating expenses to be outside the scope of Descartes’ ongoingoperations and the related expenses are not used by management to measure operations. Accordingly,these expenses are excluded from Adjusted EBITDA, which we reference to both measure our operationsand as a basis of comparison of our operations from period-to-period. Management believes thatinvestors and financial analysts measure our business on the same basis, and we are providing theAdjusted EBITDA financial metric to assist in this evaluation and to provide a higher level of transparencyinto how we measure our own business. However, Adjusted EBITDA and Adjusted EBITDA as apercentage of revenues are non-GAAP financial measures and may not be comparable to similarly titledmeasures reported by other companies. Adjusted EBITDA and Adjusted EBITDA as a percentage ofrevenues should not be construed as a substitute for net income determined in accordance with GAAP orother non-GAAP measures that may be used by other companies, such as EBITDA. The use of AdjustedEBITDA and Adjusted EBITDA as a percentage of revenues does have limitations. In particular, we havecompleted ten acquisitions since the beginning of fiscal 2020 and may complete additional acquisitions inthe future that will result in acquisition-related expenses and restructuring charges. As these acquisition-related expenses and restructuring charges may continue as we pursue our consolidation strategy, someinvestors may consider these charges and expenses as a recurring part of operations rather thanexpenses that are not part of operations.
For more information on the reconciliation of Non-GAAP financial measures in the current period, pleaserefer to our press release dated September 8, 2021: https://www.descartes.com/who-we-are/news-events/financial-news. For more information on the reconciliation of Non-GAAP financial measures forprevious periods please refer to: https://www.descartes.com/who-we-are/investor-relations/financial-information
21
(US dollars in millions) Q2FY22 Q1FY22 Q4FY21 Q3FY21 Q2FY21Net income, as reported on Consolidated Statements of Operations 23.2 18.4 17.2 13.3 10.5Adjustments to reconcile to Adjusted EBITDA:
Interest expense 0.3 0.3 0.3 0.2 0.3Investment income (0.1) (0.1) (0.1) - -Income tax expense 2.7 4.8 4.5 5.2 4.2Depreciation expense 1.3 1.2 1.3 1.5 1.4Amortization of intangible assets 14.9 13.8 14.1 14.0 14.1Stock-based compensation and related taxes 3.1 2.6 1.9 1.7 1.8Other charges (recoveries) 0.5 0.5 (0.6) 0.5 1.7Adjusted EBITDA 45.9 41.5 38.6 36.4 34.0
Revenues 104.6 98.8 93.4 87.5 84.0Net income as % of revenues 22% 19% 18% 15% 13%Adjusted EBITDA as % of revenues 44% 42% 41% 42% 40%

Reconciliation of Non-GAAP Financial Measures - Adjusted EBITDA and Adjusted EBITDA as a percentage of revenues – FY21
The table below reconciles Adjusted EBITDA and Adjusted EBITDA as a percentage of revenues to netincome reported in our audited Consolidated Statements of Operations for FY21 and FY20, which webelieve is the most directly comparable GAAP measure.
For more information on the reconciliation of Non-GAAP financial measures for FY21, please refer to ourpress release dated March 3, 2021: https://www.descartes.com/who-we-are/news-events/financial-news. For more information on the reconciliation of Non-GAAP financial measures for previous periodsplease refer to: https://www.descartes.com/who-we-are/investor-relations/financial-information
(US dollars in millions) FY21 FY20
Net income, as reported on Consolidated Statements of Operations 52.1 37.0
Adjustments to reconcile to Adjusted EBITDA:
Interest expense 1.2 4.4
Investment income (0.2) (0.2)
Income tax expense 18.3 11.1
Depreciation expense 5.8 6.0
Amortization of intangible assets 55.9 55.5
Stock-based compensation and related taxes 6.6 5.0
Other charges 2.3 3.8
Adjusted EBITDA 142.0 122.6
Revenues 348.7 325.8
Net income as % of revenues 15% 11%
Adjusted EBITDA as % of revenues 41% 38%
22
We prepare and release quarterly unaudited and annual audited financial statements prepared inaccordance with GAAP. We also disclose and discuss certain non-GAAP financial information, used toevaluate our performance, in this and other earnings releases and investor conference calls as acomplement to results provided in accordance with GAAP. We believe that current shareholders andpotential investors in our company use non-GAAP financial measures, such as Adjusted EBITDA andAdjusted EBITDA as a percentage of revenues, in making investment decisions about our company andmeasuring our operational results.
The term “Adjusted EBITDA” refers to a financial measure that we define as earnings before certaincharges that management considers to be non-operating expenses and which consist of interest, taxes,depreciation, amortization, stock-based compensation (for which we include related fees and taxes) andother charges (for which we include restructuring charges and acquisition-related expenses). AdjustedEBITDA as a percentage of revenues divides Adjusted EBITDA for a period by the revenues for thecorresponding period and expresses the quotient as a percentage.
Management considers these non-operating expenses to be outside the scope of Descartes’ ongoingoperations and the related expenses are not used by management to measure operations. Accordingly,these expenses are excluded from Adjusted EBITDA, which we reference to both measure our operationsand as a basis of comparison of our operations from period-to-period. Management believes thatinvestors and financial analysts measure our business on the same basis, and we are providing theAdjusted EBITDA financial metric to assist in this evaluation and to provide a higher level of transparencyinto how we measure our own business. However, Adjusted EBITDA and Adjusted EBITDA as apercentage of revenues are non-GAAP financial measures and may not be comparable to similarly titledmeasures reported by other companies. Adjusted EBITDA and Adjusted EBITDA as a percentage ofrevenues should not be construed as a substitute for net income determined in accordance with GAAP orother non-GAAP measures that may be used by other companies, such as EBITDA. The use of AdjustedEBITDA and Adjusted EBITDA as a percentage of revenues does have limitations. In particular, we havecompleted ten acquisitions since the beginning of fiscal 2020 and may complete additional acquisitions inthe future that will result in acquisition-related expenses and restructuring charges. As these acquisition-related expenses and restructuring charges may continue as we pursue our consolidation strategy, someinvestors may consider these charges and expenses as a recurring part of operations rather thanexpenses that are not part of operations.