desalination recovery enhancement and...
TRANSCRIPT
Final Project Report
Co-Sponsored by:
Eastern Municipal Water DistrictPERRIS, CALIFORNIA
Prepared by:
Carollo Engineers, Inc.FOUNTAIN VALLEY, CALIFORNIA
Desalination RecoveryEnhancement and ConcentrateManagement Study – Phase II

Southern California Salinity Coalition Final Project Report
Desalination Recovery Enhancement and Concentrate Management Study – Phase II
Prepared by:
Carollo Engineers, Inc. Fountain Valley, CA
For:
Eastern Municipal Water District
Perris, CA
Published by:
Southern California Salinity Coalition c/o National Water Research Institute
Fountain Valley, California
November 2010
i
About SCSC The Southern California Salinity Coalition (SCSC) is a 501c3 nonprofit formed in 2002 by water and wastewater agencies in Southern California to address the critical need to remove salt from water supplies and to preserve our water resources. SCSC, which is administered by the National Water Research Institute, focuses on research and outreach activities that address the need to control or reduce salinity in drinking water, wastewater, and recycled water. SCSC’s member agencies include: Eastern Municipal Water District, Inland Empire Utilities Agency, Metropolitan Water District of Southern California, Orange County Sanitation District, Orange County Water District, San Diego County Water Authority, Sanitation Districts of Los Angeles County, Santa Ana Watershed Project Authority, and West Basin Municipal Water District. For more information, please contact: Southern California Salinity Coalition c/o National Water Research Institute 18700 Ward Street P.O. Box 8096 Fountain Valley, California 92728-8096 USA Phone: (714) (714) 378-3728 Fax: (714) 378-3375 www.socalsalinity.org Jeffrey J. Mosher, Administrative Director Gina Melin Vartanian, Editor © 2010 by the Southern California Salinity Coalition. All rights reserved. SCSC Publication Number SCSC-2010-02 This SCSC Final Project Report is a product of SCSC Project Number SCSC-2008-07.
ii
Acknowledgments This Final Project Report was prepared by Carollo Engineers, Inc. of Fountain Valley, California, and sponsored by Eastern Municipal Water District (EMWD) of Perris, California and the Southern California Salinity Coalition (SCSC) of Fountain Valley, California. Special thanks are extended to the following for their contributions to this effort: Carollo Engineers, Inc. Eastern Municipal Water District Graham Juby, Ph.D., P.E. P. “Ravi” Ravishanker, P.E. G. Adam Zacheis, Ph.D., P.E. Behrooz Mortazavi, Ph.D., P.E. Winnie Shih, Ph.D. Michael D. Nusser Tom Caohuy The members of EMWD’s Board of Directors, and SCSC, are thanked for their vision and support. Special thanks are extended to EMWD’s Mechanical Services and Electrical Services departments for their continued support in getting the project to the finish line. And a very special thanks to the Water Operations staff at EMWD’s desalination facilities for always going “above and beyond the call of duty” to help make this project possible.

iii
Table of Contents Page No.
CHAPTER 1 - INTRODUCTION
1.1 INTRODUCTION..................................................................................................... 1-1 1.2 BACKGROUND ...................................................................................................... 1-1 1.3 GOALS AND OBJECTIVES ................................................................................... 1-2
CHAPTER 2 - MATERIALS AND METHODS
2.1 INTRODUCTION..................................................................................................... 2-1 2.2 RAW WATER SUPPLY .......................................................................................... 2-1 2.3 PILOT PLANT FACILITY ....................................................................................... 2-1
2.3.1 Overall Process Flow Diagram ..................................................................... 2-1 2.3.2 Pilot Plant Layout .......................................................................................... 2-3
2.4 BRINE PRETREATMENT ...................................................................................... 2-3 2.4.1 Chemical Softening ....................................................................................... 2-3
2.4.1.1 Sludge ............................................................................................. 2-4 2.4.1.2 Softened Water Conditioning ......................................................... 2-4
2.4.2 Dual-Media Filtration ................................................................................... 2-8 2.5 REVERSE OSMOSIS .............................................................................................. 2-9
2.5.1 Membrane Selection ................................................................................... 2-12 2.5.2 Anti-Scalant Dosing .................................................................................... 2-12 2.5.3 Acid Dosing ................................................................................................ 2-13 2.5.4 Prefilter Cartridges ...................................................................................... 2-13 2.5.5 RO Membrane Cleaning ............................................................................. 2-13
2.6 ELECTRODIALYSIS REVERSAL ....................................................................... 2-14 2.6.1 Pilot Plant System Control .......................................................................... 2-17
2.7 PILOT SAMPLING AND MONITORING ............................................................ 2-18 2.7.1 Manual Data Collection .............................................................................. 2-18 2.7.2 Automatic Data Collection ......................................................................... 2-19 2.7.3 Field Testing ............................................................................................... 2-19 2.7.4 Laboratory Analysis .................................................................................... 2-20
2.8 INTERPRETATION OF PERFORMANCE DATA .............................................. 2-24 2.8.1 RO Data Normalization .............................................................................. 2-24 2.8.2 Performance Equations ............................................................................... 2-24 2.8.3 Normalization of EDR Data ........................................................................ 2-26
CHAPTER 3 - RESULTS AND DISCUSSION
3.1 INTRODUCTION..................................................................................................... 3-1 3.2 RAW WATER SUPPLY .......................................................................................... 3-2
3.2.1 Raw Water Quality ........................................................................................ 3-2 3.3 BRINE PRETREATMENT ...................................................................................... 3-5
3.3.1 Chemical Softening ....................................................................................... 3-5
iv
3.3.1.1 Polymer Addition ......................................................................... 3-11 3.3.1.2 Solids Production and Quality ...................................................... 3-15 3.3.1.3 Solids Handling ............................................................................ 3-15 3.3.1.4 Solids Dewatering......................................................................... 3-17 3.3.1.5 Solids Disposal ............................................................................. 3-19
3.3.2 Softened Water Conditioning ..................................................................... 3-19 3.3.3 Dual Media and Cartridge Filtration ........................................................... 3-19
3.4 REVERSE OSMOSIS ............................................................................................ 3-21 3.4.1 Permeate Flow, Recoveries, Flux, and Permeability .................................. 3-21
3.4.1.1 Week 1 .......................................................................................... 3-21 3.4.1.2 Week 2 .......................................................................................... 3-24 3.4.1.3 Week 3 .......................................................................................... 3-24
3.4.2 Membrane Cleaning .................................................................................... 3-31 3.4.3 Water Quality .............................................................................................. 3-31
3.5 ELECTRODIALYSIS REVERSAL ....................................................................... 3-34 3.5.1 Flows and Recovery .................................................................................... 3-36 3.5.2 Rejection and Conductivity ......................................................................... 3-36 3.5.3 Feed Pressure .............................................................................................. 3-36 3.5.4 Energy Consumption: Voltages and Resistance ......................................... 3-36 3.5.5 Electrodialysis Reversal Water Quality ...................................................... 3-45
CHAPTER 4 - PRELIMINARY CONSTRUCTION COST ESTIMATE
4.1 PURPOSE ................................................................................................................. 4-1 4.2 COST ESTIMATE ASSUMPTIONS ....................................................................... 4-1
4.2.1 Desalter Streams and Flows .......................................................................... 4-1 4.2.2 Base Operation and Maintenance Cost Assumptions ................................... 4-2 4.2.3 Capital Cost Assumptions ............................................................................. 4-3
4.3 CONSTRUCTION COST ESTIMATES .................................................................. 4-3 4.4 SITE LAYOUT ......................................................................................................... 4-6 4.5 CONCLUSIONS ....................................................................................................... 4-6
CHAPTER 5 - CONCLUSIONS
5.1 CONCLUSIONS ....................................................................................................... 5-1
REFERENCES .................................................................................................... References-1
APPENDIX A Operator Log Sheets APPENDIX B Pilot Plant Operational History and Noted Problems APPENDIX C RO Modeling Results - 77-Percent Recovery APPENDIX D Soda Ash Solubility Curves APPENDIX E Laboratory Sludge Analysis Report APPENDIX F Sludge Dewatering Evaluation Report APPENDIX G Cost Estimate
v
List of Tables Table 2.1 CONTRAFAST® Softening System Attributes ............................................ 2-3 Table 2.2 Media Filter Details ...................................................................................... 2-9 Table 2.3 Cleaning Protocols ...................................................................................... 2-13 Table 2.4 RO Pilot Chemical Cleaning – General Features ........................................ 2-14 Table 2.5 GE/Ionics Pilot EDR Details ...................................................................... 2-17 Table 2.6 Pilot System General Control Conditions ................................................... 2-18 Table 2.7 Field-Water Quality Analysis Matrix .......................................................... 2-20 Table 2.8 Process Related Analysis ............................................................................ 2-21 Table 3.1 Summary of Water Quality Data: Menifee Brine ......................................... 3-2 Table 3.2 Summary of Water Quality Data: Softened Brine (RO/EDR Feed) ............. 3-5 Table 3.3 RO Modeling Predictions at 77-Percent Recovery ....................................... 3-7 Table 3.4 Sludge Analysis Results .............................................................................. 3-15 Table 3.5 SDI Results ................................................................................................. 3-19 Table 3.6 Summary of Water Quality Data: RO Product ........................................... 3-32 Table 3.7 Summary of Water Quality Data: RO Concentrate ..................................... 3-33 Table 3.8 Summary of Water Quality Data: EDR Product ......................................... 3-45 Table 3.9 Summary of Water Quality Data: EDR Concentrate .................................. 3-46 Table 4.1 O&M Cost Assumptions ............................................................................... 4-2 Table 4.2 Capital Cost Assumptions ............................................................................. 4-3 Table 4.3 Construction Cost Estimates ......................................................................... 4-4 List of Figures Figure 2.1 Process Flow Diagram .................................................................................. 2-2 Figure 2.2 Project Overall Site Plan ............................................................................... 2-5 Figure 2.3 Pilot Plant Layout .......................................................................................... 2-6 Figure 2.4 Schematic of CONTRAFAST® Softening Unit ............................................ 2-7 Figure 2.5 Pilot RO Process and Instrumentation Diagram ......................................... 2-10 Figure 2.6 Photograph of Pilot RO Skid ...................................................................... 2-11 Figure 2.7 Pilot EDR Process and Instrumentation Diagram ....................................... 2-15 Figure 2.8 Photos of EDR Pilot Unit and Stack ........................................................... 2-16 Figure 3.1 Menifee Plant Feed Well Flow Rates ........................................................... 3-4 Figure 3.2 Raw and Softened Water Hardness ............................................................... 3-8 Figure 3.3 Effect of Softening Plant Flow Rate on Scaling Precursor Removal............ 3-9 Figure 3.4 Raw and Softened Water Silica .................................................................. 3-10 Figure 3.5 Raw and Softened Water Alkalinity ........................................................... 3-12 Figure 3.6 Raw and Softened Water Magnesium, Iron, Selenium and Arsenic ........... 3-13 Figure 3.7 Raw and Softened Water TDS .................................................................... 3-14 Figure 3.8 Sludge Production Rates ............................................................................. 3-16
vi
Figure 3.9 Dewatering Tests......................................................................................... 3-18 Figure 3.10 Softened Brine Turbidity - Post Clarifier and Media Filtration .................. 3-20 Figure 3.11 RO Plant Feed Water Flow Rates ............................................................... 3-22 Figure 3.12 RO Plant Rejection and Recovery .............................................................. 3-23 Figure 3.13 RO Feed Pressures ...................................................................................... 3-25 Figure 3.14 RO Differential Pressures ........................................................................... 3-26 Figure 3.15 RO Normalized Permeate Flow .................................................................. 3-27 Figure 3.16 RO Normalized Salt Passage and Rejection ............................................... 3-28 Figure 3.17 Softened Water Calcium Concentration ..................................................... 3-29 Figure 3.18 Softened Water Silica Concentration .......................................................... 3-30 Figure 3.19 RO Permeate TDS ....................................................................................... 3-35 Figure 3.20 EDR Feed, Permeate and Make-Up Flows ................................................. 3-37 Figure 3.21 EDR Recovery ............................................................................................ 3-38 Figure 3.22 EDR Rejection ............................................................................................ 3-39 Figure 3.23 EDR Permeate and Concentrate Conductivity ............................................ 3-40 Figure 3.24 EDR Feed Pressures .................................................................................... 3-41 Figure 3.25 EDR Operating Voltages ............................................................................ 3-42 Figure 3.26 EDR Membrane Resistance with Salt Rejection - Stage 1 ......................... 3-43 Figure 3.27 EDR Membrane Resistance with Salt Rejection - Stage 2 ......................... 3-44 Figure 4.1 Process Streams and Costs ............................................................................ 4-5 Figure 4.2 Conceptual Brine Recovery Plant Layout - 1 mgd RO Permeate ................. 4-7

vii
ABBREVIATIONS AF acre-foot AFY acre feet per year CaCO3 calcium carbonate Carollo Carollo Engineers CIP clean-in-place EDR electrodialysis reversal EMWD Eastern Municipal Water District NPF normalized permeate flow NSP normalized salt passage NSR normalized salt rejection O&M operation and maintenance OCSD Orange County Sanitation District P&ID Process and Instrumentation Diagram PLC programmable logic controller RO reverse osmosis SARI Santa Ana Regional Interceptor SDI Silt Density Index Siemens Siemens Corporation SiO2 silica TDS total dissolved solids TOC Total Organic Carbon TSS Total Suspended Solids TVRI Temecula Valley Regional Interceptor Western Western Municipal Water District
1-1
Chapter 1
INTRODUCTION
1.1 INTRODUCTION
In January 2005, Eastern Municipal Water District (EMWD) contracted Carollo Engineers (Carollo) to conduct a turnkey piloting project aimed at reducing brine volumes discharged to the Santa Ana Regional Interceptor (SARI) from the Menifee and Perris desalters. Piloting activities were conducted over a period of six months, from June to December 2006. The pilot project incorporated testing of chemical softening, followed by secondary reverse osmosis (RO) and electrodialysis reversal (EDR) to reduce the brine volume and produce additional potable water. This first phase of piloting was completed, and partially funded, under a California Prop 50 grant. The final Phase I report was submitted to the State in January 2008. Among the various Phase I findings, it was determined that intermediate chemical brine softening pretreatment was very effective in reducing the concentration of scaling precursors in downstream membrane processes. Secondary RO recoveries, for example, could be as high as 75 percent, which, when combined with a primary RO plant recovery of 70 percent, would enable EMWD to realize a combined recovery of over 90 percent.
During Phase I testing, continuous operation of the secondary membrane systems was difficult due to solids breakthrough from the softening phase, which outstripped the capacity of the downstream filters and, hence, resulted in the passing of fine solids to secondary membrane systems. Encouraged by Phase I testing results and recognizing the value of brine minimization, EMWD made the decision to fund a second phase of this project. Therefore, Phase II was an extension of the Prop 50 brine minimization project and lessons learned from Phase I were incorporated in the design and operation of a more robust system that would allow for longer uninterrupted RO and EDR operation. In addition, a major Phase II goal included the testing and analysis of lime softening sludge as well as evaluating sludge dewatering and disposal options.
1.2 BACKGROUND
EMWD has invested significant funds in the design and construction of the Menifee and Perris Desalters to treat brackish well water for potable water production. In addition, the future construction of the Perris II Desalter is planned and, as a result, the volumes of brine requiring SARI disposal will increase. Furthermore, SARI disposal fees have been increasing, resulting in more costly operation. Consequently, the aim of the pilot plant project was to determine the feasibility of secondary treatment of brine from primary desalters to reduce the volume of brine for final disposal and increase the overall recovery of potable water to 90 percent or greater.
Both EDR and RO were investigated as the secondary desalting processes due to fundamental differences in the operation of each process and their ability to handle certain types of chemical scaling. One of the scale-forming constituents found in the Menifee brine stream is silica. Other scaling constituents present include sparingly soluble salts such as calcium carbonate and calcium sulfate. EDR, by the nature of its operation, is not as impacted by silica scaling since silica is uncharged and will not be attracted to the membrane surfaces of the EDR unit. In

1-2
contrast, RO units are susceptible to silica scaling due to the concentration of the overall bulk stream.
During this study, antiscalants were used to help control overall scaling and increase the recovery of both the RO and EDR trains.
1.3 GOALS AND OBJECTIVES
The overall goal of the Phase II pilot plant project was to extend Phase I piloting work including switching from sodium hydroxide to the use of lime and soda ash for chemical softening and the investigation of solids handling and disposal. Results from this testing are intended for use as a basis for determining the economic viability for the construction of a secondary membrane treatment process that would reduce the volume of brine currently disposed of to the SARI line and increase potable water production.
The major objectives of this work were to: 1. Operate a high-rate lime-based chemical precipitation process in conjunction with a
downstream filtration process to produce high-quality softened feed water for second-stage RO and EDR.
2. Determine the optimal dose of lime and soda ash required to achieve desired recovery for the membrane processes.
3. Evaluate processes for dewatering lime sludge produced by the pilot plant to determine the anticipated percent solids that could be expected in a full-scale application.
4. Determine the chemical composition of the lime sludge and the cost of disposal.
5. Confirm performance of the RO and EDR processes and anticipated cleaning frequency for the full-scale application.
6. Obtain cost, sizing, energy-use, and space requirement data to refine existing cost models for a future full-scale brine-minimization process at EMWD.
2-1
Chapter 2
MATERIALS AND METHODS
2.1 INTRODUCTION
The initial pilot test plan proposed two basic phases for operation: a start-up phase followed by a longer operational phase. The start-up phase was intended to last 2 weeks and would be used to establish optimal pretreatment conditions and reasonable recovery for the subsequent 3-month operational phase. This plan was predicated on the assumption that the softening process would produce suitable quality water for the downstream membrane processes. Pretreatment of the concentrate stream was necessary to reduce the calcium and silica concentrations and allow for reasonable secondary membrane recoveries.
2.2 RAW WATER SUPPLY
Feed water for the Menifee Desalter may be pumped from a number of wells of varying capacity and quality to the Menifee and Perris Desalter site. EMWD may blend these wells in different combinations to provide the feed water volume required for a given demand. This means that the well water quality and, hence, Menifee brine water quality varied somewhat during the course of pilot testing.
2.3 PILOT PLANT FACILITY
2.3.1 Overall Process Flow Diagram
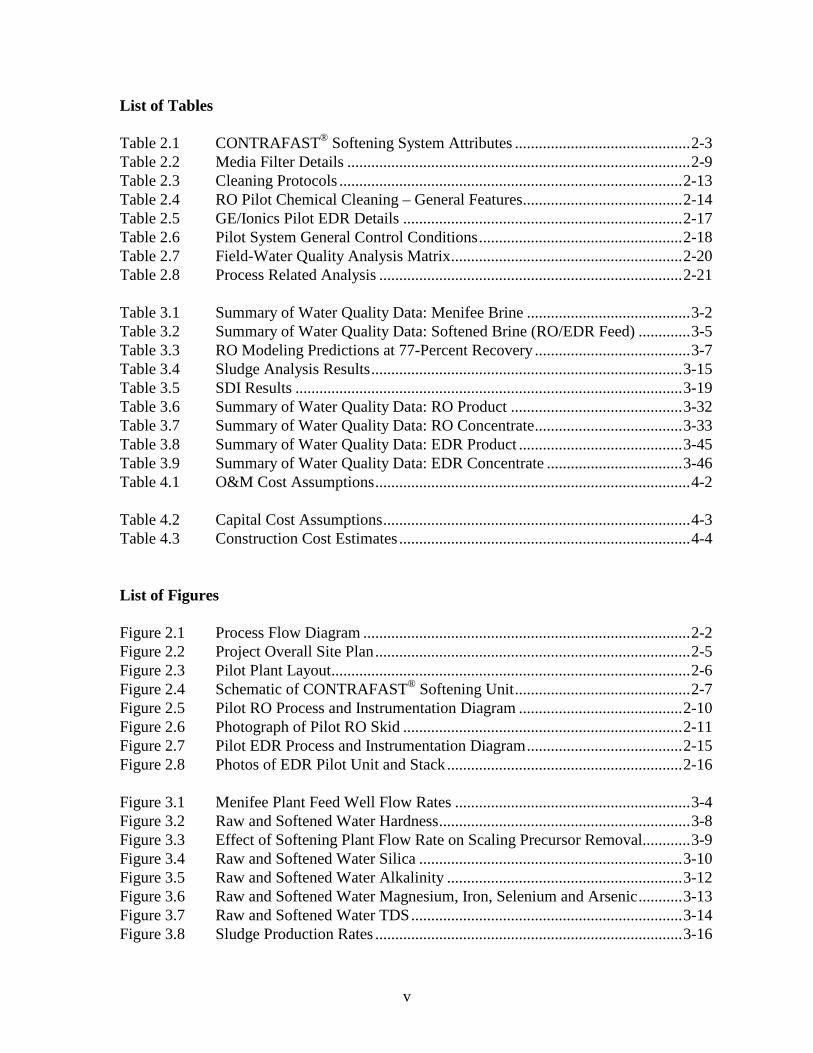
Figure 2.1 presents the overall process flow diagram of the pilot plant as initially designed and constructed with modifications required for Phase II operation. A new softening and clarification step (CONTRAFAST®) was used followed by a deep-bed conventional media filtration unit to remove remaining suspended solids from the softened water. The Phase II softening system was a high-rate contact clarifier, able to handle the high solids loading that was produced under Phase I testing. In order to ensure solids removal, a new deep-bed media filter skid was used. After filtration, flow was split to the RO and EDR pilot units. In the original process design, all permeate, concentrate, filter backwash, and sludge from the softening step was combined and returned to the pilot sump. Water from this sump was then pumped across the site to the existing brine water pump station and disposed to the SARI line.
Under Phase II operation, modifications were made to the design and operation such that solids from the CONTRAFAST® unit were diverted to on-site sludge bins for the collection and disposal of softening sludge. It was determined early in the testing program that solids produced from the pilot would settle in the SARI line after discharge in the brine pump station. Since the EMWD had recently gone through an extensive and expensive cleaning program for the Reach 10 line due to significant scaling, it was determined keeping the solids from pilot testing out of the SARI system would be prudent. Sludge composition analysis was performed at a testing laboratory to provide certification for landfill disposal through Nursery Products, Inc. Landfill disposal required that the sludge collected in the disposal bins not contain any free standing water.

FIGURE 2.1
PROCESS FLOW DIAGRAM
20-E
MW
D8-
09F
2.1-
7324
C00
.AI
EASTERN MUNICIPAL WATER DISTRICTDESALINATION RECOVERY ENHANCEMENT
AND CONCENTRATE MANAGEMENT STUDY-PHASE II

2-3
2.3.2 Pilot Plant Layout
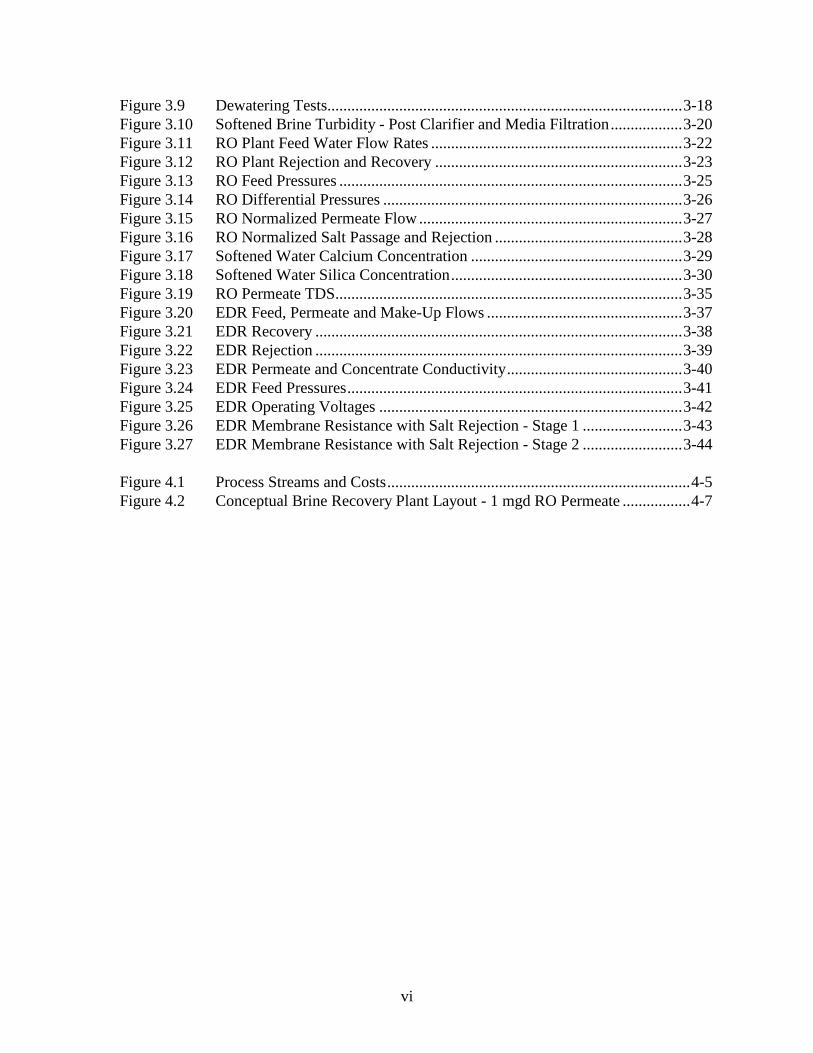
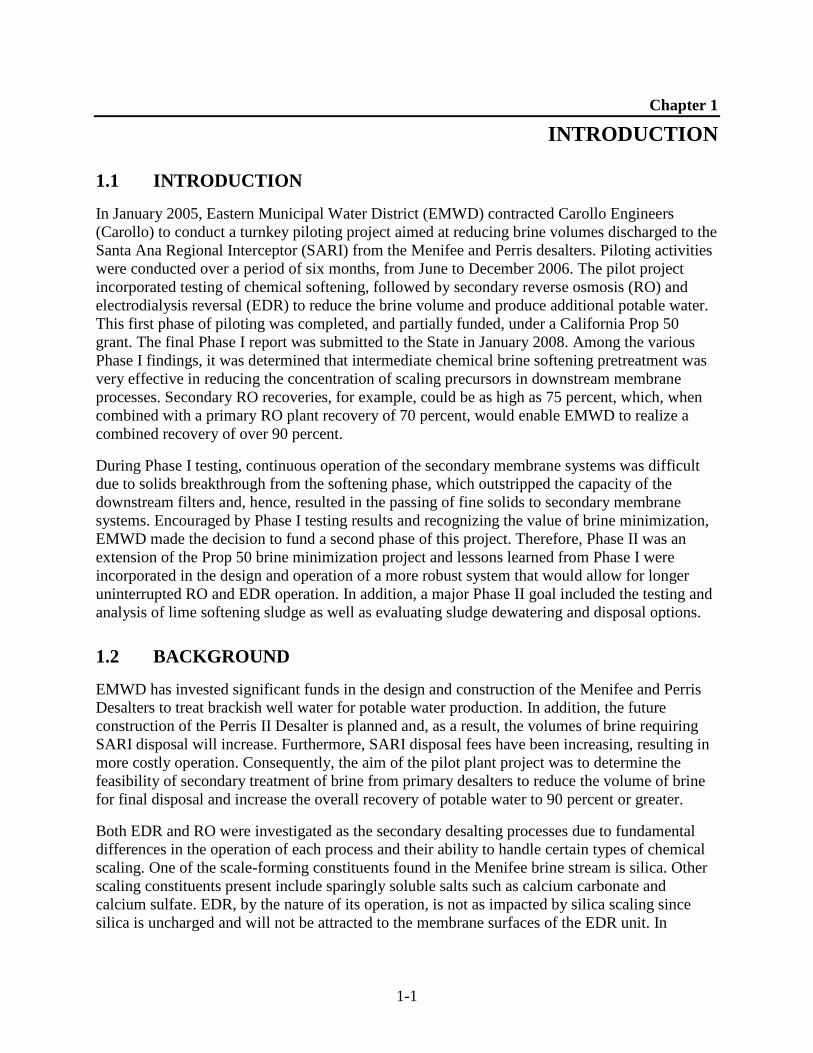
Figures 2.2 and 2.3 illustrate the overall project site plan and the pilot plant layout, respectively. The pilot plant was a modified version of the pilot facility originally constructed on the site of EMWD’s Menifee/Perris Desalters for Phase I testing.
2.4 BRINE PRETREATMENT
Pretreatment processes were utilized to make the Menifee Desalter brine stream amenable to secondary treatment using RO and EDR. This included chemical softening, sludge handling, and softened water conditioning.
2.4.1 Chemical Softening
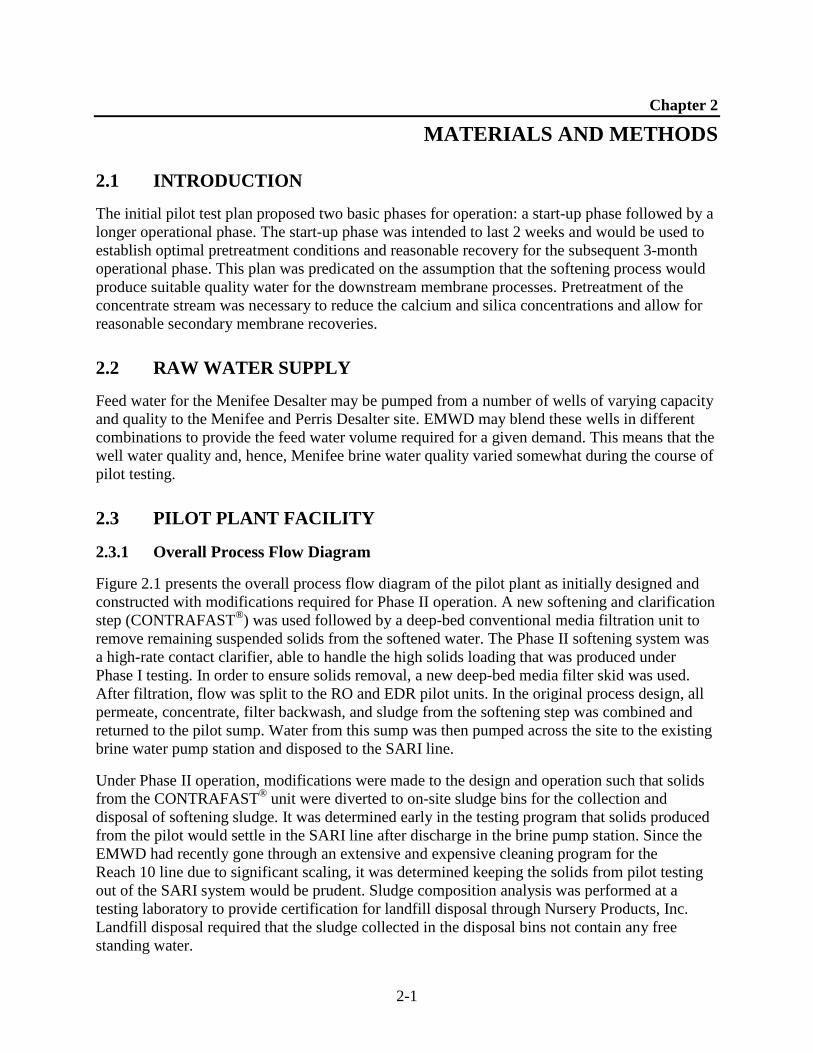
Concentrate from the Menifee Desalter was conveyed to the CONTRAFAST® unit at the pilot site via a line buried under the asphalt driveway between the site and the desalter. In the reaction chamber of the CONTRAFAST® unit, lime slurry and soda ash was mixed with the brine stream. The CONTRAFAST® unit is an upflow solids contact clarifier that incorporates the processes of coagulation, flocculation solids separation, solids recirculation, and removal in a single vessel. The unit is skid-mounted and consists of three concentric cylinders, which serve as the reactor, settling area, and effluent chamber (see Figure 2.4). Within the reactor, lime and soda ash are continuously mixed with the brine stream to achieve an elevated pH (>10.5), resulting in the formation of insoluble salts.
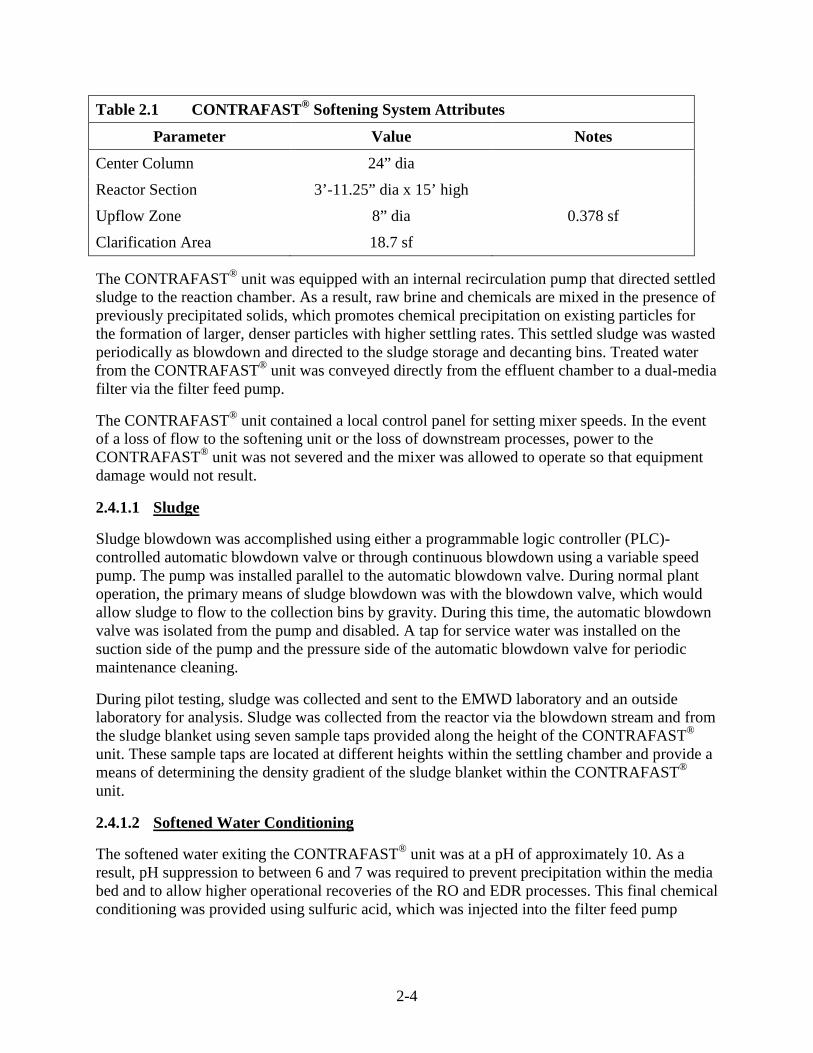
As the water flows through the chambers of the CONTRAFAST® unit, chemical and hydraulic conditions were selected to optimize precipitation of calcium, magnesium, and silica. From the reactor, the water enters the settling chamber where the precipitated solids settle out, forming a dense sludge. Softened water exits the CONTRAFAST® unit after passing through the effluent chamber. A coagulant aid such as a high molecular weight polymer can be added to improve settleability of the flocs generated in the reactor. If required, the appropriate coagulant aid will be dosed directly into the CONTRAFAST® reaction chamber. Sludge accumulating on the floor of the settling chamber concentrates under gravity. Table 2.1 summarizes the features of the CONTRAFAST® system.
Table 2.1 CONTRAFAST® Softening System Attributes
Parameter Value Notes
Basin Size 8’-0” dia x 18’-6” high Side Height
Side Water Depth 15’-4”
Operating Weight 45,000 lbs 12,000 lbs Shipping Weight
Area at Separation Zone 18.7 sf
Flow/Rise Rate 80 gpm @ 4.2 gpm/sf Typical
Flow/Rise Rate 160 gpm @ 8.6 gpm/sf Maximum
Basin Capacity 5,300 gallons
2-4
Table 2.1 CONTRAFAST® Softening System Attributes
Parameter Value Notes
Center Column 24” dia
Reactor Section 3’-11.25” dia x 15’ high
Upflow Zone 8” dia 0.378 sf
Clarification Area 18.7 sf
The CONTRAFAST® unit was equipped with an internal recirculation pump that directed settled sludge to the reaction chamber. As a result, raw brine and chemicals are mixed in the presence of previously precipitated solids, which promotes chemical precipitation on existing particles for the formation of larger, denser particles with higher settling rates. This settled sludge was wasted periodically as blowdown and directed to the sludge storage and decanting bins. Treated water from the CONTRAFAST® unit was conveyed directly from the effluent chamber to a dual-media filter via the filter feed pump.
The CONTRAFAST® unit contained a local control panel for setting mixer speeds. In the event of a loss of flow to the softening unit or the loss of downstream processes, power to the CONTRAFAST® unit was not severed and the mixer was allowed to operate so that equipment damage would not result.
2.4.1.1
Sludge blowdown was accomplished using either a programmable logic controller (PLC)-controlled automatic blowdown valve or through continuous blowdown using a variable speed pump. The pump was installed parallel to the automatic blowdown valve. During normal plant operation, the primary means of sludge blowdown was with the blowdown valve, which would allow sludge to flow to the collection bins by gravity. During this time, the automatic blowdown valve was isolated from the pump and disabled. A tap for service water was installed on the suction side of the pump and the pressure side of the automatic blowdown valve for periodic maintenance cleaning.
Sludge
During pilot testing, sludge was collected and sent to the EMWD laboratory and an outside laboratory for analysis. Sludge was collected from the reactor via the blowdown stream and from the sludge blanket using seven sample taps provided along the height of the CONTRAFAST® unit. These sample taps are located at different heights within the settling chamber and provide a means of determining the density gradient of the sludge blanket within the CONTRAFAST® unit.
2.4.1.2
The softened water exiting the CONTRAFAST® unit was at a pH of approximately 10. As a result, pH suppression to between 6 and 7 was required to prevent precipitation within the media bed and to allow higher operational recoveries of the RO and EDR processes. This final chemical conditioning was provided using sulfuric acid, which was injected into the filter feed pump
Softened Water Conditioning
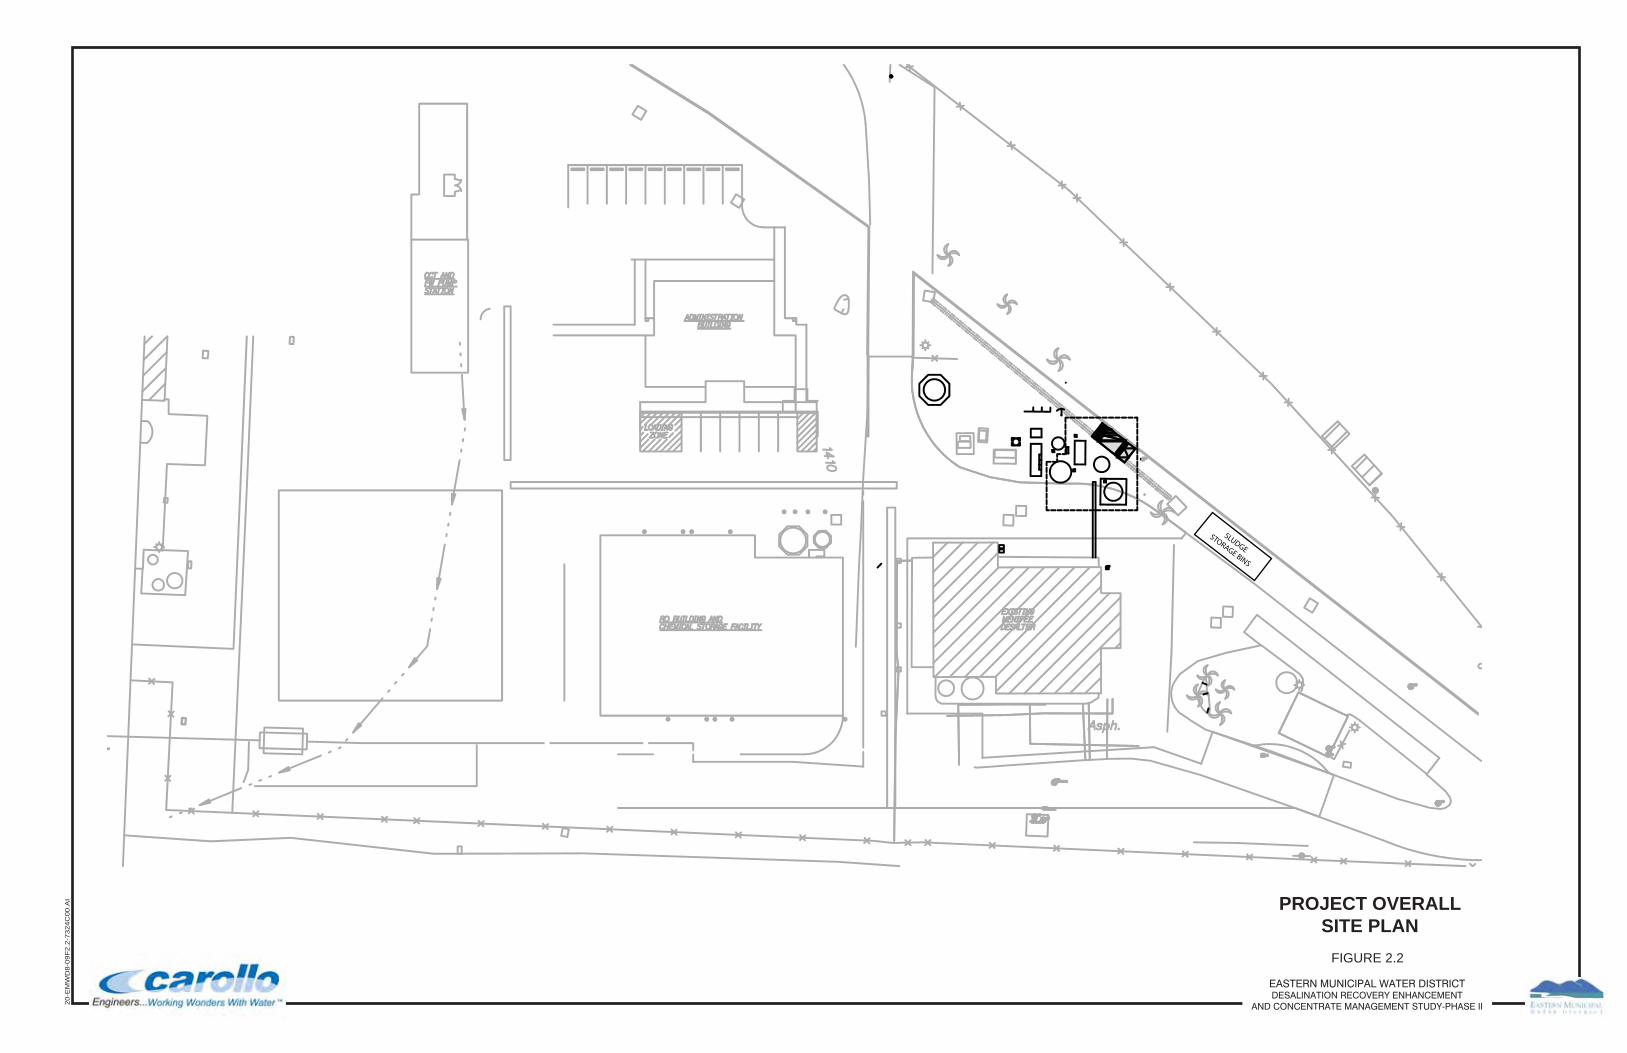
FIGURE 2.2
PROJECT OVERALLSITE PLAN
20-E
MW
D8-
09F
2.2-
7324
C00
.AI
EASTERN MUNICIPAL WATER DISTRICTDESALINATION RECOVERY ENHANCEMENT
AND CONCENTRATE MANAGEMENT STUDY-PHASE II
SLUDGE
STORAGE BINS

FIGURE 2.3
PILOT PLANT LAYOUT
20-E
MW
D8-
09F
2.3-
7324
C00
.AI
EASTERN MUNICIPAL WATER DISTRICTDESALINATION RECOVERY ENHANCEMENT
AND CONCENTRATE MANAGEMENT STUDY-PHASE II
SLUGE STORAGE BINS

FIGURE 2.4
SCHEMATIC OF CONTRAFAST SOFTENING UNIT
20-E
MW
D8-
09F
2.4-
7324
C00
.AI
EASTERN MUNICIPAL WATER DISTRICTDESALINATION RECOVERY ENHANCEMENT
AND CONCENTRATE MANAGEMENT STUDY-PHASE II
2-8
discharge line, just upstream of a static mixer. Sulfuric acid was dosed from the existing chemical facilities at the Menifee Desalter to the piloting site using diluted 30-percent sulfuric acid. Pump stroke and speed was remotely controlled using a pH control feedback loop. Sulfuric acid was conveyed in a double contained line to the point of injection.
Softened water pH was monitored just upstream of the dual-media filter and pH setpoints were entered into a local pH controller, which was mounted near the filter feed pump local control (start-stop) station. In the event of a loss of water flow, the filter feed pump was powered down via relays in the local control panel.
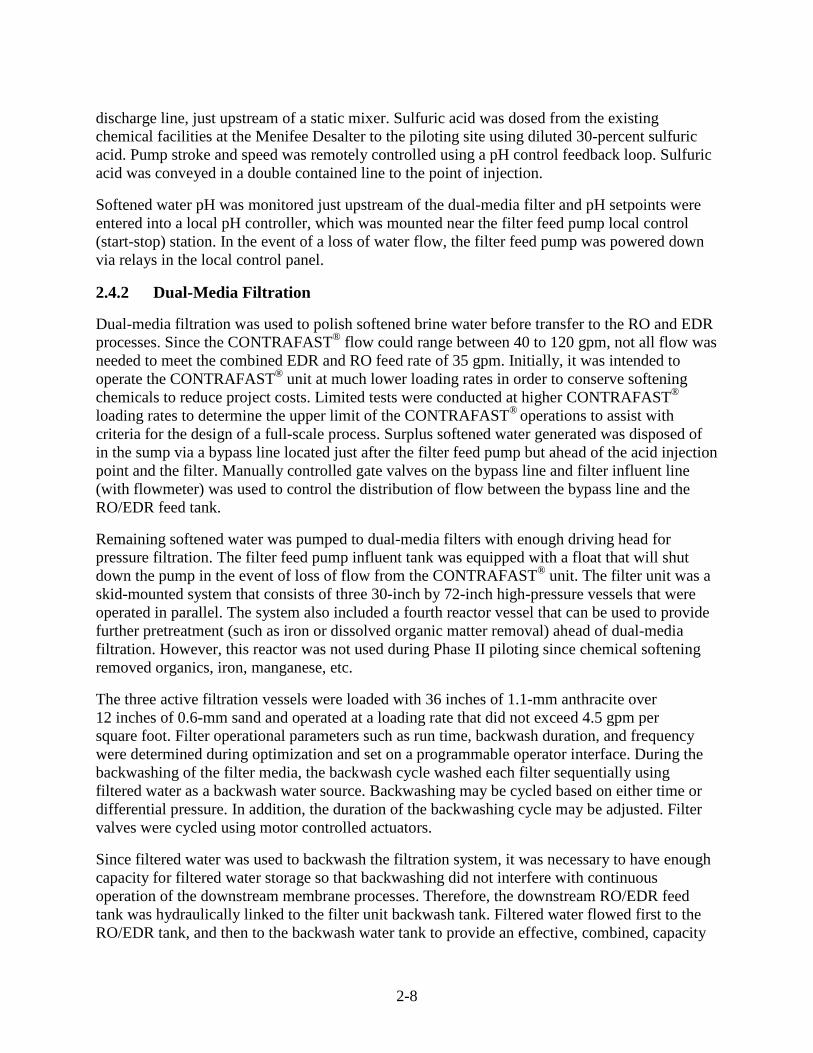
2.4.2 Dual-Media Filtration
Dual-media filtration was used to polish softened brine water before transfer to the RO and EDR processes. Since the CONTRAFAST® flow could range between 40 to 120 gpm, not all flow was needed to meet the combined EDR and RO feed rate of 35 gpm. Initially, it was intended to operate the CONTRAFAST® unit at much lower loading rates in order to conserve softening chemicals to reduce project costs. Limited tests were conducted at higher CONTRAFAST® loading rates to determine the upper limit of the CONTRAFAST® operations to assist with criteria for the design of a full-scale process. Surplus softened water generated was disposed of in the sump via a bypass line located just after the filter feed pump but ahead of the acid injection point and the filter. Manually controlled gate valves on the bypass line and filter influent line (with flowmeter) was used to control the distribution of flow between the bypass line and the RO/EDR feed tank.
Remaining softened water was pumped to dual-media filters with enough driving head for pressure filtration. The filter feed pump influent tank was equipped with a float that will shut down the pump in the event of loss of flow from the CONTRAFAST® unit. The filter unit was a skid-mounted system that consists of three 30-inch by 72-inch high-pressure vessels that were operated in parallel. The system also included a fourth reactor vessel that can be used to provide further pretreatment (such as iron or dissolved organic matter removal) ahead of dual-media filtration. However, this reactor was not used during Phase II piloting since chemical softening removed organics, iron, manganese, etc.
The three active filtration vessels were loaded with 36 inches of 1.1-mm anthracite over 12 inches of 0.6-mm sand and operated at a loading rate that did not exceed 4.5 gpm per square foot. Filter operational parameters such as run time, backwash duration, and frequency were determined during optimization and set on a programmable operator interface. During the backwashing of the filter media, the backwash cycle washed each filter sequentially using filtered water as a backwash water source. Backwashing may be cycled based on either time or differential pressure. In addition, the duration of the backwashing cycle may be adjusted. Filter valves were cycled using motor controlled actuators.
Since filtered water was used to backwash the filtration system, it was necessary to have enough capacity for filtered water storage so that backwashing did not interfere with continuous operation of the downstream membrane processes. Therefore, the downstream RO/EDR feed tank was hydraulically linked to the filter unit backwash tank. Filtered water flowed first to the RO/EDR tank, and then to the backwash water tank to provide an effective, combined, capacity
2-9
of 1,500 gallons. Excess filtered water was directed to the pilot area sump. The tanks were sized to allow sufficient water for backwashing and feeding the RO and EDR skids at a combined flow of 40 gpm.
Backwash water from a given backwash cycle was directed to a 1,500-gallon Spent Filter Backwash Tank, located just west of the pilot slab. The purpose of this tank was to provide temporary storage to slowly drain water to the pilot sump to prevent overloading of the sump pump. Other specific details of the filters are summarized in Table 2.2.
Table 2.2 Media Filter Details
Value Notes
Filter Tanks 30 inches 3 vessels total
Filter Area 4.91 sf Per vessel
Dry Weight 1,500 lbs Empty weight
Working Pressure 100 psi Maximum
Footprint 105” x 53” x 137”
Filter Flow Rate 60 gpm Maximum
Backwash Rate 15 gpm/sf Used during testing
Backwash Duration 5 mins Used during testing
Backwash Interval 24 hrs Used during testing
2.5 REVERSE OSMOSIS
An RO pilot plant was purchased from Harn RO Systems and was installed at the site for Phase I testing. This unit was used for Phase II testing and new membranes were installed. The RO skid measured approximately 60 inches in length by 144 inches in width by 72 inches in height. Figures 2.5 and 2.6 present a Process and Instrumentation Diagram (P&ID) and photograph of the pilot skid, respectively. Key components of the RO pilot included pretreatment acid and scale inhibitor chemical injection, 5-μm cartridge filters, booster pump, high-pressure feed pump, inter-stage booster pump, pressure vessels, RO membrane elements, instrumentation, controls, and a clean-in-place (CIP) system for membrane cleaning.
The skid-mounted pilot unit consisted of two stages of RO membranes, organized in a 2:1 array of three- and four-element pressure vessels operated in series. The particular array was selected to mimic the configuration of the Menifee Desalter. The first stage consisted of two parallel vessels, each containing seven 4-inch diameter membrane elements. The second stage consisted of one vessel also with seven 4-inch elements providing 21 membrane elements in the unit. To minimize space demands, each vessel (for both stages) was divided into two, and the pieces manifolded in a manner so that they would behave, in effect, as a typical single vessel. This resulted in a modification of the configuration to a 2:2:1:1 array capable of achieving the desired recovery.
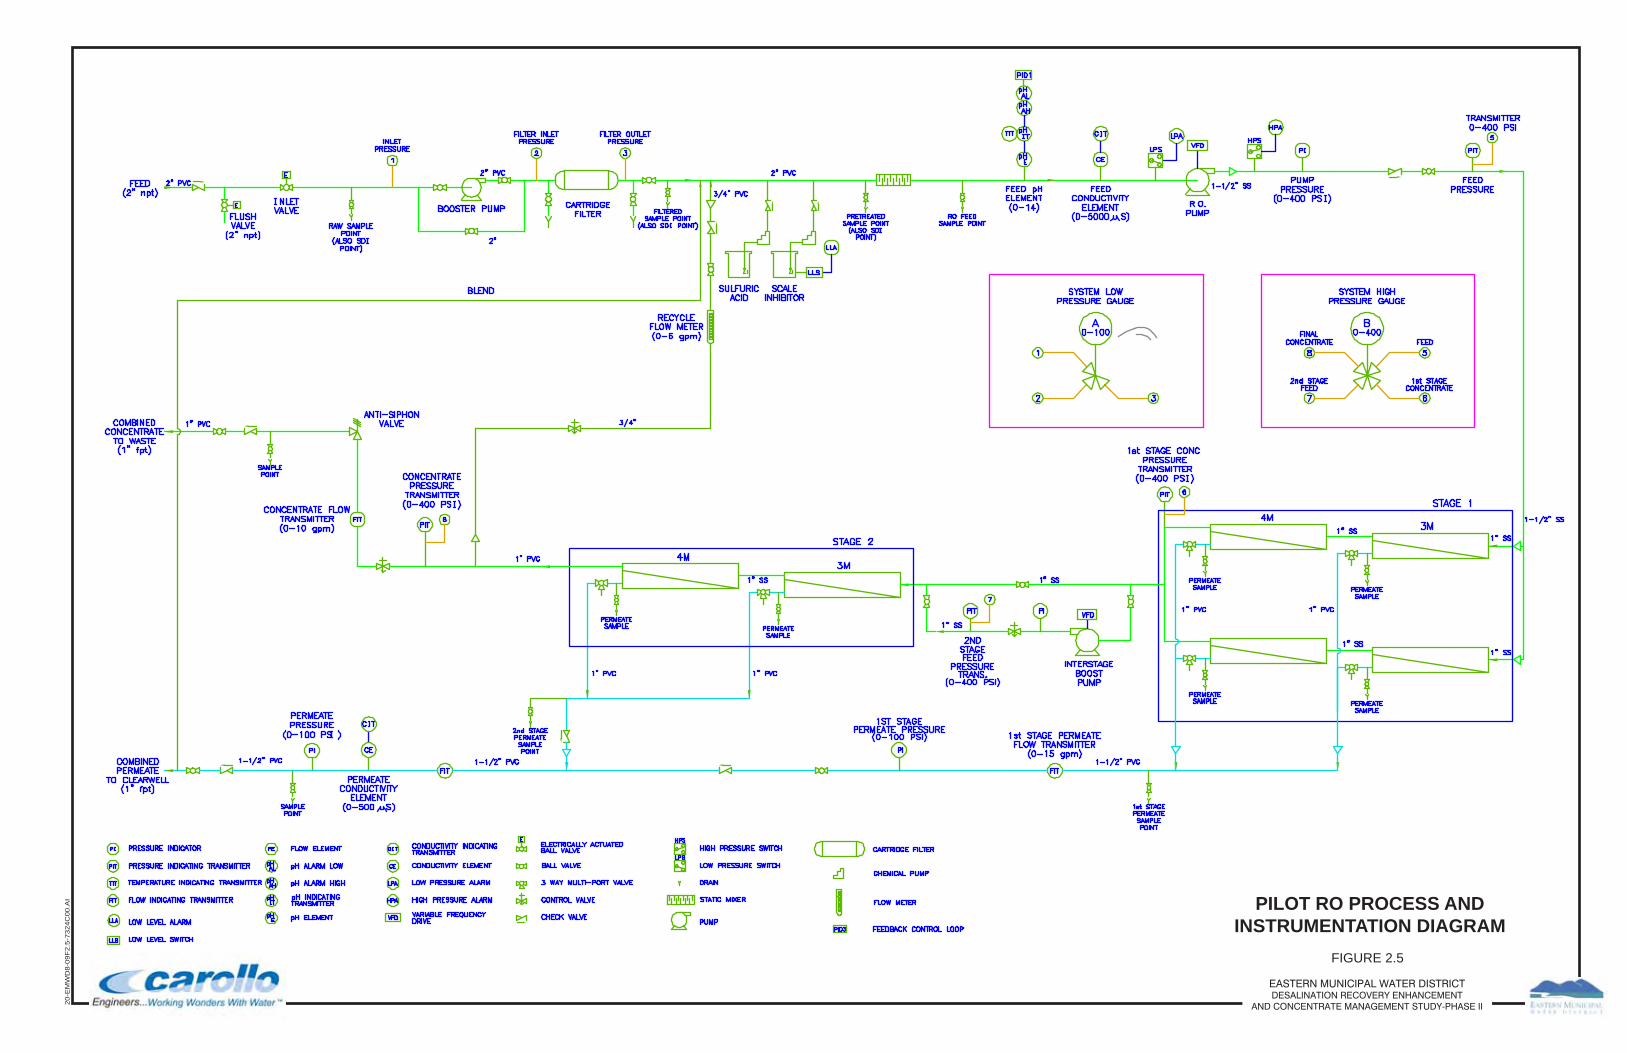
FIGURE 2.5
PILOT RO PROCESS ANDINSTRUMENTATION DIAGRAM
20-E
MW
D8-
09F
2.5-
7324
C00
.AI
EASTERN MUNICIPAL WATER DISTRICTDESALINATION RECOVERY ENHANCEMENT
AND CONCENTRATE MANAGEMENT STUDY-PHASE II

20-EMWD8-09F2.6-7324C00.AI
FIGURE 2.6
EASTERN MUNICIPAL WATER DISTRICTDESALINATION RECOVERY ENHANCEMENT
AND CONCENTRATE MANAGEMENT STUDY-PHASE II
PHOTOGRAPH OF PILOT RO SKID
2-12
System control was governed by a PLC, which initiated a pre-programmed sequence of valve movements and pump actions in response to the direction of the operator. Operator interaction was enabled through a touch screen with a process instrumentation flow diagram. This allowed the operator to control feed flow and pressures to each stage.
Targeted flows and pressures were set according to the manufacturer’s instructions during start-up testing. These setpoints were obtained from projected values from the membrane manufacturer’s analytical software. A manual concentrate valve on the second-stage discharge line allowed the operator to set the second-stage membranes backpressure and regulate concentrate flow. This allowed the control of the overall pilot plant recovery.
Data was automatically logged via a PLC on a daily basis at an interval of 10 minutes. Logged data included water flows, pressures, conductivities, and anti-scalant flows. In the event of loss of pump suction pressure, anti-scalant flow interruptions, or high discharge pressure, the PLC would automatically shut down the pilot unit. As a result, the RO pilot was operated as an independent unit and was not controlled from the general pilot plant control system.
From the RO feed tank, pretreated brine was pumped by the RO booster pump and then conveyed to the first-stage membranes by the high-pressure feed pump. Before contact with the RO membranes, the water underwent additional conditioning including pH adjustment (performed either at the skid or upstream of the RO feed tank), anti-scalant dosing, and filtration through a 5-μm cartridge filter. The fully conditioned water was pumped by the feed pump through the first-stage membranes, and the concentrate was fed to the second-stage membranes for further separation. The osmotic pressure of the first-stage concentrate was often very high and required an additional pressure boost to generate more permeate. An interstage pump was utilized for this purpose at the discretion of the pilot operator. Both feed and interstage pumps were vertical turbine pumps capable of pumping up to heads of 290 psi.
The following sections briefly discuss the RO pilot system in more detail.
2.5.1 Membrane Selection
Pilot RO membranes were selected based on chemical compatibility with the membranes in use in EMWD’s primary desalters. The membranes used by the Menifee Desalter are FILMTEC™ BW 3030 elements, which are manufactured by Dow Chemicals, Inc., and intended for use with brackish water. Elements are thin-film composite membranes with a polyamide active layer. Pilot membranes were Dow FILMTEC™ membranes made of the same material but were "extremely low energy" membranes. The 4-inch diameter XLE-4040 membranes are 40-inch long spirally wound membrane elements and were selected to fit the pressure vessels on the RO skid.
2.5.2 Anti-Scalant Dosing
The pilot system included an LMI anti-scalant pump for chemical dosing. The pump was rated for 0.42 gph at a maximum working pressure of 110 psig. Calibration of the RO anti-scalant pump was accomplished using an integral 100-mL graduated cylinder and redirecting the pump suction to the cylinder while timing the withdrawal rate.
2-13
The anti-scalant selected for this study was King Lee Y2K. The anti-scalant was purchased at 100-percent strength (specific gravity of 1.1) and diluted to 2.55 percent to deliver the recommended dose of 4.0 mg/L. Throughout the study, the pump speed was adjusted in response to changing feed water flow. The system was installed with a flow and level switches that shut down the RO pilot system and annunciated an alarm in the event of a loss of anti-scalant flow.
2.5.3 Acid Dosing
In addition to pH adjustment of softened water prior to filtration, pH adjustment could also be accomplished at the RO skid. An LMI chemical dosing pump was provided for this purpose. The acid dose was manually adjusted until the pH of the feed was in the range of 6.5 to 7.0.
2.5.4 Prefilter Cartridges
The RO pilot system was installed with cartridge filters to remove small particles carried over from the pretreatment step, which could lead to colloidal fouling of the RO membranes. The ultimate capacity of the cartridge system was 28 gpm. It was constructed of a stainless steel housing with seven 10-inch polypropylene cartridges with a 5-micron nominal pore size (Hytrex, GX05-10) rating.
Cartridge filters were not intended to reduce the turbidity of the influent stream. The membrane manufacturer recommended that the influent stream not exceed a turbidity of 1 NTU and a Silt Density Index (SDI) of 3.0. Pressure gauges were supplied upstream and downstream of the cartridge filters for regular inspection and logging by the plant operator. Cartridge filters were changed when the differential pressure increased to 10 psi.
2.5.5 RO Membrane Cleaning
As part of the pilot project, a cleaning skid was provided to allow for periodic membrane chemical cleaning. During operation, membrane performance metrics were monitored and logged. These included, feed flow, differential pressure, normalized permeate flow, and salt rejection. Cleaning was initiated when feed pressures, feed flows, or flux through each stage differed from start-up values by more than 10 percent. As recommended by the manufacturers, rinse cleaning was first conducted with a high pH (> 11.5) rinse followed by a low pH (< 2) solution. Two cleaning protocols were employed in Phase I testing: moderate and aggressive (Table 2.3). The particular protocol applied was based on the level and location of membrane fouling as suggested by interpretation of performance data. However, given the short duration of pilot testing, a chemical clean of the RO system was never implemented.
Table 2.3 Cleaning Protocols
Step Description
Moderate Cleaning Aggressive Cleaning
Feed (gpm) Duration
(hr) Feed (gpm) Duration (hr)
1 Low-flow pumping 5.0 0.5 10.0 0.5
2 Recycle 5.0 2.0 10.0 2.0
3 Soak 0 10-12 - -
2-14
Table 2.3 Cleaning Protocols
Step Description
Moderate Cleaning Aggressive Cleaning
Feed (gpm) Duration
(hr) Feed (gpm) Duration (hr)
4 High-flow pumping 10.0 1.0 10 10-12
5 Flushing 5 1.0 5 1.0
Chemicals used for low- and high-pH cleans were hydrochloric acid and caustic soda, respectively. These chemical solutions are heated by the CIP skid when used. Cleaning details are listed in Table 2.4.
Table 2.4 RO Pilot Chemical Cleaning – General Features
Backwash Feature Description
Low-pH Cleaning Used to dissolve membrane scales such as calcium carbonate, calcium phosphate, iron sulfide, metal silicates, and metallic oxides.
High-pH Cleaning Used to clean colloids, organic suspended matter, and biological microorganisms.
Maximum Vessels per Cleaning Two 4-inch vessels at 20 gpm in parallel
2.6 ELECTRODIALYSIS REVERSAL
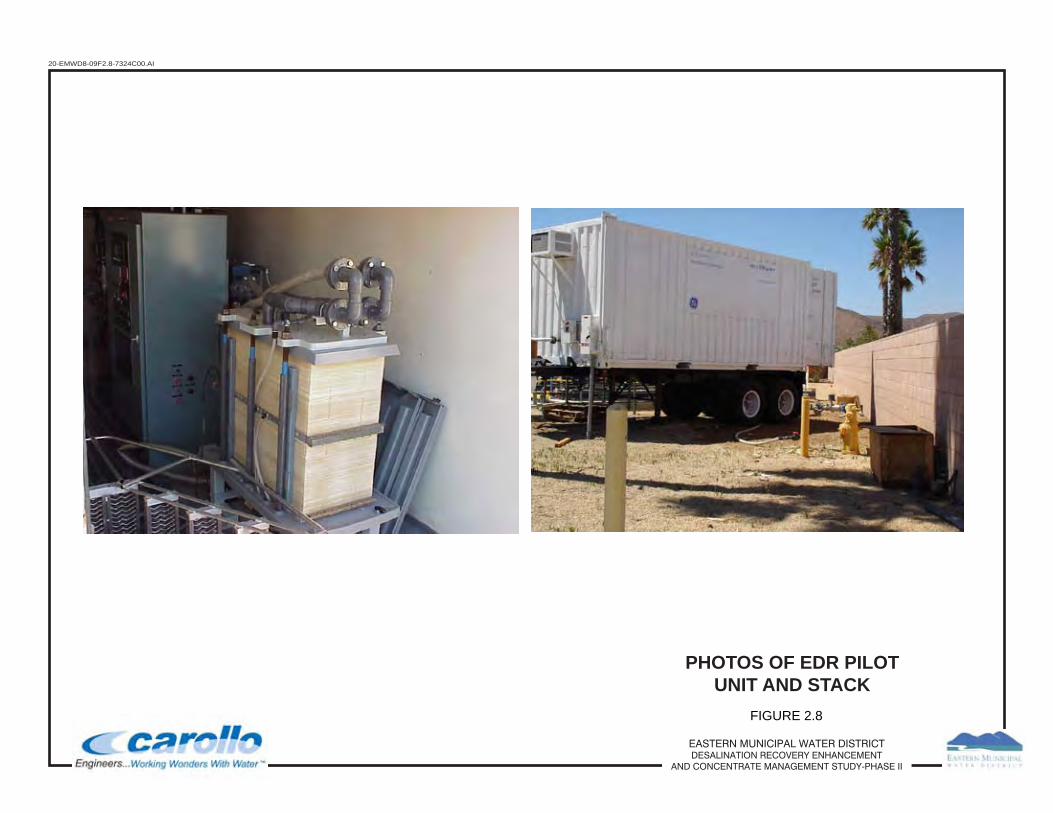
A mobile EDR piloting skid was leased from GE/Ionics for Phase I and II testing. The Aquamite V pilot was housed in a trailer cargo container with dimensions of 20 feet long by 8 feet wide by 12 feet tall and located just west of the concrete pad. Figures 2.7 and 2.8 show a P&ID and a photograph of the unit, respectively. The unit utilized a single EDR membrane stack with two electrical and four hydraulic stages. Essentially, an electrical stage is composed of one cathode and one anode separated by a series of cationic and anionic membranes and spacers. Electrodes were made of platinized titanium with a rare earth paint layer. Both cation and anion-transfer membranes were acrylic backed.
An electrical potential was applied across opposing electrodes, and positively charged (cations) and negatively charged ions (anions) are attracted towards the cathodes and anodes, respectively. Anionic membranes allow negatively charged ions (anions) to pass through them, but repel positively charged ions, while the cationic membranes allow the passage of cations and reject anions. The ions pass through the membranes as the water flows tangential to the membrane surfaces. As the ions flow towards their respective electrodes, alternating fresh water and brine compartments are created and removed from the stack by EDR manifolds.
Membranes are separated by spacers to separate brine and product-water streams. Each electrical stage also has two corresponding hydraulic stages. All the feed water to the EDR passes through each electrical stage twice to provide greater residence time for ion transfer. Water developed within the concentrate cell pairs is circulated back to the concentrate system in a concentrate

FIGURE 2.7
PILOT EDR PROCESS ANDINSTRUMENTATION DIAGRAM
20-E
MW
D8-
09F
2.7-
7324
C00
.AI
EASTERN MUNICIPAL WATER DISTRICTDESALINATION RECOVERY ENHANCEMENT
AND CONCENTRATE MANAGEMENT STUDY-PHASE II
20-EMWD8-09F2.8-7324C00.AI
FIGURE 2.8
EASTERN MUNICIPAL WATER DISTRICTDESALINATION RECOVERY ENHANCEMENT
AND CONCENTRATE MANAGEMENT STUDY-PHASE II
PHOTOS OF EDR PILOTUNIT AND STACK
2-17
loop. A small booster pump is used to circulate the concentrate loop through the stack until the salts become supersaturated and a portion of the loop must be removed, which creates a reject stream. This process of brine removal is referred to as brine “blowdown” and the dilution and replenishment of the brine loop is referred to as “brine makeup.” Hydrochloric acid was continuously fed to the circulating brine stream and the anode finish water to prevent calcium carbonate scaling.
The EDR cathode and anode operation were programmed to alternate every 15 minutes by reversing the polarity, or direction, of current flow. This aided in preserving the integrity of the membranes by preventing scale buildup. During charge reversal, which was approximately 30 to 45 seconds in duration, water was not to specification and was diverted to waste.
An EDR pump conveyed pretreated water from the RO feed tank to the Aquamite V pilot trailer. A built-in booster pump then provided sufficient pressure to pass the water through 10-µm cartridge filters and the membrane stack.
Specific details of the GE/Ionics pilot EDR are shown in Table 2.5.
Table 2.5 GE/Ionics Pilot EDR Details
Number Feature Description
1 18,000-gpd to 20,000-gpd production capacity with a water recovery of 75% to 80%.
2 EDR membrane stack composed of two electrical stages with two hydraulic stages per electrical stage.
3 Voltage regulator for simulating a two-stage, three-stage, or four-stage EDR unit.
4 Feed water pump, EDR membrane stack, and chemical feed systems.
5 Rectifier for pilot control and operation. The EDR pilot operated independently of the overall pilot process control panel.
EDR technology has been in use for over 20 years, primarily on low total dissolved solids (TDS) water, such as that found in groundwater wells. Its application in recovering water from the high-TDS RO reject for use as the feed water, as used in this study is a fairly new application.
2.6.1 Pilot Plant System Control
As part of the Phase II project, enhanced system controls were put in place to ensure the shut down of pilot plant components in order to provide greater site safety and to preserve chemicals. This system utilized basic power relays to shut off power to pumps in the case of an operational error or pump malfunction. The packaged systems, which included the CONTRAFAST®, multi-media filter, lime-dosing system, RO, and EDR skids, operated outside this control system. The CONTRAFAST® and filters were not shut down, as their continued operation had no effect on the overall pilot system and would not result in the damage of any machinery or result in wasteful chemical use. In addition, it was desirable to keep the CONTRAFAST® system operating to preserve the sludge blanket and chemical conditions. The RO and EDR PLCs

2-18
automatically shut down when flow to the units was terminated. Table 2.6 summarizes the critical conditions and the effect of the failure on the pilot system.
Table 2.6 Pilot System General Control Conditions Failure Event Primary Action Secondary Action
Brine Feed Pump Failure
Shutdown of all process and chemical pumps Shutdown of RO and EDR units.
Filter Feed Pump Failure
RO Feed Tank Level Switch Trip
Shutdown of all process and chemical pumps followed by automatic shutdown of RO and EDR units.
EDR Feed Pump Failure EDR System Shutdown Pilot system remains in
operation.
Lime Slurry Line Break/Pump Failure pH Setpoint Trip
Shutdown of all process and chemical pumps followed by automatic shutdown of RO and EDR units.
Soda Ash Pump Line Break/Pump Failure pH Setpoint Trip
Shutdown of all process and chemical pumps followed by automatic shutdown of RO and EDR units.
Sump Pump High-High Level Alarm Condition
Shutdown of all process and chemical pumps followed by automatic shutdown of RO and EDR units.
Sulfuric Acid Containment Leak Alarm Annunciation Pilot system remains in
operation
2.7 PILOT SAMPLING AND MONITORING
The following sections detail the collection of data sampling, water quality, and monitoring throughout the pilot process.
2.7.1 Manual Data Collection
Operational and performance data for the RO and EDR processes were manually recorded on daily log sheets and the data entered into software for normalization and analysis of system performance. Sample log sheets for each system can be seen in Appendix A.
Operational parameters included:
1. RO: Pressure readings, cartridge filter inlet and outlet pressures, and feed pump VFD speed.
2. EDR: Voltages, current drawn, feed pressures, differential pressures across the stacks, and electrode flows.

2-19
Performance data included: 1. RO: Flow readings, recovery, feed, and product conductivities.
2. EDR: Flow readings, recovery, feed, and product conductivities.
2.7.2 Automatic Data Collection
The RO system was equipped with automatic data collection capabilities, and the following parameters were monitored and collected:
1. Date and Time.
2. Feed Temperature.
3. Feed pH.
4. Conductivities: Feed and permeate.
5. Pressures: Feed, Stage 1 Concentrate, Stage 2 Feed, Final Concentrate, Stage 1 Permeate, and Stage 2 Permeate.
6. Flows: Concentrate, Stage 1 Permeate, and Total Permeate.
In addition, the following system performance parameters were calculated and logged:
1. Rejection.
2. Recovery.
3. Flows: Feed and Stage 2 Permeate. The system was not equipped with flow-detection devices on these lines. These flows were calculated by using the flows from the concentrate, Stage 1 permeate, and combined permeate streams.
Data logging frequency was determined by a built-in code. The system was initially set to log one data set per day. To allow time for stabilization of RO performance, the unit was set to collect data after the first hour of continuous operation. The data-logging frequency was later changed to twice in every 24 hours of operation to provide more data.
2.7.3 Field Testing
Table 2.7 outlines the daily water quality testing analysis. Grab samples were collected and analysis conducted in an on-site laboratory. On-site testing was used to establish daily dosing and other operational conditions. The following equipment was used to perform field analysis:
1. HACH sensION portable pH meter equipped with a Beckman Model 511052 pH Probe.
2. HACH sensION5 conductivity meter with HACH Model 51975-03 Conductivity Probe for Conductivity and Temperature.
3. HACH 2100N Laboratory Turbidimeter.
4. Millipore 0.45-µm Nitrocellulose Membranes for SDI measurement. The most common measure of feed-water quality for RO systems is SDI15. It is a dimensionless indicator of RO feed water particulate fouling potential and is determined by the time difference required to filter 500 mL of feedwater through a 0.45-µm filter pad at 30 psi. Colloidal and suspended material clogs the filter pad, resulting in increased SDI values. SDI15

2-20
values that exceed 3 are considered problematic for RO membranes because the solids could clog membrane element surfaces and feed channels.
5. DigiSDI, Taka Inc. for SDI.
6. HACH DR/890 Colorimeter for Silica, Total Iron, Ferrous Iron.
7. 25-mL Burette for Calcium quantification.
8. Alkalinity and hardness were determined by the use of HACH pillow packs and reagents.
Table 2.7 Field-Water Quality Analysis Matrix
Parameter(4) Raw Brine Clarifier
Baker Exit Filtrate
RO Feed Tank
pH (S.U.) Alkalinity (mg/L as CaCO3) Hardness (mg/L as CaCO3) Calcium (mg/L as CaCO3) Magnesium(1) (mg/L as CaCO3) Silica (mg/L as SiO2) Total Iron(2) (µg/L) Ferrous Iron (µg/L) Conductivity (µS/cm) Turbidity (NTU) Silt Density Index (SDI)(3) Notes(1) Magnesium was detected by subtracting calcium determined by the burette method
from total hardness.
:
(2) Iron testing was discontinued after the first few weeks of operation because the reading from the HACH colorimeter was unreliable. Weekly external analysis conducted by EMWD’s main laboratory confirmed that iron values were sufficiently low for this test to be ignored.
(3) SDI tests were conducted on RO cartridge filter permeate at the RO skid. Frequency of testing was determined by availability of the DigiSDI kit.
(4) The tests were intended as a tool to monitor pretreatment performance and guide chemical dosing. Time constrains made it impractical to conduct all of them on a daily basis. Only alkalinity, hardness, and silica testing were done on a regular basis.
2.7.4 Laboratory Analysis
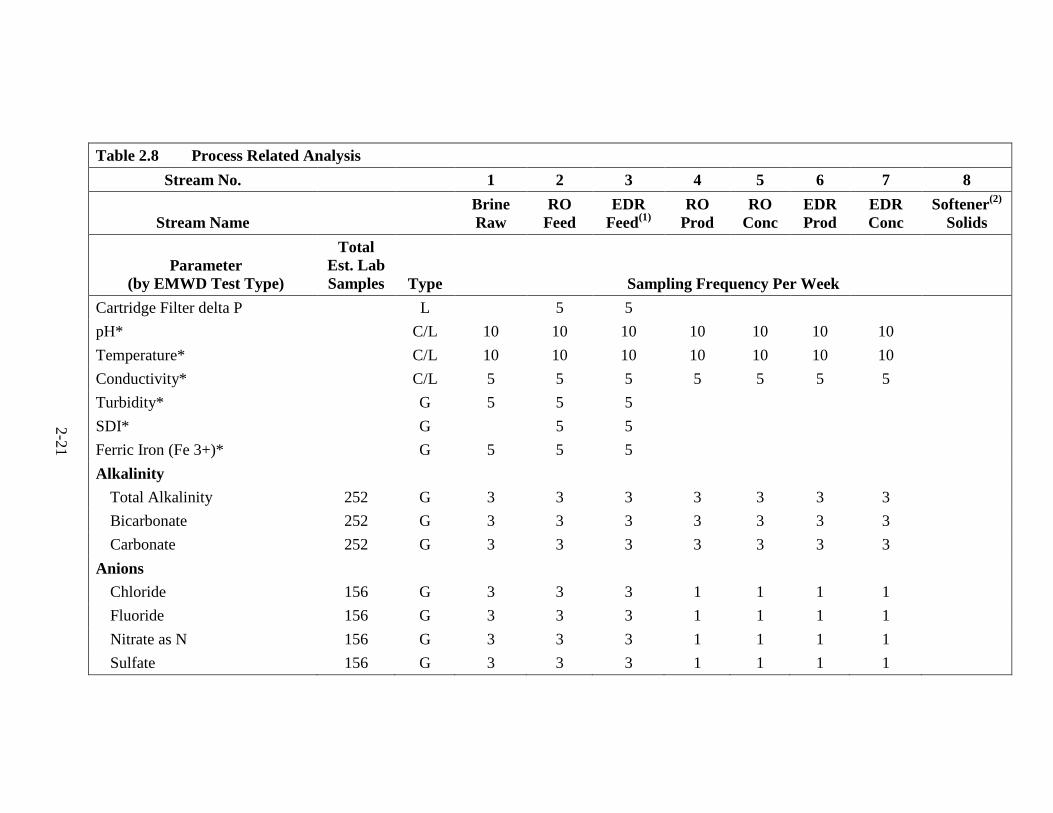
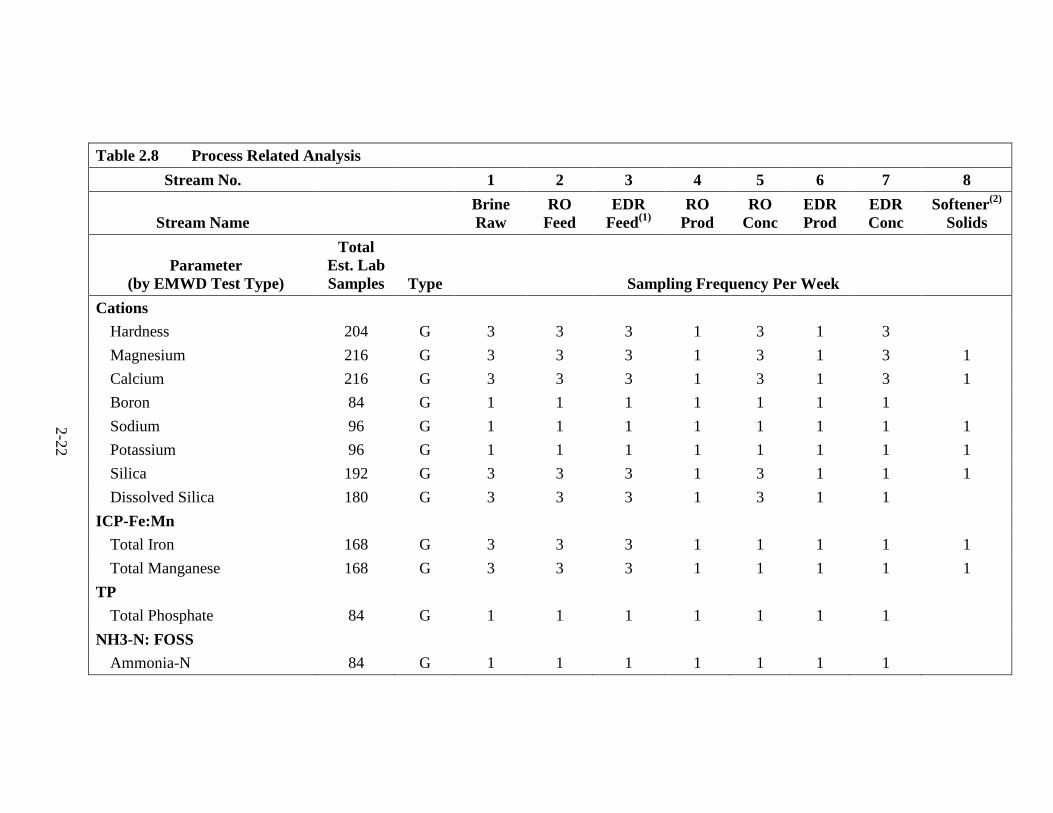
The pilot study included an extensive analytical program. Table 2.8 outlines the parameters and frequency of analysis conducted by the EMWD main laboratory. Grab samples were collected in half-gallon bottles by the Carollo operator and delivered to the laboratory for analysis. Samples were collected three times per week. As shown in Table 2.8, some parameters were tested more frequently by the Carollo operator.
2-21
Table 2.8 Process Related Analysis Stream No. 1 2 3 4 5 6 7 8
Stream Name Brine Raw
RO Feed
EDR Feed(1)
RO Prod
RO Conc
EDR Prod
EDR Conc
Softener(2) Solids
Parameter (by EMWD Test Type)
Total Est. Lab Samples Type Sampling Frequency Per Week
Cartridge Filter delta P L 5 5 pH* C/L 10 10 10 10 10 10 10 Temperature* C/L 10 10 10 10 10 10 10 Conductivity* C/L 5 5 5 5 5 5 5 Turbidity* G 5 5 5 SDI* G 5 5 Ferric Iron (Fe 3+)* G 5 5 5 Alkalinity
Total Alkalinity 252 G 3 3 3 3 3 3 3 Bicarbonate 252 G 3 3 3 3 3 3 3 Carbonate 252 G 3 3 3 3 3 3 3
Anions Chloride 156 G 3 3 3 1 1 1 1 Fluoride 156 G 3 3 3 1 1 1 1 Nitrate as N 156 G 3 3 3 1 1 1 1 Sulfate 156 G 3 3 3 1 1 1 1
2-22
Table 2.8 Process Related Analysis Stream No. 1 2 3 4 5 6 7 8
Stream Name Brine Raw
RO Feed
EDR Feed(1)
RO Prod
RO Conc
EDR Prod
EDR Conc
Softener(2) Solids
Parameter (by EMWD Test Type)
Total Est. Lab Samples Type Sampling Frequency Per Week
Cations Hardness 204 G 3 3 3 1 3 1 3 Magnesium 216 G 3 3 3 1 3 1 3 1 Calcium 216 G 3 3 3 1 3 1 3 1 Boron 84 G 1 1 1 1 1 1 1 Sodium 96 G 1 1 1 1 1 1 1 1 Potassium 96 G 1 1 1 1 1 1 1 1 Silica 192 G 3 3 3 1 3 1 1 1 Dissolved Silica 180 G 3 3 3 1 3 1 1
ICP-Fe:Mn Total Iron 168 G 3 3 3 1 1 1 1 1 Total Manganese 168 G 3 3 3 1 1 1 1 1
TP Total Phosphate 84 G 1 1 1 1 1 1 1
NH3-N: FOSS Ammonia-N 84 G 1 1 1 1 1 1 1

2-23
Table 2.8 Process Related Analysis Stream No. 1 2 3 4 5 6 7 8
Stream Name Brine Raw
RO Feed
EDR Feed(1)
RO Prod
RO Conc
EDR Prod
EDR Conc
Softener(2) Solids
Parameter (by EMWD Test Type)
Total Est. Lab Samples Type Sampling Frequency Per Week
ICP-MS Scan Arsenic 72 G 1 1 1 1 1 1 Aluminum 72 G 1 1 1 1 1 1 Barium 72 G 1 1 1 1 1 1 Selenium 72 G 1 1 1 1 1 1 Strontium 72 G 1 1 1 1 1 1
Lumped Total Dissolved Solids (TDS) 252 G 3 3 3 3 3 3 3 Total Organic Carbon (TOC) 84 G 1 1 1 1 1 1 1 Total Suspended Solids (TSS) 84 G 1 1 1 1 1 1 1
Radioactivity Radon 18 G 0.25 0.25 0.25 0.25 0.25 Gross Alpha 18 G 0.25 0.25 0.25 0.25 0.25
(1) In most cases, EDR influent will be the same as the RO influent stream (i.e., 100-percent softening).
Notes:
(2) Analysis for softener solids will be on a percent dry weight basis.
LegendC/L = Continuous data logging or logged by pilot plant operator.
:
Sample Type: G = grab. * Assumed to be measured on-site.
2-24
2.8 INTERPRETATION OF PERFORMANCE DATA
2.8.1 RO Data Normalization
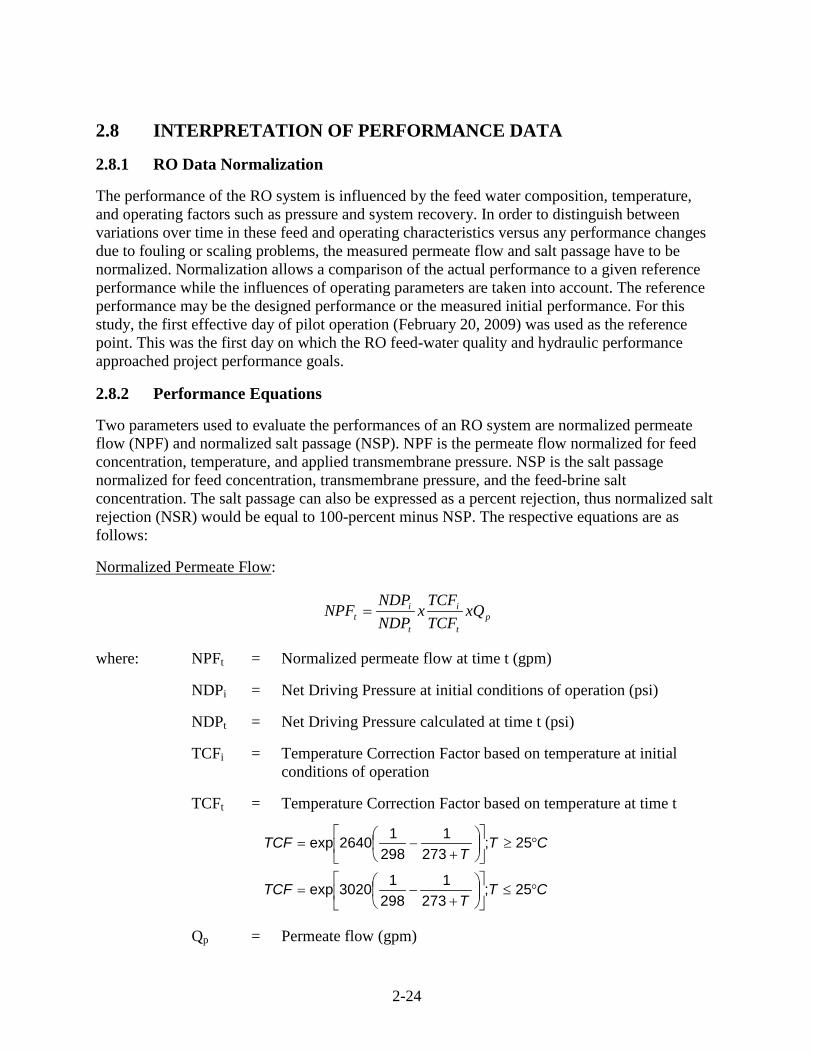
The performance of the RO system is influenced by the feed water composition, temperature, and operating factors such as pressure and system recovery. In order to distinguish between variations over time in these feed and operating characteristics versus any performance changes due to fouling or scaling problems, the measured permeate flow and salt passage have to be normalized. Normalization allows a comparison of the actual performance to a given reference performance while the influences of operating parameters are taken into account. The reference performance may be the designed performance or the measured initial performance. For this study, the first effective day of pilot operation (February 20, 2009) was used as the reference point. This was the first day on which the RO feed-water quality and hydraulic performance approached project performance goals.
2.8.2 Performance Equations
Two parameters used to evaluate the performances of an RO system are normalized permeate flow (NPF) and normalized salt passage (NSP). NPF is the permeate flow normalized for feed concentration, temperature, and applied transmembrane pressure. NSP is the salt passage normalized for feed concentration, transmembrane pressure, and the feed-brine salt concentration. The salt passage can also be expressed as a percent rejection, thus normalized salt rejection (NSR) would be equal to 100-percent minus NSP. The respective equations are as follows:
Normalized Permeate Flow
pt
i
t
it xQ
TCFTCF
xNDPNDP
NPF =
:
where: NPFt = Normalized permeate flow at time t (gpm)
NDPi = Net Driving Pressure at initial conditions of operation (psi)
NDPt = Net Driving Pressure calculated at time t (psi)
TCFi = Temperature Correction Factor based on temperature at initial conditions of operation
TCFt = Temperature Correction Factor based on temperature at time t
CTT
TCF
CTT
TCF
°≤
+−=
°≥
+−=
25;273
1298
13020exp
25;273
1298
12640exp
Qp = Permeate flow (gpm)

2-25
Normalized Salt Passage
xSPCC
xCC
xNDPNDP
NSPfi
ft
fbt
fbi
i
tt =
:
where: NSPt = Normalized salt passage at time t (%)
NDPi = Net Driving Pressure at initial conditions of operation (psi)
NDPt = Net Driving Pressure calculated at time t (psi)
Cfb i = Feed-brine salt concentration at initial conditions of operation (mg/L) (defined below)
Cfb t = Feed-brine salt concentration at time t (mg/L) (defined below)
Cfi = Feed salt concentration at initial conditions of operation (mg/L)
Cft = Feed salt concentration at time t (mg/L)
SP = Salt passage - the amount of salt that passes through the membrane into the permeate stream, expressed as a percentage (%)
Feed-Brine Salt Concentration
−
=
b
f
f
b
fb
CCCC
C1
ln
:
where: Cfb = Feed-brine salt concentration
Cb = Brine (concentrate) salt concentration (mg/L)
Cf = Feed salt concentration (mg/L)
Normalized Salt Rejection
NSR = 100% - NSP
:
where: NSR = Normalized Salt Rejection (%)
NSP = Normalized Salt Passage (%)
Data obtained from daily manual data recording were used to calculate the normalized parameters mentioned above. Automatically logged data could not be used for normalization and subsequent interpretation of RO performance.
2-26
2.8.3 Normalization of EDR Data
EDR data was sparse and was not normalized because there is no established normalization procedure. EDR analysis is usually conducted on hydraulic and electrical performance data. Hydraulic performance data is used to determine salt rejection, production, and recovery. Electrical data collected is used to determine the energy demand of the system at different recoveries and to generate a profile of the resistance of each stage. Resistance was calculated as the ratio of applied voltage to current.
3-1
Chapter 3
RESULTS AND DISCUSSION
3.1 INTRODUCTION
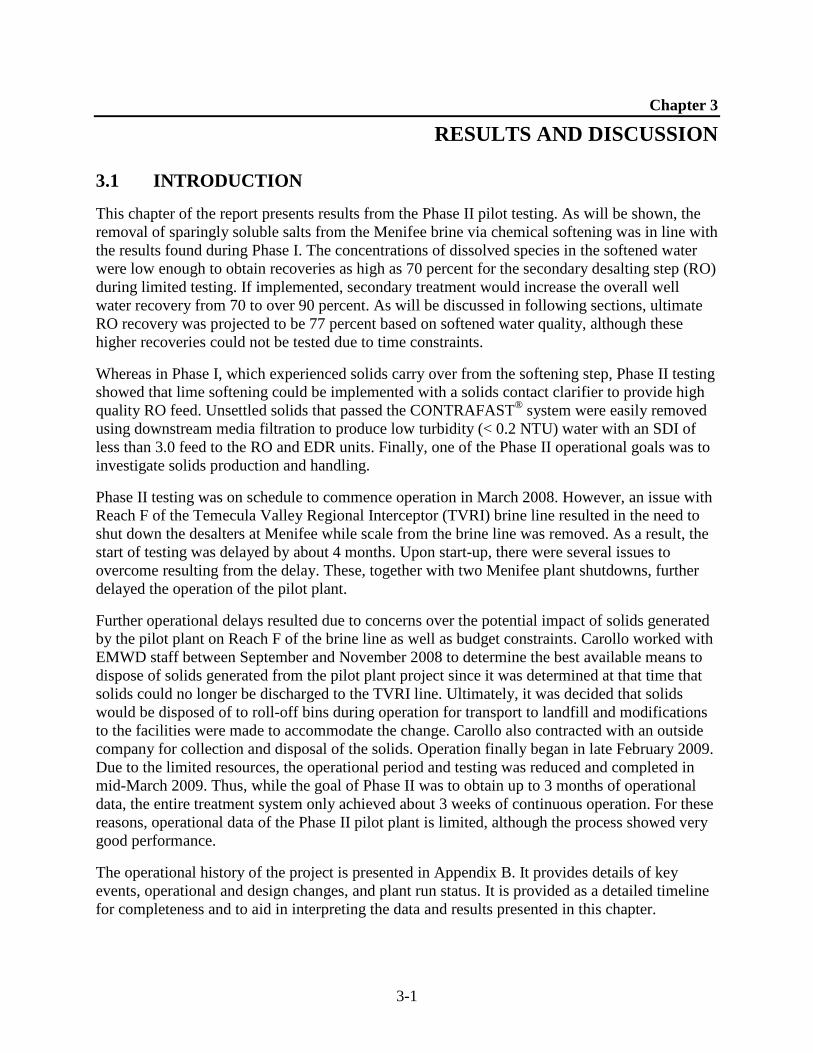
This chapter of the report presents results from the Phase II pilot testing. As will be shown, the removal of sparingly soluble salts from the Menifee brine via chemical softening was in line with the results found during Phase I. The concentrations of dissolved species in the softened water were low enough to obtain recoveries as high as 70 percent for the secondary desalting step (RO) during limited testing. If implemented, secondary treatment would increase the overall well water recovery from 70 to over 90 percent. As will be discussed in following sections, ultimate RO recovery was projected to be 77 percent based on softened water quality, although these higher recoveries could not be tested due to time constraints.
Whereas in Phase I, which experienced solids carry over from the softening step, Phase II testing showed that lime softening could be implemented with a solids contact clarifier to provide high quality RO feed. Unsettled solids that passed the CONTRAFAST® system were easily removed using downstream media filtration to produce low turbidity (< 0.2 NTU) water with an SDI of less than 3.0 feed to the RO and EDR units. Finally, one of the Phase II operational goals was to investigate solids production and handling.
Phase II testing was on schedule to commence operation in March 2008. However, an issue with Reach F of the Temecula Valley Regional Interceptor (TVRI) brine line resulted in the need to shut down the desalters at Menifee while scale from the brine line was removed. As a result, the start of testing was delayed by about 4 months. Upon start-up, there were several issues to overcome resulting from the delay. These, together with two Menifee plant shutdowns, further delayed the operation of the pilot plant.
Further operational delays resulted due to concerns over the potential impact of solids generated by the pilot plant on Reach F of the brine line as well as budget constraints. Carollo worked with EMWD staff between September and November 2008 to determine the best available means to dispose of solids generated from the pilot plant project since it was determined at that time that solids could no longer be discharged to the TVRI line. Ultimately, it was decided that solids would be disposed of to roll-off bins during operation for transport to landfill and modifications to the facilities were made to accommodate the change. Carollo also contracted with an outside company for collection and disposal of the solids. Operation finally began in late February 2009. Due to the limited resources, the operational period and testing was reduced and completed in mid-March 2009. Thus, while the goal of Phase II was to obtain up to 3 months of operational data, the entire treatment system only achieved about 3 weeks of continuous operation. For these reasons, operational data of the Phase II pilot plant is limited, although the process showed very good performance.
The operational history of the project is presented in Appendix B. It provides details of key events, operational and design changes, and plant run status. It is provided as a detailed timeline for completeness and to aid in interpreting the data and results presented in this chapter.

3-2
The feed water requirements for the RO and EDR pilot units were at least 36 gpm. Although the softening unit was sized for a feed flow rate of 80 to 160 gpm, the unit was operated at various flow rates (50, 80, and 100 gpm). The majority of operation was at 50 gpm to conserve expensive chemicals. In general, softening using the CONTRAFAST® unit was relatively straightforward and the most challenging aspect of pilot testing turned out to be the use of high concentration (15-percent) soda ash, which has a high freezing point.
3.2 RAW WATER SUPPLY
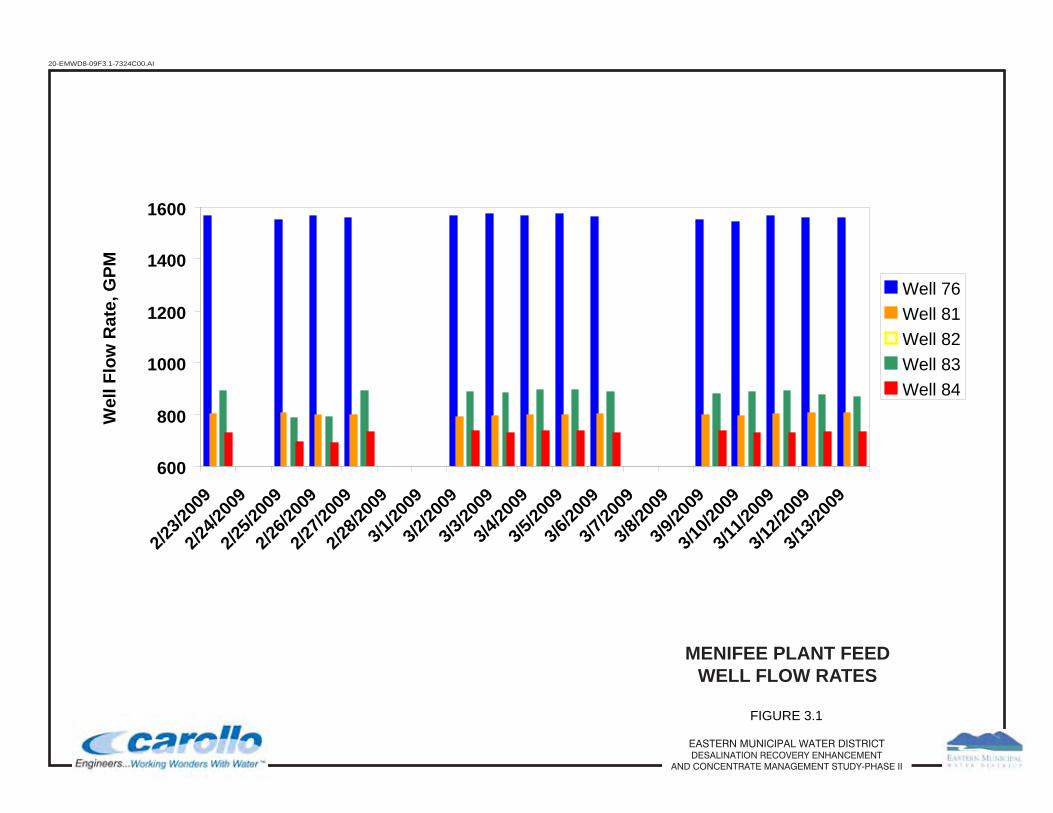
Figure 3.1 summarizes the well use history of the Menifee plant for the 3 weeks of pilot operation, which spanned from February 23, 2009 to March 13, 2009. The most frequently pumped wells were Wells 76 and 81 through 84, of which the majority of flow came from Well No. 76.
3.2.1 Raw Water Quality
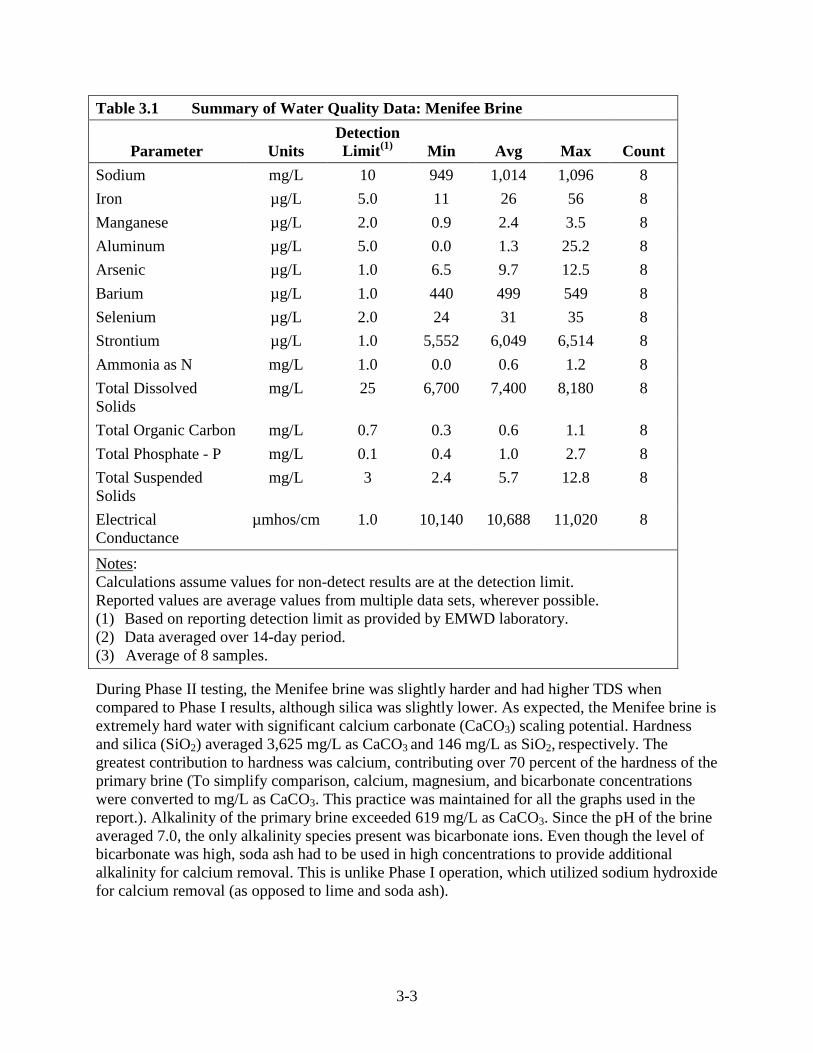
The raw water source for the pilot plant was Menifee Desalter brine. Grab samples of this water stream were collected at frequent intervals and used to characterize the quality of the raw brine. Table 3.1 summarizes the minimum, average, and maximum values for individual raw water parameters that were measured throughout the study period. This table includes EMWD’s Reporting Detection Limit for comparison.
Table 3.1 Summary of Water Quality Data: Menifee Brine
Parameter Units Detection Limit(1) Min Avg Max Count
pH pH units - 7.1 7.1 7.2 8 Bicarbonate mg/L 3 552 755 802 8 Total Alkalinity mg/L as
CaCO3 3 552 619 658 8
Chloride mg/L 1.0 2,722 2,863 3,109 8 Fluoride mg/L 0.10 0.3 0.7 2.1 8 Nitrate – N mg/L 0.1 17.9 19.4 22.1 8 Sulfate mg/L 1.0 479 538 592 8 Boron mg/L 0.01 0.36 0.48 0.58 8 Calcium mg/L 1.0 1,005 1,041 1,079 8 Hardness(2) mg/L as
CaCO3 3,506 3,625 3,744 8
Magnesium mg/L 1.0 241 249 259 8 Potassium mg/L 0.1 24.9 30.1 36.7 8 Silica mg/L as
SiO2 1.0 130 146 162 8
Reactive Silica mg/L as SiO2
1.0 130 139 151 8
3-3
Table 3.1 Summary of Water Quality Data: Menifee Brine
Parameter Units Detection Limit(1) Min Avg Max Count
Sodium mg/L 10 949 1,014 1,096 8 Iron µg/L 5.0 11 26 56 8 Manganese µg/L 2.0 0.9 2.4 3.5 8 Aluminum µg/L 5.0 0.0 1.3 25.2 8 Arsenic µg/L 1.0 6.5 9.7 12.5 8 Barium µg/L 1.0 440 499 549 8 Selenium µg/L 2.0 24 31 35 8 Strontium µg/L 1.0 5,552 6,049 6,514 8 Ammonia as N mg/L 1.0 0.0 0.6 1.2 8 Total Dissolved Solids
mg/L 25 6,700 7,400 8,180 8
Total Organic Carbon mg/L 0.7 0.3 0.6 1.1 8 Total Phosphate - P mg/L 0.1 0.4 1.0 2.7 8 Total Suspended Solids
mg/L 3 2.4 5.7 12.8 8
Electrical Conductance
µmhos/cm 1.0 10,140 10,688 11,020 8
NotesCalculations assume values for non-detect results are at the detection limit.
:
Reported values are average values from multiple data sets, wherever possible. (1) Based on reporting detection limit as provided by EMWD laboratory. (2) Data averaged over 14-day period. (3) Average of 8 samples.
During Phase II testing, the Menifee brine was slightly harder and had higher TDS when compared to Phase I results, although silica was slightly lower. As expected, the Menifee brine is extremely hard water with significant calcium carbonate (CaCO3) scaling potential. Hardness and silica (SiO2) averaged 3,625 mg/L as CaCO3 and 146 mg/L as SiO2, respectively. The greatest contribution to hardness was calcium, contributing over 70 percent of the hardness of the primary brine (To simplify comparison, calcium, magnesium, and bicarbonate concentrations were converted to mg/L as CaCO3. This practice was maintained for all the graphs used in the report.). Alkalinity of the primary brine exceeded 619 mg/L as CaCO3. Since the pH of the brine averaged 7.0, the only alkalinity species present was bicarbonate ions. Even though the level of bicarbonate was high, soda ash had to be used in high concentrations to provide additional alkalinity for calcium removal. This is unlike Phase I operation, which utilized sodium hydroxide for calcium removal (as opposed to lime and soda ash).
20-EMWD8-09F3.1-7324C00.AI
MENIFEE PLANT FEEDWELL FLOW RATES
FIGURE 3.1
EASTERN MUNICIPAL WATER DISTRICTDESALINATION RECOVERY ENHANCEMENT
AND CONCENTRATE MANAGEMENT STUDY-PHASE II
600
800
1000
1200
1400
1600
2/23/2
009
2/24/2
009
2/25/2
009
2/26/2
009
2/27/2
009
2/28/2
009
3/1/20
09
3/2/20
09
3/3/20
09
3/4/20
09
3/5/20
09
3/6/20
09
3/7/20
09
3/8/20
09
3/9/20
09
3/10/2
009
3/11/2
009
3/12/2
009
3/13/2
009
Wel
l Flo
w R
ate,
GPM
Well 76Well 81Well 82Well 83Well 84
3-5
Other constituents such as iron, manganese, and heavy metals were present in sufficiently low quantities that they were not expected to pose a threat to the RO membranes, even at the desired 75-percent recovery. As anticipated, the TDS of the raw concentrate ranged from 6,700 to 8,180 depending upon the blend of groundwater wells in operation and respective well flow rates (see Figure 3.1).
3.3 BRINE PRETREATMENT Pretreatment was conducted in two phases: a short optimization phase followed by a longer operational phase. The goal of the optimization phase was to establish optimal dosing and chemical selection for reducing the scaling potential of the Menifee brine. The target components for removal were calcium and silica. Initial chemical doses utilized during the optimization phase were based on results of bench-top testing of a brine sample using lime and soda ash.
3.3.1 Chemical Softening
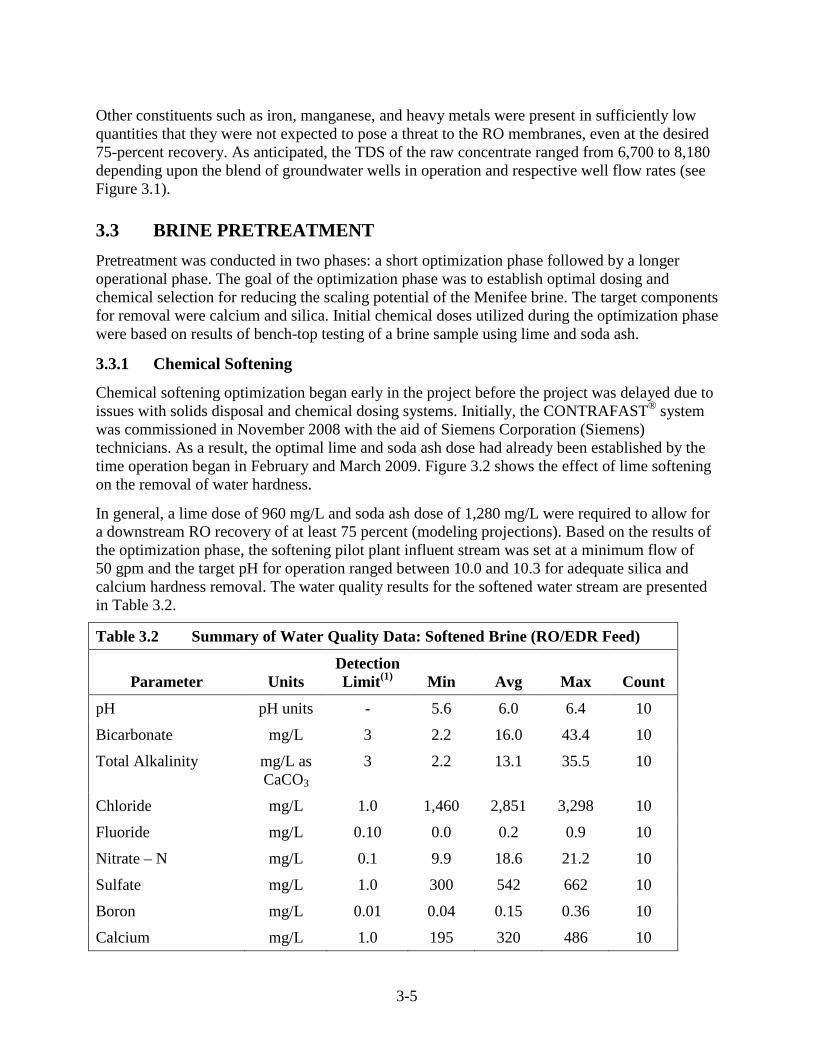
Chemical softening optimization began early in the project before the project was delayed due to issues with solids disposal and chemical dosing systems. Initially, the CONTRAFAST® system was commissioned in November 2008 with the aid of Siemens Corporation (Siemens) technicians. As a result, the optimal lime and soda ash dose had already been established by the time operation began in February and March 2009. Figure 3.2 shows the effect of lime softening on the removal of water hardness.
In general, a lime dose of 960 mg/L and soda ash dose of 1,280 mg/L were required to allow for a downstream RO recovery of at least 75 percent (modeling projections). Based on the results of the optimization phase, the softening pilot plant influent stream was set at a minimum flow of 50 gpm and the target pH for operation ranged between 10.0 and 10.3 for adequate silica and calcium hardness removal. The water quality results for the softened water stream are presented in Table 3.2.
Table 3.2 Summary of Water Quality Data: Softened Brine (RO/EDR Feed)
Parameter Units Detection Limit(1) Min Avg Max Count
pH pH units - 5.6 6.0 6.4 10
Bicarbonate mg/L 3 2.2 16.0 43.4 10
Total Alkalinity mg/L as CaCO3
3 2.2 13.1 35.5 10
Chloride mg/L 1.0 1,460 2,851 3,298 10
Fluoride mg/L 0.10 0.0 0.2 0.9 10
Nitrate – N mg/L 0.1 9.9 18.6 21.2 10
Sulfate mg/L 1.0 300 542 662 10
Boron mg/L 0.01 0.04 0.15 0.36 10
Calcium mg/L 1.0 195 320 486 10

3-6
Table 3.2 Summary of Water Quality Data: Softened Brine (RO/EDR Feed)
Parameter Units Detection Limit(1) Min Avg Max Count
Hardness(2) mg/L as CaCO3
1,112 1,437 1,892 10
Magnesium mg/L 1.0 128 155 192 10
Potassium mg/L 0.1 23 28 33 10
Silica mg/L as SiO2
1.0 35 54 85 10
Reactive Silica mg/L as SiO2
1.0 35 55 87 10
Sodium mg/L 10 1,387 1,611 1,823 10
Iron µg/L 5.0 3.7 36.8 120.8 10
Manganese µg/L 2.0 0.0 0.8 14.4 10
Aluminum µg/L 5.0 0.0 15.9 118.9 10
Arsenic µg/L 1.0 3.9 8.2 15.3 10
Barium µg/L 1.0 55.9 85.7 135.9 10
Selenium µg/L 2.0 12.0 27.3 37.7 10
Strontium µg/L 1.0 1,692 2,544 3,534 10
Ammonia as N mg/L 1.0 0.0 0.5 1.4 10
Total Dissolved Solids
mg/L 25 5,460 6,136 6,580 10
Total Organic Carbon mg/L 0.7 0.2 0.4 0.9 10
Total Phosphate - P mg/L 0.1 0.0 0.1 0.4 10
Total Suspended Solids
mg/L 3 0.4 3.2 8.6 10
Electrical Conductance
µmhos/cm 1.0 9,620 10,121 10,570 10
NotesCalculations assume values for non-detect results are at the detection limit.
:
Reported values are average values from multiple data sets, wherever possible. pH measured after conditioning with acid. (1) Based on reporting detection limit as provided by EMWD laboratory. (2) Data averaged over 14-day period. (3) Average of 10 samples.

3-7
As shown on Figure 3.2, a significant reduction in hardness was the result of calcium removal from the Menifee brine. Total hardness was reduced from 3,625 mg/L to 1,437 mg/L as CaCO3 (60-percent reduction). Most of the reduction was due to calcium carbonate precipitation, which was expected at a pH of 9.5 to 10.0. At this higher pH range, magnesium hardness (as CaCO3) was reduced from approximately 500 mg/L to 300 mg/L via magnesium hydroxide precipitation (40-percent reduction).
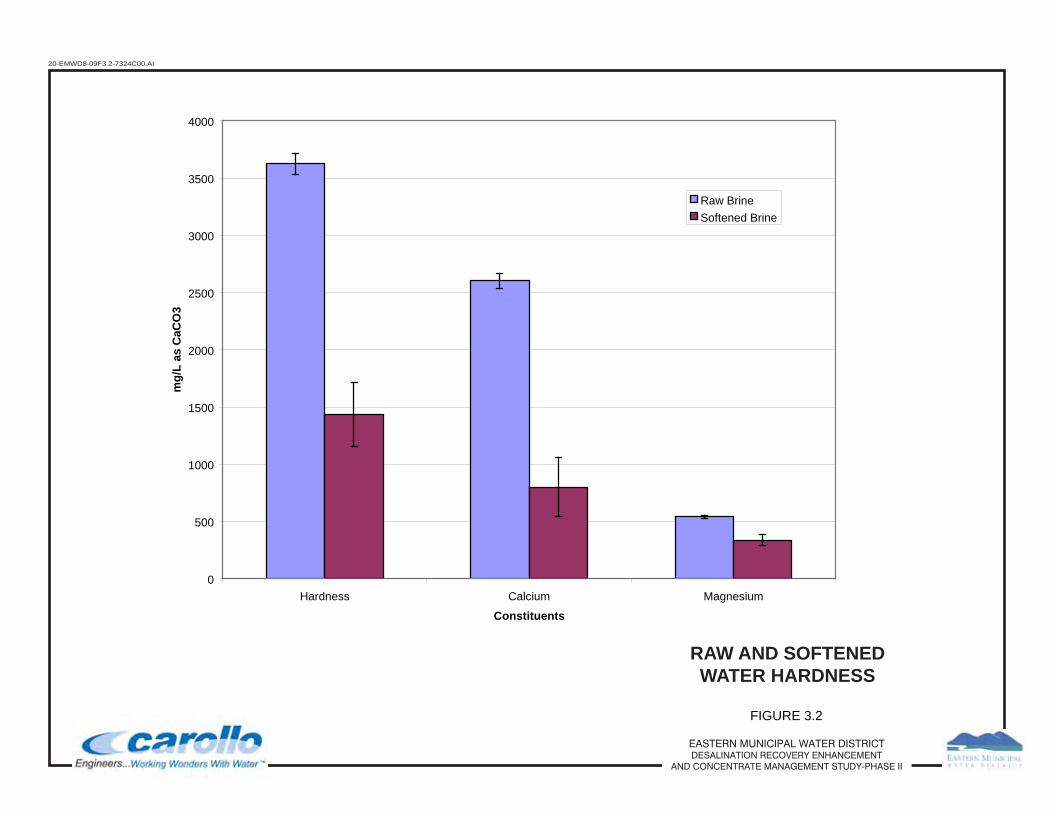
The effect of CONTRAFAST® flow rate on the reduction of calcium, magnesium, and silica showed some variation as illustrated on Figure 3.3. Testing at higher flow rates was limited. However, some variation may be explained through the failure of the solids recycle pump on the CONTRAFAST® system near the end of testing. Since this failure occurred during the period where higher flow rates were tested, solids contacting was not optimal as it was when operating at a flow rate of 50 gpm. Siemens was unable to supply a replacement pump before the required shutdown of the pilot facility. Likewise, lower calcium levels could have been the result of a lack of carbonate and sub-optimal dosing of soda ash.
As shown on Figure 3.4, silica removal was possible through a slight reduction in magnesium hardness (Figure 3.2), which resulted in the co-precipitation of silica through the formation of magnesium hydroxide when the CONTRAFAST® system was operated in the pH range of 10 to 10.3. This phenomenon has been shown in the literature to occur at higher values of pH, much to the benefit of the project, and was verified in Phase I testing. At a lime dose of 960 mg/L, the silica concentration was reduced to 36 percent of the raw brine levels (146 to 53 mg/L).
Lime and soda ash doses were effective in reducing the scaling potential with respect to calcium sulfate, barium sulfate, and magnesium hydroxide. At the desired RO recovery of 75 percent, silica would be concentrated nearly three times its saturation level and result in a silica concentration of 159 mg/L, which can be handled using anti-scalants in the RO process. Therefore, this lime and soda ash dose was maintained throughout testing and to provide some operational “buffer” in case there were some excursions in the silica level above the average. ROSA RO performance modeling software predicted, based on Phase II water quality data and lower silica levels such as those found in Phase I testing, that an upper limit recovery for the system would be 77 percent. Table 3.3 summarizes some of the model results, which may be found in Appendix C of this report.
Table 3.3 RO Modeling Predictions at 77-Percent Recovery
Parameter RO Feed Water Concentrate
CaSO4 Saturation 13.6% 73.5%
SiO2 Saturation 22.1% 97.1%
BaSO4 Saturation 334% 1,459%
pH 6.0 6.4
TDS 5,576 23,542
Langelier Saturation Index -1.95 -0.32
20-EMWD8-09F3.2-7324C00.AI
RAW AND SOFTENEDWATER HARDNESS
FIGURE 3.2
EASTERN MUNICIPAL WATER DISTRICTDESALINATION RECOVERY ENHANCEMENT
AND CONCENTRATE MANAGEMENT STUDY-PHASE II
0
500
1000
1500
2000
2500
3000
3500
4000
Hardness Calcium Magnesium
Constituents
mg/
L as
CaC
O3
Raw BrineSoftened Brine
20-EMWD8-09F3.3-7324C00.AI
EFFECT OF SOFTENING PLAN FLOW RATE ON SCALING PRECURSOR REMOVAL
FIGURE 3.3
EASTERN MUNICIPAL WATER DISTRICTDESALINATION RECOVERY ENHANCEMENT
AND CONCENTRATE MANAGEMENT STUDY-PHASE II
80
75
70
65
60
55
50
45
40
35
30
25
2040 50 60 70 80 90 100 110
Sca
ling
Pre
curs
or R
emov
al E
ffici
ency
(%)
Feed Flow Rate (GPM)
% Calcium Removal% Magnesium Removal% Silica Removal
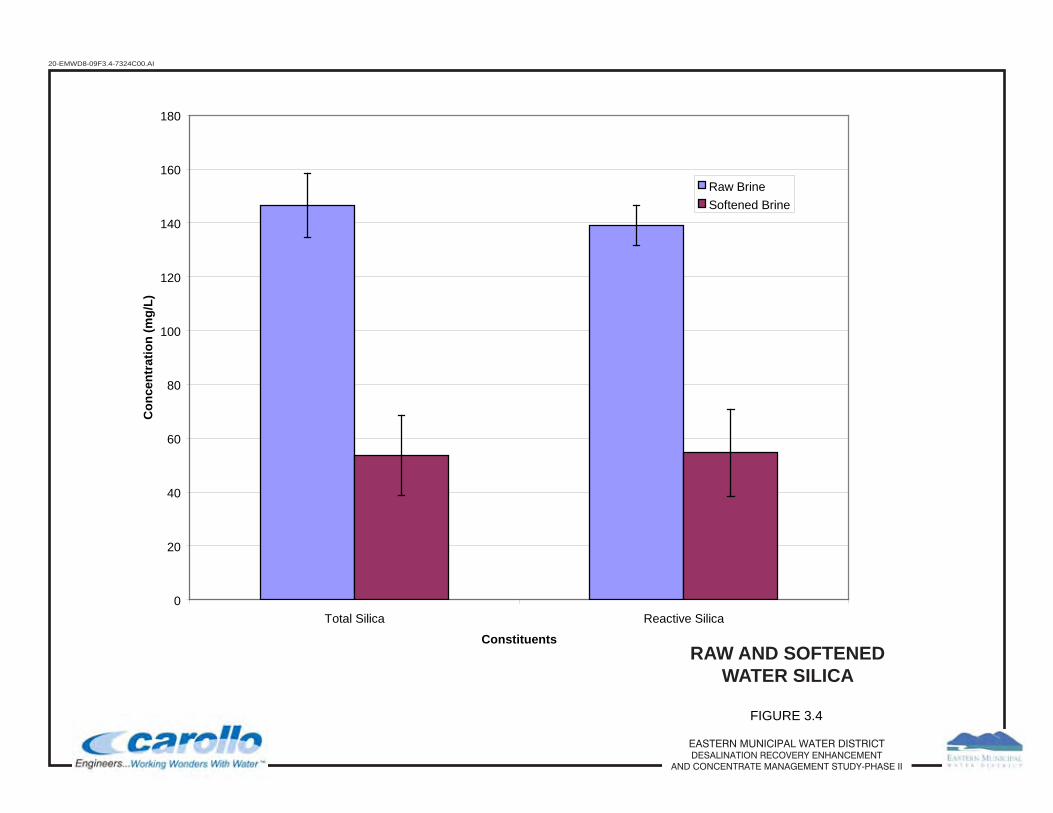
20-EMWD8-09F3.4-7324C00.AI
RAW AND SOFTENEDWATER SILICA
FIGURE 3.4
EASTERN MUNICIPAL WATER DISTRICTDESALINATION RECOVERY ENHANCEMENT
AND CONCENTRATE MANAGEMENT STUDY-PHASE II
0
20
40
60
80
100
120
140
160
180
Total Silica Reactive Silica
Constituents
Con
cent
ratio
n (m
g/L)
Raw BrineSoftened Brine
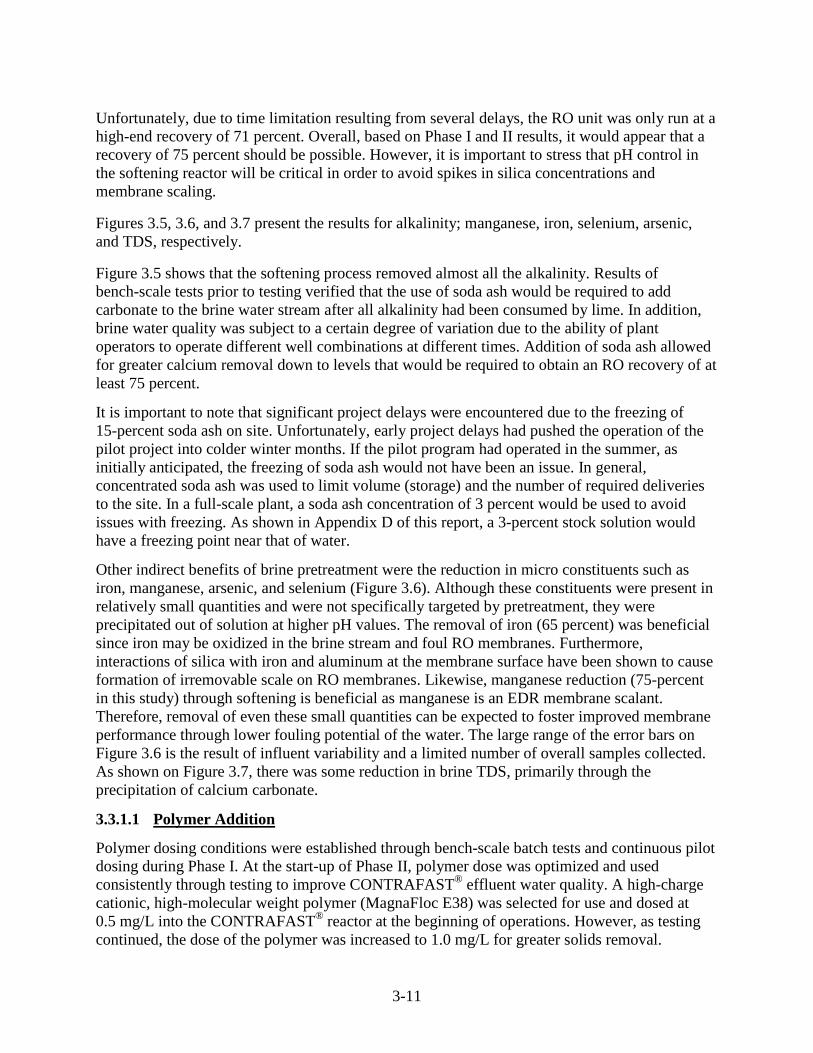
3-11
Unfortunately, due to time limitation resulting from several delays, the RO unit was only run at a high-end recovery of 71 percent. Overall, based on Phase I and II results, it would appear that a recovery of 75 percent should be possible. However, it is important to stress that pH control in the softening reactor will be critical in order to avoid spikes in silica concentrations and membrane scaling.
Figures 3.5, 3.6, and 3.7 present the results for alkalinity; manganese, iron, selenium, arsenic, and TDS, respectively.
Figure 3.5 shows that the softening process removed almost all the alkalinity. Results of bench-scale tests prior to testing verified that the use of soda ash would be required to add carbonate to the brine water stream after all alkalinity had been consumed by lime. In addition, brine water quality was subject to a certain degree of variation due to the ability of plant operators to operate different well combinations at different times. Addition of soda ash allowed for greater calcium removal down to levels that would be required to obtain an RO recovery of at least 75 percent.
It is important to note that significant project delays were encountered due to the freezing of 15-percent soda ash on site. Unfortunately, early project delays had pushed the operation of the pilot project into colder winter months. If the pilot program had operated in the summer, as initially anticipated, the freezing of soda ash would not have been an issue. In general, concentrated soda ash was used to limit volume (storage) and the number of required deliveries to the site. In a full-scale plant, a soda ash concentration of 3 percent would be used to avoid issues with freezing. As shown in Appendix D of this report, a 3-percent stock solution would have a freezing point near that of water.
Other indirect benefits of brine pretreatment were the reduction in micro constituents such as iron, manganese, arsenic, and selenium (Figure 3.6). Although these constituents were present in relatively small quantities and were not specifically targeted by pretreatment, they were precipitated out of solution at higher pH values. The removal of iron (65 percent) was beneficial since iron may be oxidized in the brine stream and foul RO membranes. Furthermore, interactions of silica with iron and aluminum at the membrane surface have been shown to cause formation of irremovable scale on RO membranes. Likewise, manganese reduction (75-percent in this study) through softening is beneficial as manganese is an EDR membrane scalant. Therefore, removal of even these small quantities can be expected to foster improved membrane performance through lower fouling potential of the water. The large range of the error bars on Figure 3.6 is the result of influent variability and a limited number of overall samples collected. As shown on Figure 3.7, there was some reduction in brine TDS, primarily through the precipitation of calcium carbonate.
3.3.1.1
Polymer dosing conditions were established through bench-scale batch tests and continuous pilot dosing during Phase I. At the start-up of Phase II, polymer dose was optimized and used consistently through testing to improve CONTRAFAST® effluent water quality. A high-charge cationic, high-molecular weight polymer (MagnaFloc E38) was selected for use and dosed at 0.5 mg/L into the CONTRAFAST® reactor at the beginning of operations. However, as testing continued, the dose of the polymer was increased to 1.0 mg/L for greater solids removal.
Polymer Addition
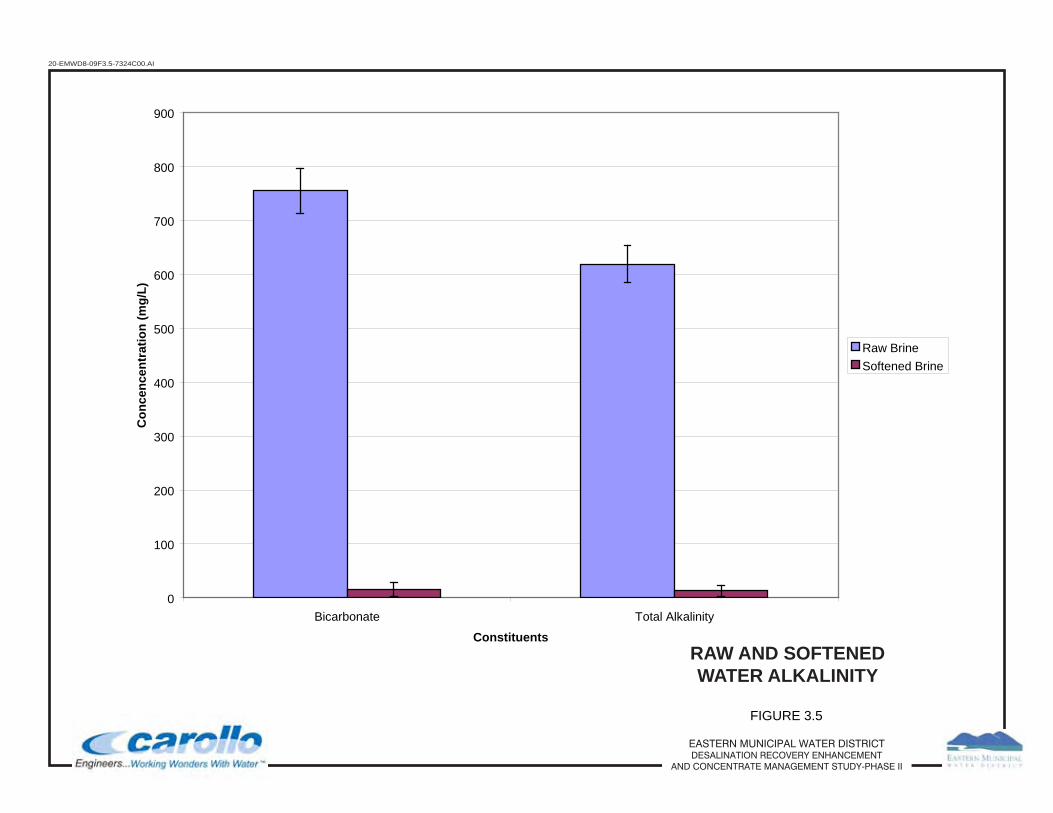
20-EMWD8-09F3.5-7324C00.AI
RAW AND SOFTENEDWATER ALKALINITY
FIGURE 3.5
EASTERN MUNICIPAL WATER DISTRICTDESALINATION RECOVERY ENHANCEMENT
AND CONCENTRATE MANAGEMENT STUDY-PHASE II
0
100
200
300
400
500
600
700
800
900
Bicarbonate Total Alkalinity
Constituents
Con
cenc
entr
atio
n (m
g/L)
Raw BrineSoftened Brine
20-EMWD8-09F3.6-7324C00.AI
RAW AND SOFTENEDWATER MAGNESIUM, IRON, SELENIUM
AND ARSENIC
FIGURE 3.6
EASTERN MUNICIPAL WATER DISTRICTDESALINATION RECOVERY ENHANCEMENT
AND CONCENTRATE MANAGEMENT STUDY-PHASE II
-10
0
10
20
30
40
50
Manganese Total Iron Selenium Arsenic
Constituent
Con
cent
ratio
n (u
g/L)
Raw BrineSoftened Brine
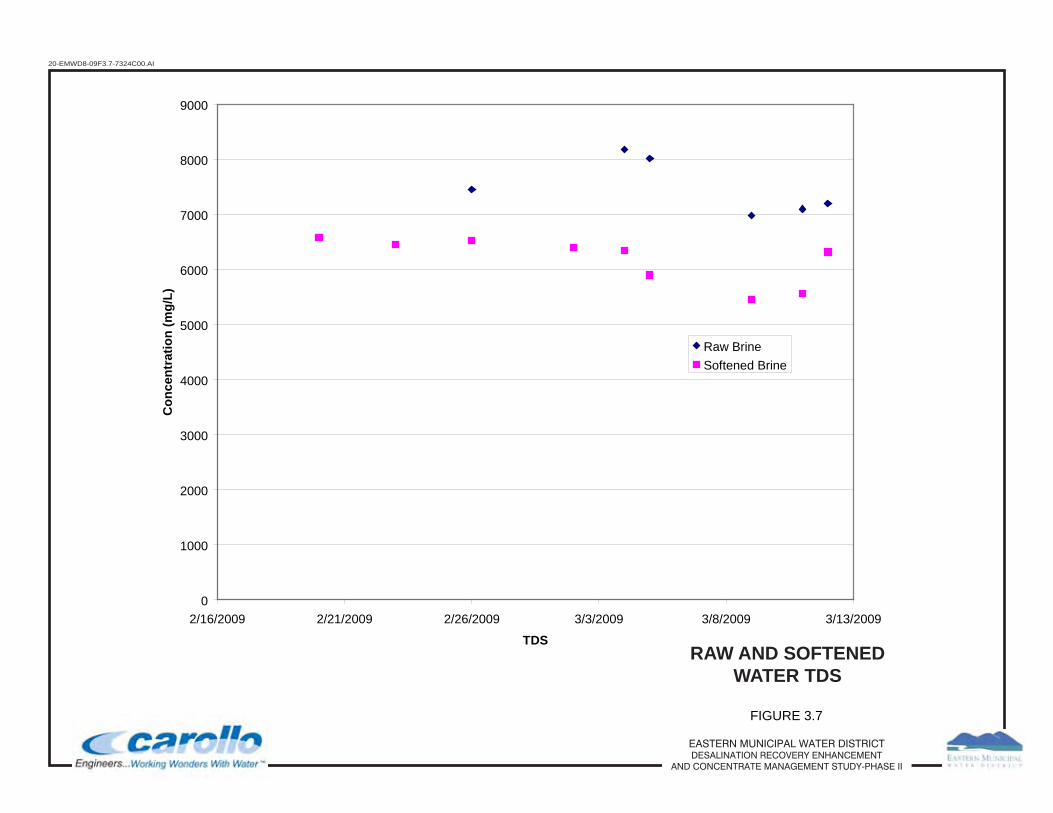
20-EMWD8-09F3.7-7324C00.AI
FIGURE 3.7
EASTERN MUNICIPAL WATER DISTRICTDESALINATION RECOVERY ENHANCEMENT
AND CONCENTRATE MANAGEMENT STUDY-PHASE II
RAW AND SOFTENEDWATER TDS
0
1000
2000
3000
4000
5000
6000
7000
8000
9000
2/16/2009 2/21/2009 2/26/2009 3/3/2009 3/8/2009 3/13/2009
TDS
Con
cent
ratio
n (m
g/L)
Raw BrineSoftened Brine
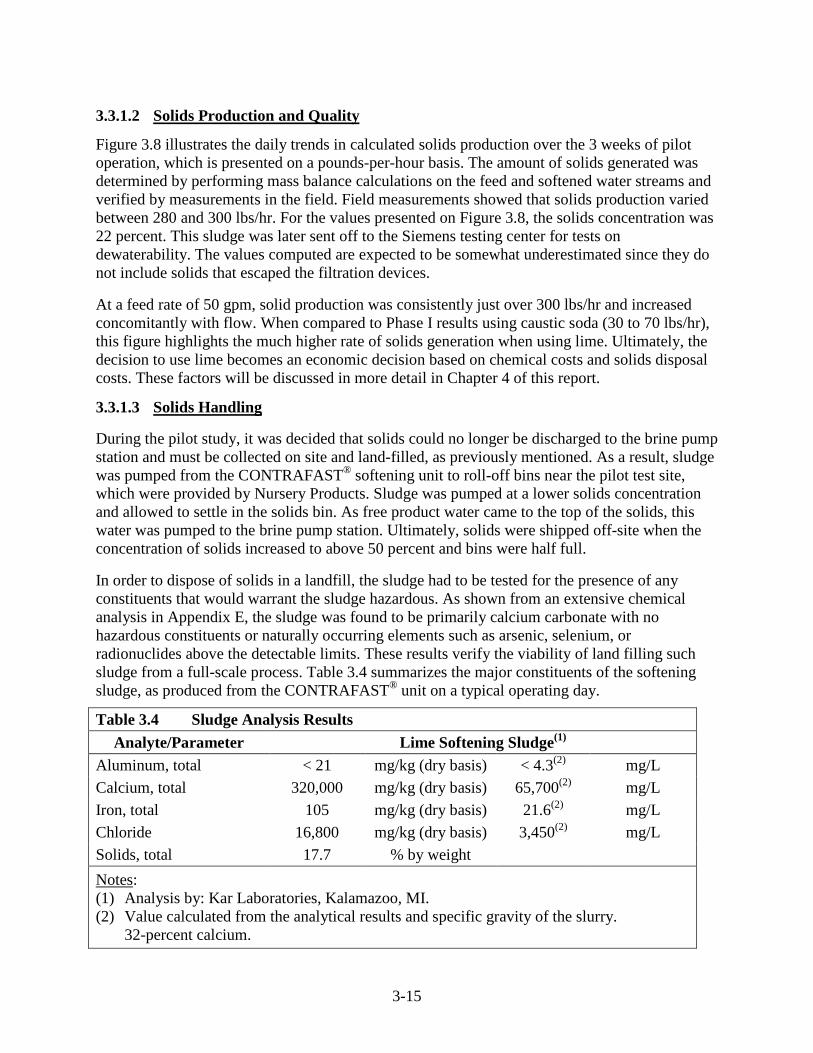
3-15
3.3.1.2
Figure 3.8 illustrates the daily trends in calculated solids production over the 3 weeks of pilot operation, which is presented on a pounds-per-hour basis. The amount of solids generated was determined by performing mass balance calculations on the feed and softened water streams and verified by measurements in the field. Field measurements showed that solids production varied between 280 and 300 lbs/hr. For the values presented on Figure 3.8, the solids concentration was 22 percent. This sludge was later sent off to the Siemens testing center for tests on dewaterability. The values computed are expected to be somewhat underestimated since they do not include solids that escaped the filtration devices.
Solids Production and Quality
At a feed rate of 50 gpm, solid production was consistently just over 300 lbs/hr and increased concomitantly with flow. When compared to Phase I results using caustic soda (30 to 70 lbs/hr), this figure highlights the much higher rate of solids generation when using lime. Ultimately, the decision to use lime becomes an economic decision based on chemical costs and solids disposal costs. These factors will be discussed in more detail in Chapter 4 of this report.
3.3.1.3
During the pilot study, it was decided that solids could no longer be discharged to the brine pump station and must be collected on site and land-filled, as previously mentioned. As a result, sludge was pumped from the CONTRAFAST® softening unit to roll-off bins near the pilot test site, which were provided by Nursery Products. Sludge was pumped at a lower solids concentration and allowed to settle in the solids bin. As free product water came to the top of the solids, this water was pumped to the brine pump station. Ultimately, solids were shipped off-site when the concentration of solids increased to above 50 percent and bins were half full.
Solids Handling
In order to dispose of solids in a landfill, the sludge had to be tested for the presence of any constituents that would warrant the sludge hazardous. As shown from an extensive chemical analysis in Appendix E, the sludge was found to be primarily calcium carbonate with no hazardous constituents or naturally occurring elements such as arsenic, selenium, or radionuclides above the detectable limits. These results verify the viability of land filling such sludge from a full-scale process. Table 3.4 summarizes the major constituents of the softening sludge, as produced from the CONTRAFAST® unit on a typical operating day.
Table 3.4 Sludge Analysis Results Analyte/Parameter Lime Softening Sludge(1)
Aluminum, total < 21 mg/kg (dry basis) < 4.3(2) mg/L Calcium, total 320,000 mg/kg (dry basis) 65,700(2) mg/L Iron, total 105 mg/kg (dry basis) 21.6(2) mg/L Chloride 16,800 mg/kg (dry basis) 3,450(2) mg/L Solids, total 17.7 % by weight Notes(1) Analysis by: Kar Laboratories, Kalamazoo, MI.
:
(2) Value calculated from the analytical results and specific gravity of the slurry. 32-percent calcium.

20-EMWD8-09F3.8-7324C00.AI
FIGURE 3.8
EASTERN MUNICIPAL WATER DISTRICTDESALINATION RECOVERY ENHANCEMENT
AND CONCENTRATE MANAGEMENT STUDY-PHASE II
SLUDGEPRODUCTION RATES
0
20
40
60
80
100
120
02/19
/09
02/23
/09
02/25
/09
02/26
/09
02/26
/09
02/27
/09
03/02
/09
03/02
/09
03/03
/09
03/04
/09
03/04
/09
03/05
/09
03/06
/09
03/06
/09
03/09
/09
03/10
/09
03/10
/09
03/11
/09
03/12
/09
03/12
/09
03/13
/09
Date
Brin
e Fl
ow R
ate,
GPM
0.00
100.00
200.00
300.00
400.00
500.00
600.00
700.00
800.00
Slud
ge P
rodu
ctio
n, lb
/hr
Brine Flow Rate (GPM) Sludge Production (lb/hr)
3-17
Given the total calcium concentration, the calculated total calcium carbonate dry mass would be 800,000 mg/kg on a stoichiometric basis, assuming that all calcium was precipitated as calcite. The sum of all solids (including the addition of sodium and other minerals) would total 833,726 mg/kg, which would indicate a 97-percent calcium carbonate presence in the produced sludge.
3.3.1.4
Samples of CONTRAFAST® sludge were sent to Siemens for dewatering tests where it was ultimately determined that plate presses would be the optimal dewatering technology. The purpose of the testing was to generate relevant data to be used to size the dewatering equipment as well as to confirm key process parameters such as maximum feed pressure and cake thickness.
Solids Dewatering
Testing was performed to determine the amenability of the slurry to pressure filtration. Conditioning of the sludge was not required prior to testing to enhance or improve dewatering. A bench-top pressure filtration test was performed with a 3-inch laboratory filter press. Slurry was placed in the sample reservoir, which was subsequently pressurized with compressed air. The feed pressure was started at 25 psig and staged to a final pressure of 100 psig. Completion of the filtration cycle was determined when the filtrate flow reached an approximate rate of 0.01 gpm per square foot of filtration area. Cake air blowdown was performed prior to discharging the filter cake.
The testing performed produced an acceptable filter cake that did not contain any free liquids, which therefore, would pass the “paint filter test.” The dry solids content of the filter cake is expected to be from 55 to 60 percent by weight with a wet cake density of 96 lbs/ft3. Total cycle time, excluding cake discharge, is estimated to be 1.2 to 1.5 hours. The type of plate shifting selected, if any, and/or the size of the filter press would determine the time required for cake discharge. See Figure 3.9 for photos of a full-scale plate press, the bench-top testing apparatus, and solids cake.
The outcome of the test was based on the characteristics of the sample submitted as shown in the Summary of Test Results and Slurry Analysis in Appendix F. Actual performance may change if the future sludge characteristics are different or vary. The performance of the full-scale application will be dependent on the slurry being relatively similar to the sample tested.
As will be shown in Chapter 4, the cost of operating plate presses is very low compared to other methods such as filter belt presses or centrifuges. Electrical costs per unit are expected to be around $12,000/year and $25,000/year for replacement parts and maintenance.
Overall, test results showed that high levels of dewatering might be achieved with the lime sludge generated from this process. This is encouraging, as these drier cakes will reduce the disposal costs associated with a full-scale plant.
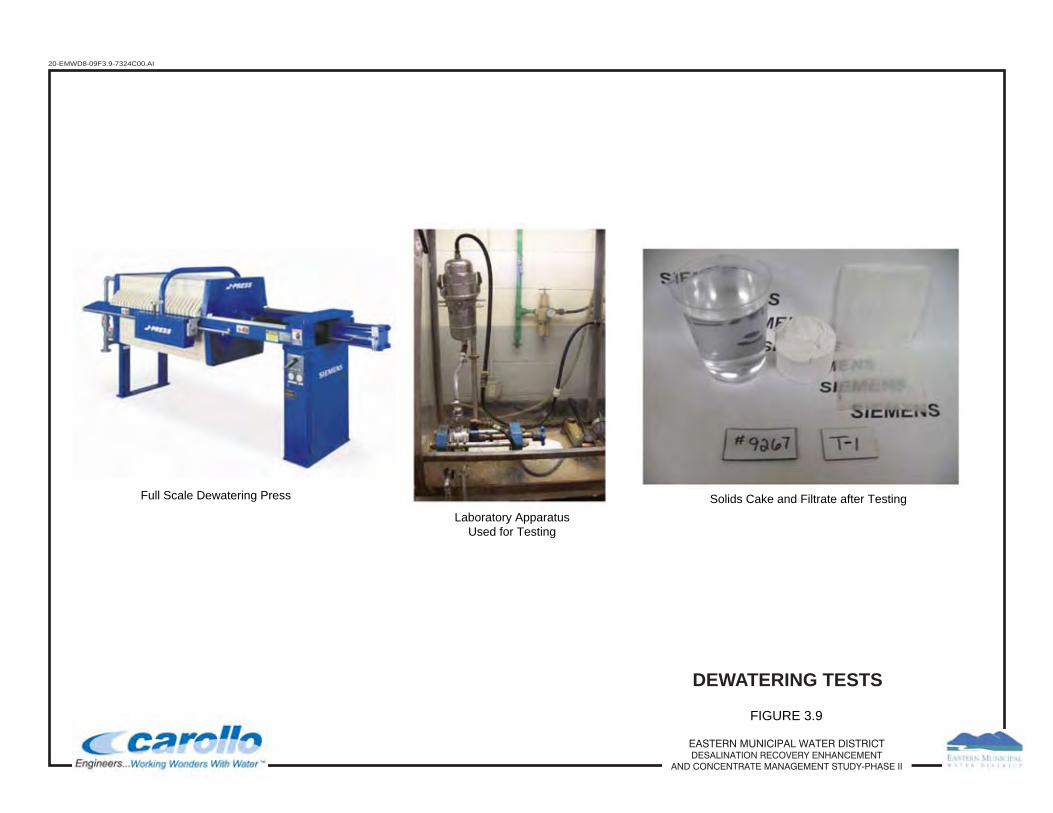
20-EMWD8-09F3.9-7324C00.AI
FIGURE 3.9
Solids Cake and Filtrate after TestingFull Scale Dewatering Press
Laboratory ApparatusUsed for Testing
EASTERN MUNICIPAL WATER DISTRICTDESALINATION RECOVERY ENHANCEMENT
AND CONCENTRATE MANAGEMENT STUDY-PHASE II
DEWATERING TESTS
3-19
3.3.1.5
To date, no market has been determined for lime sludge. Originally, it was thought that sludge could be either used for soil or wastewater sludge conditioning or used in cement kilns. For the former option, it was later determined through research that soil pH conditions in California were basic. Acidic soils, more commonly found in the Midwestern and Eastern United States, would be more appropriate for the use of this sludge.
Solids Disposal
For the second option (cement kilns), a local company in Riverside (Valencia A-1 Grit) said that they do not have the proper equipment to handle sludge particles that are less than 200 microns. This company sends their material into a rotary dryer followed by a kiln and then pass the granular pellets into a sieve to size it for packaging. At this point, they can only take a pellet form of solids. The contact did suggest that EMWD could contact landfill companies who may want the dried sludge as inert materials that they sometimes use (in place of dirt or sand) to mix with other compounds to absorb the water. The contact also suggested perhaps a mining industry.
Valencia A-1 Grit has expressed interest in taking solids generated from a pelletized reactor, which was investigated by Carollo for Western Municipal Water District (Western). At the beginning of this project, it was determined that the pilot testing of pelletized reactors would not move forward due to the parallel work being completed at Western. This treatment option would be a possible alternative to conventional lime/soda ash softening.
Based on the above, the cost analysis presented in Chapter 4 is predicated on the disposal of the lime solids to a landfill, which would provide the most conservative cost estimate for a full-scale project.
3.3.2 Softened Water Conditioning
Water from the CONTRAFAST® unit was adjusted to pH 7 using sulfuric acid during the course of pilot testing. This is an important step to prevent scale formation in the secondary RO unit.
3.3.3 Dual Media and Cartridge Filtration
In Phase II testing, a more robust deep media filter was used to filter water from the CONTRAFAST® system; this unit is detailed in Chapter 2. A major problem in Phase I testing was solids breakthrough of the original rental filter unit, which allowed solids to pass to the secondary RO unit. As shown on Figure 3.10, the performance of the new deep bed media filter was unquestionably superior. The filter consistently removed solids from the CONTRAFAST® effluent to produce a RO feed water turbidity of less than 0.5 NTU, which in turn lead to low SDIs (see Table 3.5).
Table 3.5 SDI Results CONTRAFAST® Flow
(gpm) SDI Range SDI Average No. Samples 50 2.1 - 3.0 2.6 10 80 1.8 - 2.0 1.9 2
100 1.6 - 1.8 1.7 3

20-EMWD8-09F3.10-7324C00.AI
FIGURE 3.10
EASTERN MUNICIPAL WATER DISTRICTDESALINATION RECOVERY ENHANCEMENT
AND CONCENTRATE MANAGEMENT STUDY-PHASE II
SOFTENED BRINE TURBIDITY -POST CLARIFIER AND MEDIA FILTRATION
Dates of Operation
25
20
15
10
5
02/16 2/20 2/24 2/28 3/4 3/8 3/12 3/16
Turbidity of softened brine exiting clarifier
After media polishing,turbidity is consistently < 0.5 NTU
0.5 NTU
50 GPM 80 GPM 100 GPM < < < < <
Sof
tene
d B
rine
Turb
idity
(NTU
)
<
3-21
During Phase I testing, SDI filter pads clogged during the 15-minute test and filtrate flow fell below measurable levels, resulting in very high SDI values. Based on the Phase II results of these filters, it appears that a full-scale application could utilize media filtration instead of more expensive microfiltration. Media filtration would likely employ the use of larger media pressure vessels to obtain similar results. During the course of plant operations, the head loss buildup on the media filters was minimal over one operating day. However, the filters were backwashed daily, regardless. This is more of a testament to the high performance of the CONTRAFAST® unit, which consistently produced water with an effluent turbidity that was generally < 5 NTU (see Figure 3.10). There was an increase in CONTRAFAST® turbidity as the flow rate (and loading rate) through the unit was increased, as shown on Figure 3.10. However, even at a 100-gpm loading rate (worst-case) the turbidity was always < 20 NTU. Interestingly, SDI values decreased with increasing CONTRAFAST® loading rates, perhaps a result of filter “ripening” due to the higher influent turbidity.
3.4 REVERSE OSMOSIS In conventional RO operation, performance is predicted by either maintaining a constant feed pressure or maintaining a constant permeate production (constant membrane flux). In a constant flux operation, the feed and trans-membrane pressures increase in response to membrane fouling. If the feed pressure is kept constant, fouling is identified by a decrease in flux. In this pilot study, due to the manual nature of control, a combination of adjustments were made to the flow rate and feed pressure during the course of operation. However, normalization of the performance data eliminates any discrepancies that may have resulted from the daily adjustments of feed flow rate and pressure.
3.4.1 Permeate Flow, Recoveries, Flux, and Permeability
Figure 3.11 presents the variation in RO plant feed water flow rate for the duration of the study. As can be seen, the feed flow rate varied between 19.5 and 20.0 gpm for most of the operating period. It was reduced to below 19.5 gpm for the final 3 days of testing in order to conserve acid use. Due to the nature of the operation, it was not possible to operate the RO plant continuously for the entire 3-week operating period. The plant was shut down each Friday afternoon and then flushed with RO permeate and left off-line until Monday morning when it was re started. Although the plant operated continuously overnight without an operator present, the period between Friday 5:00 pm to Monday 8:00 am was considered too long for the plant to be unattended. Because each operating period was separated by flushing and a shutdown, each can be considered separately. For this reason, discussion of the results has been broken into individual weeks. Each operating period was sufficiently long to allow the RO system to reach equilibrium, so the results are representative. However, long-term predictions of membrane performance is not easy to estimate from this data.
3.4.1.1 During the first week the plant operated for 4 days at a recovery of between 65 and 68 percent. Figure 3.12 shows the recovery of the entire operating period, and shows that for the remaining weeks of operation the recovery was around 70-percent. The overall salt rejection is also shown. During Week 1, the salt rejection increased from about 93 percent to around 98 percent, where it remained.
Week 1

20-EMWD8-09F3.11-7324C00.AI
FIGURE 3.11
EASTERN MUNICIPAL WATER DISTRICTDESALINATION RECOVERY ENHANCEMENT
AND CONCENTRATE MANAGEMENT STUDY-PHASE II
RO PLANT FEEDWATER FLOW RATES
16.0
16.5
17.0
17.5
18.0
18.5
19.0
19.5
20.0
20.5
3 5 6 7 10 11 12 13 14 17 18 19 20 21
Operating Time (Days)
Flow
(gpm
)
Feed Flow
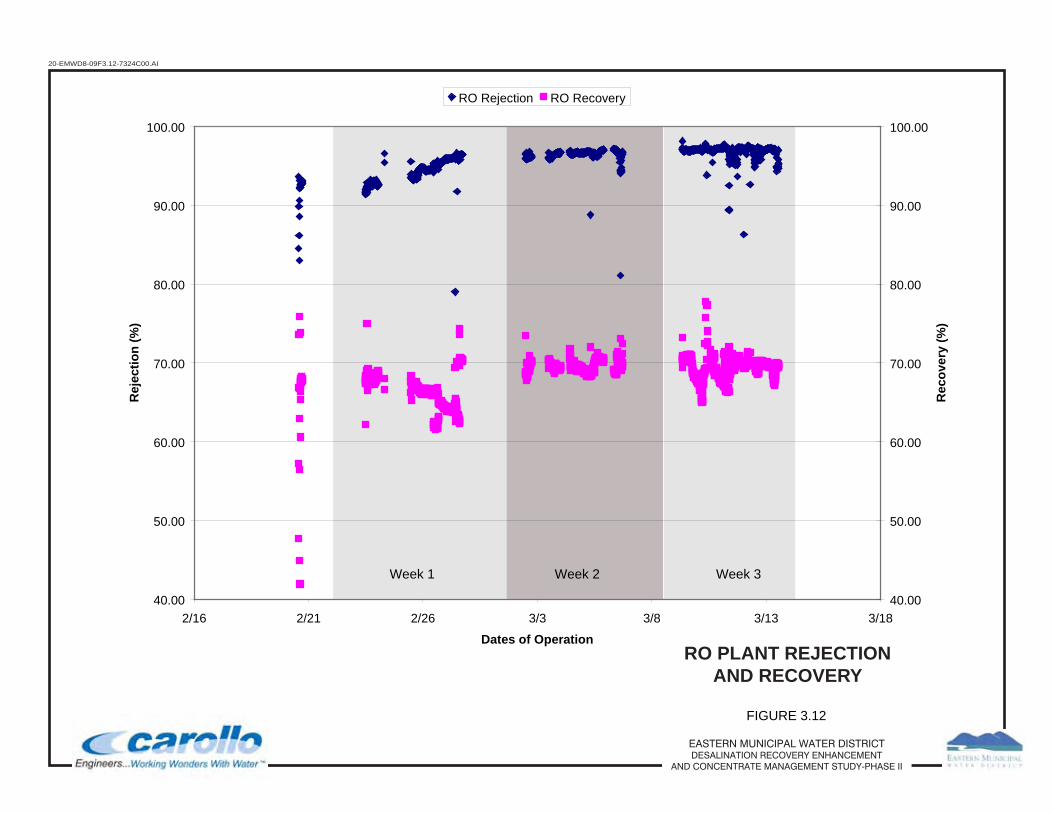
20-EMWD8-09F3.12-7324C00.AI
FIGURE 3.12
Week 1 Week 2 Week 3
EASTERN MUNICIPAL WATER DISTRICTDESALINATION RECOVERY ENHANCEMENT
AND CONCENTRATE MANAGEMENT STUDY-PHASE II
RO PLANT REJECTIONAND RECOVERY
40.00
50.00
60.00
70.00
80.00
90.00
100.00
2/16 2/21 2/26 3/3 3/8 3/13 3/18
Dates of Operation
Rej
ectio
n (%
)
40.00
50.00
60.00
70.00
80.00
90.00
100.00
Rec
over
y (%
)
RO Rejection RO Recovery

3-24
The first and second stage RO feed pressures are shown on Figure 3.13. As shown, in Week 1, the Stage 1 feed pressure increased slightly from about 155 psi to 160 psi, while the second stage pressure was relatively consistent around 225 psi.
Differential pressures are shown on Figure 3.14 and indicate a stable trend through Week 1 and for the rest of the operating period.
Figure 3.15 presents the NPF for each week of operation. This data takes into account changes in feed pressure, temperatures and salinity of the feed stream. For Week 1 it can be seen that the Stage 1 NPF shows some variation but on average was stable. The second stage NPF was also stable. The overall NPF flow (top data on Figure 3.15) shows the combined data. Overall, in Week 1 there was no significant change in NPF.
Figure 3.16 shows the normalized salt passage and overall salt rejection for each membrane stage. As shown, all data was stable in Week 1.
3.4.1.2
During Week 2, the plant operated continuously between 8:00 am Monday and 5:00 pm on Friday. The Week 2 NPF data (see Figure 3.15) shows stable performance for both Stage 1 and Stage 2 membranes. The normalized salt passage and overall salt rejection (see Figure 3.16) for each membrane stage was also stable during this period.
Week 2
3.4.1.3
During Week 3, the plant also operated continuously between 8:00 am Monday and 5:00 pm Friday. Figure 3.15 shows some variation in the NPF for the Stage 1 membranes, but overall the average NPF remained stable. The Stage 2 NPF was also generally stable, with a slight decline towards the end of the operating period. The slight downward trend is confirmed by the overall NPF data.
Week 3
In order to explain this decline, the actual silica and calcium concentration in the feed streams to the RO plant were examined. Figure 3.17 shows the calcium concentrations for each week of operation and presents both laboratory and site analyses. As shown, the on-site measured calcium concentrations in Week 3 were steady and between 600 and 800 mg/L as Ca, which is the target range for the upstream treatment. The laboratory calcium values show variation with two values being lower than the on-site measurements and one value significantly higher (around 1,000 mg/L).
Figure 3.18 shows the softened water silica concentrations. The figure also indicates shaded ranges of silica concentration that could be tolerated for different overall recovery levels of 70- and 75-percent. As shown, to operate at a recovery level of 70-percent without the use of an antiscalant, the feed silica concentration should be in the range of 36 to 54 mg/L. This would provide a brine concentration of between 120 and 180 mg/L, considered to be the limit for operation without an antiscalant (Wilf, Mark. "Wastewater Reclamation Using UF/RO Technology," Hydranautics Technical Papers, May 1998) (Ning, Robert Y. "Process Simplification Through the Use of Antiscalants and Antifoulants," Ultrapure Water, 20(7), 2003). Increasing the recovery to 75-percent would reduce the acceptable concentration range of silica to between 30 and 45 mg/L. The actual silica concentrations indicate that for most of Week 3 the silica levels were between 60 and 70 mg/L, which should be acceptable at a recovery of
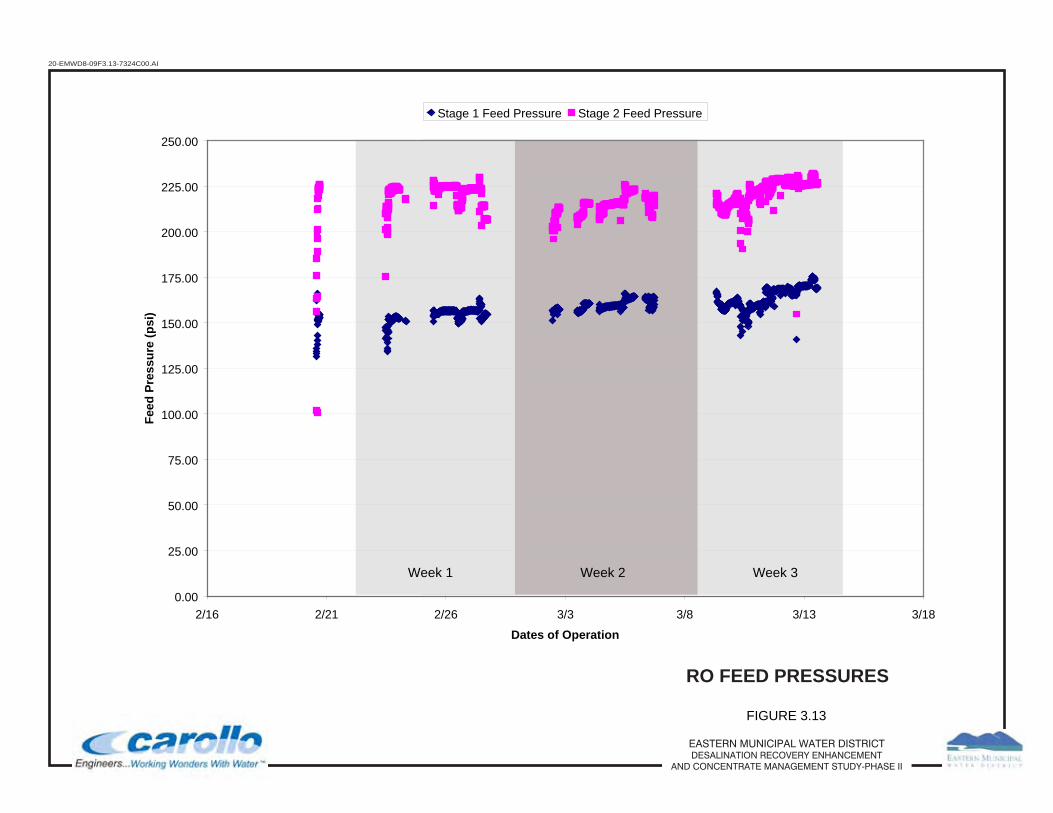
20-EMWD8-09F3.13-7324C00.AI
FIGURE 3.13
Week 1 Week 2 Week 3
EASTERN MUNICIPAL WATER DISTRICTDESALINATION RECOVERY ENHANCEMENT
AND CONCENTRATE MANAGEMENT STUDY-PHASE II
RO FEED PRESSURES
0.00
25.00
50.00
75.00
100.00
125.00
150.00
175.00
200.00
225.00
250.00
2/16 2/21 2/26 3/3 3/8 3/13 3/18
Dates of Operation
Feed
Pre
ssur
e (p
si)
Stage 1 Feed Pressure Stage 2 Feed Pressure
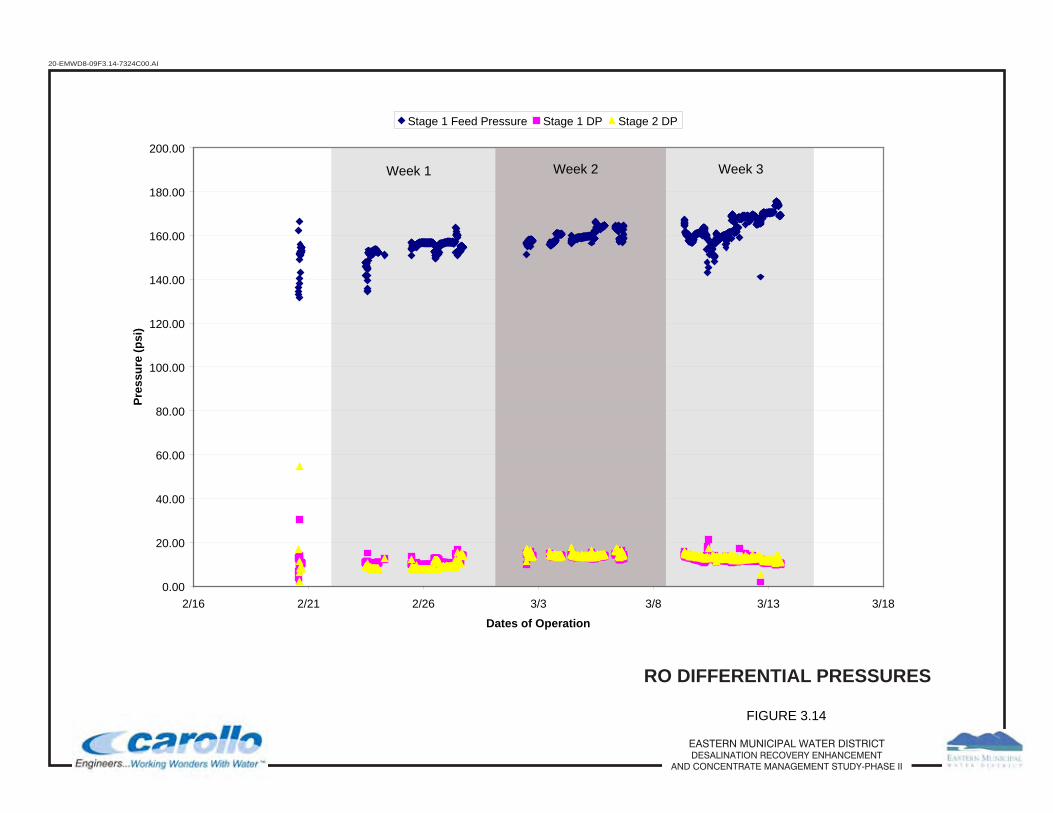
20-EMWD8-09F3.14-7324C00.AI
FIGURE 3.14
EASTERN MUNICIPAL WATER DISTRICTDESALINATION RECOVERY ENHANCEMENT
AND CONCENTRATE MANAGEMENT STUDY-PHASE II
RO DIFFERENTIAL PRESSURES
0.00
20.00
40.00
60.00
80.00
100.00
120.00
140.00
160.00
180.00
200.00
2/16 2/21 2/26 3/3 3/8 3/13 3/18
Dates of Operation
Pres
sure
(psi
)Stage 1 Feed Pressure Stage 1 DP Stage 2 DP
Week 1 Week 2 Week 3

20-EMWD8-09F3.15-7324C00.AI
FIGURE 3.15
EASTERN MUNICIPAL WATER DISTRICTDESALINATION RECOVERY ENHANCEMENT
AND CONCENTRATE MANAGEMENT STUDY-PHASE II
RO NORMALIZED PERMEATE FLOW
Week 1 Week 3Week 2
0.00
2.00
4.00
6.00
8.00
10.00
12.00
14.00
16.00
2/16 2/21 2/26 3/3 3/8 3/13 3/18
Dates of Operation
Flow
(gpm
)
Stage 1 NPF Stage 2 NPF Overall System NPF

20-EMWD8-09F3.16-7324C00.AI
FIGURE 3.16
Week 1 Week 2 Week 3
EASTERN MUNICIPAL WATER DISTRICTDESALINATION RECOVERY ENHANCEMENT
AND CONCENTRATE MANAGEMENT STUDY-PHASE II
RO NORMALIZED SALTPASSAGE AND REJECTION
0.0%
0.5%
1.0%
1.5%
2.0%
2.5%
3.0%
3.5%
4.0%
4.5%
5.0%
3 5 6 7 10 11 12 13 14 17 18 19 20 21Operating Time (days)
Salt
Pass
age
(%)
90.0%
91.0%
92.0%
93.0%
94.0%
95.0%
96.0%
97.0%
98.0%
99.0%
100.0%
Salt
Rej
ectio
n (%
)
1st Stg Salt Pass 2nd Stg Salt Pass 1st Stg Salt Rej 2nd Stg Salt Rej
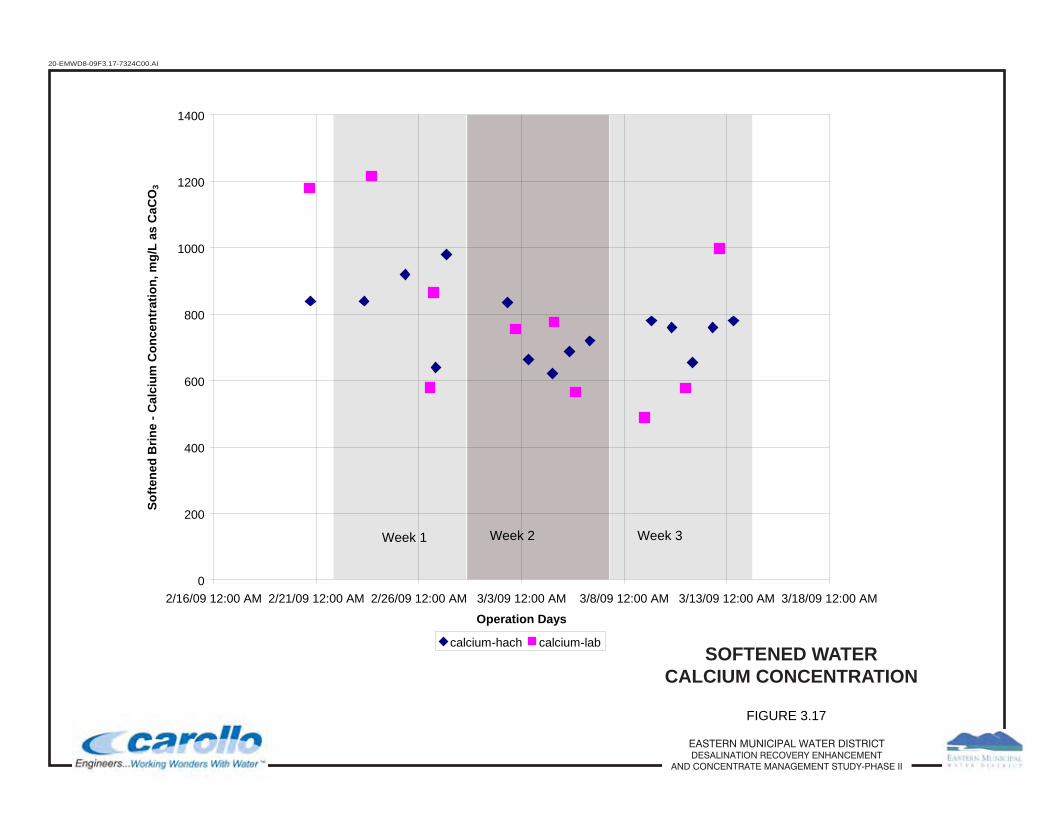
20-EMWD8-09F3.17-7324C00.AI
FIGURE 3.17
EASTERN MUNICIPAL WATER DISTRICTDESALINATION RECOVERY ENHANCEMENT
AND CONCENTRATE MANAGEMENT STUDY-PHASE II
SOFTENED WATERCALCIUM CONCENTRATION
0
200
400
600
800
1000
1200
1400
2/16/09 12:00 AM 2/21/09 12:00 AM 2/26/09 12:00 AM 3/3/09 12:00 AM 3/8/09 12:00 AM 3/13/09 12:00 AM 3/18/09 12:00 AM
Operation Days
Softe
ned
Brin
e - C
alci
um C
once
ntra
tion,
mg/
L as
CaC
O3
calcium-hach calcium-lab
Week 1 Week 2 Week 3
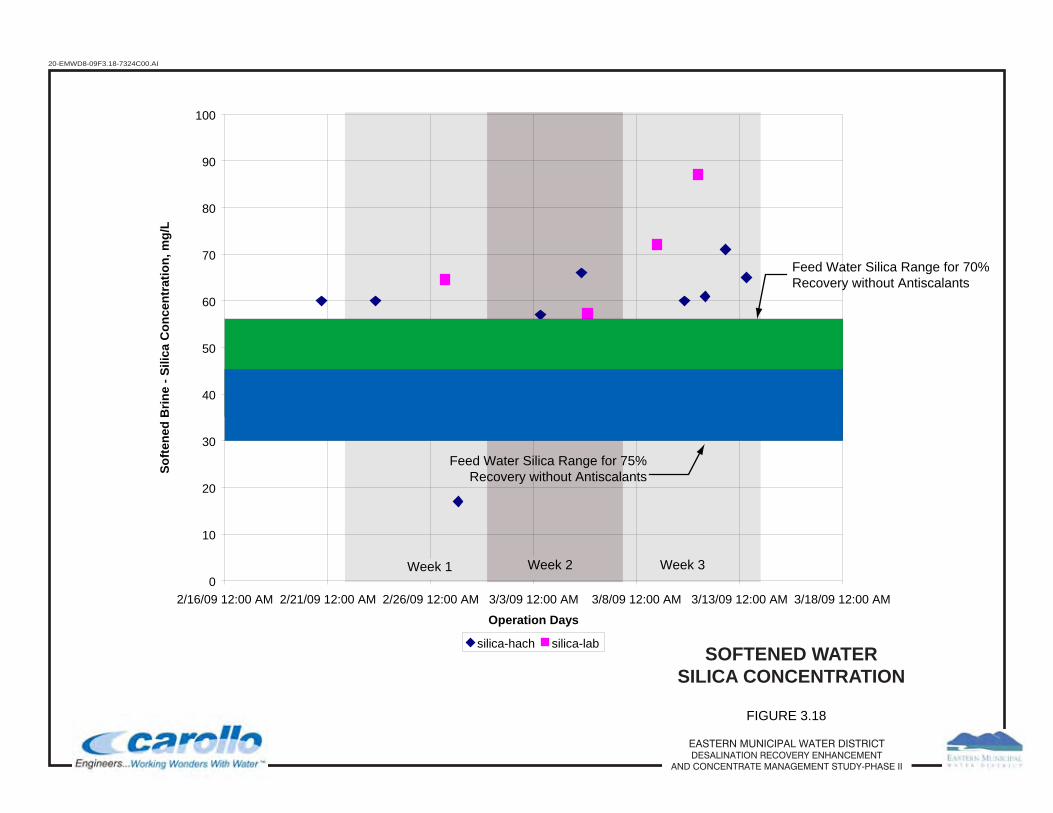
20-EMWD8-09F3.18-7324C00.AI
FIGURE 3.18
EASTERN MUNICIPAL WATER DISTRICTDESALINATION RECOVERY ENHANCEMENT
AND CONCENTRATE MANAGEMENT STUDY-PHASE II
SOFTENED WATERSILICA CONCENTRATION
Week 1 Week 2 Week 3
Feed Water Silica Range for 75%Recovery without Antiscalants
Feed Water Silica Range for 70%Recovery without Antiscalants
0
10
20
30
40
50
60
70
80
90
100
2/16/09 12:00 AM 2/21/09 12:00 AM 2/26/09 12:00 AM 3/3/09 12:00 AM 3/8/09 12:00 AM 3/13/09 12:00 AM 3/18/09 12:00 AM
Operation Days
Softe
ned
Brin
e - S
ilica
Con
cent
ratio
n, m
g/L
silica-hach silica-lab

3-31
70-percent and the use of an antiscalant. In fact, for the entire operating period, all but one of the RO feed water silica concentrations were at about 70 mg/L or less. As shown, one laboratory sample shows a value of 88 mg/L. The antiscalant used (King Lee Y2K at a dose of 4 mg/L) should allow silica concentrations of up to about 80 mg/L at this recovery, and 70 mg/L at a recovery of 75-percent.
Overall, both the calcium and the silica concentrations were within acceptable ranges for operating the RO plant at a recovery level of 70-percent. Actually, with better pH control of the softening operation on a larger plant, it should be possible to maintain the silica concentration at levels that will allow the RO process to operate at 75-percent recovery.
The slight observed decline in NPF towards the end of Week 3 operating period coincides with an increase in the Stage 2 feed pressure indicating that some fouling was occurring on the Stage 2 membranes. Without a membrane autopsy, it is not possible to definitely identify the cause of the observed fouling. Possibilities include:
• Silica fouling - the silica concentrations were well within the limits of a system using antiscalant. So, if silica was the foulant then that would indicate that the antiscalant was inadequate, or the dosage was not sufficient.
• Calcium sulfate scaling - this is unlikely given the calcium and sulfate feed water concentration and the presence of the antiscalant.
• Particulate fouling - the reduction of feed flow to the Stage 2 membranes in Week 3 would have resulted in lower velocities and could have contributed to membrane fouling.
Overall, membrane salt rejection was high and lead to low permeate TDS (see Figure 3.19). The salt passage was steady for the first stage membranes at around 2.5 percent, while the second stage membranes were initially around 2-percent salt passage and increased slightly to around 2.5-percent at the end of the operating period (see Figure 3.16). The important point from this data is that there is no upward or downward trend, which is encouraging. The overall permeate was low enough to meet potable water treatment goals (< 400 mg/L) and allow for some side stream blending to increase overall recovery. TDS levels were fairly constant, even with increases in RO recovery. As will be shown in RO concentrate data, the TDS leaving the RO pilot was over 20,000 mg/L.
3.4.2 Membrane Cleaning
Membrane cleaning was not required during the Phase II study due to the short duration of RO pilot operation. However, it should be noted that a lack of solids carryover from the softening process would have resulted in a substantial decrease in scaling when compared to Phase I results. The 5-micron cartridge filters were not changed during the entire operating period, confirming the low level of suspended material in the RO feed water. No autopsy of the membranes was performed.
3.4.3 Water Quality
Tables 3.6 and 3.7 present summaries of the comprehensive analysis of the RO permeate and concentrate quality, respectively. In general, the membranes prevented passage of greater than 90 percent of all constituents. The TDS of the permeate water ranged from 125 to 321 mg/L (see Figure 3.19).

3-32
Table 3.6 Summary of Water Quality Data: RO Product
Parameter Units Detection Limit(1) Min Avg Max Count
pH pH units - 5.1 5.3 5.6 10
Bicarbonate mg/L 3 0.0 0.5 2.2 10
Total Alkalinity mg/L as CaCO3
3 0.0 0.4 1.8 10
Chloride mg/L 1.0 64 118 190 10
Fluoride mg/L 0.10 0.0 0.0 0.0 10
Nitrate – N mg/L 0.1 1.8 3.6 5.3 10
Sulfate mg/L 1.0 2.9 4.3 8.4 10
Boron mg/L 0.01 0.0 0.1 0.1 10
Calcium mg/L 1.0 0.8 2.1 4.6 10
Hardness(2) mg/L as CaCO3
4.3 9.3 18.1 10
Magnesium mg/L 1.0 0.6 1.0 1.6 10
Potassium mg/L 0.1 0.0 1.5 2.8 10
Silica mg/L as SiO2
1.0 0.5 0.9 1.5 10
Reactive Silica mg/L as SiO2
1.0 0.2 2.2 4.6 10
Sodium mg/L 10 44 81 126 10
Iron µg/L 5.0 0.0 4.0 10.8 10
Manganese µg/L 2.0 0.0 0.0 0.8 10
Aluminum µg/L 5.0 0.0 2.4 8.4 10
Arsenic µg/L 1.0 0.0 0.5 1.0 10
Barium µg/L 1.0 0.1 1.0 3.1 10
Selenium µg/L 2.0 0.3 0.7 1.4 10
Strontium µg/L 1.0 7.5 17.1 33.4 10
Ammonia as N mg/L 1.0 0.0 0.5 0.9 10
Total Dissolved Solids
mg/L 25 125 210 321 9
Total Organic Carbon mg/L 0.7 0.0 0.0 0.1 10
Total Phosphate - P mg/L 0.1 0.0 0.0 0.2 10
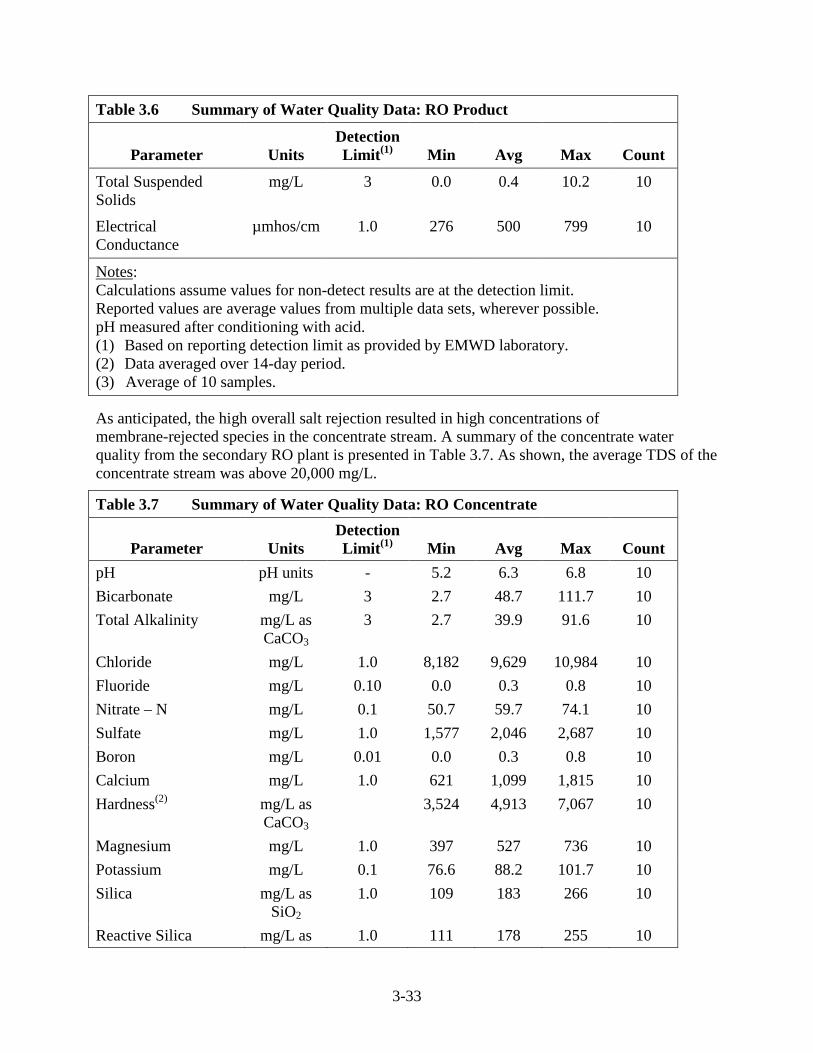
3-33
Table 3.6 Summary of Water Quality Data: RO Product
Parameter Units Detection Limit(1) Min Avg Max Count
Total Suspended Solids
mg/L 3 0.0 0.4 10.2 10
Electrical Conductance
µmhos/cm 1.0 276 500 799 10
NotesCalculations assume values for non-detect results are at the detection limit.
:
Reported values are average values from multiple data sets, wherever possible. pH measured after conditioning with acid. (1) Based on reporting detection limit as provided by EMWD laboratory. (2) Data averaged over 14-day period. (3) Average of 10 samples.
As anticipated, the high overall salt rejection resulted in high concentrations of membrane-rejected species in the concentrate stream. A summary of the concentrate water quality from the secondary RO plant is presented in Table 3.7. As shown, the average TDS of the concentrate stream was above 20,000 mg/L.
Table 3.7 Summary of Water Quality Data: RO Concentrate
Parameter Units Detection Limit(1) Min Avg Max Count
pH pH units - 5.2 6.3 6.8 10 Bicarbonate mg/L 3 2.7 48.7 111.7 10 Total Alkalinity mg/L as
CaCO3 3 2.7 39.9 91.6 10
Chloride mg/L 1.0 8,182 9,629 10,984 10 Fluoride mg/L 0.10 0.0 0.3 0.8 10 Nitrate – N mg/L 0.1 50.7 59.7 74.1 10 Sulfate mg/L 1.0 1,577 2,046 2,687 10 Boron mg/L 0.01 0.0 0.3 0.8 10 Calcium mg/L 1.0 621 1,099 1,815 10 Hardness(2) mg/L as
CaCO3 3,524 4,913 7,067 10
Magnesium mg/L 1.0 397 527 736 10 Potassium mg/L 0.1 76.6 88.2 101.7 10 Silica mg/L as
SiO2 1.0 109 183 266 10
Reactive Silica mg/L as 1.0 111 178 255 10
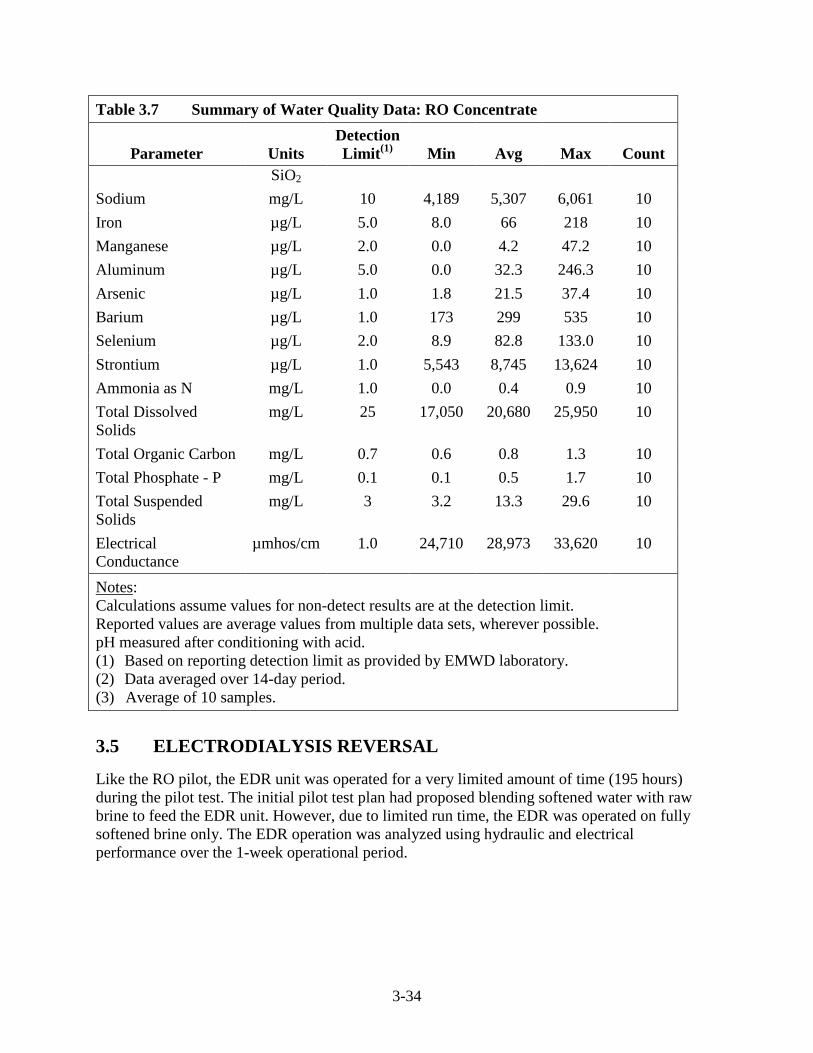
3-34
Table 3.7 Summary of Water Quality Data: RO Concentrate
Parameter Units Detection Limit(1) Min Avg Max Count
SiO2 Sodium mg/L 10 4,189 5,307 6,061 10 Iron µg/L 5.0 8.0 66 218 10 Manganese µg/L 2.0 0.0 4.2 47.2 10 Aluminum µg/L 5.0 0.0 32.3 246.3 10 Arsenic µg/L 1.0 1.8 21.5 37.4 10 Barium µg/L 1.0 173 299 535 10 Selenium µg/L 2.0 8.9 82.8 133.0 10 Strontium µg/L 1.0 5,543 8,745 13,624 10 Ammonia as N mg/L 1.0 0.0 0.4 0.9 10 Total Dissolved Solids
mg/L 25 17,050 20,680 25,950 10
Total Organic Carbon mg/L 0.7 0.6 0.8 1.3 10 Total Phosphate - P mg/L 0.1 0.1 0.5 1.7 10 Total Suspended Solids
mg/L 3 3.2 13.3 29.6 10
Electrical Conductance
µmhos/cm 1.0 24,710 28,973 33,620 10
NotesCalculations assume values for non-detect results are at the detection limit.
:
Reported values are average values from multiple data sets, wherever possible. pH measured after conditioning with acid. (1) Based on reporting detection limit as provided by EMWD laboratory. (2) Data averaged over 14-day period. (3) Average of 10 samples.
3.5 ELECTRODIALYSIS REVERSAL
Like the RO pilot, the EDR unit was operated for a very limited amount of time (195 hours) during the pilot test. The initial pilot test plan had proposed blending softened water with raw brine to feed the EDR unit. However, due to limited run time, the EDR was operated on fully softened brine only. The EDR operation was analyzed using hydraulic and electrical performance over the 1-week operational period.
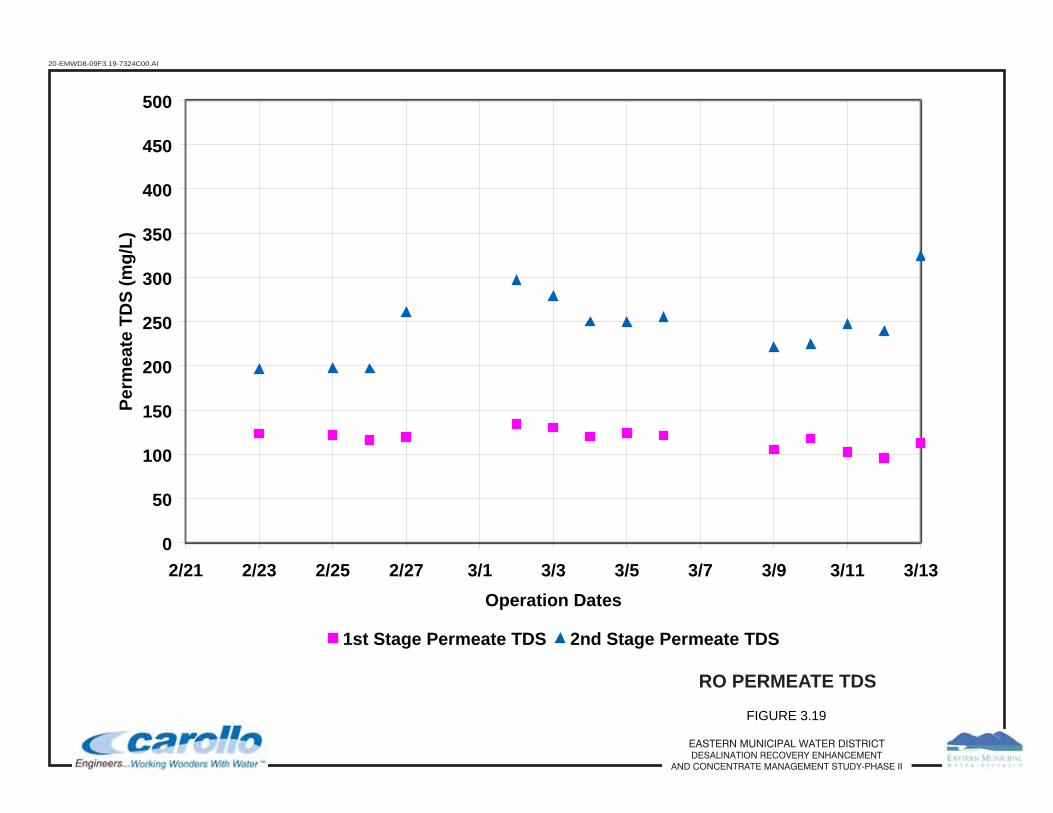
20-EMWD8-09F3.19-7324C00.AI
FIGURE 3.19
EASTERN MUNICIPAL WATER DISTRICTDESALINATION RECOVERY ENHANCEMENT
AND CONCENTRATE MANAGEMENT STUDY-PHASE II
RO PERMEATE TDS
0
50
100
150
200
250
300
350
400
450
500
2/21 2/23 2/25 2/27 3/1 3/3 3/5 3/7 3/9 3/11 3/13Operation Dates
Perm
eate
TD
S (m
g/L)
1st Stage Permeate TDS 2nd Stage Permeate TDS
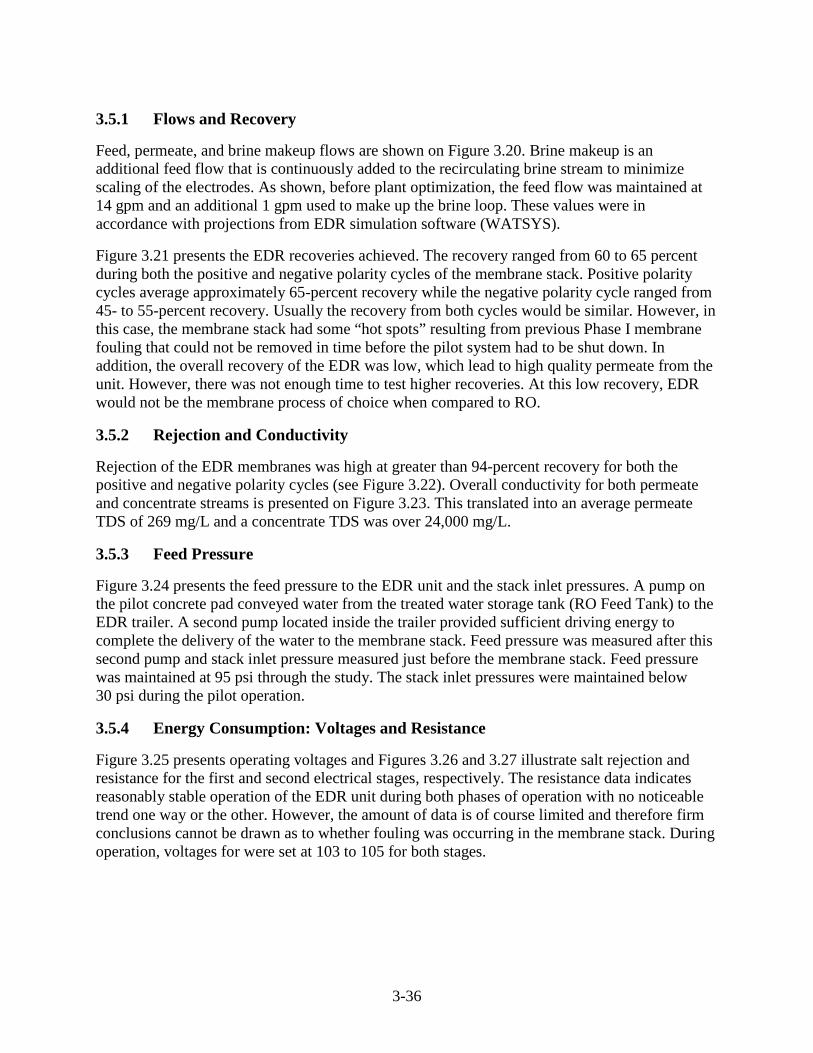
3-36
3.5.1 Flows and Recovery
Feed, permeate, and brine makeup flows are shown on Figure 3.20. Brine makeup is an additional feed flow that is continuously added to the recirculating brine stream to minimize scaling of the electrodes. As shown, before plant optimization, the feed flow was maintained at 14 gpm and an additional 1 gpm used to make up the brine loop. These values were in accordance with projections from EDR simulation software (WATSYS).
Figure 3.21 presents the EDR recoveries achieved. The recovery ranged from 60 to 65 percent during both the positive and negative polarity cycles of the membrane stack. Positive polarity cycles average approximately 65-percent recovery while the negative polarity cycle ranged from 45- to 55-percent recovery. Usually the recovery from both cycles would be similar. However, in this case, the membrane stack had some “hot spots” resulting from previous Phase I membrane fouling that could not be removed in time before the pilot system had to be shut down. In addition, the overall recovery of the EDR was low, which lead to high quality permeate from the unit. However, there was not enough time to test higher recoveries. At this low recovery, EDR would not be the membrane process of choice when compared to RO.
3.5.2 Rejection and Conductivity
Rejection of the EDR membranes was high at greater than 94-percent recovery for both the positive and negative polarity cycles (see Figure 3.22). Overall conductivity for both permeate and concentrate streams is presented on Figure 3.23. This translated into an average permeate TDS of 269 mg/L and a concentrate TDS was over 24,000 mg/L.
3.5.3 Feed Pressure
Figure 3.24 presents the feed pressure to the EDR unit and the stack inlet pressures. A pump on the pilot concrete pad conveyed water from the treated water storage tank (RO Feed Tank) to the EDR trailer. A second pump located inside the trailer provided sufficient driving energy to complete the delivery of the water to the membrane stack. Feed pressure was measured after this second pump and stack inlet pressure measured just before the membrane stack. Feed pressure was maintained at 95 psi through the study. The stack inlet pressures were maintained below 30 psi during the pilot operation.
3.5.4 Energy Consumption: Voltages and Resistance
Figure 3.25 presents operating voltages and Figures 3.26 and 3.27 illustrate salt rejection and resistance for the first and second electrical stages, respectively. The resistance data indicates reasonably stable operation of the EDR unit during both phases of operation with no noticeable trend one way or the other. However, the amount of data is of course limited and therefore firm conclusions cannot be drawn as to whether fouling was occurring in the membrane stack. During operation, voltages for were set at 103 to 105 for both stages.

20-EMWD8-09F3.20-7324C00.AI
FIGURE 3.20
EASTERN MUNICIPAL WATER DISTRICTDESALINATION RECOVERY ENHANCEMENT
AND CONCENTRATE MANAGEMENT STUDY-PHASE II
EDR FEED, PERMEATEAND MAKE-UP FLOWS
0
2
4
6
8
10
12
14
16
3/4 3/5 3/6 3/7 3/8 3/9 3/10 3/11 3/12 3/13 3/14
Date
Flo
w R
ates
(gpm
)Dilute Makeup + Product - Product

20-EMWD8-09F3.21-7324C00.AI
FIGURE 3.21
EASTERN MUNICIPAL WATER DISTRICTDESALINATION RECOVERY ENHANCEMENT
AND CONCENTRATE MANAGEMENT STUDY-PHASE II
EDR RECOVERY
0%
10%
20%
30%
40%
50%
60%
70%
3/4 3/5 3/6 3/7 3/8 3/9 3/10 3/11 3/12 3/13 3/14
Date
Rec
over
y (%
)(+) Recovery (-) Recovery

20-EMWD8-09F3.22-7324C00.AI
FIGURE 3.22
EASTERN MUNICIPAL WATER DISTRICTDESALINATION RECOVERY ENHANCEMENT
AND CONCENTRATE MANAGEMENT STUDY-PHASE II
EDR REJECTION
50%
55%
60%
65%
70%
75%
80%
85%
90%
95%
100%
3/4 3/5 3/6 3/7 3/8 3/9 3/10 3/11 3/12 3/13 3/14
Date
EDR
Rej
ectio
n (%
)(+) Rejection (-) Rejection

20-EMWD8-09F3.23-7324C00.AI
FIGURE 3.23
EASTERN MUNICIPAL WATER DISTRICTDESALINATION RECOVERY ENHANCEMENT
AND CONCENTRATE MANAGEMENT STUDY-PHASE II
EDR PERMEATE AND CONCENTRATE CONDUCTIVITY
0
2
4
6
8
10
12
3/4 3/5 3/6 3/7 3/8 3/9 3/10 3/11 3/12 3/13 3/14
Date
Con
duct
ivity
, mS/
cm
Feed Conductivity (+) Product Conductivity (+) Feed Conductivity (-) Product Conductivity (-)
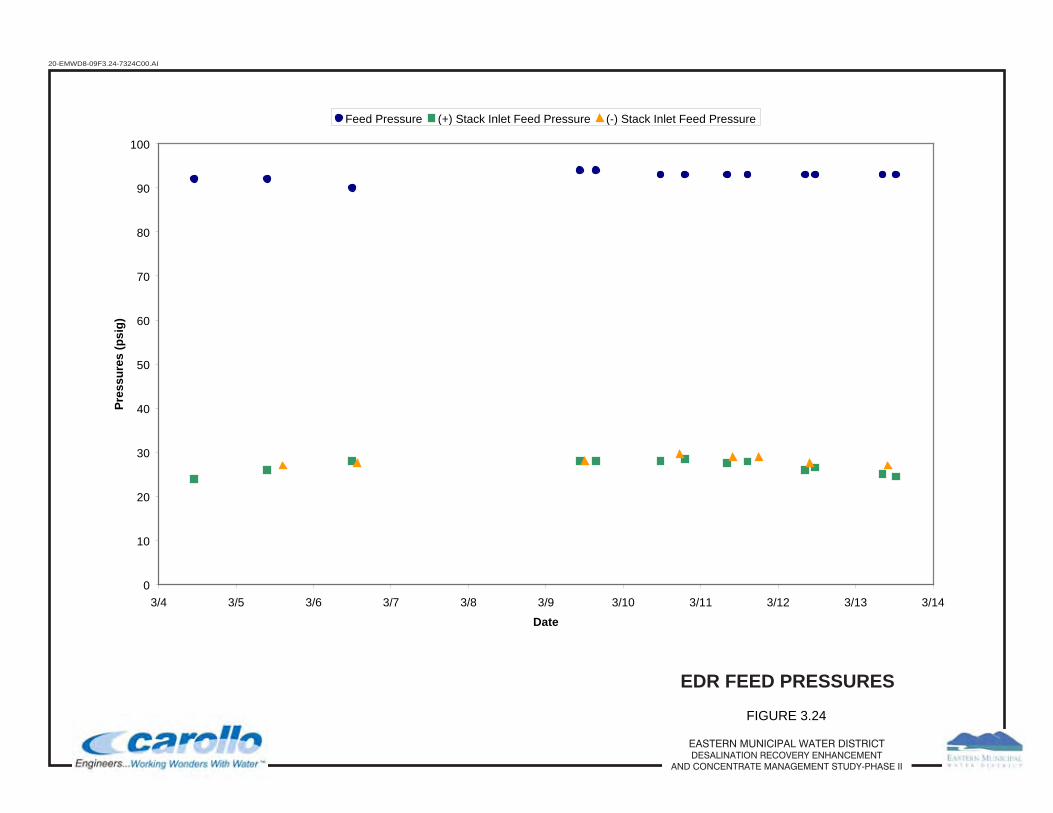
20-EMWD8-09F3.24-7324C00.AI
FIGURE 3.24
EASTERN MUNICIPAL WATER DISTRICTDESALINATION RECOVERY ENHANCEMENT
AND CONCENTRATE MANAGEMENT STUDY-PHASE II
EDR FEED PRESSURES
0
10
20
30
40
50
60
70
80
90
100
3/4 3/5 3/6 3/7 3/8 3/9 3/10 3/11 3/12 3/13 3/14
Date
Pres
sure
s (p
sig)
Feed Pressure (+) Stack Inlet Feed Pressure (-) Stack Inlet Feed Pressure
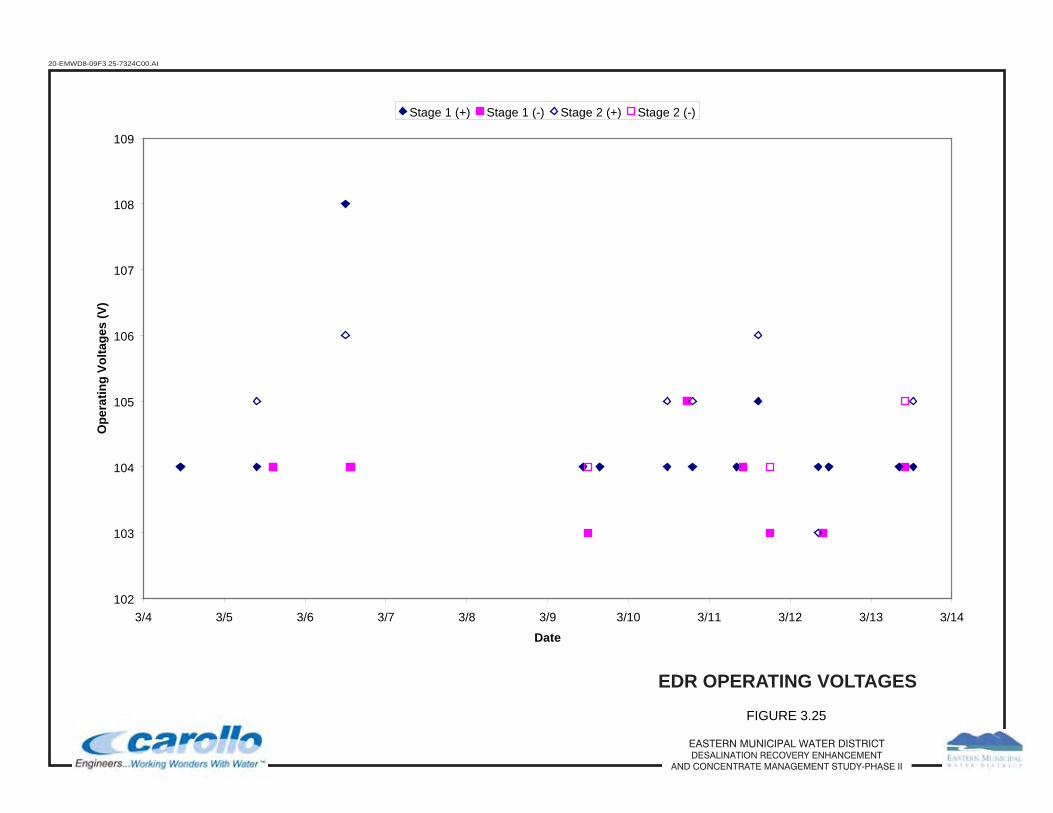
20-EMWD8-09F3.25-7324C00.AI
FIGURE 3.25
EASTERN MUNICIPAL WATER DISTRICTDESALINATION RECOVERY ENHANCEMENT
AND CONCENTRATE MANAGEMENT STUDY-PHASE II
EDR OPERATING VOLTAGES
102
103
104
105
106
107
108
109
3/4 3/5 3/6 3/7 3/8 3/9 3/10 3/11 3/12 3/13 3/14
Date
Ope
ratin
g Vo
ltage
s (V
)Stage 1 (+) Stage 1 (-) Stage 2 (+) Stage 2 (-)

20-EMWD8-09F3.26-7324C00.AI
FIGURE 3.26
EASTERN MUNICIPAL WATER DISTRICTDESALINATION RECOVERY ENHANCEMENT
AND CONCENTRATE MANAGEMENT STUDY-PHASE II
EDR MEMBRANE RESISTANCEWITH SALT REJECTION - STAGE 1
0.0
0.5
1.0
1.5
2.0
2.5
3.0
3.5
3/4 3/5 3/6 3/7 3/8 3/9 3/10 3/11 3/12 3/13 3/14
Date
Res
ista
nce
(ohm
)
50%
55%
60%
65%
70%
75%
80%
85%
90%
95%
100%
Salt
Rej
ectio
n (%
)
Stage 1 Resistance (+) Rejection (+) Stage 1 Resistance (-) Rejection (-)
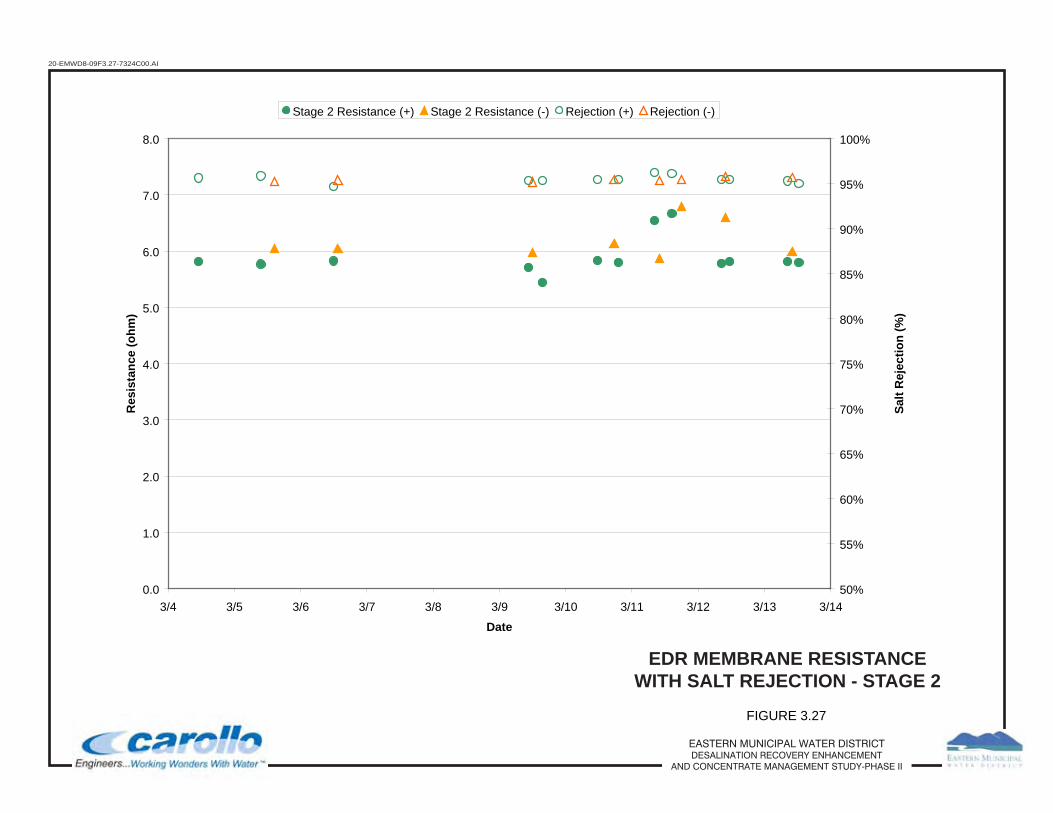
20-EMWD8-09F3.27-7324C00.AI
FIGURE 3.27
EASTERN MUNICIPAL WATER DISTRICTDESALINATION RECOVERY ENHANCEMENT
AND CONCENTRATE MANAGEMENT STUDY-PHASE II
EDR MEMBRANE RESISTANCEWITH SALT REJECTION - STAGE 2
0.0
1.0
2.0
3.0
4.0
5.0
6.0
7.0
8.0
3/4 3/5 3/6 3/7 3/8 3/9 3/10 3/11 3/12 3/13 3/14
Date
Res
ista
nce
(ohm
)
50%
55%
60%
65%
70%
75%
80%
85%
90%
95%
100%
Salt
Rej
ectio
n (%
)
Stage 2 Resistance (+) Stage 2 Resistance (-) Rejection (+) Rejection (-)
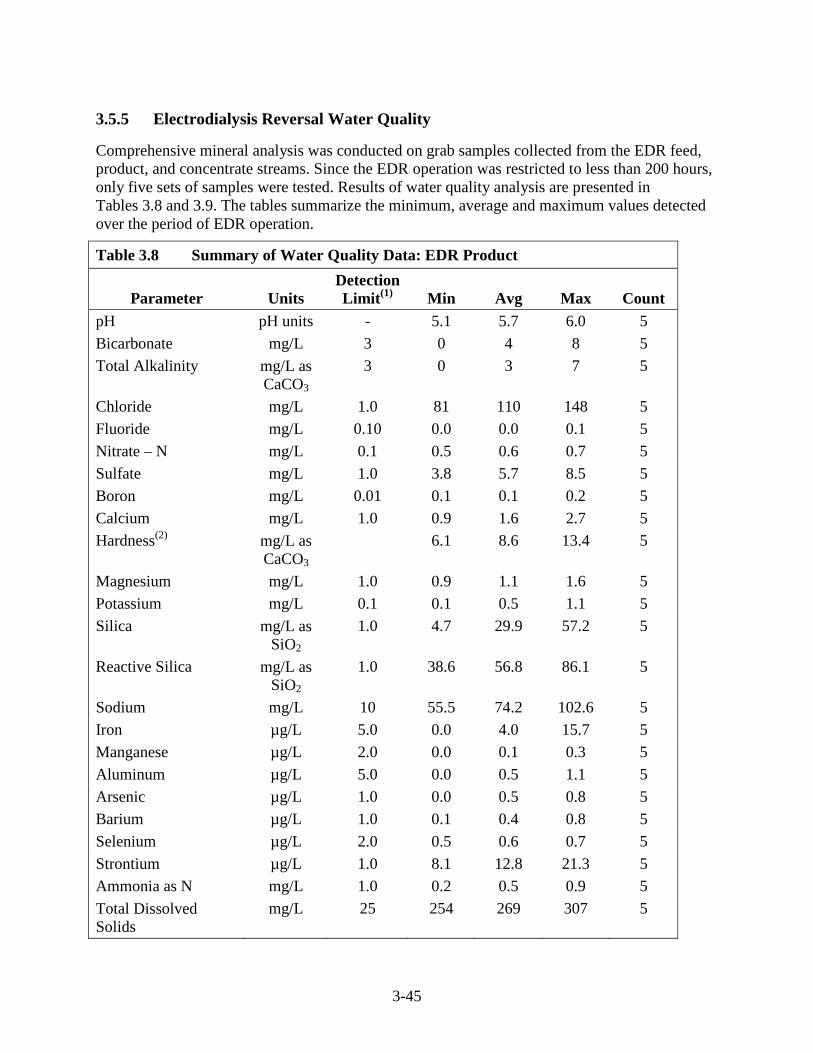
3-45
3.5.5 Electrodialysis Reversal Water Quality
Comprehensive mineral analysis was conducted on grab samples collected from the EDR feed, product, and concentrate streams. Since the EDR operation was restricted to less than 200 hours, only five sets of samples were tested. Results of water quality analysis are presented in Tables 3.8 and 3.9. The tables summarize the minimum, average and maximum values detected over the period of EDR operation.
Table 3.8 Summary of Water Quality Data: EDR Product
Parameter Units Detection Limit(1) Min Avg Max Count
pH pH units - 5.1 5.7 6.0 5 Bicarbonate mg/L 3 0 4 8 5 Total Alkalinity mg/L as
CaCO3 3 0 3 7 5
Chloride mg/L 1.0 81 110 148 5 Fluoride mg/L 0.10 0.0 0.0 0.1 5 Nitrate – N mg/L 0.1 0.5 0.6 0.7 5 Sulfate mg/L 1.0 3.8 5.7 8.5 5 Boron mg/L 0.01 0.1 0.1 0.2 5 Calcium mg/L 1.0 0.9 1.6 2.7 5 Hardness(2) mg/L as
CaCO3 6.1 8.6 13.4 5
Magnesium mg/L 1.0 0.9 1.1 1.6 5 Potassium mg/L 0.1 0.1 0.5 1.1 5 Silica mg/L as
SiO2 1.0 4.7 29.9 57.2 5
Reactive Silica mg/L as SiO2
1.0 38.6 56.8 86.1 5
Sodium mg/L 10 55.5 74.2 102.6 5 Iron µg/L 5.0 0.0 4.0 15.7 5 Manganese µg/L 2.0 0.0 0.1 0.3 5 Aluminum µg/L 5.0 0.0 0.5 1.1 5 Arsenic µg/L 1.0 0.0 0.5 0.8 5 Barium µg/L 1.0 0.1 0.4 0.8 5 Selenium µg/L 2.0 0.5 0.6 0.7 5 Strontium µg/L 1.0 8.1 12.8 21.3 5 Ammonia as N mg/L 1.0 0.2 0.5 0.9 5 Total Dissolved Solids
mg/L 25 254 269 307 5
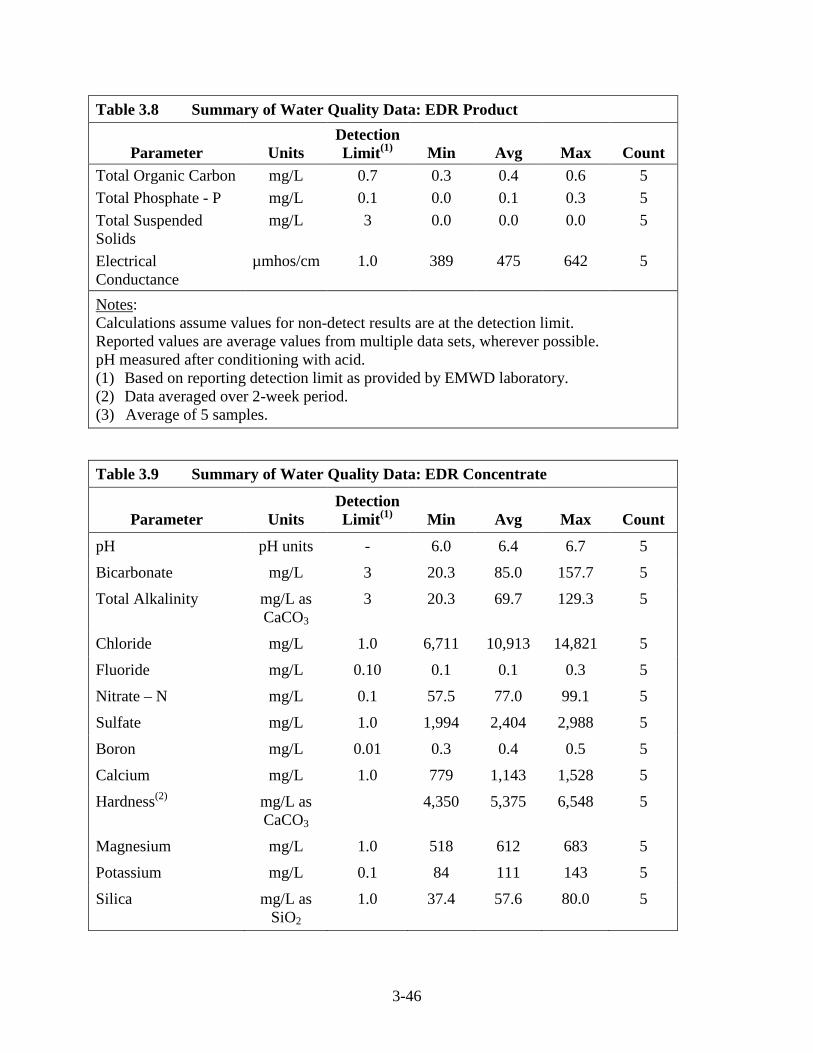
3-46
Table 3.8 Summary of Water Quality Data: EDR Product
Parameter Units Detection Limit(1) Min Avg Max Count
Total Organic Carbon mg/L 0.7 0.3 0.4 0.6 5 Total Phosphate - P mg/L 0.1 0.0 0.1 0.3 5 Total Suspended Solids
mg/L 3 0.0 0.0 0.0 5
Electrical Conductance
µmhos/cm 1.0 389 475 642 5
NotesCalculations assume values for non-detect results are at the detection limit.
:
Reported values are average values from multiple data sets, wherever possible. pH measured after conditioning with acid. (1) Based on reporting detection limit as provided by EMWD laboratory. (2) Data averaged over 2-week period. (3) Average of 5 samples.
Table 3.9 Summary of Water Quality Data: EDR Concentrate
Parameter Units Detection Limit(1) Min Avg Max Count
pH pH units - 6.0 6.4 6.7 5
Bicarbonate mg/L 3 20.3 85.0 157.7 5
Total Alkalinity mg/L as CaCO3
3 20.3 69.7 129.3 5
Chloride mg/L 1.0 6,711 10,913 14,821 5
Fluoride mg/L 0.10 0.1 0.1 0.3 5
Nitrate – N mg/L 0.1 57.5 77.0 99.1 5
Sulfate mg/L 1.0 1,994 2,404 2,988 5
Boron mg/L 0.01 0.3 0.4 0.5 5
Calcium mg/L 1.0 779 1,143 1,528 5
Hardness(2) mg/L as CaCO3
4,350 5,375 6,548 5
Magnesium mg/L 1.0 518 612 683 5
Potassium mg/L 0.1 84 111 143 5
Silica mg/L as SiO2
1.0 37.4 57.6 80.0 5
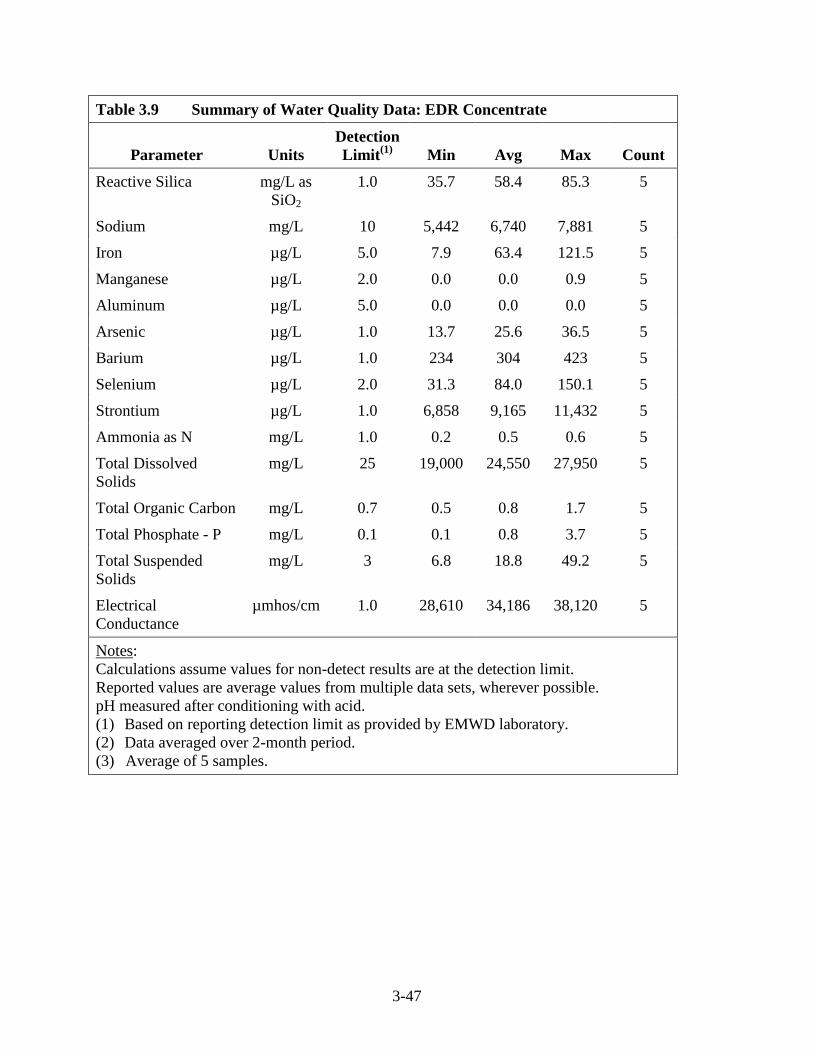
3-47
Table 3.9 Summary of Water Quality Data: EDR Concentrate
Parameter Units Detection Limit(1) Min Avg Max Count
Reactive Silica mg/L as SiO2
1.0 35.7 58.4 85.3 5
Sodium mg/L 10 5,442 6,740 7,881 5
Iron µg/L 5.0 7.9 63.4 121.5 5
Manganese µg/L 2.0 0.0 0.0 0.9 5
Aluminum µg/L 5.0 0.0 0.0 0.0 5
Arsenic µg/L 1.0 13.7 25.6 36.5 5
Barium µg/L 1.0 234 304 423 5
Selenium µg/L 2.0 31.3 84.0 150.1 5
Strontium µg/L 1.0 6,858 9,165 11,432 5
Ammonia as N mg/L 1.0 0.2 0.5 0.6 5
Total Dissolved Solids
mg/L 25 19,000 24,550 27,950 5
Total Organic Carbon mg/L 0.7 0.5 0.8 1.7 5
Total Phosphate - P mg/L 0.1 0.1 0.8 3.7 5
Total Suspended Solids
mg/L 3 6.8 18.8 49.2 5
Electrical Conductance
µmhos/cm 1.0 28,610 34,186 38,120 5
NotesCalculations assume values for non-detect results are at the detection limit.
:
Reported values are average values from multiple data sets, wherever possible. pH measured after conditioning with acid. (1) Based on reporting detection limit as provided by EMWD laboratory. (2) Data averaged over 2-month period. (3) Average of 5 samples.

4-1
Chapter 4
PRELIMINARY CONSTRUCTION COST ESTIMATE
4.1 PURPOSE
The purpose of this chapter is to provide preliminary construction cost estimates (order-of-magnitude) for a full-scale secondary brine recovery system that could treat brine flow from all three EMWD desalters (Menifee and Perris I and II Desalters). This treatment process would consist of the following major components:
• Chemical precipitation/softening process (lime softening).
• Chemical dosing systems.
• Softening effluent filtration.
• Secondary RO. RO was selected for this analysis due to the longer operating time on the RO pilot plant and the lower anticipated capital and operating cost compared to EDR.
• Solids handling system.
• Sludge loading facility.
• Brine disposal (SARI).
A major operational parameter that can significantly affect costs is the recovery of the secondary RO system. In the case of the following cost analysis, overall process costs were evaluated based on an RO recovery of 70, 75, and 80 percent to establish the sensitivity of RO recovery on cost. Therefore, a range of costs is presented. It should be noted that, during pilot testing operation of Phase II, the secondary RO recovery was continuously held at 70 percent. However, Phase I results showed operation to a maximum of 77 percent. Based on the much better performance of the softening and media filtration processes under Phase II, higher recoveries should be possible even though there was not adequate operational time to test higher recoveries.
4.2 COST ESTIMATE ASSUMPTIONS
Several baseline cost assumptions were required to complete the cost estimate for the secondary recovery system. These assumptions include operation and maintenance (O&M) factors, such as the cost for power, chemicals, potable water retail values, brine disposal costs, etc., and estimates of process capital cost based on past projects and vendor quotes.
4.2.1 Desalter Streams and Flows
For all treatment scenarios, brine treatment costs were estimated for all existing and future EMWD desalters. In the current analysis, it was assumed that the total well field flow (17,100 acre-feet per year (AFY)) was available for RO treatment and that the recovery from all three RO plants would be 70 percent. This results in 11,970 AFY of produced potable water and 5,130 AFY (4.6 mgd) of brine reject, requiring secondary treatment. Therefore, secondary treatment processes were sized assuming a brine influent flow of 4.6 mgd. The resulting, overall

4-2
system recovery and brine stream volume for disposal to the SARI line depends on the assumed secondary RO system recovery (70 to 80 percent).
4.2.2 Base Operation and Maintenance Cost Assumptions
Table 4.1 lists the pertinent O&M cost assumptions used in the process cost estimate.
Table 4.1 O&M Cost Assumptions
Parameter Value Units
Labor Costs (with benefits) 47.75 $/hr
Lime (Quicklime - 90% Purity) 130 $/ton
Soda Ash (100%) 0.20 $/lb
Sulfuric Acid (93%) 3.50 $/gallon
RO Membrane Replacement 0.16 $/1,000 gallons RO Chemicals (anti-scalants, etc.) 0.07 $/1,000 gallons
Electrical Power 0.13 $/kWhr
Sludge Disposal 55 $/ton
Potable Water (Retail) 888.25 $/AF
Import Water Costs (MWD) 503 $/AF
SARI Line Capacity (Purchased) 4.6 mgd
SARI Flow Fee 840 $/mgd/day
SARI BOD Fee 283 $/1,000 lbs/day
SARI TSS Fee 420 $/1,000 lbs/day
SARI Fixed Pipe Fee 2,581 $/month
SARI Fixed Treatment Fee 6,452 $/month
SARI Line Capacity Cost 3,750,000 $/mgd
SARI Line Treatment Costs (OCSD) 4,547,249 $/mgd
Water recovered from the secondary RO process was assumed to have a retail value of $888.25/acre-foot (AF) (current EMWD retail value) and was calculated as additional revenue for the project. This water was assumed to offset imported water demands (Tier 1, untreated).
SARI disposal costs significantly affect the overall feasibility of secondary brine treatment. Brine treatment by secondary RO will ultimately reduce the brine volume from the EMWD desalters and reduce the overall SARI line capacity required. At ultimate build-out, any excess capacity would still demand payments for SARI line capacity and Orange County Sanitation District (OCSD) treatment capacity.
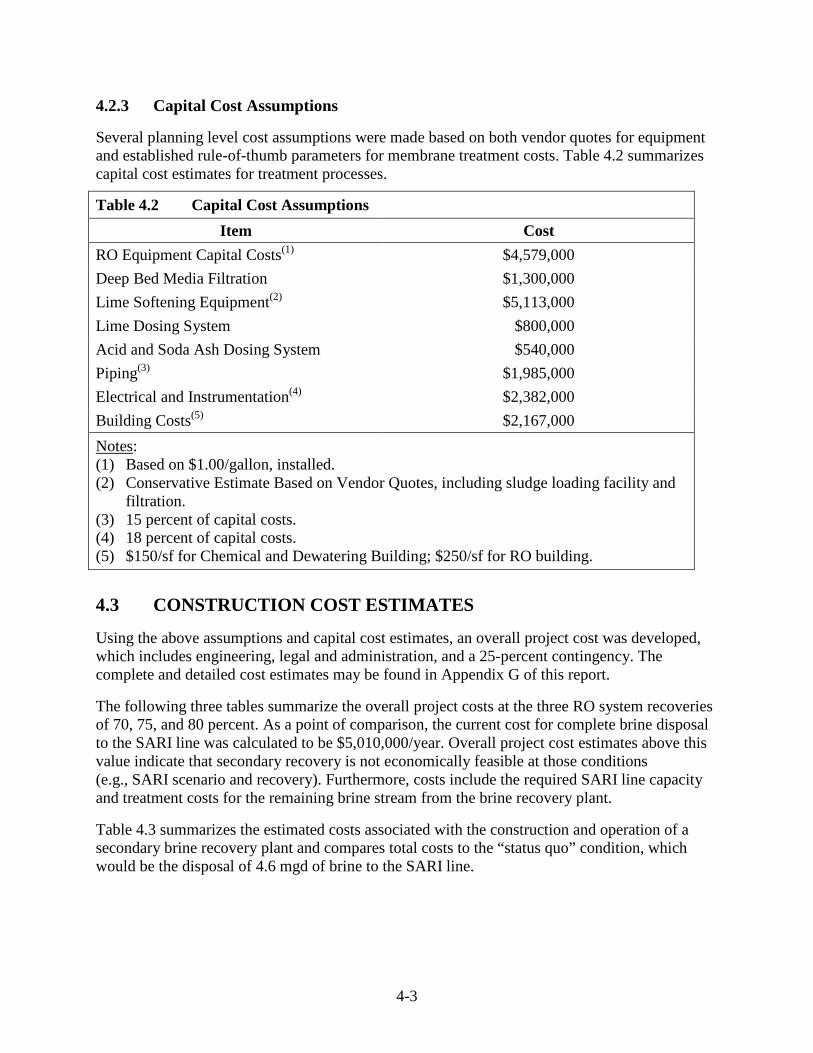
4-3
4.2.3 Capital Cost Assumptions
Several planning level cost assumptions were made based on both vendor quotes for equipment and established rule-of-thumb parameters for membrane treatment costs. Table 4.2 summarizes capital cost estimates for treatment processes.
Table 4.2 Capital Cost Assumptions Item Cost
RO Equipment Capital Costs $4,579,000 (1) Deep Bed Media Filtration $1,300,000 Lime Softening Equipment $5,113,000 (2) Lime Dosing System $800,000 Acid and Soda Ash Dosing System $540,000 Piping $1,985,000 (3) Electrical and Instrumentation $2,382,000 (4) Building Costs $2,167,000 (5) Notes(1) Based on $1.00/gallon, installed.
:
(2) Conservative Estimate Based on Vendor Quotes, including sludge loading facility and filtration.
(3) 15 percent of capital costs. (4) 18 percent of capital costs. (5) $150/sf for Chemical and Dewatering Building; $250/sf for RO building.
4.3 CONSTRUCTION COST ESTIMATES
Using the above assumptions and capital cost estimates, an overall project cost was developed, which includes engineering, legal and administration, and a 25-percent contingency. The complete and detailed cost estimates may be found in Appendix G of this report.
The following three tables summarize the overall project costs at the three RO system recoveries of 70, 75, and 80 percent. As a point of comparison, the current cost for complete brine disposal to the SARI line was calculated to be $5,010,000/year. Overall project cost estimates above this value indicate that secondary recovery is not economically feasible at those conditions (e.g., SARI scenario and recovery). Furthermore, costs include the required SARI line capacity and treatment costs for the remaining brine stream from the brine recovery plant.
Table 4.3 summarizes the estimated costs associated with the construction and operation of a secondary brine recovery plant and compares total costs to the “status quo” condition, which would be the disposal of 4.6 mgd of brine to the SARI line.

4-4
Table 4.3 Construction Cost Estimates Parameters Units RO Recovery
Secondary RO Recovery
Percentage 70 75 80
Overall Recovery Percentage 91 93 95 Treatment Costs
Capital Costs $/year (1) $2,878,000 $2,884,000 $2,890,000 Chemical Costs $/year (2) $1,476,000 $1,479,000 $1,482,000 Sludge Disposal Costs
$/year $1,967,000 $1,967,000 $1,967,000
O&M Costs for RO, Media Filtration, Pumping
$/year $1,133,000 $1,146,000 $1,159,000
Brine Disposal $/year $554,000 $480,000 $405,000 Total Treatment Costs (excluding revenue)
$/year $5,130,000 $5,072,000 $5,014,000
Income from Generated Water
$/year $3,190,000 $3,418,000 $3,645,000
Avoided Import Water Costs
$/year $1,806,000 $1,935,000 $2,064,000
Total Operating Costs (w/Revenue)
$/year $134,000 ($281,000) ($696,000)
Total Annual Costs $/year $3,012,000 $2,603,000 $2,194,000 Total Cost $/AF (3) 839 676 535 Brine Disposal (Status Quo)
$/year $5,010,000 $5,010,000 $5,010,000
Notes(1) Capital costs amortized over 20 years at 6-percent average interest rate.
:
(2) Chemical costs increase slightly with recovery due to additional product water chlorine and ammonia usage.
(3) Based on potable water produced from secondary treatment.
Figure 4.1 summarizes the different water and revenue streams for status quo treatment and brine recovery. For comparison, it was assumed that in the status quo scenario, 3,591 AFY of raw imported water would be brought into EMWD’s system to make up the production to 15,561 AFY (the amount that the desalters would produce if secondary treatment was added). As indicated by Figure 4.1 and the figures in the tables, the project would be advantageous at all the three listed recoveries when assuming factoring in potable water for sale to customers and avoided imported water costs (which will increase in expense over time). Based on these assumptions, EMWD would increase revenue by about $1.7 million from the baseline condition
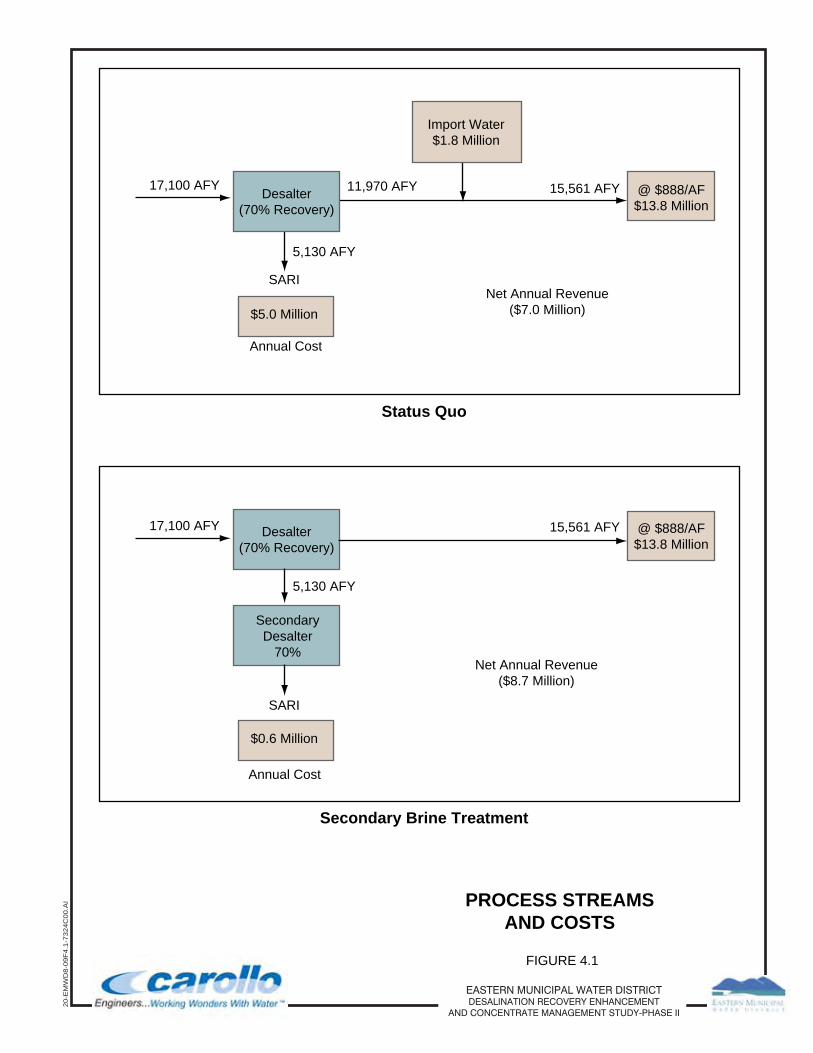
PROCESS STREAMSAND COSTS
FIGURE 4.1
20-E
MW
D8-
09F
4.1-
7324
C00
.AI
EASTERN MUNICIPAL WATER DISTRICTDESALINATION RECOVERY ENHANCEMENT
AND CONCENTRATE MANAGEMENT STUDY-PHASE II
17,100 AFY
5,130 AFY
11,970 AFY
SARI
Desalter(70% Recovery)
Desalter(70% Recovery)
$5.0 Million
Annual Cost
Status Quo
17,100 AFY 15,561 AFY
Net Annual Revenue($8.7 Million)
Net Annual Revenue($7.0 Million)
5,130 AFY
$0.6 Million
@ $888/AF$13.8 Million
15,561 AFY @ $888/AF$13.8 Million
Import Water$1.8 Million
Annual Cost
Secondary Brine Treatment
SecondaryDesalter
70%
SARI
4-6
of brine disposal to the SARI line. As shown, the greater recovery of water from the brine stream results in greater potable water revenue, avoided imported water costs, and lower brine disposal costs. All of these factors help to lower the cost of secondary brine recovery and saves money when compared to the status quo approach.
4.4 SITE LAYOUT
As part of this project, a preliminary site layout was developed for an initial brine recovery system (Figure 4.2). This layout was based on an initial product water flow of 1 mgd and the design parameters arrived at in pilot testing and subsequently used in the development of the cost estimate. As shown on Figure 4.2, the layout shows the use of lime and soda ash for softening, a solids contact clarifier, media filtration, and secondary RO. Additional facilities were included for chemical storage, preparation, and storage, sludge dewatering, and solids unloading. This preliminary layout includes additional space for a second phase of RO expansion.
4.5 CONCLUSIONS
As shown in Table 4.3, the cost for treatment with a secondary RO process is already advantageous based on today’s disposal costs. However, escalating SARI disposal costs will most likely make this project more attractive in the long term. Increased RO recovery leads to greater resource recovery, lower imported water demands, lower demand on the SARI line, and in-kind water revenues. Therefore, recovering more water from the primary RO brine stream is beneficial to EMWD and to the region as a whole. Furthermore, analysis has shown that, in order to make secondary treatment more competitive compared to current SARI disposal, excess SARI line capacity should be sold to free up funds dedicated to excess capacity capital costs. The income generated from selling excess SARI capacity would allow the secondary RO brine recovery process to offset the financial burden of excess SARI capacity capital costs.
Some additional salient features of the cost estimates include the following:
• Chemical consumption costs are significant. It has been assumed that the lime/soda ash approach is less expensive than using caustic soda. However, the lime soda ash, in turn, produces greater quantities of sludge for disposal given the additional solids loading from lime.
• Sludge disposal costs are significant and dependent on the sludge disposal rate. A conservative, yet realistic, sludge disposal rate of $55 per ton was used based on quotes from Nursery Products. However, the possibility of finding a beneficial use for the calcium carbonate rich sludge still exists. If such a source were found, the financial benefits of the project would increase significantly.
• Recovered water from the secondary process generated almost enough revenue to offset chemical consumption and sludge disposal costs.
It is important to note that the cost estimates did not evaluate the effect of increasing SARI disposal costs or increased OCSD treatment costs in the future. It is likely that SARI fees will increase in the future, especially if problems with SARI line scaling or the presence of contaminants like nitrates and suspended solids become problematic.

FIGURE 4.2
CONCEPTUAL BRINE RECOVERY PLANT LAYOUT -
1 MGD RO PERMEATE
20-E
MW
D8-
09F
4.2-
7324
C00
.AI
EASTERN MUNICIPAL WATER DISTRICTDESALINATION RECOVERY ENHANCEMENT
AND CONCENTRATE MANAGEMENT STUDY-PHASE II

5-1
Chapter 5
CONCLUSIONS
5.1 CONCLUSIONS
In general, Phase II pilot testing showed that secondary brine recovery is technically feasible. While solids carryover was the primary impediment to good downstream membrane performance in Phase I, this issue was resolved in Phase II testing. Although Phase II operational time was limited, the pilot process (softening followed by pH adjustment, media filtration, and secondary desalting) was able to run uninterrupted for several days at a time. The largest obstacles to operation of the pilot facility were issues with faulty equipment and project delays. Most notably, dealing with large volumes of sludge for disposal as part of a pilot project was a major challenge, and the delay of the project into the winter months resulted in problems with the freezing of soda ash. However, once these obstacles were ultimately overcome, secondary softening with lime and soda ash proved to be very effective in reducing the levels of constituents in the brine stream that would be responsible for downstream membrane process scaling. As part of this phase of testing, particular attention was paid to the handling and dewaterability of softening sludge. Ultimately, it was found that the lime softening sludge settled very well and was easily dewatered to produce up to 55- to 60-percent (dry solids) cake.
Specific findings of this project were as follows:
1. The chemical softening process was optimized for removal of calcium and silica. Both lime and soda ash were required at high doses (960 and 1,280 mg/L, respectively). Excellent removal of calcium and silica was achieved during chemical softening. The secondary RO) process operated at 70-percent recovery, which would achieve an overall recovery of brackish well water of 91 percent. Modeling indicated that the secondary RO process could operate at a recovery as high as 77 percent if low silica concentrations in the softened brine can be maintained such as those obtained in Phase I. When combined with the primary desalter recovery level of 70 percent, this would achieve an overall recovery of 93 percent.
2. Due to softening, very high solids loads were produced, even more so than in Phase I testing. Approximately 300 pounds of solids were generated every hour at an influent flow rate of 50 gpm. This equates to more than 80 tons per day of dewatered solids at a feed flow of 4.6 mgd. Based on laboratory analysis, it was determined that the softening sludge was 97-percent calcium carbonate.
3. The CONTRAFAST® system achieved high quality effluent turbidity (< 20 NTU at all times), resulting in a significantly lower solids load to downstream media filtration.
4. Deep bed media filtration produced RO and EDR feed water that was of high quality with SDIs consistently lower than 3 and turbidities < 0.2 NTU.
5. The RO unit produced high-quality, low-TDS (less than 400 mg/L) water that could be blended into the potable water system.
6. RO membrane performance data was limited due to time constraints, but did indicate that the unit could operate without fouling at a recovery of 71 percent. Higher recoveries
5-2
should be possible based on modeling results, if consistently low silica concentrations can be maintained. Furthermore, the absence of solids carryover from the softening step means that, unlike in Phase I operation, particulate fouling potential should be dramatically reduced. The RO pilot unit did not operate long enough to specifically determine the required membrane cleaning frequency. However, a conservative cost estimate was used for RO CIP chemicals, which should provide chemicals for monthly cleanings.
7. The EDR pilot unit demonstrated the ability to produce acceptable permeate quality (TDS ~400 mg/L), however, data was limited. When in production, the recovery of the EDR unit was around 60 to 65 percent. Time was not available to push the EDR unit to higher recoveries.
8. A cost model developed around the treatment combination of chemical softening followed by RO (operating at a conservative recovery of 70 percent) showed that recovering additional potable water by this method (total recovery of 91 percent) and discharging the resulting brine stream to the SARI line would cost about $4 million per year less than the current status quo approach. As SARI disposal costs increase in the future and imported water costs rise further, the secondary brine recovery approach will become more economically viable.
9. The cost model assumes that the calcium carbonate rich sludge from the process would be disposed of to landfill at an annual cost of about $2 million. If a beneficial user could be found, the disposal cost could be significantly reduced or even converted to a net income.
10. The control of softening pH would be critical in a full-scale plant since the pH level will determine the degree of silica removal from the brine stream. Silica levels will, in turn, dictate RO recovery. Therefore, consistent pH control and removal of silica to target levels is essential to prevent the scaling of RO membranes.
A-1
Appendix A
OPERATOR LOG SHEETS

EMWD: PROP 50 PILOT PLANTHARN RO OPERATOR LOG
DATE: OPERATOR:
TIME: HOUR METER READING:
FEED SDI: FILTRATE SDI:
FEED TEMP: PERMEATE pH: 1st Stage: 2nd Stage:
FEEd pH: CONCENTRATE pH:
CARTRIDGE FILTER INLET PRESSURE: CARTRIDGE FILTER OUTLET PRESSURE:
PUMP PRESSURE: (at RO feed pump discharge)
Stage 1 Feed Pressure: Stage 2 Feed Pressre:
Stage 1 Concentrate Pressure: Stage 1 ∆P: Total System ∆P:
Stage 2 Concentrate Pressure: Stage 2 ∆P: Total System ∆P:
PERMEATE PRESSURE: Stage 1: Stage 2: Total:
FEED CONDUCTIVITY: % REJECTION:
PERMEATE CONDUCTIVITY: Stage 1: Stage 2: Total System:
INTRASTAGE CONDUCTIVITY: V1-1: V1-2: V2-1:
CONCENTRATE CONDUCTIVITY:
FEED: PERMEATE: Stage 1: Stage 2: Total System:
CONCENTRATE FLOW: RECYCLE FLOW:
RECOVERY: BLEND FLOW:
BOOSTER Speed: Hz: RO FEED Speed: Hz:
STAGE 2 Speed: Hz:
COMMENTS:
PUMP SET POINTS
PRESSURE READINGS [psi]
SDI & pH READINGS
CONDUCTIVITY READINGS [µS/cm]
FLOW READINGS [GPM]
INTERSTAGE CONDUCTIVITY:
7/24/2009 RO_Log_-_Blank.xlspw://Carollo/Documents/Client/CA/EMWD/7324C00/Deliverables/Report/NWRI/Appendix A.pdf
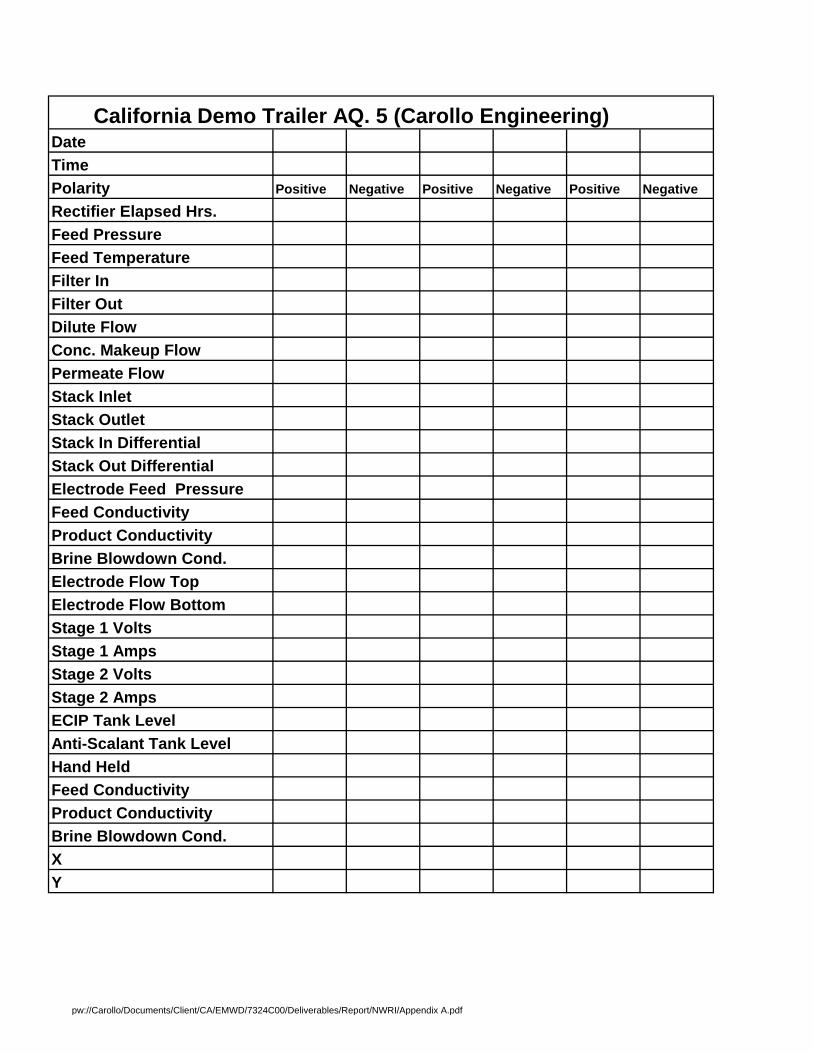
DateTimePolarity Positive Negative Positive Negative Positive Negative
Rectifier Elapsed Hrs.Feed PressureFeed TemperatureFilter InFilter OutDilute FlowConc. Makeup FlowPermeate FlowStack InletStack OutletStack In DifferentialStack Out DifferentialElectrode Feed PressureFeed ConductivityProduct ConductivityBrine Blowdown Cond.Electrode Flow TopElectrode Flow BottomStage 1 VoltsStage 1 AmpsStage 2 VoltsStage 2 AmpsECIP Tank LevelAnti-Scalant Tank LevelHand HeldFeed ConductivityProduct ConductivityBrine Blowdown Cond.XY
California Demo Trailer AQ. 5 (Carollo Engine ering)
pw://Carollo/Documents/Client/CA/EMWD/7324C00/Deliverables/Report/NWRI/Appendix A.pdf
B-1
Appendix B
PILOT PLANT OPERATIONAL HISTORY AND NOTED PROBLEMS
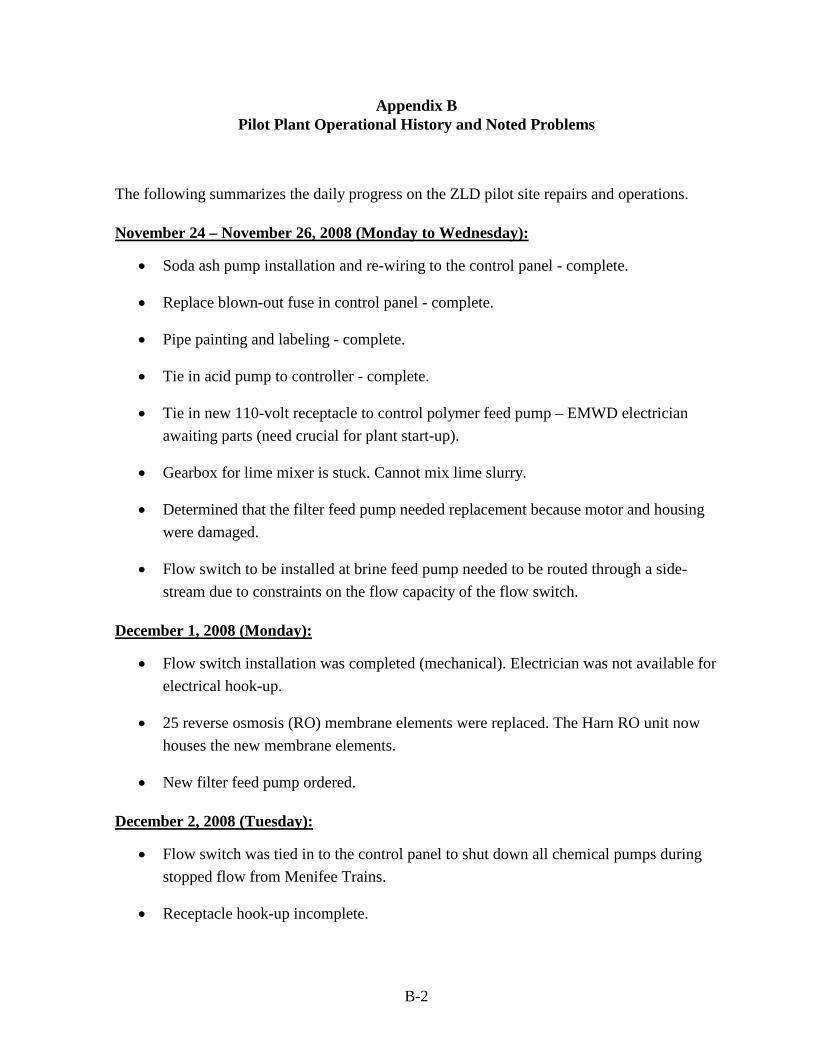
B-2
Appendix B Pilot Plant Operational History and Noted Problems
The following summarizes the daily progress on the ZLD pilot site repairs and operations.
November 24 – November 26, 2008 (Monday to Wednesday):
• Soda ash pump installation and re-wiring to the control panel - complete.
• Replace blown-out fuse in control panel - complete.
• Pipe painting and labeling - complete.
• Tie in acid pump to controller - complete.
• Tie in new 110-volt receptacle to control polymer feed pump – EMWD electrician awaiting parts (need crucial for plant start-up).
• Gearbox for lime mixer is stuck. Cannot mix lime slurry.
• Determined that the filter feed pump needed replacement because motor and housing were damaged.
• Flow switch to be installed at brine feed pump needed to be routed through a side-stream due to constraints on the flow capacity of the flow switch.
December 1, 2008 (Monday):
• Flow switch installation was completed (mechanical). Electrician was not available for electrical hook-up.
• 25 reverse osmosis (RO) membrane elements were replaced. The Harn RO unit now houses the new membrane elements.
• New filter feed pump ordered.
December 2, 2008 (Tuesday):
• Flow switch was tied in to the control panel to shut down all chemical pumps during stopped flow from Menifee Trains.
• Receptacle hook-up incomplete.
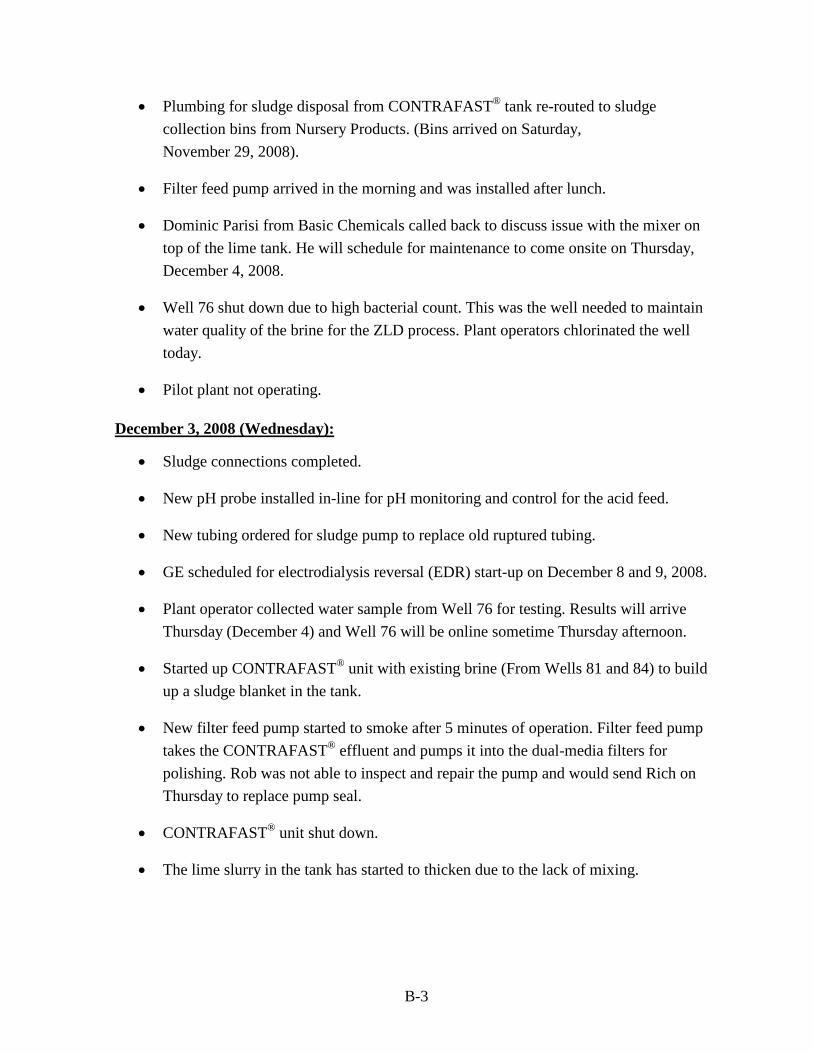
B-3
• Plumbing for sludge disposal from CONTRAFAST® tank re-routed to sludge collection bins from Nursery Products. (Bins arrived on Saturday, November 29, 2008).
• Filter feed pump arrived in the morning and was installed after lunch.
• Dominic Parisi from Basic Chemicals called back to discuss issue with the mixer on top of the lime tank. He will schedule for maintenance to come onsite on Thursday, December 4, 2008.
• Well 76 shut down due to high bacterial count. This was the well needed to maintain water quality of the brine for the ZLD process. Plant operators chlorinated the well today.
• Pilot plant not operating.
December 3, 2008 (Wednesday):
• Sludge connections completed.
• New pH probe installed in-line for pH monitoring and control for the acid feed.
• New tubing ordered for sludge pump to replace old ruptured tubing.
• GE scheduled for electrodialysis reversal (EDR) start-up on December 8 and 9, 2008.
• Plant operator collected water sample from Well 76 for testing. Results will arrive Thursday (December 4) and Well 76 will be online sometime Thursday afternoon.
• Started up CONTRAFAST® unit with existing brine (From Wells 81 and 84) to build up a sludge blanket in the tank.
• New filter feed pump started to smoke after 5 minutes of operation. Filter feed pump takes the CONTRAFAST® effluent and pumps it into the dual-media filters for polishing. Rob was not able to inspect and repair the pump and would send Rich on Thursday to replace pump seal.
• CONTRAFAST® unit shut down.
• The lime slurry in the tank has started to thicken due to the lack of mixing.

B-4
December 4, 2008 (Thursday):
• The filter feed pump was dissembled to determine the extent of damage on the pump. There was a rag in the pump intake line that was lodged into the impeller. The damage was similar to what had occurred to the first filter feed pump.
• Ryan Herco contacted Serfilco (pump manufacturer) and they wanted us to send the pump back for repair since it was still under warrantee.
• Basic Chemicals maintenance person confirmed that the gearbox was stuck. To replace the gearbox would require taking apart the shaft from the mixer and it is a two-man operation. Repair is scheduled for December 9, 2008 (Tuesday).
• Siemens Corporation (Siemens) called to confirm CONTRAFAST® operation because they are scheduled to come on Monday (December 8) with clients for on-site visit.
December 5, 2008 (Friday):
• Well 76 back online.
• Rescheduled with GE for EDR start-up. Without the filter feed pump, the softened water from the CONTRAFAST® could not be pumped through the dual-media filters for polishing and there would be no water in the feed tank for EDR start-up. Tentative EDR start-up date is scheduled for December 11, 2008 (Tuesday).
• Harn RO confirmed that the new membranes can remain in the pressure vessels for 1 to 2 weeks without operation. Beyond that, it would require flushing every other day to prevent the membranes from drying up.
• New filter feed pump housing ordered from Ryan Herco. Scheduled delivery date is for December 6, 2008 (Saturday).
• Siemens offered to fly in on Sunday to perform site repairs.
February 27, 2009 (Friday):
1. Pump seal on the sludge recirculation pump broke in the night and sent sludge shooting through the air and there’s a dense sludge blanket on site. Calcium carbonate snow.
2. Request vac box for additional sludge storage capacity on site.
3. Sludge line clogged – Tom surmised that the buildup at the bottom of the tank has gotten too thick and reached toothpaste consistency.
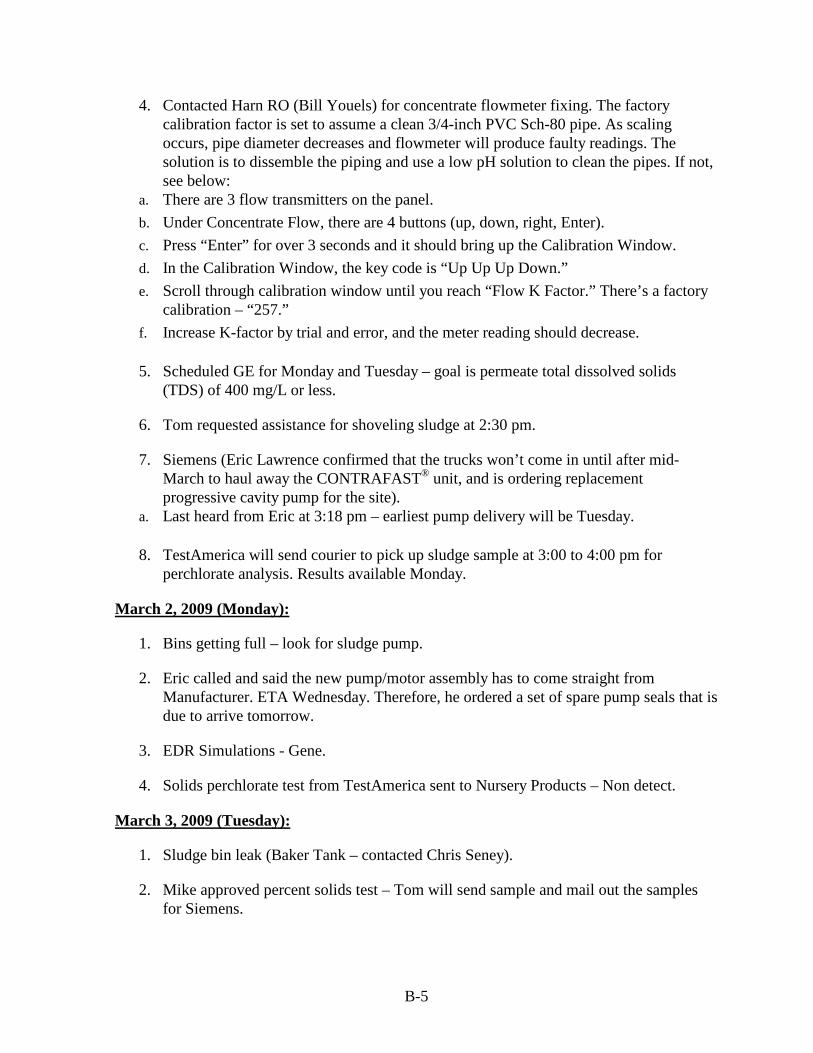
B-5
4. Contacted Harn RO (Bill Youels) for concentrate flowmeter fixing. The factory calibration factor is set to assume a clean 3/4-inch PVC Sch-80 pipe. As scaling occurs, pipe diameter decreases and flowmeter will produce faulty readings. The solution is to dissemble the piping and use a low pH solution to clean the pipes. If not, see below:
a. There are 3 flow transmitters on the panel. b. Under Concentrate Flow, there are 4 buttons (up, down, right, Enter). c. Press “Enter” for over 3 seconds and it should bring up the Calibration Window. d. In the Calibration Window, the key code is “Up Up Up Down.” e. Scroll through calibration window until you reach “Flow K Factor.” There’s a factory
calibration – “257.” f. Increase K-factor by trial and error, and the meter reading should decrease.
5. Scheduled GE for Monday and Tuesday – goal is permeate total dissolved solids (TDS) of 400 mg/L or less.
6. Tom requested assistance for shoveling sludge at 2:30 pm.
7. Siemens (Eric Lawrence confirmed that the trucks won’t come in until after mid-March to haul away the CONTRAFAST® unit, and is ordering replacement progressive cavity pump for the site).
a. Last heard from Eric at 3:18 pm – earliest pump delivery will be Tuesday.
8. TestAmerica will send courier to pick up sludge sample at 3:00 to 4:00 pm for perchlorate analysis. Results available Monday.
March 2, 2009 (Monday):
1. Bins getting full – look for sludge pump.
2. Eric called and said the new pump/motor assembly has to come straight from Manufacturer. ETA Wednesday. Therefore, he ordered a set of spare pump seals that is due to arrive tomorrow.
3. EDR Simulations - Gene.
4. Solids perchlorate test from TestAmerica sent to Nursery Products – Non detect.
March 3, 2009 (Tuesday):
1. Sludge bin leak (Baker Tank – contacted Chris Seney).
2. Mike approved percent solids test – Tom will send sample and mail out the samples for Siemens.

B-6
3. Replacement seal arrived for the Sludge Recirc Pump. Turns out that the pump itself is broken. New pump arriving tomorrow.
4. Tom called to verify lime dose for the system. At 0.2 L/min setting, the actual lime flow rate is closer to 300 mL/min. At this dosing rate for 50 gpm, CONTRAFAST® pH is at 9.9 to 10 with total hardness of 1,400 mg/L and Si of 60 mg/L. At 0.3 L/min setting, the actual lime flow rate is around 420 mL/min, pH varying between 10.3 to 10.5, silica level is around 38 to 40 mg/L, and the total hardness is around 1,200 mg/L. Conferred with Graham and decided to keep 0.2 L/min setting, but lower the feed to around 47 to 48 gpm to bump the pH up a little to enhance Mg co-precipitation with Si.
C-1
Appendix C
RO MODELING RESULTS - 77-PERCENT RECOVERY
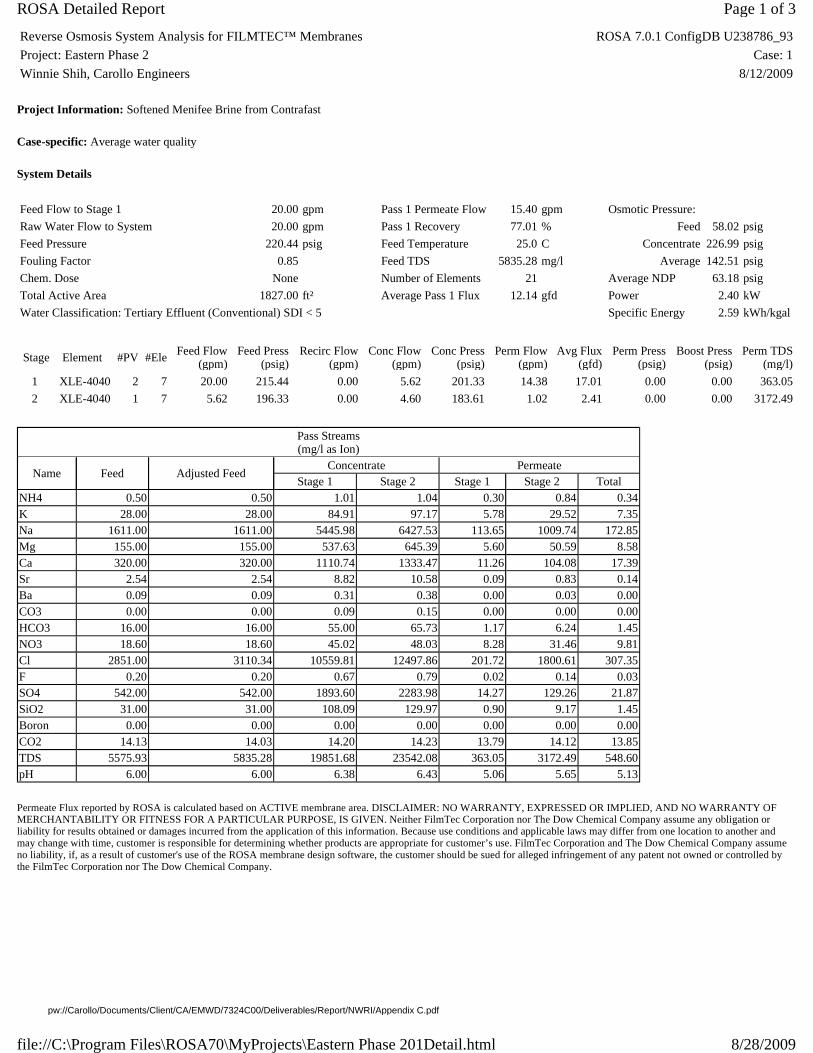
Project Information: Softened Menifee Brine from Contrafast
Case-specific: Average water quality
System Details
Permeate Flux reported by ROSA is calculated based on ACTIVE membrane area. DISCLAIMER: NO WARRANTY, EXPRESSED OR IMPLIED, AND NO WARRANTY OF MERCHANTABILITY OR FITNESS FOR A PARTICULAR PURPOSE, IS GIVEN. Neither FilmTec Corporation nor The Dow Chemical Company assume any obligation or liability for results obtained or damages incurred from the application of this information. Because use conditions and applicable laws may differ from one location to another and may change with time, customer is responsible for determining whether products are appropriate for customer’s use. FilmTec Corporation and The Dow Chemical Company assume no liability, if, as a result of customer's use of the ROSA membrane design software, the customer should be sued for alleged infringement of any patent not owned or controlled by the FilmTec Corporation nor The Dow Chemical Company.
Reverse Osmosis System Analysis for FILMTEC™ Membranes ROSA 7.0.1 ConfigDB U238786_93
Project: Eastern Phase 2 Case: 1
Winnie Shih, Carollo Engineers 8/12/2009
Feed Flow to Stage 1 20.00 gpm Pass 1 Permeate Flow 15.40 gpm Osmotic Pressure:
Raw Water Flow to System 20.00 gpm Pass 1 Recovery 77.01 % Feed 58.02 psig
Feed Pressure 220.44 psig Feed Temperature 25.0 C Concentrate 226.99 psig
Fouling Factor 0.85 Feed TDS 5835.28 mg/l Average 142.51 psig
Chem. Dose None Number of Elements 21 Average NDP 63.18 psig
Total Active Area 1827.00 ft² Average Pass 1 Flux 12.14 gfd Power 2.40 kW
Water Classification: Tertiary Effluent (Conventional) SDI < 5 Specific Energy 2.59 kWh/kgal
Stage Element #PV #EleFeed Flow
(gpm) Feed Press
(psig) Recirc Flow
(gpm) Conc Flow
(gpm) Conc Press
(psig) Perm Flow
(gpm) Avg Flux
(gfd) Perm Press
(psig) Boost Press
(psig) Perm TDS
(mg/l)
1 XLE-4040 2 7 20.00 215.44 0.00 5.62 201.33 14.38 17.01 0.00 0.00 363.05
2 XLE-4040 1 7 5.62 196.33 0.00 4.60 183.61 1.02 2.41 0.00 0.00 3172.49
Pass Streams (mg/l as Ion)
Name Feed Adjusted FeedConcentrate Permeate
Stage 1 Stage 2 Stage 1 Stage 2 TotalNH4 0.50 0.50 1.01 1.04 0.30 0.84 0.34K 28.00 28.00 84.91 97.17 5.78 29.52 7.35Na 1611.00 1611.00 5445.98 6427.53 113.65 1009.74 172.85Mg 155.00 155.00 537.63 645.39 5.60 50.59 8.58Ca 320.00 320.00 1110.74 1333.47 11.26 104.08 17.39Sr 2.54 2.54 8.82 10.58 0.09 0.83 0.14Ba 0.09 0.09 0.31 0.38 0.00 0.03 0.00CO3 0.00 0.00 0.09 0.15 0.00 0.00 0.00HCO3 16.00 16.00 55.00 65.73 1.17 6.24 1.45NO3 18.60 18.60 45.02 48.03 8.28 31.46 9.81Cl 2851.00 3110.34 10559.81 12497.86 201.72 1800.61 307.35F 0.20 0.20 0.67 0.79 0.02 0.14 0.03SO4 542.00 542.00 1893.60 2283.98 14.27 129.26 21.87SiO2 31.00 31.00 108.09 129.97 0.90 9.17 1.45Boron 0.00 0.00 0.00 0.00 0.00 0.00 0.00CO2 14.13 14.03 14.20 14.23 13.79 14.12 13.85TDS 5575.93 5835.28 19851.68 23542.08 363.05 3172.49 548.60pH 6.00 6.00 6.38 6.43 5.06 5.65 5.13
Page 1 of 3ROSA Detailed Report
8/28/2009file://C:\Program Files\ROSA70\MyProjects\Eastern Phase 201Detail.html
pw://Carollo/Documents/Client/CA/EMWD/7324C00/Deliverables/Report/NWRI/Appendix C.pdf

Design Warnings
Solubility Warnings
Stage Details
Permeate Flux reported by ROSA is calculated based on ACTIVE membrane area. DISCLAIMER: NO WARRANTY, EXPRESSED OR IMPLIED, AND NO WARRANTY OF MERCHANTABILITY OR FITNESS FOR A PARTICULAR PURPOSE, IS GIVEN. Neither FilmTec Corporation nor The Dow Chemical Company assume any obligation or liability for results obtained or damages incurred from the application of this information. Because use conditions and applicable laws may differ from one location to another and may change with time, customer is responsible for determining whether products are appropriate for customer’s use. FilmTec Corporation and The Dow Chemical Company assume no liability, if, as a result of customer's use of the ROSA membrane design software, the customer should be sued for alleged infringement of any patent not owned or controlled by the FilmTec Corporation nor The Dow Chemical Company.
Reverse Osmosis System Analysis for FILMTEC™ Membranes ROSA 7.0.1 ConfigDB U238786_93
Project: Eastern Phase 2 Case: 1
Winnie Shih, Carollo Engineers 8/12/2009
WARNING: Maximum element recovery has been exceeded. Please change your system design to reduce the element recoveries. (Product: XLE-4040, Limit: 12.00%)
WARNING: Maximum recommended element permeate flow rate has been exceeded. Please change your system design to reduce the element permeate flows. (Product: XLE-4040, Limit: 0.83gpm)
CAUTION: The concentrate flow rate is less than the recommended minimum flow. Please change your system design to increase concentrate flow rates. (Product: XLE-4040, Limit: 5.00gpm)
BaSO4 (% Saturation) > 100%
CaF2 (% Saturation) > 100%
Antiscalants may be required. Consult your antiscalant manufacturer for dosing and maximum allowable system recovery.
Stage 1 Element Recovery Perm Flow (gpm) Perm TDS (mg/l) Feed Flow (gpm) Feed TDS (mg/l) Feed Press (psig)
1 0.19 1.94 125.02 10.00 5835.28 215.44
2 0.20 1.62 178.35 8.06 7213.67 211.32
3 0.20 1.28 265.22 6.43 8986.52 208.29
4 0.18 0.95 409.35 5.16 11147.98 206.08
5 0.16 0.66 648.21 4.21 13558.58 204.45
6 0.12 0.44 1025.66 3.55 15951.02 203.19
7 0.10 0.30 1564.99 3.11 18079.60 202.18
Stage 2 Element Recovery Perm Flow (gpm) Perm TDS (mg/l) Feed Flow (gpm) Feed TDS (mg/l) Feed Press (psig)
1 0.04 0.22 2115.02 5.62 19851.68 196.33
2 0.03 0.19 2480.01 5.40 20574.70 194.26
3 0.03 0.15 3022.45 5.21 21230.65 192.31
4 0.03 0.13 3470.49 5.05 21782.80 190.44
5 0.02 0.12 3768.57 4.92 22276.89 188.64
6 0.02 0.11 4325.97 4.80 22750.71 186.91
7 0.02 0.09 4781.49 4.69 23164.55 185.24
Page 2 of 3ROSA Detailed Report
8/28/2009file://C:\Program Files\ROSA70\MyProjects\Eastern Phase 201Detail.html
pw://Carollo/Documents/Client/CA/EMWD/7324C00/Deliverables/Report/NWRI/Appendix C.pdf

Scaling Calculations
To balance: 259.34 mg/l Cl added to feed.
Raw Water Adjusted Feed Concentrate
pH 6.00 6.00 6.43
Langelier Saturation Index -1.95 -1.95 -0.32
Stiff & Davis Stability Index -2.24 -2.24 -1.16
Ionic Strength (Molal) 0.12 0.12 0.50
TDS (mg/l) 5575.93 5835.28 23542.08
HCO3 16.00 16.00 65.73
CO2 14.13 14.13 14.23
CO3 0.00 0.00 0.15
CaSO4 (% Saturation) 13.61 13.61 73.54
BaSO4 (% Saturation) 333.60 333.60 1459.38
SrSO4 (% Saturation) 4.71 4.71 22.44
CaF2 (% Saturation) 1.70 1.70 109.38
SiO2 (% Saturation) 22.06 24.91 97.08
Mg(OH)2 (% Saturation) 0.00 0.00 0.00
Page 3 of 3ROSA Detailed Report
8/28/2009file://C:\Program Files\ROSA70\MyProjects\Eastern Phase 201Detail.html
pw://Carollo/Documents/Client/CA/EMWD/7324C00/Deliverables/Report/NWRI/Appendix C.pdf

D-1
Appendix D
SODA ASH SOLUBILITY CURVES

pw://Carollo/Documents/Client/CA/EMWD/7324C00/Deliverables/Report/NWRI/Appendix D.pdf
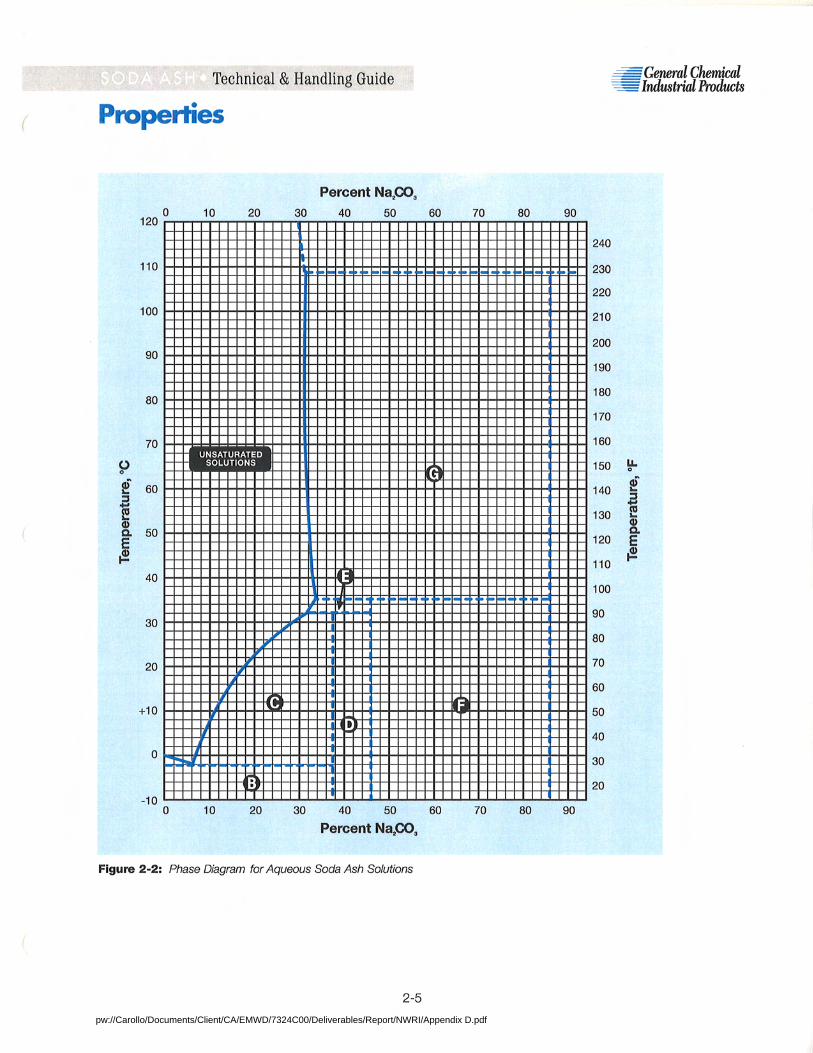
pw://Carollo/Documents/Client/CA/EMWD/7324C00/Deliverables/Report/NWRI/Appendix D.pdf

E-1
Appendix E
LABORATORY SLUDGE ANALYSIS REPORT
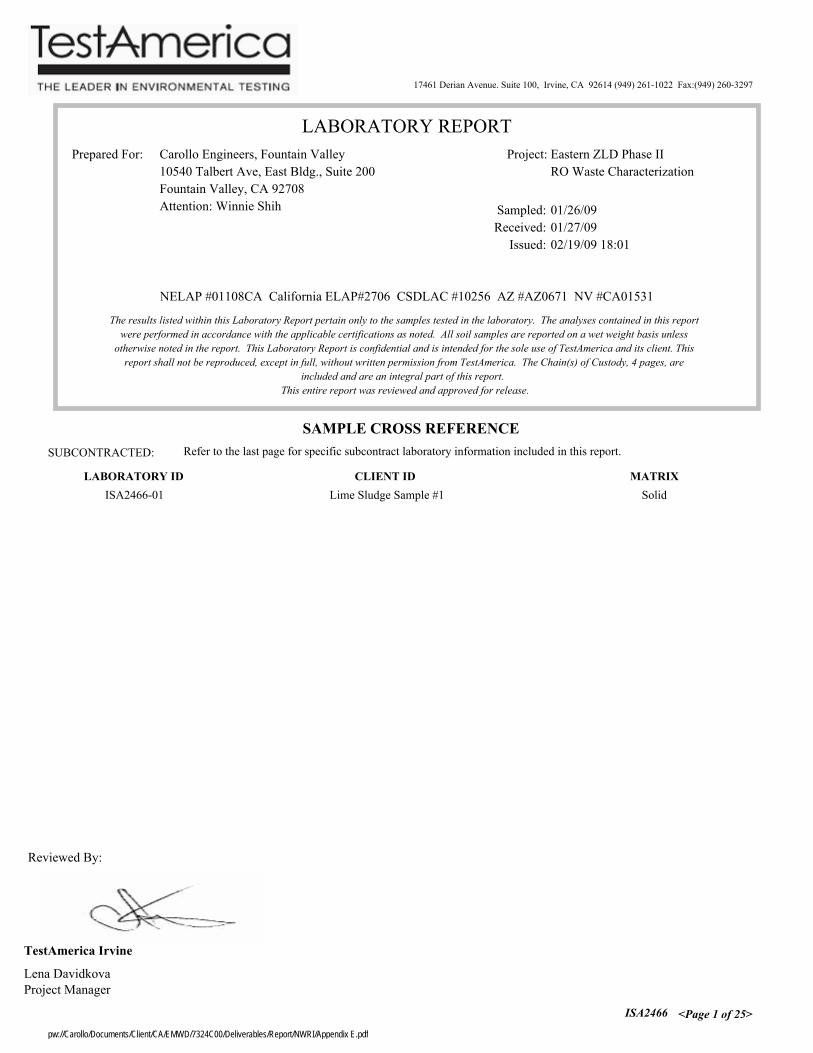
17461 Derian Avenue. Suite 100, Irvine, CA 92614 (949) 261-1022 Fax:(949) 260-3297
LABORATORY REPORT
Prepared For: Carollo Engineers, Fountain Valley
10540 Talbert Ave, East Bldg., Suite 200
Fountain Valley, CA 92708
Attention: Winnie Shih Sampled:
Received:
Issued:
01/26/09
01/27/09
02/19/09 18:01
The results listed within this Laboratory Report pertain only to the samples tested in the laboratory. The analyses contained in this report
were performed in accordance with the applicable certifications as noted. All soil samples are reported on a wet weight basis unless
otherwise noted in the report. This Laboratory Report is confidential and is intended for the sole use of TestAmerica and its client. This
report shall not be reproduced, except in full, without written permission from TestAmerica. The Chain(s) of Custody, 4 pages, are
included and are an integral part of this report.
This entire report was reviewed and approved for release.
Project: Eastern ZLD Phase II
RO Waste Characterization
NELAP #01108CA California ELAP#2706 CSDLAC #10256 AZ #AZ0671 NV #CA01531
SAMPLE CROSS REFERENCE
SUBCONTRACTED: Refer to the last page for specific subcontract laboratory information included in this report.
MATRIXCLIENT IDLABORATORY ID
ISA2466-01 Lime Sludge Sample #1 Solid
Reviewed By:
Project Manager
TestAmerica Irvine
ISA2466
Lena Davidkova
<Page 1 of 25>
pw://Carollo/Documents/Client/CA/EMWD/7324C00/Deliverables/Report/NWRI/Appendix E.pdf

17461 Derian Avenue. Suite 100, Irvine, CA 92614 (949) 261-1022 Fax:(949) 260-3297
Carollo Engineers, Fountain Valley
10540 Talbert Ave, East Bldg., Suite 200
Fountain Valley, CA 92708
Attention: Winnie Shih
Sampled:
Received:
01/26/09
01/27/09Report Number:
Project ID:
ISA2466
Eastern ZLD Phase II
RO Waste Characterization
Analyte Method
Date
Extracted
Date
Analyzed
Dilution
Factor
EXTRACTABLE FUEL HYDROCARBONS (CADHS/8015 Modified)
Data
QualifiersBatch
Reporting
Limit
Sample
Result
Sample ID: ISA2466-01 (Lime Sludge Sample #1 - Solid)
Reporting Units: mg/kg
2/5/20092/4/2009EPA 8015B MOD.DRO (C13-C22) 159B03118 3ND
2/5/20092/4/2009EPA 8015B MOD.ORO (C23-C32) 159B03118 3ND
2/5/20092/4/2009EPA 8015B MOD.EFH (C13 - C32) 159B03118 3ND
109 %Surrogate: n-Octacosane (40-125%)
Project Manager
TestAmerica Irvine
ISA2466
Lena Davidkova
The results pertain only to the samples tested in the laboratory. This report shall not be reproduced,
except in full, without written permission from TestAmerica. <Page 2 of 25>
pw://Carollo/Documents/Client/CA/EMWD/7324C00/Deliverables/Report/NWRI/Appendix E.pdf
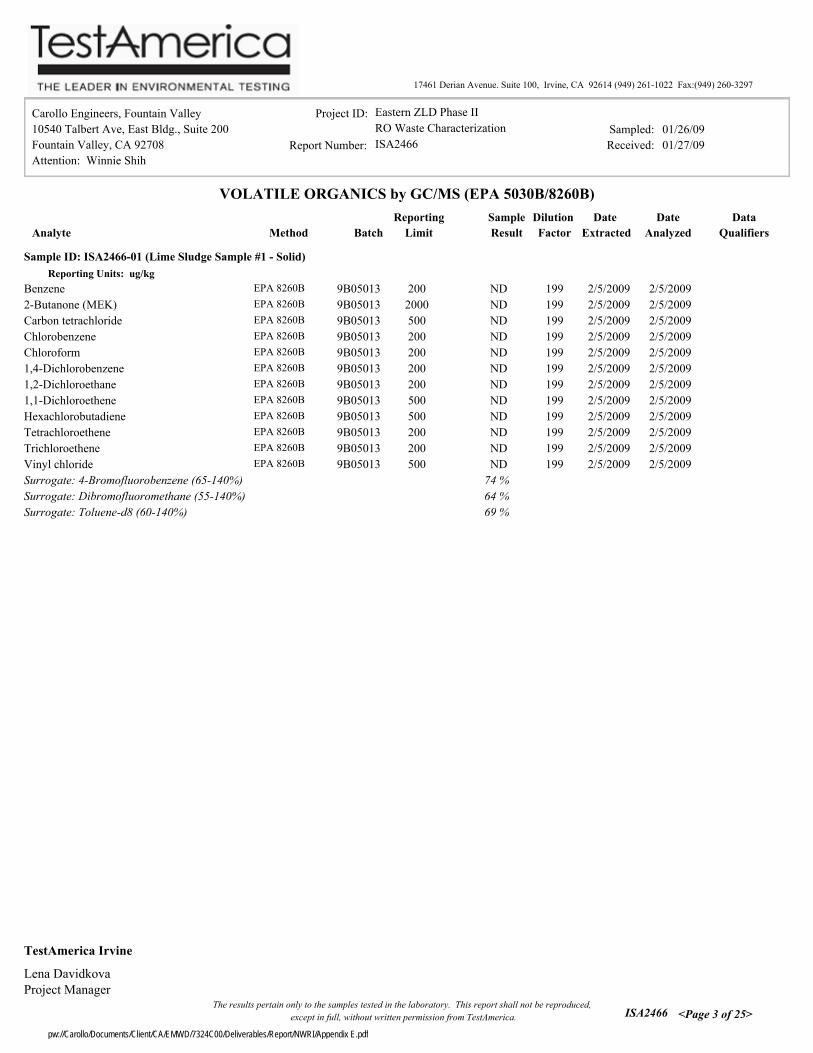
17461 Derian Avenue. Suite 100, Irvine, CA 92614 (949) 261-1022 Fax:(949) 260-3297
Carollo Engineers, Fountain Valley
10540 Talbert Ave, East Bldg., Suite 200
Fountain Valley, CA 92708
Attention: Winnie Shih
Sampled:
Received:
01/26/09
01/27/09Report Number:
Project ID:
ISA2466
Eastern ZLD Phase II
RO Waste Characterization
Analyte Method
Date
Extracted
Date
Analyzed
Dilution
Factor
VOLATILE ORGANICS by GC/MS (EPA 5030B/8260B)
Data
QualifiersBatch
Reporting
Limit
Sample
Result
Sample ID: ISA2466-01 (Lime Sludge Sample #1 - Solid)
Reporting Units: ug/kg
2/5/20092/5/2009EPA 8260BBenzene 2009B05013 199ND
2/5/20092/5/2009EPA 8260B2-Butanone (MEK) 20009B05013 199ND
2/5/20092/5/2009EPA 8260BCarbon tetrachloride 5009B05013 199ND
2/5/20092/5/2009EPA 8260BChlorobenzene 2009B05013 199ND
2/5/20092/5/2009EPA 8260BChloroform 2009B05013 199ND
2/5/20092/5/2009EPA 8260B1,4-Dichlorobenzene 2009B05013 199ND
2/5/20092/5/2009EPA 8260B1,2-Dichloroethane 2009B05013 199ND
2/5/20092/5/2009EPA 8260B1,1-Dichloroethene 5009B05013 199ND
2/5/20092/5/2009EPA 8260BHexachlorobutadiene 5009B05013 199ND
2/5/20092/5/2009EPA 8260BTetrachloroethene 2009B05013 199ND
2/5/20092/5/2009EPA 8260BTrichloroethene 2009B05013 199ND
2/5/20092/5/2009EPA 8260BVinyl chloride 5009B05013 199ND
74 %Surrogate: 4-Bromofluorobenzene (65-140%)
64 %Surrogate: Dibromofluoromethane (55-140%)
69 %Surrogate: Toluene-d8 (60-140%)
Project Manager
TestAmerica Irvine
ISA2466
Lena Davidkova
The results pertain only to the samples tested in the laboratory. This report shall not be reproduced,
except in full, without written permission from TestAmerica. <Page 3 of 25>
pw://Carollo/Documents/Client/CA/EMWD/7324C00/Deliverables/Report/NWRI/Appendix E.pdf

17461 Derian Avenue. Suite 100, Irvine, CA 92614 (949) 261-1022 Fax:(949) 260-3297
Carollo Engineers, Fountain Valley
10540 Talbert Ave, East Bldg., Suite 200
Fountain Valley, CA 92708
Attention: Winnie Shih
Sampled:
Received:
01/26/09
01/27/09Report Number:
Project ID:
ISA2466
Eastern ZLD Phase II
RO Waste Characterization
Analyte Method
Date
Extracted
Date
Analyzed
Dilution
Factor
SEMI-VOLATILE ORGANICS BY GC/MS (EPA 3545/8270C)
Data
QualifiersBatch
Reporting
Limit
Sample
Result
Sample ID: ISA2466-01 (Lime Sludge Sample #1 - Solid) RL1
Reporting Units: ug/kg
2/3/20092/3/2009EPA 8270C1,4-Dichlorobenzene 9809B03050 2.94ND
2/3/20092/3/2009EPA 8270C2,4-Dinitrotoluene 9809B03050 2.94ND
2/3/20092/3/2009EPA 8270CHexachlorobenzene 9809B03050 2.94ND
2/3/20092/3/2009EPA 8270CHexachlorobutadiene 9809B03050 2.94ND
2/3/20092/3/2009EPA 8270CHexachloroethane 9809B03050 2.94ND
2/3/20092/3/2009EPA 8270C2-Methylphenol 9809B03050 2.94ND
2/3/20092/3/2009EPA 8270CNitrobenzene 9809B03050 2.94ND
2/3/20092/3/2009EPA 8270CPentachlorophenol 24009B03050 2.94ND
2/3/20092/3/2009EPA 8270CPyridine 5909B03050 2.94ND
2/3/20092/3/2009EPA 8270C2,4,5-Trichlorophenol 9809B03050 2.94ND
2/3/20092/3/2009EPA 8270C2,4,6-Trichlorophenol 9809B03050 2.94ND
2/3/20092/3/2009EPA 8270C3,4-Methylphenol 9809B03050 2.94ND
2/3/20092/3/2009EPA 8270CCresol 20009B03050 2.94ND
78 %Surrogate: 2,4,6-Tribromophenol (35-125%)
91 %Surrogate: 2-Fluorobiphenyl (35-120%)
92 %Surrogate: 2-Fluorophenol (25-120%)
85 %Surrogate: Nitrobenzene-d5 (30-120%)
100 %Surrogate: Phenol-d6 (35-120%)
123 %Surrogate: Terphenyl-d14 (40-135%)
Project Manager
TestAmerica Irvine
ISA2466
Lena Davidkova
The results pertain only to the samples tested in the laboratory. This report shall not be reproduced,
except in full, without written permission from TestAmerica. <Page 4 of 25>
pw://Carollo/Documents/Client/CA/EMWD/7324C00/Deliverables/Report/NWRI/Appendix E.pdf
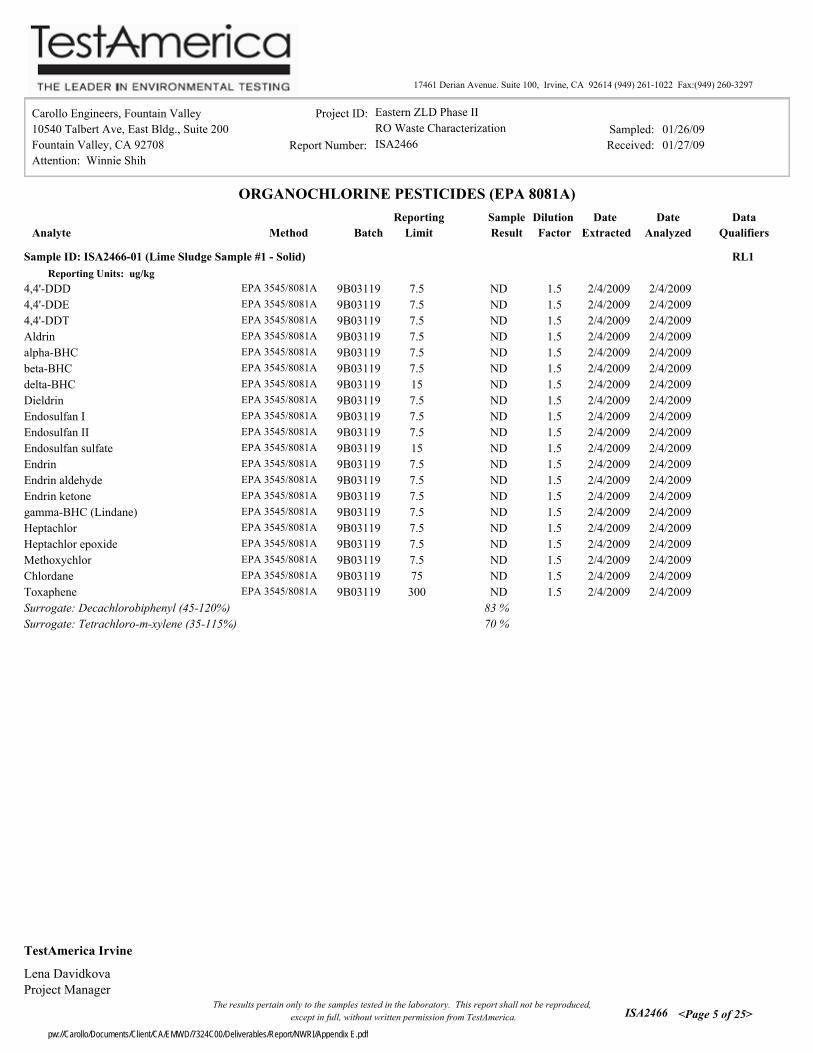
17461 Derian Avenue. Suite 100, Irvine, CA 92614 (949) 261-1022 Fax:(949) 260-3297
Carollo Engineers, Fountain Valley
10540 Talbert Ave, East Bldg., Suite 200
Fountain Valley, CA 92708
Attention: Winnie Shih
Sampled:
Received:
01/26/09
01/27/09Report Number:
Project ID:
ISA2466
Eastern ZLD Phase II
RO Waste Characterization
Analyte Method
Date
Extracted
Date
Analyzed
Dilution
Factor
ORGANOCHLORINE PESTICIDES (EPA 8081A)
Data
QualifiersBatch
Reporting
Limit
Sample
Result
Sample ID: ISA2466-01 (Lime Sludge Sample #1 - Solid) RL1
Reporting Units: ug/kg
2/4/20092/4/2009EPA 3545/8081A4,4'-DDD 7.59B03119 1.5ND
2/4/20092/4/2009EPA 3545/8081A4,4'-DDE 7.59B03119 1.5ND
2/4/20092/4/2009EPA 3545/8081A4,4'-DDT 7.59B03119 1.5ND
2/4/20092/4/2009EPA 3545/8081AAldrin 7.59B03119 1.5ND
2/4/20092/4/2009EPA 3545/8081Aalpha-BHC 7.59B03119 1.5ND
2/4/20092/4/2009EPA 3545/8081Abeta-BHC 7.59B03119 1.5ND
2/4/20092/4/2009EPA 3545/8081Adelta-BHC 159B03119 1.5ND
2/4/20092/4/2009EPA 3545/8081ADieldrin 7.59B03119 1.5ND
2/4/20092/4/2009EPA 3545/8081AEndosulfan I 7.59B03119 1.5ND
2/4/20092/4/2009EPA 3545/8081AEndosulfan II 7.59B03119 1.5ND
2/4/20092/4/2009EPA 3545/8081AEndosulfan sulfate 159B03119 1.5ND
2/4/20092/4/2009EPA 3545/8081AEndrin 7.59B03119 1.5ND
2/4/20092/4/2009EPA 3545/8081AEndrin aldehyde 7.59B03119 1.5ND
2/4/20092/4/2009EPA 3545/8081AEndrin ketone 7.59B03119 1.5ND
2/4/20092/4/2009EPA 3545/8081Agamma-BHC (Lindane) 7.59B03119 1.5ND
2/4/20092/4/2009EPA 3545/8081AHeptachlor 7.59B03119 1.5ND
2/4/20092/4/2009EPA 3545/8081AHeptachlor epoxide 7.59B03119 1.5ND
2/4/20092/4/2009EPA 3545/8081AMethoxychlor 7.59B03119 1.5ND
2/4/20092/4/2009EPA 3545/8081AChlordane 759B03119 1.5ND
2/4/20092/4/2009EPA 3545/8081AToxaphene 3009B03119 1.5ND
83 %Surrogate: Decachlorobiphenyl (45-120%)
70 %Surrogate: Tetrachloro-m-xylene (35-115%)
Project Manager
TestAmerica Irvine
ISA2466
Lena Davidkova
The results pertain only to the samples tested in the laboratory. This report shall not be reproduced,
except in full, without written permission from TestAmerica. <Page 5 of 25>
pw://Carollo/Documents/Client/CA/EMWD/7324C00/Deliverables/Report/NWRI/Appendix E.pdf

17461 Derian Avenue. Suite 100, Irvine, CA 92614 (949) 261-1022 Fax:(949) 260-3297
Carollo Engineers, Fountain Valley
10540 Talbert Ave, East Bldg., Suite 200
Fountain Valley, CA 92708
Attention: Winnie Shih
Sampled:
Received:
01/26/09
01/27/09Report Number:
Project ID:
ISA2466
Eastern ZLD Phase II
RO Waste Characterization
Analyte Method
Date
Extracted
Date
Analyzed
Dilution
Factor
POLYCHLORINATED BIPHENYLS (EPA 3545/8082)
Data
QualifiersBatch
Reporting
Limit
Sample
Result
Sample ID: ISA2466-01 (Lime Sludge Sample #1 - Solid) RL1
Reporting Units: ug/kg
2/5/20092/4/2009EPA 8082Aroclor 1016 1609B04089 3.26ND
2/5/20092/4/2009EPA 8082Aroclor 1221 1609B04089 3.26ND
2/5/20092/4/2009EPA 8082Aroclor 1232 1609B04089 3.26ND
2/5/20092/4/2009EPA 8082Aroclor 1242 1609B04089 3.26ND
2/5/20092/4/2009EPA 8082Aroclor 1248 1609B04089 3.26ND
2/5/20092/4/2009EPA 8082Aroclor 1254 1609B04089 3.26ND
2/5/20092/4/2009EPA 8082Aroclor 1260 1609B04089 3.26ND
99 %Surrogate: Decachlorobiphenyl (45-120%)
Project Manager
TestAmerica Irvine
ISA2466
Lena Davidkova
The results pertain only to the samples tested in the laboratory. This report shall not be reproduced,
except in full, without written permission from TestAmerica. <Page 6 of 25>
pw://Carollo/Documents/Client/CA/EMWD/7324C00/Deliverables/Report/NWRI/Appendix E.pdf

17461 Derian Avenue. Suite 100, Irvine, CA 92614 (949) 261-1022 Fax:(949) 260-3297
Carollo Engineers, Fountain Valley
10540 Talbert Ave, East Bldg., Suite 200
Fountain Valley, CA 92708
Attention: Winnie Shih
Sampled:
Received:
01/26/09
01/27/09Report Number:
Project ID:
ISA2466
Eastern ZLD Phase II
RO Waste Characterization
Analyte Method
Date
Extracted
Date
Analyzed
Dilution
Factor
METALS
Data
QualifiersBatch
Reporting
Limit
Sample
Result
Sample ID: ISA2466-01 (Lime Sludge Sample #1 - Solid)
Reporting Units: mg/kg
2/3/20092/3/2009EPA 7471AMercury 0.0209B03103 1ND
2/5/20092/4/2009EPA 6010BArsenic 2.09B04124 1ND
Barium 2/5/20092/4/20099B04124 1.0 1EPA 6010B 18
2/5/20092/4/2009EPA 6010BCadmium 0.509B04124 1ND
2/5/20092/4/2009EPA 6010BChromium 1.09B04124 1ND
2/5/20092/4/2009EPA 6010BLead 2.09B04124 1ND
2/5/20092/4/2009EPA 6010BSelenium 2.09B04124 1ND
2/5/20092/4/2009EPA 6010BSilver 1.09B04124 1ND
Project Manager
TestAmerica Irvine
ISA2466
Lena Davidkova
The results pertain only to the samples tested in the laboratory. This report shall not be reproduced,
except in full, without written permission from TestAmerica. <Page 7 of 25>
pw://Carollo/Documents/Client/CA/EMWD/7324C00/Deliverables/Report/NWRI/Appendix E.pdf
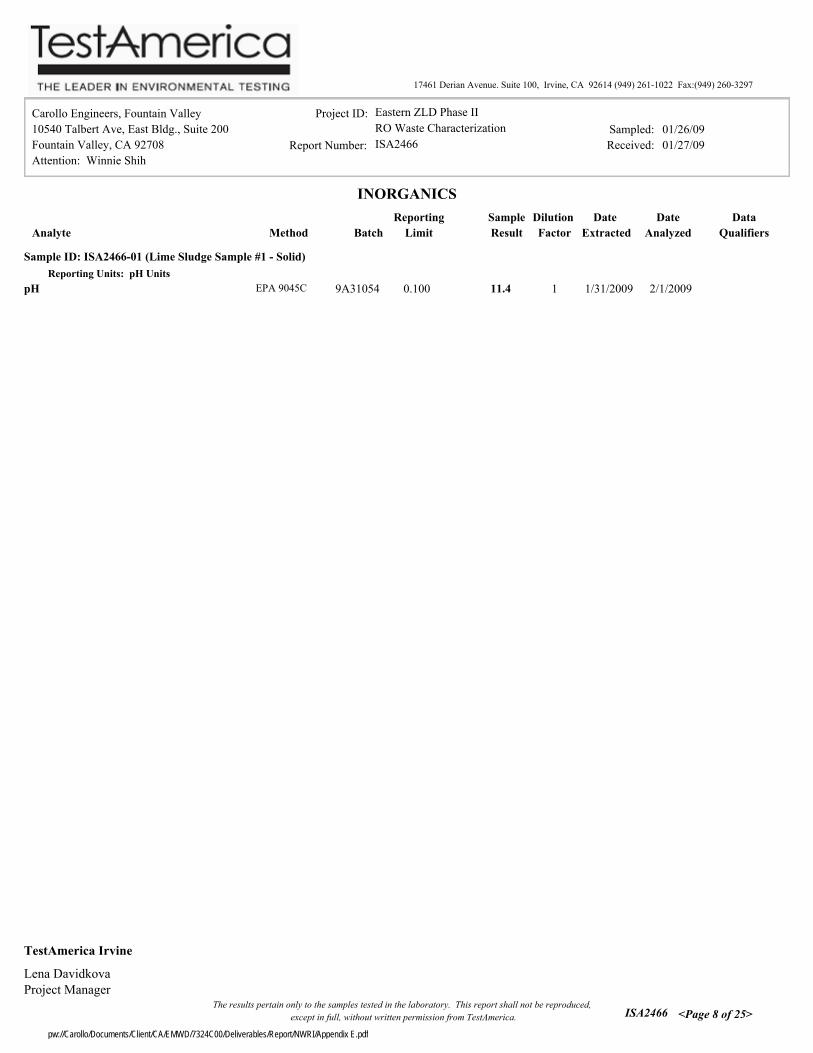
17461 Derian Avenue. Suite 100, Irvine, CA 92614 (949) 261-1022 Fax:(949) 260-3297
Carollo Engineers, Fountain Valley
10540 Talbert Ave, East Bldg., Suite 200
Fountain Valley, CA 92708
Attention: Winnie Shih
Sampled:
Received:
01/26/09
01/27/09Report Number:
Project ID:
ISA2466
Eastern ZLD Phase II
RO Waste Characterization
Analyte Method
Date
Extracted
Date
Analyzed
Dilution
Factor
INORGANICS
Data
QualifiersBatch
Reporting
Limit
Sample
Result
Sample ID: ISA2466-01 (Lime Sludge Sample #1 - Solid)
Reporting Units: pH Units
pH 2/1/20091/31/20099A31054 0.100 1EPA 9045C 11.4
Project Manager
TestAmerica Irvine
ISA2466
Lena Davidkova
The results pertain only to the samples tested in the laboratory. This report shall not be reproduced,
except in full, without written permission from TestAmerica. <Page 8 of 25>
pw://Carollo/Documents/Client/CA/EMWD/7324C00/Deliverables/Report/NWRI/Appendix E.pdf
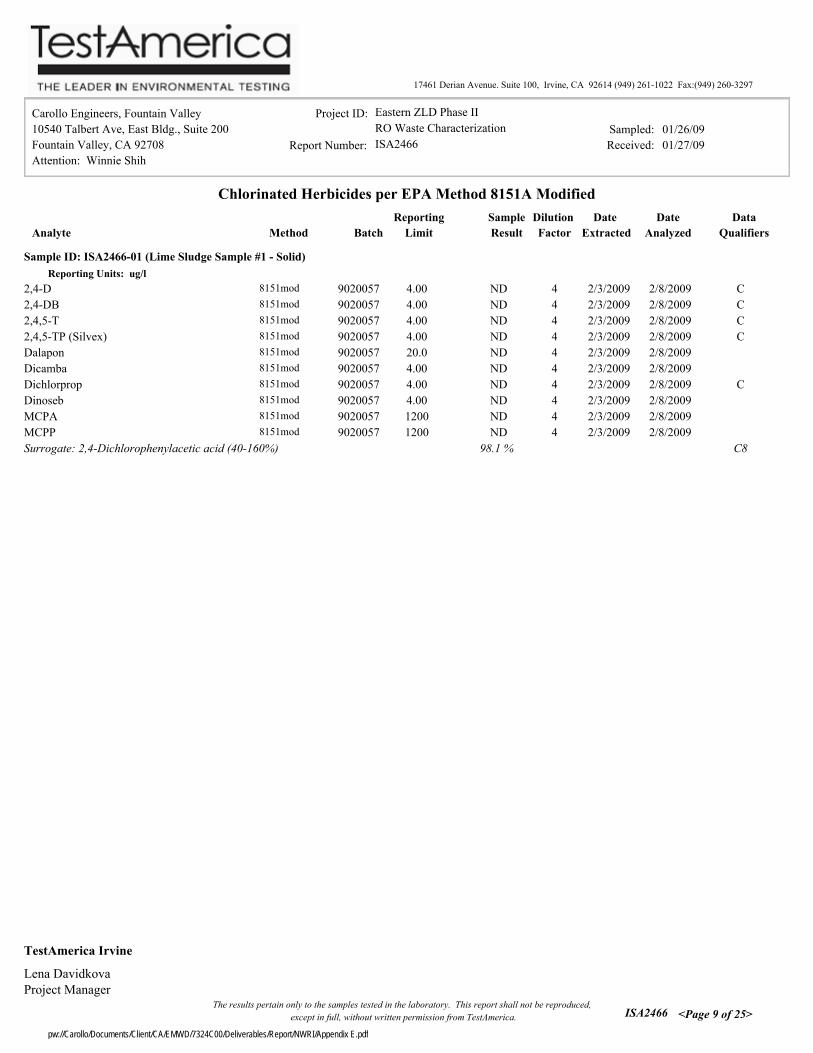
17461 Derian Avenue. Suite 100, Irvine, CA 92614 (949) 261-1022 Fax:(949) 260-3297
Carollo Engineers, Fountain Valley
10540 Talbert Ave, East Bldg., Suite 200
Fountain Valley, CA 92708
Attention: Winnie Shih
Sampled:
Received:
01/26/09
01/27/09Report Number:
Project ID:
ISA2466
Eastern ZLD Phase II
RO Waste Characterization
Analyte Method
Date
Extracted
Date
Analyzed
Dilution
Factor
Chlorinated Herbicides per EPA Method 8151A Modified
Data
QualifiersBatch
Reporting
Limit
Sample
Result
Sample ID: ISA2466-01 (Lime Sludge Sample #1 - Solid)
Reporting Units: ug/l
2/8/20092/3/20098151mod2,4-D 4.009020057 C4ND
2/8/20092/3/20098151mod2,4-DB 4.009020057 C4ND
2/8/20092/3/20098151mod2,4,5-T 4.009020057 C4ND
2/8/20092/3/20098151mod2,4,5-TP (Silvex) 4.009020057 C4ND
2/8/20092/3/20098151modDalapon 20.09020057 4ND
2/8/20092/3/20098151modDicamba 4.009020057 4ND
2/8/20092/3/20098151modDichlorprop 4.009020057 C4ND
2/8/20092/3/20098151modDinoseb 4.009020057 4ND
2/8/20092/3/20098151modMCPA 12009020057 4ND
2/8/20092/3/20098151modMCPP 12009020057 4ND
98.1 % C8Surrogate: 2,4-Dichlorophenylacetic acid (40-160%)
Project Manager
TestAmerica Irvine
ISA2466
Lena Davidkova
The results pertain only to the samples tested in the laboratory. This report shall not be reproduced,
except in full, without written permission from TestAmerica. <Page 9 of 25>
pw://Carollo/Documents/Client/CA/EMWD/7324C00/Deliverables/Report/NWRI/Appendix E.pdf

17461 Derian Avenue. Suite 100, Irvine, CA 92614 (949) 261-1022 Fax:(949) 260-3297
Carollo Engineers, Fountain Valley
10540 Talbert Ave, East Bldg., Suite 200
Fountain Valley, CA 92708
Attention: Winnie Shih
Sampled:
Received:
01/26/09
01/27/09Report Number:
Project ID:
ISA2466
Eastern ZLD Phase II
RO Waste Characterization
Result Limit
Reporting
Units Level
Spike
Result
Source
%REC
%REC
Limits RPD
RPD
Limit Analyte
EXTRACTABLE FUEL HYDROCARBONS (CADHS/8015 Modified)
METHOD BLANK/QC DATA
Data
Qualifiers
Batch: 9B03118 Extracted: 02/04/09
Blank Analyzed: 02/05/2009 (9B03118-BLK1)
DRO (C13-C22) mg/kg5.0ND
ORO (C23-C32) mg/kg5.0ND
EFH (C13 - C32) mg/kg5.0ND
EFH (C13 - C28) mg/kg5.0ND
6.67 40-125Surrogate: n-Octacosane mg/kg6.98 105
LCS Analyzed: 02/05/2009 (9B03118-BS1)
EFH (C13 - C28) 25.0 45-115mg/kg5.023.3 93
6.67 40-125Surrogate: n-Octacosane mg/kg7.11 107
Matrix Spike Analyzed: 02/05/2009 (9B03118-MS1) Source: ISA2722-09
EFH (C13 - C32) 25.0 40-120mg/kg5.022.0 ND 88
6.67 40-125Surrogate: n-Octacosane mg/kg6.62 99
Matrix Spike Dup Analyzed: 02/05/2009 (9B03118-MSD1) Source: ISA2722-09
EFH (C13 - C32) 25.0 3040-120mg/kg5.024.6 ND 98 11
6.67 40-125Surrogate: n-Octacosane mg/kg7.31 110
Project Manager
TestAmerica Irvine
ISA2466
Lena Davidkova
The results pertain only to the samples tested in the laboratory. This report shall not be reproduced,
except in full, without written permission from TestAmerica. <Page 10 of 25>
pw://Carollo/Documents/Client/CA/EMWD/7324C00/Deliverables/Report/NWRI/Appendix E.pdf

17461 Derian Avenue. Suite 100, Irvine, CA 92614 (949) 261-1022 Fax:(949) 260-3297
Carollo Engineers, Fountain Valley
10540 Talbert Ave, East Bldg., Suite 200
Fountain Valley, CA 92708
Attention: Winnie Shih
Sampled:
Received:
01/26/09
01/27/09Report Number:
Project ID:
ISA2466
Eastern ZLD Phase II
RO Waste Characterization
Result Limit
Reporting
Units Level
Spike
Result
Source
%REC
%REC
Limits RPD
RPD
Limit Analyte
VOLATILE ORGANICS by GC/MS (EPA 5030B/8260B)
METHOD BLANK/QC DATA
Data
Qualifiers
Batch: 9B05013 Extracted: 02/05/09
Blank Analyzed: 02/05/2009 (9B05013-BLK1)
Benzene ug/kg100ND
2-Butanone (MEK) ug/kg1000ND
Carbon tetrachloride ug/kg250ND
Chlorobenzene ug/kg100ND
Chloroform ug/kg100ND
1,4-Dichlorobenzene ug/kg100ND
1,2-Dichloroethane ug/kg100ND
1,1-Dichloroethene ug/kg250ND
Hexachlorobutadiene ug/kg250ND
Tetrachloroethene ug/kg100ND
Trichloroethene ug/kg100ND
Vinyl chloride ug/kg250ND
2500 65-140Surrogate: 4-Bromofluorobenzene ug/kg2450 98
2500 55-140Surrogate: Dibromofluoromethane ug/kg2560 103
2500 60-140Surrogate: Toluene-d8 ug/kg2530 101
LCS Analyzed: 02/05/2009 (9B05013-BS1) MNR1
Benzene 2500 65-120ug/kg1002740 110
2-Butanone (MEK) 2500 40-145ug/kg10002920 117
Carbon tetrachloride 2500 65-145ug/kg2502750 110
Chlorobenzene 2500 70-125ug/kg1002850 114
Chloroform 2500 75-130ug/kg1002860 114
1,4-Dichlorobenzene 2500 70-125ug/kg1002550 102
1,2-Dichloroethane 2500 60-145ug/kg1002690 108
1,1-Dichloroethene 2500 75-140ug/kg2502470 99
Hexachlorobutadiene 2500 60-135ug/kg2502810 112
Tetrachloroethene 2500 65-125ug/kg1002800 112
Trichloroethene 2500 70-130ug/kg1002710 108
Vinyl chloride 2500 10-120ug/kg2501040 42
2500 65-140Surrogate: 4-Bromofluorobenzene ug/kg2490 99
2500 55-140Surrogate: Dibromofluoromethane ug/kg2610 104
2500 60-140Surrogate: Toluene-d8 ug/kg2490 100
Project Manager
TestAmerica Irvine
ISA2466
Lena Davidkova
The results pertain only to the samples tested in the laboratory. This report shall not be reproduced,
except in full, without written permission from TestAmerica. <Page 11 of 25>
pw://Carollo/Documents/Client/CA/EMWD/7324C00/Deliverables/Report/NWRI/Appendix E.pdf
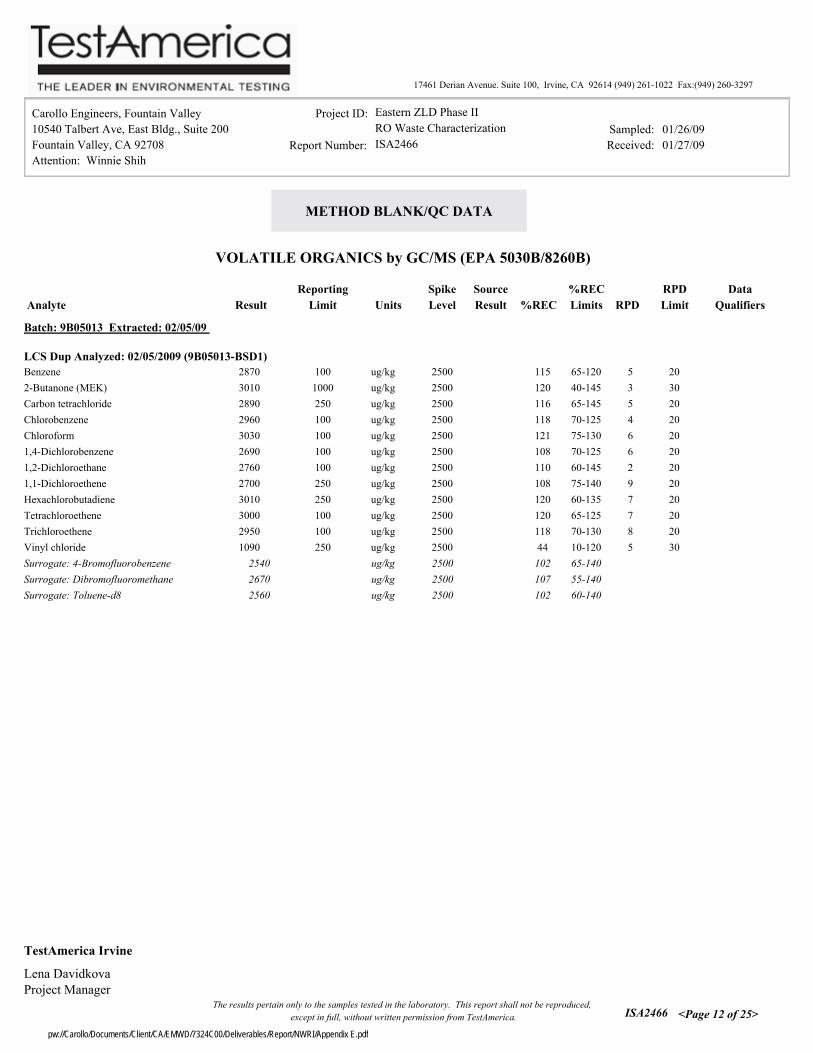
17461 Derian Avenue. Suite 100, Irvine, CA 92614 (949) 261-1022 Fax:(949) 260-3297
Carollo Engineers, Fountain Valley
10540 Talbert Ave, East Bldg., Suite 200
Fountain Valley, CA 92708
Attention: Winnie Shih
Sampled:
Received:
01/26/09
01/27/09Report Number:
Project ID:
ISA2466
Eastern ZLD Phase II
RO Waste Characterization
Result Limit
Reporting
Units Level
Spike
Result
Source
%REC
%REC
Limits RPD
RPD
Limit Analyte
VOLATILE ORGANICS by GC/MS (EPA 5030B/8260B)
METHOD BLANK/QC DATA
Data
Qualifiers
Batch: 9B05013 Extracted: 02/05/09
LCS Dup Analyzed: 02/05/2009 (9B05013-BSD1)
Benzene 2500 2065-120ug/kg1002870 115 5
2-Butanone (MEK) 2500 3040-145ug/kg10003010 120 3
Carbon tetrachloride 2500 2065-145ug/kg2502890 116 5
Chlorobenzene 2500 2070-125ug/kg1002960 118 4
Chloroform 2500 2075-130ug/kg1003030 121 6
1,4-Dichlorobenzene 2500 2070-125ug/kg1002690 108 6
1,2-Dichloroethane 2500 2060-145ug/kg1002760 110 2
1,1-Dichloroethene 2500 2075-140ug/kg2502700 108 9
Hexachlorobutadiene 2500 2060-135ug/kg2503010 120 7
Tetrachloroethene 2500 2065-125ug/kg1003000 120 7
Trichloroethene 2500 2070-130ug/kg1002950 118 8
Vinyl chloride 2500 3010-120ug/kg2501090 44 5
2500 65-140Surrogate: 4-Bromofluorobenzene ug/kg2540 102
2500 55-140Surrogate: Dibromofluoromethane ug/kg2670 107
2500 60-140Surrogate: Toluene-d8 ug/kg2560 102
Project Manager
TestAmerica Irvine
ISA2466
Lena Davidkova
The results pertain only to the samples tested in the laboratory. This report shall not be reproduced,
except in full, without written permission from TestAmerica. <Page 12 of 25>
pw://Carollo/Documents/Client/CA/EMWD/7324C00/Deliverables/Report/NWRI/Appendix E.pdf
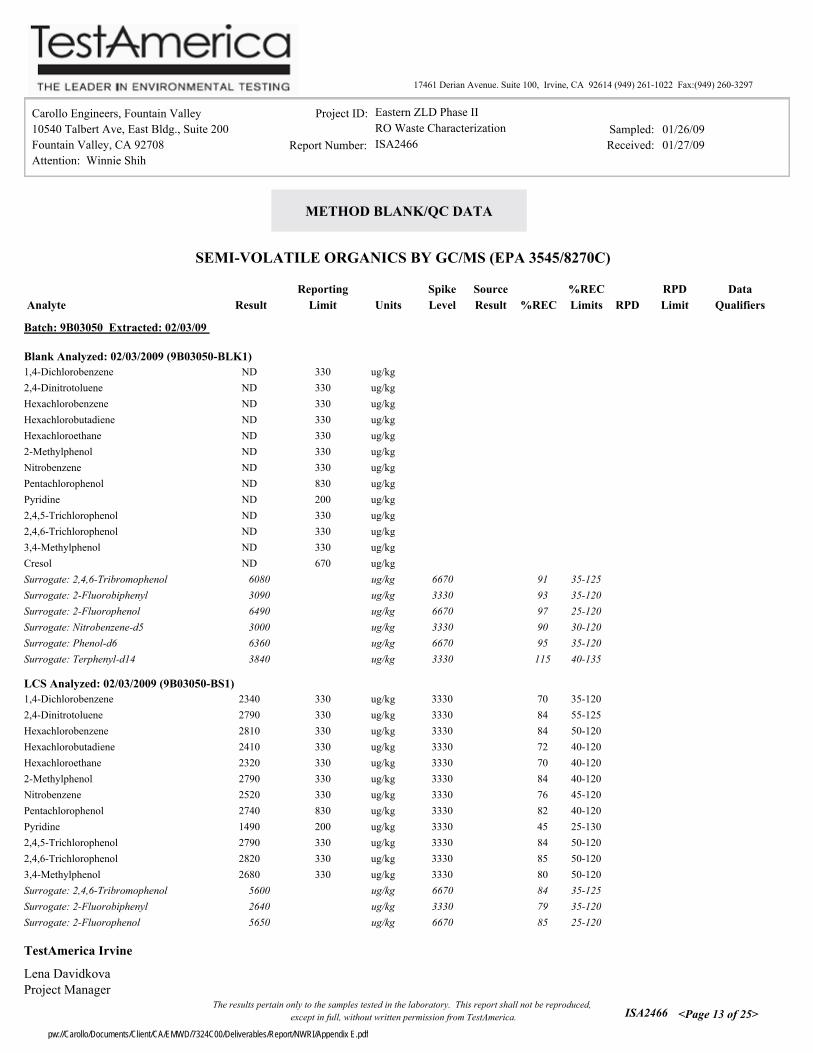
17461 Derian Avenue. Suite 100, Irvine, CA 92614 (949) 261-1022 Fax:(949) 260-3297
Carollo Engineers, Fountain Valley
10540 Talbert Ave, East Bldg., Suite 200
Fountain Valley, CA 92708
Attention: Winnie Shih
Sampled:
Received:
01/26/09
01/27/09Report Number:
Project ID:
ISA2466
Eastern ZLD Phase II
RO Waste Characterization
Result Limit
Reporting
Units Level
Spike
Result
Source
%REC
%REC
Limits RPD
RPD
Limit Analyte
SEMI-VOLATILE ORGANICS BY GC/MS (EPA 3545/8270C)
METHOD BLANK/QC DATA
Data
Qualifiers
Batch: 9B03050 Extracted: 02/03/09
Blank Analyzed: 02/03/2009 (9B03050-BLK1)
1,4-Dichlorobenzene ug/kg330ND
2,4-Dinitrotoluene ug/kg330ND
Hexachlorobenzene ug/kg330ND
Hexachlorobutadiene ug/kg330ND
Hexachloroethane ug/kg330ND
2-Methylphenol ug/kg330ND
Nitrobenzene ug/kg330ND
Pentachlorophenol ug/kg830ND
Pyridine ug/kg200ND
2,4,5-Trichlorophenol ug/kg330ND
2,4,6-Trichlorophenol ug/kg330ND
3,4-Methylphenol ug/kg330ND
Cresol ug/kg670ND
6670 35-125Surrogate: 2,4,6-Tribromophenol ug/kg6080 91
3330 35-120Surrogate: 2-Fluorobiphenyl ug/kg3090 93
6670 25-120Surrogate: 2-Fluorophenol ug/kg6490 97
3330 30-120Surrogate: Nitrobenzene-d5 ug/kg3000 90
6670 35-120Surrogate: Phenol-d6 ug/kg6360 95
3330 40-135Surrogate: Terphenyl-d14 ug/kg3840 115
LCS Analyzed: 02/03/2009 (9B03050-BS1)
1,4-Dichlorobenzene 3330 35-120ug/kg3302340 70
2,4-Dinitrotoluene 3330 55-125ug/kg3302790 84
Hexachlorobenzene 3330 50-120ug/kg3302810 84
Hexachlorobutadiene 3330 40-120ug/kg3302410 72
Hexachloroethane 3330 40-120ug/kg3302320 70
2-Methylphenol 3330 40-120ug/kg3302790 84
Nitrobenzene 3330 45-120ug/kg3302520 76
Pentachlorophenol 3330 40-120ug/kg8302740 82
Pyridine 3330 25-130ug/kg2001490 45
2,4,5-Trichlorophenol 3330 50-120ug/kg3302790 84
2,4,6-Trichlorophenol 3330 50-120ug/kg3302820 85
3,4-Methylphenol 3330 50-120ug/kg3302680 80
6670 35-125Surrogate: 2,4,6-Tribromophenol ug/kg5600 84
3330 35-120Surrogate: 2-Fluorobiphenyl ug/kg2640 79
6670 25-120Surrogate: 2-Fluorophenol ug/kg5650 85
Project Manager
TestAmerica Irvine
ISA2466
Lena Davidkova
The results pertain only to the samples tested in the laboratory. This report shall not be reproduced,
except in full, without written permission from TestAmerica. <Page 13 of 25>
pw://Carollo/Documents/Client/CA/EMWD/7324C00/Deliverables/Report/NWRI/Appendix E.pdf

17461 Derian Avenue. Suite 100, Irvine, CA 92614 (949) 261-1022 Fax:(949) 260-3297
Carollo Engineers, Fountain Valley
10540 Talbert Ave, East Bldg., Suite 200
Fountain Valley, CA 92708
Attention: Winnie Shih
Sampled:
Received:
01/26/09
01/27/09Report Number:
Project ID:
ISA2466
Eastern ZLD Phase II
RO Waste Characterization
Result Limit
Reporting
Units Level
Spike
Result
Source
%REC
%REC
Limits RPD
RPD
Limit Analyte
SEMI-VOLATILE ORGANICS BY GC/MS (EPA 3545/8270C)
METHOD BLANK/QC DATA
Data
Qualifiers
Batch: 9B03050 Extracted: 02/03/09
LCS Analyzed: 02/03/2009 (9B03050-BS1)
3330 30-120Surrogate: Nitrobenzene-d5 ug/kg2560 77
6670 35-120Surrogate: Phenol-d6 ug/kg5800 87
3330 40-135Surrogate: Terphenyl-d14 ug/kg3220 97
Matrix Spike Analyzed: 02/04/2009 (9B03050-MS1) Source: ISA2775-10
1,4-Dichlorobenzene 3330 35-120ug/kg3302350 ND 71
2,4-Dinitrotoluene 3330 50-125ug/kg3303010 ND 90
Hexachlorobenzene 3330 50-120ug/kg3302980 ND 89
Hexachlorobutadiene 3330 40-120ug/kg3302390 ND 72
Hexachloroethane 3330 35-120ug/kg3302350 ND 70
2-Methylphenol 3330 40-120ug/kg3303240 ND 97
Nitrobenzene 3330 40-120ug/kg3302520 ND 76
Pentachlorophenol 3330 30-120ug/kg8302210 ND 66
Pyridine 3330 25-130ug/kg2001240 ND 37
2,4,5-Trichlorophenol 3330 45-120ug/kg3302950 ND 89
2,4,6-Trichlorophenol 3330 45-120ug/kg3302840 ND 85
3,4-Methylphenol 3330 50-120ug/kg3303120 ND 94
6670 35-125Surrogate: 2,4,6-Tribromophenol ug/kg5630 84
3330 35-120Surrogate: 2-Fluorobiphenyl ug/kg2660 80
6670 25-120Surrogate: 2-Fluorophenol ug/kg5680 85
3330 30-120Surrogate: Nitrobenzene-d5 ug/kg2550 76
6670 35-120Surrogate: Phenol-d6 ug/kg6550 98
3330 40-135Surrogate: Terphenyl-d14 ug/kg3540 106
Matrix Spike Dup Analyzed: 02/04/2009 (9B03050-MSD1) Source: ISA2775-10
1,4-Dichlorobenzene 3330 2535-120ug/kg3302150 ND 65 9
2,4-Dinitrotoluene 3330 2550-125ug/kg3302900 ND 87 3
Hexachlorobenzene 3330 2550-120ug/kg3303010 ND 90 1
Hexachlorobutadiene 3330 2540-120ug/kg3302340 ND 70 2
Hexachloroethane 3330 3035-120ug/kg3302190 ND 66 7
2-Methylphenol 3330 2540-120ug/kg3303020 ND 91 7
Nitrobenzene 3330 2540-120ug/kg3302510 ND 75 1
Pentachlorophenol 3330 2530-120ug/kg8302230 ND 67 1
Pyridine 3330 3025-130ug/kg2001140 ND 34 9
2,4,5-Trichlorophenol 3330 2045-120ug/kg3302920 ND 88 1
2,4,6-Trichlorophenol 3330 2545-120ug/kg3302900 ND 87 2
3,4-Methylphenol 3330 2550-120ug/kg3302870 ND 86 8
Project Manager
TestAmerica Irvine
ISA2466
Lena Davidkova
The results pertain only to the samples tested in the laboratory. This report shall not be reproduced,
except in full, without written permission from TestAmerica. <Page 14 of 25>
pw://Carollo/Documents/Client/CA/EMWD/7324C00/Deliverables/Report/NWRI/Appendix E.pdf

17461 Derian Avenue. Suite 100, Irvine, CA 92614 (949) 261-1022 Fax:(949) 260-3297
Carollo Engineers, Fountain Valley
10540 Talbert Ave, East Bldg., Suite 200
Fountain Valley, CA 92708
Attention: Winnie Shih
Sampled:
Received:
01/26/09
01/27/09Report Number:
Project ID:
ISA2466
Eastern ZLD Phase II
RO Waste Characterization
Result Limit
Reporting
Units Level
Spike
Result
Source
%REC
%REC
Limits RPD
RPD
Limit Analyte
SEMI-VOLATILE ORGANICS BY GC/MS (EPA 3545/8270C)
METHOD BLANK/QC DATA
Data
Qualifiers
Batch: 9B03050 Extracted: 02/03/09
Matrix Spike Dup Analyzed: 02/04/2009 (9B03050-MSD1) Source: ISA2775-10
6660 35-125Surrogate: 2,4,6-Tribromophenol ug/kg5770 87
3330 35-120Surrogate: 2-Fluorobiphenyl ug/kg2650 80
6660 25-120Surrogate: 2-Fluorophenol ug/kg5410 81
3330 30-120Surrogate: Nitrobenzene-d5 ug/kg2510 75
6660 35-120Surrogate: Phenol-d6 ug/kg6050 91
3330 40-135Surrogate: Terphenyl-d14 ug/kg3410 102
Project Manager
TestAmerica Irvine
ISA2466
Lena Davidkova
The results pertain only to the samples tested in the laboratory. This report shall not be reproduced,
except in full, without written permission from TestAmerica. <Page 15 of 25>
pw://Carollo/Documents/Client/CA/EMWD/7324C00/Deliverables/Report/NWRI/Appendix E.pdf

17461 Derian Avenue. Suite 100, Irvine, CA 92614 (949) 261-1022 Fax:(949) 260-3297
Carollo Engineers, Fountain Valley
10540 Talbert Ave, East Bldg., Suite 200
Fountain Valley, CA 92708
Attention: Winnie Shih
Sampled:
Received:
01/26/09
01/27/09Report Number:
Project ID:
ISA2466
Eastern ZLD Phase II
RO Waste Characterization
Result Limit
Reporting
Units Level
Spike
Result
Source
%REC
%REC
Limits RPD
RPD
Limit Analyte
ORGANOCHLORINE PESTICIDES (EPA 8081A)
METHOD BLANK/QC DATA
Data
Qualifiers
Batch: 9B03119 Extracted: 02/03/09
Blank Analyzed: 02/05/2009 (9B03119-BLK1)
4,4'-DDD ug/kg5.0ND
4,4'-DDE ug/kg5.0ND
4,4'-DDT ug/kg5.0ND
Aldrin ug/kg5.0ND
alpha-BHC ug/kg5.0ND
beta-BHC ug/kg5.0ND
delta-BHC ug/kg10ND
Dieldrin ug/kg5.0ND
Endosulfan I ug/kg5.0ND
Endosulfan II ug/kg5.0ND
Endosulfan sulfate ug/kg10ND
Endrin ug/kg5.0ND
Endrin aldehyde ug/kg5.0ND
Endrin ketone ug/kg5.0ND
gamma-BHC (Lindane) ug/kg5.0ND
Heptachlor ug/kg5.0ND
Heptachlor epoxide ug/kg5.0ND
Methoxychlor ug/kg5.0ND
Chlordane ug/kg50ND
Toxaphene ug/kg200ND
33.3 45-120Surrogate: Decachlorobiphenyl ug/kg30.6 92
33.3 35-115Surrogate: Tetrachloro-m-xylene ug/kg29.0 87
LCS Analyzed: 02/05/2009 (9B03119-BS1) MNR
4,4'-DDD 33.3 60-120ug/kg5.030.0 90
4,4'-DDE 33.3 60-120ug/kg5.029.7 89
4,4'-DDT 33.3 65-120ug/kg5.030.5 91
Aldrin 33.3 50-115ug/kg5.028.0 84
alpha-BHC 33.3 60-115ug/kg5.030.6 92
beta-BHC 33.3 60-115ug/kg5.026.3 79
delta-BHC 33.3 60-115ug/kg1027.9 84
Dieldrin 33.3 65-115ug/kg5.028.1 84
Endosulfan I 33.3 40-120ug/kg5.028.3 85
Endosulfan II 33.3 55-120ug/kg5.030.2 90
Endosulfan sulfate 33.3 65-115ug/kg1028.1 84
Endrin 33.3 55-120ug/kg5.030.7 92
Project Manager
TestAmerica Irvine
ISA2466
Lena Davidkova
The results pertain only to the samples tested in the laboratory. This report shall not be reproduced,
except in full, without written permission from TestAmerica. <Page 16 of 25>
pw://Carollo/Documents/Client/CA/EMWD/7324C00/Deliverables/Report/NWRI/Appendix E.pdf

17461 Derian Avenue. Suite 100, Irvine, CA 92614 (949) 261-1022 Fax:(949) 260-3297
Carollo Engineers, Fountain Valley
10540 Talbert Ave, East Bldg., Suite 200
Fountain Valley, CA 92708
Attention: Winnie Shih
Sampled:
Received:
01/26/09
01/27/09Report Number:
Project ID:
ISA2466
Eastern ZLD Phase II
RO Waste Characterization
Result Limit
Reporting
Units Level
Spike
Result
Source
%REC
%REC
Limits RPD
RPD
Limit Analyte
ORGANOCHLORINE PESTICIDES (EPA 8081A)
METHOD BLANK/QC DATA
Data
Qualifiers
Batch: 9B03119 Extracted: 02/03/09
LCS Analyzed: 02/05/2009 (9B03119-BS1) MNR
Endrin aldehyde 33.3 55-115ug/kg5.026.4 79
Endrin ketone 33.3 65-115ug/kg5.031.5 94
gamma-BHC (Lindane) 33.3 55-115ug/kg5.029.1 87
Heptachlor 33.3 55-115ug/kg5.028.1 84
Heptachlor epoxide 33.3 55-115ug/kg5.027.2 82
Methoxychlor 33.3 65-120ug/kg5.029.9 90
33.3 45-120Surrogate: Decachlorobiphenyl ug/kg26.6 80
33.3 35-115Surrogate: Tetrachloro-m-xylene ug/kg25.6 77
Project Manager
TestAmerica Irvine
ISA2466
Lena Davidkova
The results pertain only to the samples tested in the laboratory. This report shall not be reproduced,
except in full, without written permission from TestAmerica. <Page 17 of 25>
pw://Carollo/Documents/Client/CA/EMWD/7324C00/Deliverables/Report/NWRI/Appendix E.pdf

17461 Derian Avenue. Suite 100, Irvine, CA 92614 (949) 261-1022 Fax:(949) 260-3297
Carollo Engineers, Fountain Valley
10540 Talbert Ave, East Bldg., Suite 200
Fountain Valley, CA 92708
Attention: Winnie Shih
Sampled:
Received:
01/26/09
01/27/09Report Number:
Project ID:
ISA2466
Eastern ZLD Phase II
RO Waste Characterization
Result Limit
Reporting
Units Level
Spike
Result
Source
%REC
%REC
Limits RPD
RPD
Limit Analyte
POLYCHLORINATED BIPHENYLS (EPA 3545/8082)
METHOD BLANK/QC DATA
Data
Qualifiers
Batch: 9B04089 Extracted: 02/04/09
Blank Analyzed: 02/04/2009 (9B04089-BLK1)
Aroclor 1016 ug/kg50ND
Aroclor 1221 ug/kg50ND
Aroclor 1232 ug/kg50ND
Aroclor 1242 ug/kg50ND
Aroclor 1248 ug/kg50ND
Aroclor 1254 ug/kg50ND
Aroclor 1260 ug/kg50ND
33.3 45-120Surrogate: Decachlorobiphenyl ug/kg32.6 98
LCS Analyzed: 02/04/2009 (9B04089-BS1)
Aroclor 1016 267 65-115ug/kg50256 96
Aroclor 1260 267 65-115ug/kg50263 99
33.3 45-120Surrogate: Decachlorobiphenyl ug/kg33.2 100
Matrix Spike Analyzed: 02/04/2009 (9B04089-MS1) Source: ISA2624-04
Aroclor 1016 266 50-120ug/kg50247 ND 93
Aroclor 1260 266 50-125ug/kg50246 ND 92
33.2 45-120Surrogate: Decachlorobiphenyl ug/kg31.2 94
Matrix Spike Dup Analyzed: 02/04/2009 (9B04089-MSD1) Source: ISA2624-04
Aroclor 1016 266 3050-120ug/kg50254 ND 95 3
Aroclor 1260 266 3050-125ug/kg50256 ND 96 4
33.3 45-120Surrogate: Decachlorobiphenyl ug/kg32.9 99
Project Manager
TestAmerica Irvine
ISA2466
Lena Davidkova
The results pertain only to the samples tested in the laboratory. This report shall not be reproduced,
except in full, without written permission from TestAmerica. <Page 18 of 25>
pw://Carollo/Documents/Client/CA/EMWD/7324C00/Deliverables/Report/NWRI/Appendix E.pdf
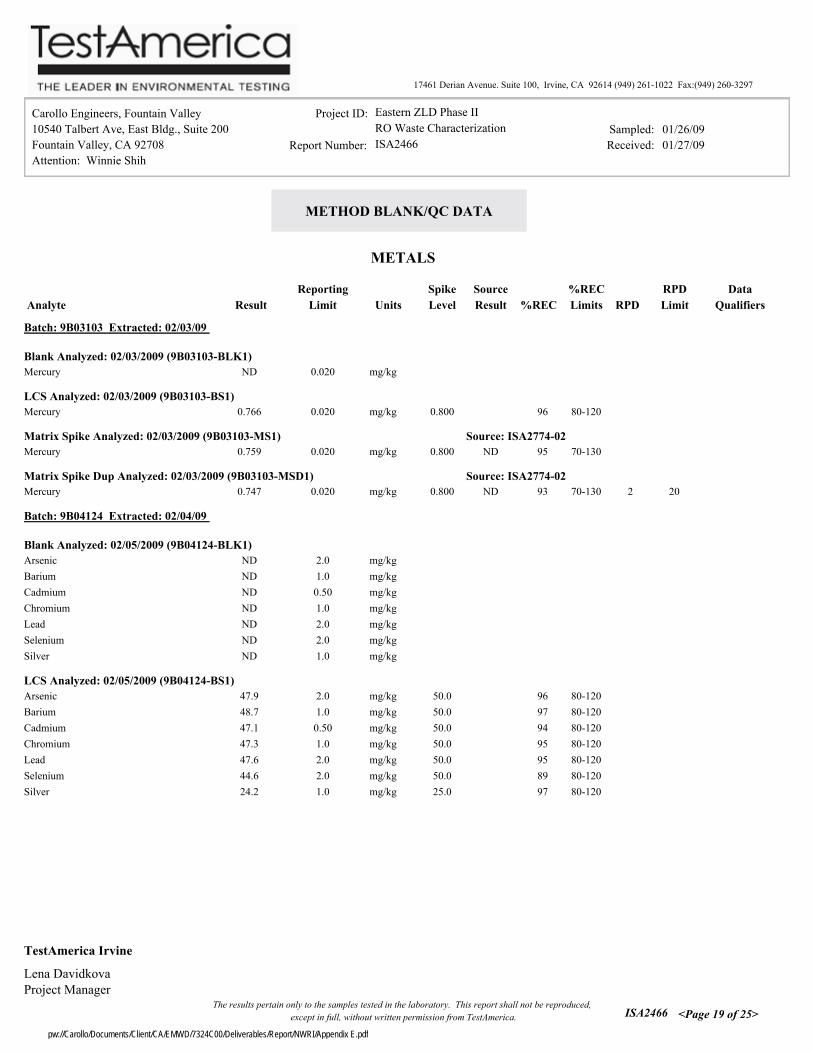
17461 Derian Avenue. Suite 100, Irvine, CA 92614 (949) 261-1022 Fax:(949) 260-3297
Carollo Engineers, Fountain Valley
10540 Talbert Ave, East Bldg., Suite 200
Fountain Valley, CA 92708
Attention: Winnie Shih
Sampled:
Received:
01/26/09
01/27/09Report Number:
Project ID:
ISA2466
Eastern ZLD Phase II
RO Waste Characterization
Result Limit
Reporting
Units Level
Spike
Result
Source
%REC
%REC
Limits RPD
RPD
Limit Analyte
METALS
METHOD BLANK/QC DATA
Data
Qualifiers
Batch: 9B03103 Extracted: 02/03/09
Blank Analyzed: 02/03/2009 (9B03103-BLK1)
Mercury mg/kg0.020ND
LCS Analyzed: 02/03/2009 (9B03103-BS1)
Mercury 0.800 80-120mg/kg0.0200.766 96
Matrix Spike Analyzed: 02/03/2009 (9B03103-MS1) Source: ISA2774-02
Mercury 0.800 70-130mg/kg0.0200.759 ND 95
Matrix Spike Dup Analyzed: 02/03/2009 (9B03103-MSD1) Source: ISA2774-02
Mercury 0.800 2070-130mg/kg0.0200.747 ND 93 2
Batch: 9B04124 Extracted: 02/04/09
Blank Analyzed: 02/05/2009 (9B04124-BLK1)
Arsenic mg/kg2.0ND
Barium mg/kg1.0ND
Cadmium mg/kg0.50ND
Chromium mg/kg1.0ND
Lead mg/kg2.0ND
Selenium mg/kg2.0ND
Silver mg/kg1.0ND
LCS Analyzed: 02/05/2009 (9B04124-BS1)
Arsenic 50.0 80-120mg/kg2.047.9 96
Barium 50.0 80-120mg/kg1.048.7 97
Cadmium 50.0 80-120mg/kg0.5047.1 94
Chromium 50.0 80-120mg/kg1.047.3 95
Lead 50.0 80-120mg/kg2.047.6 95
Selenium 50.0 80-120mg/kg2.044.6 89
Silver 25.0 80-120mg/kg1.024.2 97
Project Manager
TestAmerica Irvine
ISA2466
Lena Davidkova
The results pertain only to the samples tested in the laboratory. This report shall not be reproduced,
except in full, without written permission from TestAmerica. <Page 19 of 25>
pw://Carollo/Documents/Client/CA/EMWD/7324C00/Deliverables/Report/NWRI/Appendix E.pdf

17461 Derian Avenue. Suite 100, Irvine, CA 92614 (949) 261-1022 Fax:(949) 260-3297
Carollo Engineers, Fountain Valley
10540 Talbert Ave, East Bldg., Suite 200
Fountain Valley, CA 92708
Attention: Winnie Shih
Sampled:
Received:
01/26/09
01/27/09Report Number:
Project ID:
ISA2466
Eastern ZLD Phase II
RO Waste Characterization
Result Limit
Reporting
Units Level
Spike
Result
Source
%REC
%REC
Limits RPD
RPD
Limit Analyte
METALS
METHOD BLANK/QC DATA
Data
Qualifiers
Batch: 9B04124 Extracted: 02/04/09
Matrix Spike Analyzed: 02/05/2009 (9B04124-MS1) Source: ISA2686-01
Arsenic 50.0 75-125mg/kg2.071.2 24.5 93
Barium 50.0 75-125mg/kg1.0319 MHA270 97
Cadmium 50.0 75-125mg/kg0.5044.7 0.277 89
Chromium 50.0 75-125mg/kg1.079.9 36.3 87
Lead 50.0 75-125mg/kg2.061.0 16.7 89
Selenium 50.0 75-125mg/kg2.046.9 3.93 86
Silver 25.0 75-125mg/kg1.025.2 0.921 97
Matrix Spike Dup Analyzed: 02/05/2009 (9B04124-MSD1) Source: ISA2686-01
Arsenic 50.0 2075-125mg/kg2.069.9 24.5 91 2
Barium 50.0 2075-125mg/kg1.0300 MHA270 60 6
Cadmium 50.0 2075-125mg/kg0.5044.7 0.277 89 0
Chromium 50.0 2075-125mg/kg1.076.8 36.3 81 4
Lead 50.0 2075-125mg/kg2.059.7 16.7 86 2
Selenium 50.0 2075-125mg/kg2.046.0 3.93 84 2
Silver 25.0 2075-125mg/kg1.024.5 0.921 94 3
Project Manager
TestAmerica Irvine
ISA2466
Lena Davidkova
The results pertain only to the samples tested in the laboratory. This report shall not be reproduced,
except in full, without written permission from TestAmerica. <Page 20 of 25>
pw://Carollo/Documents/Client/CA/EMWD/7324C00/Deliverables/Report/NWRI/Appendix E.pdf

17461 Derian Avenue. Suite 100, Irvine, CA 92614 (949) 261-1022 Fax:(949) 260-3297
Carollo Engineers, Fountain Valley
10540 Talbert Ave, East Bldg., Suite 200
Fountain Valley, CA 92708
Attention: Winnie Shih
Sampled:
Received:
01/26/09
01/27/09Report Number:
Project ID:
ISA2466
Eastern ZLD Phase II
RO Waste Characterization
Result Limit
Reporting
Units Level
Spike
Result
Source
%REC
%REC
Limits RPD
RPD
Limit Analyte
INORGANICS
METHOD BLANK/QC DATA
Data
Qualifiers
Batch: 9A31054 Extracted: 01/31/09
Duplicate Analyzed: 02/01/2009 (9A31054-DUP1) Source: ISA2736-04
pH 5pH Units0.1007.94 7.94 0
Duplicate Analyzed: 02/01/2009 (9A31054-DUP2) Source: ISA2736-12
pH 5pH Units0.1008.73 8.72 0
Project Manager
TestAmerica Irvine
ISA2466
Lena Davidkova
The results pertain only to the samples tested in the laboratory. This report shall not be reproduced,
except in full, without written permission from TestAmerica. <Page 21 of 25>
pw://Carollo/Documents/Client/CA/EMWD/7324C00/Deliverables/Report/NWRI/Appendix E.pdf

17461 Derian Avenue. Suite 100, Irvine, CA 92614 (949) 261-1022 Fax:(949) 260-3297
Carollo Engineers, Fountain Valley
10540 Talbert Ave, East Bldg., Suite 200
Fountain Valley, CA 92708
Attention: Winnie Shih
Sampled:
Received:
01/26/09
01/27/09Report Number:
Project ID:
ISA2466
Eastern ZLD Phase II
RO Waste Characterization
Result Limit
Reporting
Units Level
Spike
Result
Source
%REC
%REC
Limits RPD
RPD
Limit Analyte
Chlorinated Herbicides per EPA Method 8151A Modified
METHOD BLANK/QC DATA
Data
Qualifiers
Batch: 9020057 Extracted: 02/03/09
Blank Analyzed: 02/08/2009 (9020057-BLK1)
2,4-D ug/l1.00ND
2,4-DB ug/l1.00ND
2,4,5-T ug/l1.00ND
2,4,5-TP (Silvex) ug/l1.00ND
Dalapon ug/l5.00ND
Dicamba ug/l1.00ND
Dichlorprop ug/l1.00ND
Dinoseb ug/l1.00ND
MCPA ug/l300ND
MCPP ug/l300ND
25.0 40-160Surrogate: 2,4-Dichlorophenylacetic acid ug/l31.5 126
LCS Analyzed: 02/08/2009 (9020057-BS1)
2,4-D 20.0 60-140ug/l1.0024.1 121
2,4-DB 20.0 55-130ug/l1.0021.8 109
2,4,5-T 20.0 50-110ug/l1.0024.0 L120
2,4,5-TP (Silvex) 20.0 60-115ug/l1.0023.3 L116
Dalapon 20.0 60-110ug/l5.0025.2 L126
Dicamba 20.0 60-110ug/l1.0023.0 L115
Dichlorprop 20.0 70-120ug/l1.0022.3 111
Dinoseb 20.0 40-95ug/l1.0024.5 L122
MCPA 2000 60-140ug/l3001790 90
MCPP 2000 60-140ug/l3001920 96
25.0 40-160Surrogate: 2,4-Dichlorophenylacetic acid ug/l29.3 117
Duplicate Analyzed: 02/08/2009 (9020057-DUP1) Source: ISA2466-01
2,4-D 30ug/l4.00ND CND
2,4-DB 30ug/l4.00ND CND
2,4,5-T 30ug/l4.00ND CND
2,4,5-TP (Silvex) 30ug/l4.00ND CND
Dalapon 30ug/l20.0ND ND
Dicamba 30ug/l4.00ND ND
Dichlorprop 30ug/l4.00ND CND
Dinoseb 30ug/l4.00ND ND
MCPA 30ug/l1200ND ND
MCPP 30ug/l1200ND ND
100 40-160Surrogate: 2,4-Dichlorophenylacetic acid ug/l108 C8108
Project Manager
TestAmerica Irvine
ISA2466
Lena Davidkova
The results pertain only to the samples tested in the laboratory. This report shall not be reproduced,
except in full, without written permission from TestAmerica. <Page 22 of 25>
pw://Carollo/Documents/Client/CA/EMWD/7324C00/Deliverables/Report/NWRI/Appendix E.pdf
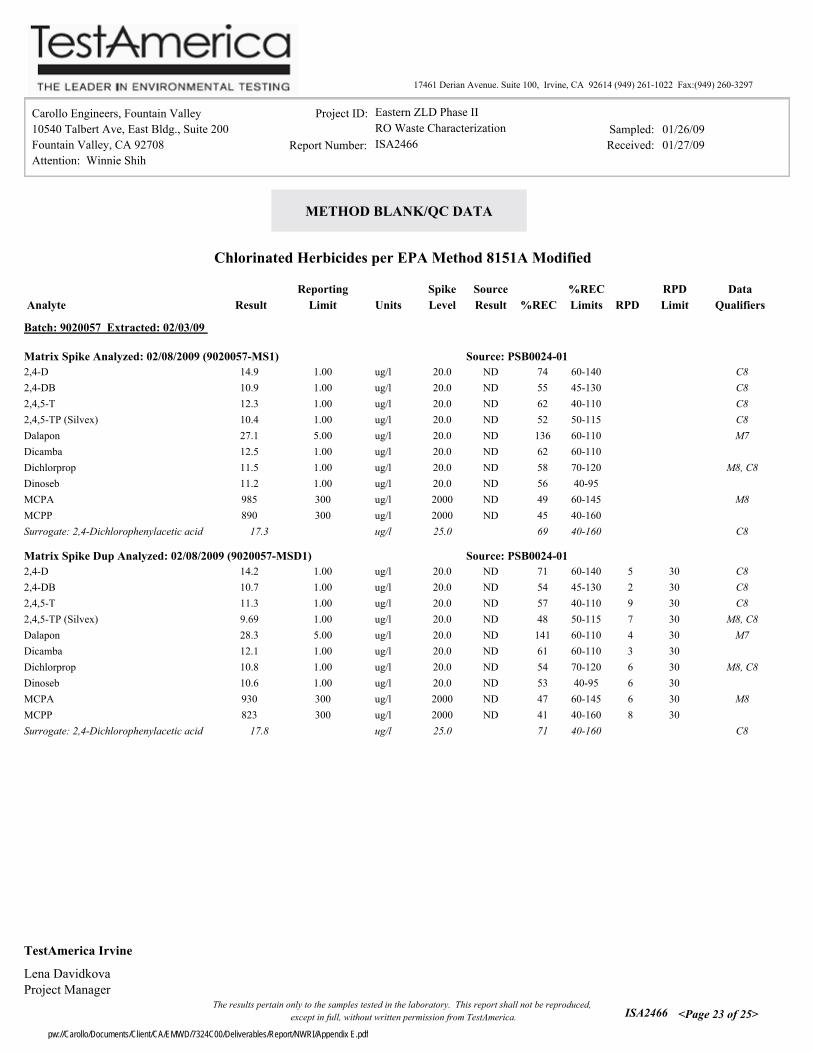
17461 Derian Avenue. Suite 100, Irvine, CA 92614 (949) 261-1022 Fax:(949) 260-3297
Carollo Engineers, Fountain Valley
10540 Talbert Ave, East Bldg., Suite 200
Fountain Valley, CA 92708
Attention: Winnie Shih
Sampled:
Received:
01/26/09
01/27/09Report Number:
Project ID:
ISA2466
Eastern ZLD Phase II
RO Waste Characterization
Result Limit
Reporting
Units Level
Spike
Result
Source
%REC
%REC
Limits RPD
RPD
Limit Analyte
Chlorinated Herbicides per EPA Method 8151A Modified
METHOD BLANK/QC DATA
Data
Qualifiers
Batch: 9020057 Extracted: 02/03/09
Matrix Spike Analyzed: 02/08/2009 (9020057-MS1) Source: PSB0024-01
2,4-D 20.0 60-140ug/l1.0014.9 C8ND 74
2,4-DB 20.0 45-130ug/l1.0010.9 C8ND 55
2,4,5-T 20.0 40-110ug/l1.0012.3 C8ND 62
2,4,5-TP (Silvex) 20.0 50-115ug/l1.0010.4 C8ND 52
Dalapon 20.0 60-110ug/l5.0027.1 M7ND 136
Dicamba 20.0 60-110ug/l1.0012.5 ND 62
Dichlorprop 20.0 70-120ug/l1.0011.5 M8, C8ND 58
Dinoseb 20.0 40-95ug/l1.0011.2 ND 56
MCPA 2000 60-145ug/l300985 M8ND 49
MCPP 2000 40-160ug/l300890 ND 45
25.0 40-160Surrogate: 2,4-Dichlorophenylacetic acid ug/l17.3 C869
Matrix Spike Dup Analyzed: 02/08/2009 (9020057-MSD1) Source: PSB0024-01
2,4-D 20.0 3060-140ug/l1.0014.2 C8ND 71 5
2,4-DB 20.0 3045-130ug/l1.0010.7 C8ND 54 2
2,4,5-T 20.0 3040-110ug/l1.0011.3 C8ND 57 9
2,4,5-TP (Silvex) 20.0 3050-115ug/l1.009.69 M8, C8ND 48 7
Dalapon 20.0 3060-110ug/l5.0028.3 M7ND 141 4
Dicamba 20.0 3060-110ug/l1.0012.1 ND 61 3
Dichlorprop 20.0 3070-120ug/l1.0010.8 M8, C8ND 54 6
Dinoseb 20.0 3040-95ug/l1.0010.6 ND 53 6
MCPA 2000 3060-145ug/l300930 M8ND 47 6
MCPP 2000 3040-160ug/l300823 ND 41 8
25.0 40-160Surrogate: 2,4-Dichlorophenylacetic acid ug/l17.8 C871
Project Manager
TestAmerica Irvine
ISA2466
Lena Davidkova
The results pertain only to the samples tested in the laboratory. This report shall not be reproduced,
except in full, without written permission from TestAmerica. <Page 23 of 25>
pw://Carollo/Documents/Client/CA/EMWD/7324C00/Deliverables/Report/NWRI/Appendix E.pdf

17461 Derian Avenue. Suite 100, Irvine, CA 92614 (949) 261-1022 Fax:(949) 260-3297
Carollo Engineers, Fountain Valley
10540 Talbert Ave, East Bldg., Suite 200
Fountain Valley, CA 92708
Attention: Winnie Shih
Sampled:
Received:
01/26/09
01/27/09Report Number:
Project ID:
ISA2466
Eastern ZLD Phase II
RO Waste Characterization
DATA QUALIFIERS AND DEFINITIONS
C Calibration Verification recovery was above the method control limit for this analyte. Analyte not detected, data not
impacted.
C8 Calibration Verification recovery was above the method control limit for this analyte. A high bias may be indicated.
L Laboratory Control Sample and/or Laboratory Control Sample Duplicate recovery was above the acceptance limits.
Analyte not detected, data not impacted.
M7 The MS and/or MSD were above the acceptance limits. See Blank Spike (LCS).
M8 The MS and/or MSD were below the acceptance limits. See Blank Spike (LCS).
MHA Due to high levels of analyte in the sample, the MS/MSD calculation does not provide useful spike recovery
information. See Blank Spike (LCS).
MNR No results were reported for the MS/MSD. The sample used for the MS/MSD required dilution due to the sample
matrix. Because of this, the spike compounds were diluted below the detection limit.
MNR1 There was no MS/MSD analyzed with this batch due to insufficient sample volume. See Blank Spike/Blank Spike
Duplicate.
RL1 Reporting limit raised due to sample matrix effects.
Relative Percent DifferenceRPD
Analyte NOT DETECTED at or above the reporting limit or MDL, if MDL is specified.ND
ADDITIONAL COMMENTS
Due to the high water solubility of alcohols and ketones, the calibration criteria for these compounds is <30% RSD.
The average % RSD of all compounds in the calibration is 15%, in accordance with EPA methods.
For 8260 analyses:
For Extractable Fuel Hydrocarbons (EFH, DRO, ORO) :
Unless otherwise noted, Extractable Fuel Hydrocarbons (EFH, DRO, ORO) are quantitated against a Diesel Fuel Standard.
Project Manager
TestAmerica Irvine
ISA2466
Lena Davidkova
The results pertain only to the samples tested in the laboratory. This report shall not be reproduced,
except in full, without written permission from TestAmerica. <Page 24 of 25>
pw://Carollo/Documents/Client/CA/EMWD/7324C00/Deliverables/Report/NWRI/Appendix E.pdf

17461 Derian Avenue. Suite 100, Irvine, CA 92614 (949) 261-1022 Fax:(949) 260-3297
Carollo Engineers, Fountain Valley
10540 Talbert Ave, East Bldg., Suite 200
Fountain Valley, CA 92708
Attention: Winnie Shih
Sampled:
Received:
01/26/09
01/27/09Report Number:
Project ID:
ISA2466
Eastern ZLD Phase II
RO Waste Characterization
Certification Summary
Method Matrix Nelac California
TestAmerica Irvine
XSolid XEPA 3545/8081A
XSolid XEPA 6010B
XSolid XEPA 7471A
N/ASolid N/AEPA 8015B MOD.
XSolid XEPA 8082
XSolid XEPA 8260B
XSolid XEPA 8270C
XSolid XEPA 9045C
Nevada and NELAP provide analyte specific accreditations. Analyte specific information for TestAmerica may be obtained by contacting
the laboratory or visiting our website at www.testamericainc.com
Subcontracted Laboratories
TestAmerica - Portland, OR
9405 Southwest Nimbus Avenue - Beaverton, OR 97008
Method Performed: 8151modSamples: ISA2466-01
Project Manager
TestAmerica Irvine
ISA2466
Lena Davidkova
The results pertain only to the samples tested in the laboratory. This report shall not be reproduced,
except in full, without written permission from TestAmerica. <Page 25 of 25>
pw://Carollo/Documents/Client/CA/EMWD/7324C00/Deliverables/Report/NWRI/Appendix E.pdf
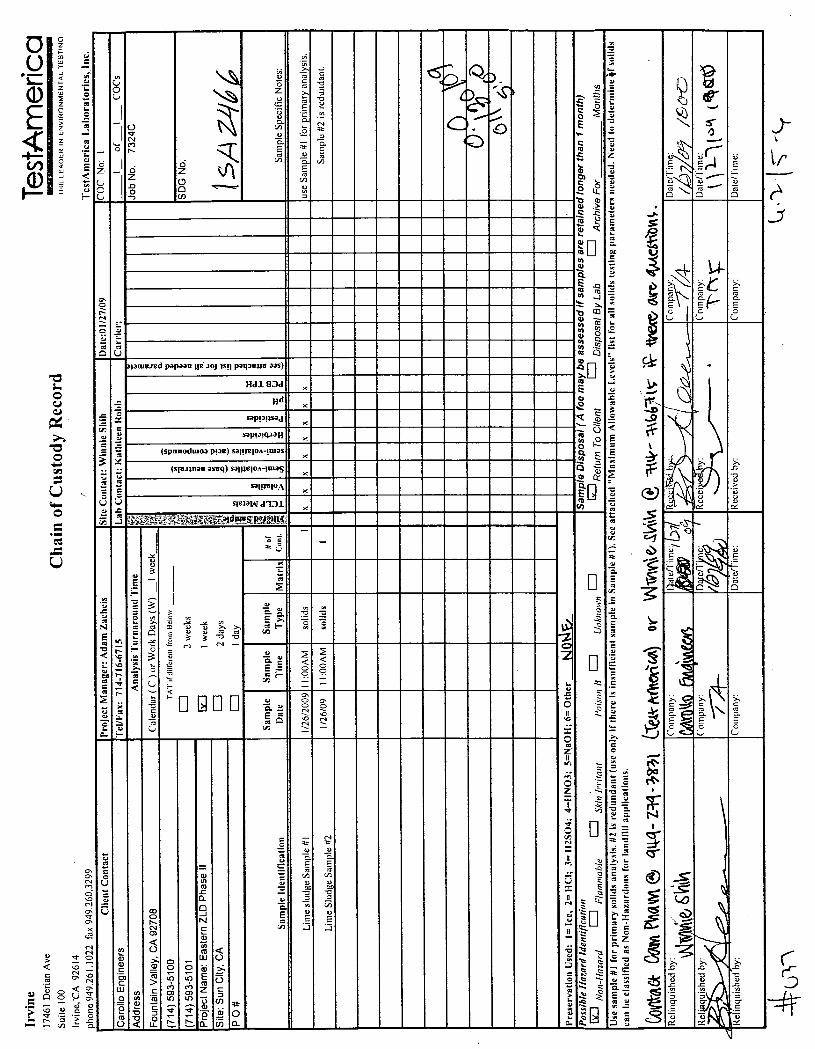
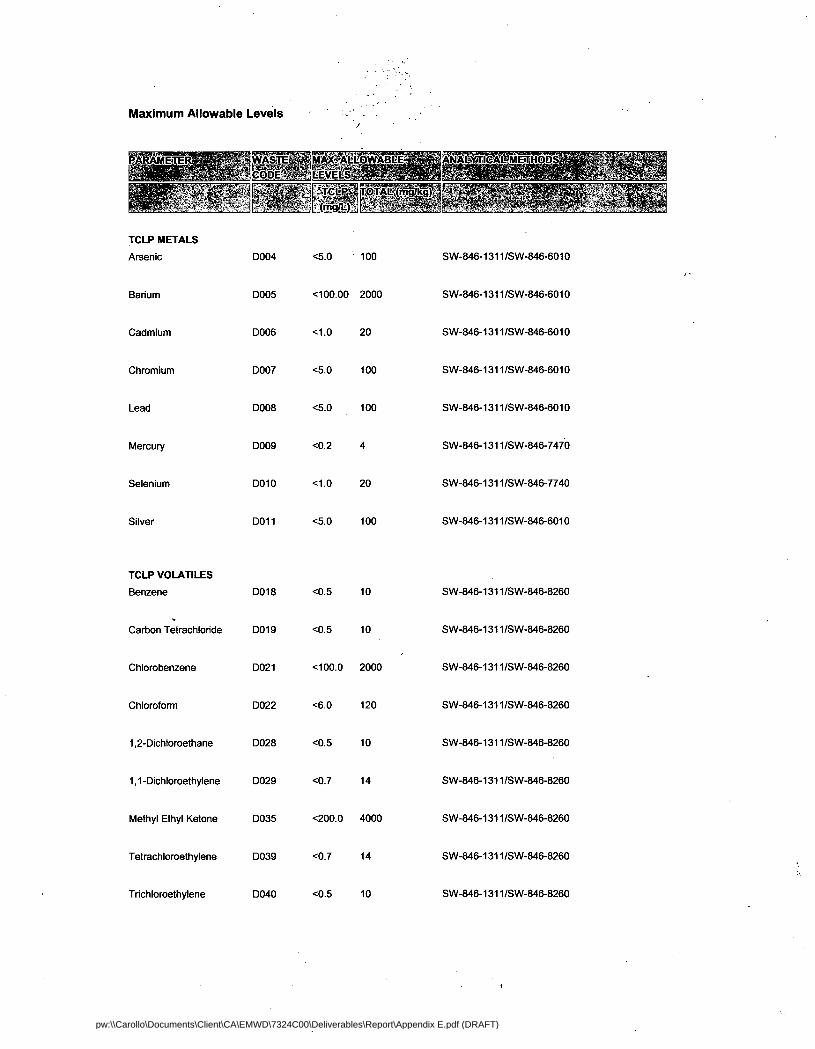
pw:\\Carollo\Documents\Client\CA\EMWD\7324C00\Deliverables\Report\Appendix E.pdf (DRAFT)
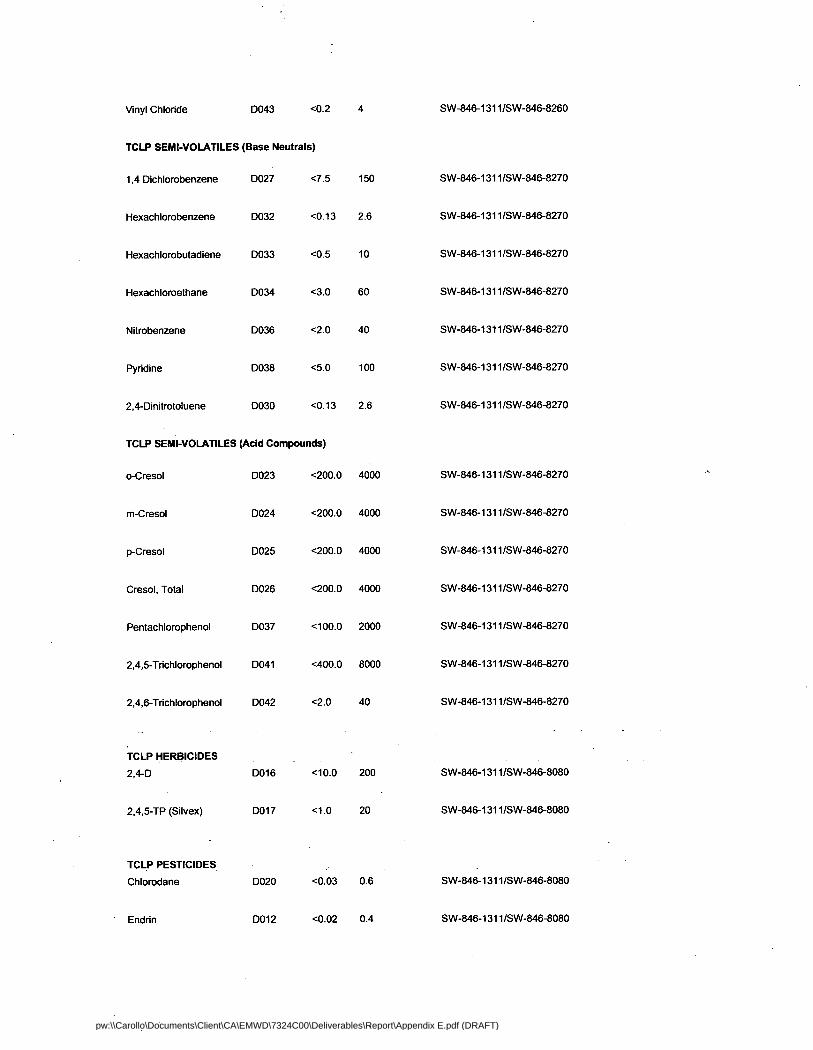
pw:\\Carollo\Documents\Client\CA\EMWD\7324C00\Deliverables\Report\Appendix E.pdf (DRAFT)

pw:\\Carollo\Documents\Client\CA\EMWD\7324C00\Deliverables\Report\Appendix E.pdf (DRAFT)

F-1
Appendix F
SLUDGE DEWATERING EVALUATION REPORT

FILTER PRESS DEWATERING EVALUATION
FOR
CAROLLO ENGINEERS Fountain Valley, CA
April 16, 2009
Lab Test #9267 Lime-Soda Ash Softening Sludge
(EMWD Sun City ZLD Phase 2)
PREPARED BY
Siemens Water Technologies 2155 112th Avenue, Holland, MI 49424 PH: 616-772-9011, FX: 616-772-4516
Technical Sales Mgr: Mike Spring
pw://Carollo/Documents/Client/CA/EMWD/7324C00/Deliverables/Report/NWRI/Appendix F.pdf

April 16, 2009 Page 2 of 7 Siemens Water Technologies
Carollo Engineers EMWD Sun City Phase 2
Lab Test #9267
Dewatering Evaluation Testing was requested to evaluate the dewatering characteristics of a sample of lime-soda ash softening sludge from pilot testing at the Eastern Municipal Water District (EMWD) facility in Sun City, California. The slurry sample was submitted by Adam Zacheis of Carollo Engineers. Description of Slurry: Lime-Soda Ash Softening Sludge Application Code: W056 The purpose of the testing is to generate relevant data to be used to size the dewatering equipment as well as to confirm key process parameters such as maximum feed pressure and cake thickness. Test Method Testing was performed as indicated below to determine the amenability of the slurry to pressure filtration. Conditioning of the sludge was not required prior to testing to enhance or improve dewatering. A benchtop pressure filtration test was performed with a 3” Lab Filter Press. Slurry was placed in the sample reservoir, which was subsequently pressurized with compressed air. The feed pressure was started at 25psig and staged to a final pressure of 100psig. Completion of the filtration cycle was determined when the filtrate flow reached an approximate rate of 0.01 gpm per square foot of filtration area. Cake air blowdown was performed prior to discharging the filter cake.
3” Lab Filter Press
pw://Carollo/Documents/Client/CA/EMWD/7324C00/Deliverables/Report/NWRI/Appendix F.pdf

April 16, 2009 Page 3 of 7 Siemens Water Technologies
Carollo Engineers EMWD Sun City Phase 2
Lab Test #9267
Conclusions/Recommendations The testing performed produced an acceptable filter cake that did not contain any free liquids, which therefore, would pass the “paint filter test”. The dry solids content of the filter cake is expected to be from 55-60% by weight with a wet cake density of 96 lbs/ft3. Total cycle time, excluding cake discharge, is estimated to be 1.2 -1.5 hours. The time required for cake discharge would be determined by the type of plate shifting selected, if any, and/or the size of the filter press. The outcome of the test was based on the characteristics of the sample submitted as shown in the Summary of Test Results and Slurry Analysis. Actual performance may change if the future sludge characteristics are different or vary. The performance of the full-scale application will be dependent on the slurry being relatively similar to the sample tested.
pw://Carollo/Documents/Client/CA/EMWD/7324C00/Deliverables/Report/NWRI/Appendix F.pdf
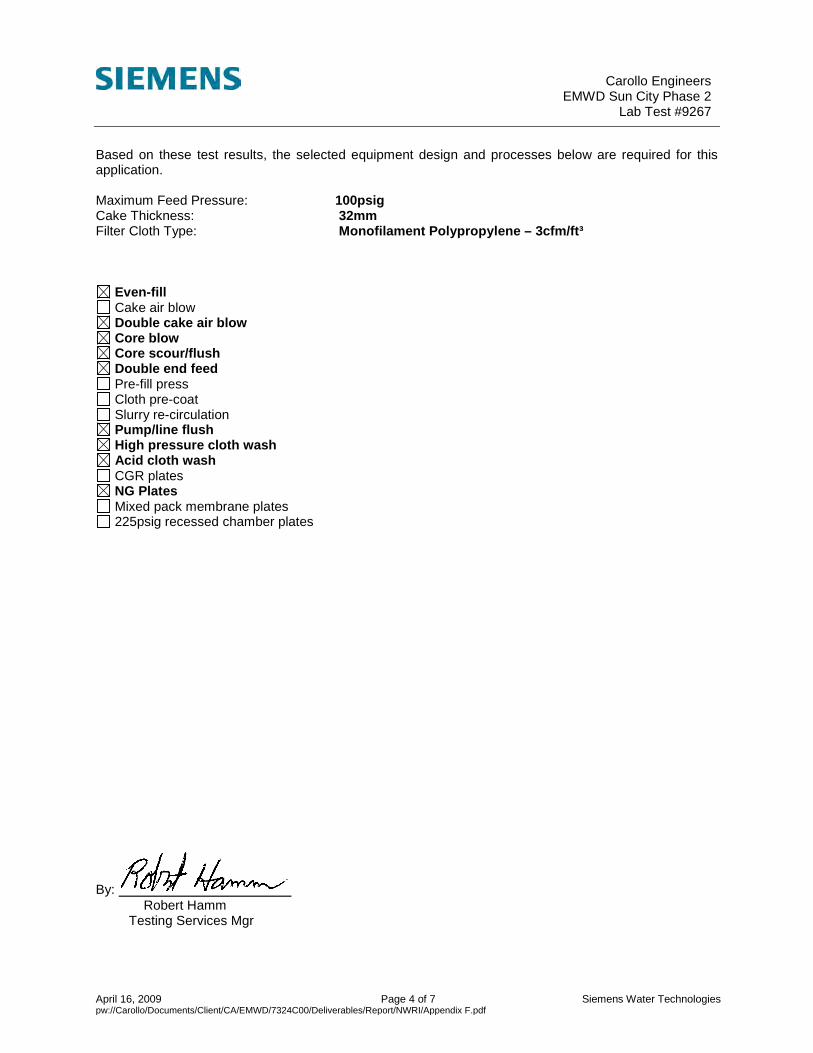
April 16, 2009 Page 4 of 7 Siemens Water Technologies
Carollo Engineers EMWD Sun City Phase 2
Lab Test #9267
Based on these test results, the selected equipment design and processes below are required for this application. Maximum Feed Pressure: 100psig Cake Thickness: 32mm Filter Cloth Type: Monofilament Polypropylene – 3cfm/ft³
Even-fill Cake air blow Double cake air blow Core blow Core scour/flush Double end feed Pre-fill press Cloth pre-coat Slurry re-circulation Pump/line flush High pressure cloth wash Acid cloth wash CGR plates NG Plates Mixed pack membrane plates 225psig recessed chamber plates
By: Robert Hamm Testing Services Mgr
pw://Carollo/Documents/Client/CA/EMWD/7324C00/Deliverables/Report/NWRI/Appendix F.pdf

April 16, 2009 Page 5 of 7 Siemens Water Technologies
Carollo Engineers EMWD Sun City Phase 2
Lab Test #9267
Summary of Test Results
Sludge Type Lime-Soda Ash Softening Slurry
Trial Number As-Received 1
Total Susp. Solids (% w/w) 15.9 5.67
Total Susp. Solids (mg/l) 185,100 59,500
Total Solids (% w/w) 17.6 -
Total Dissolved Solids (% w/w) 1.70 -
Volatile Solids (% of TS) - -
Specific Gravity 1.16 1.05
pH (s.u.) 12.6 12.1
Color White White
CST (secs.) - -
Bodyfeed Type -
Bodyfeed Dosage (mg/l) -
Bodyfeed Dosage (% of DS) -
Cake Thickness (mm) 32
Filter Cloth Type Mo/PP-3
Cloth Precoat (Y/N) No
Filtration Time (mins.) 50
Max. Filtration Press. (psig) 100
Filtrate Quality Clear
Slurry Temperature (oF) 70
Cake Air Blow (mins./psig) 4/40
Squeeze (mins./psig) -
Cake Wash (volumes/mins./psig) -
Nature of Cake Firm
Cake Release From Cloths Good
Cake Dry Solids (% w/w) 57.9
Wet Cake Density (lbs/ft3) 96
Dry Solids Output (lbs/ft3) 55.6
Notes 1,
Notes: 1. As-received sample was diluted with water to obtain a slurry with 5-6% TSS.
pw://Carollo/Documents/Client/CA/EMWD/7324C00/Deliverables/Report/NWRI/Appendix F.pdf

April 16, 2009 Page 6 of 7 Siemens Water Technologies
Carollo Engineers EMWD Sun City Phase 2
Lab Test #9267
Slurry Analysis
Sludge Type Lime Softening Sludge
Aluminum, total <21 mg/kg (dry basis) <4.3* mg/l
Calcium, total 320,000 mg/kg (dry basis) 65,700* mg/l
Iron, total 105 mg/kg (dry basis) 21.6* mg/l
Chloride 16,800 mg/kg (dry basis) 3,450* mg/l
Solid, total 17.7 % by weight
Analysis by: Kar Laboratories, Kalamazoo, MI * Value calculated from the analytical results and specific gravity of the slurry.
pw://Carollo/Documents/Client/CA/EMWD/7324C00/Deliverables/Report/NWRI/Appendix F.pdf
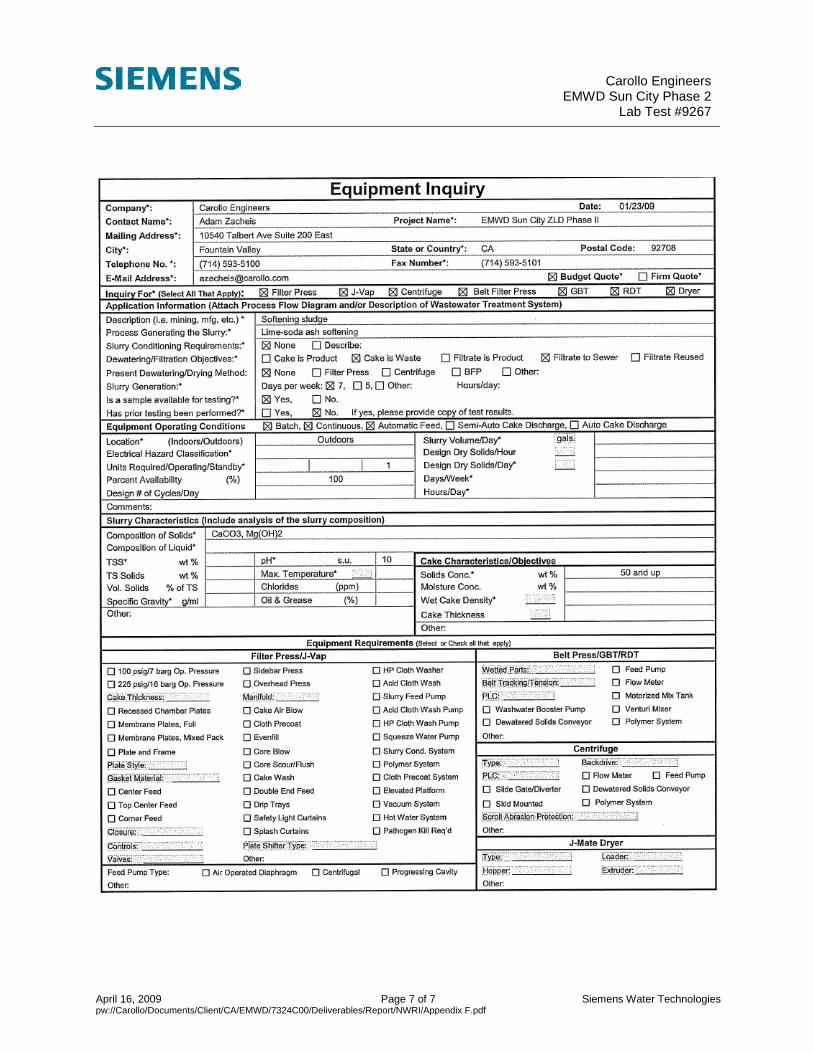
April 16, 2009 Page 7 of 7 Siemens Water Technologies
Carollo Engineers EMWD Sun City Phase 2
Lab Test #9267
pw://Carollo/Documents/Client/CA/EMWD/7324C00/Deliverables/Report/NWRI/Appendix F.pdf
G-1
Appendix G
COST ESTIMATE

Cost Constants: Lime/SA Lime/SA Lime/SA- Cost of Lime ($/t) - Quicklime (90% Pure CaO) $130.00 $130.00 $130.00- Cost of Soda Ash ($/lb) $0.20 $0.20 $0.20- Cost of Acid ($/gal) - 93% pure $3.50 $3.50 $3.50- Cost of Sodium Hydroxide - 50% $0.16 $0.16 $0.16- Electrical Power ($/kWh) $0.13 $0.13 $0.13- Sludge disposal Cost ($/t) $55.00 $55.00 $55.00- SARI BOD Rate (BOD/1000 lbs) $283.00 $283.00 $283.00- Assumed BOD (mg/L) 20 20 20- BOD, ppd 764 764 764- SARI SS Rate (SS/1000 lbs) $420.00 $420.00 $420.00- Assumed SS (mg/L) 18 18 18- SS, ppd 688 688 688- SARI Flow Rate (/mgd) $840.00 $840.00 $840.00- SARI Fixed Pipe Charge (per month) $2,581.00 $2,581.00 $2,581.00- SARI Fixed Treatment Charge (per month) $6,452.00 $6,452.00 $6,452.00- Brine Treatment Flow (mgd, all RO Plants) 4.6 4.6 4.6- Retail Value of Potable Water ($/AF) $888.25 $888.25 $888.25
EMWD Desalination Facilities- Well water available (AF/y) 17,100 17,100 17,100- Primary Desalter Average Recovery (%) 70% 70% 70%- Potable Water Produced (AF/y) 11,970 11,970 11,970
Potable Water Produced (mgd) 10.7 10.7 10.7 - Brine for disposal (AF/y) 5,130 5,130 5,130
Brine for disposal (mgd) 4.6 4.6 4.6
SARI Disposal Costs:
OCSD Treatment Capacity Cost ($/mgd) 4,547,249 4,547,249 4,547,249 - EMWD Total treatment cap needed (mgd) 4.6 4.6 4.6 - Treatment Cost ($) 20,823,931 20,823,931 20,823,931 SARI Line Capacity Cost ($/mgd) 3,750,000 3,750,000 3,750,000 - Capacity needed (mgd) 4.6 4.6 4.6 - SARI Line Cost ($) 17,172,963 17,172,963 17,172,963 Total Capital Expenditure ($) 37,996,894 37,996,894 37,996,894
- Interest Rate (%) 6% 6% 6%- Loan Period (years) 20 20 20- Annual Payment ($) $3,312,742 $3,312,742 $3,312,742
Disposal Cost:- SARI Line Disposal Cost ($/yr) $1,696,845 $1,696,845 $1,696,845
EASTERN MUNICIPAL WATER DISTRICT
pw://Carollo/Documents/Client/CA/EMWD/7324C00/Deliverables/Report/NWRI/Appendix G.pdf
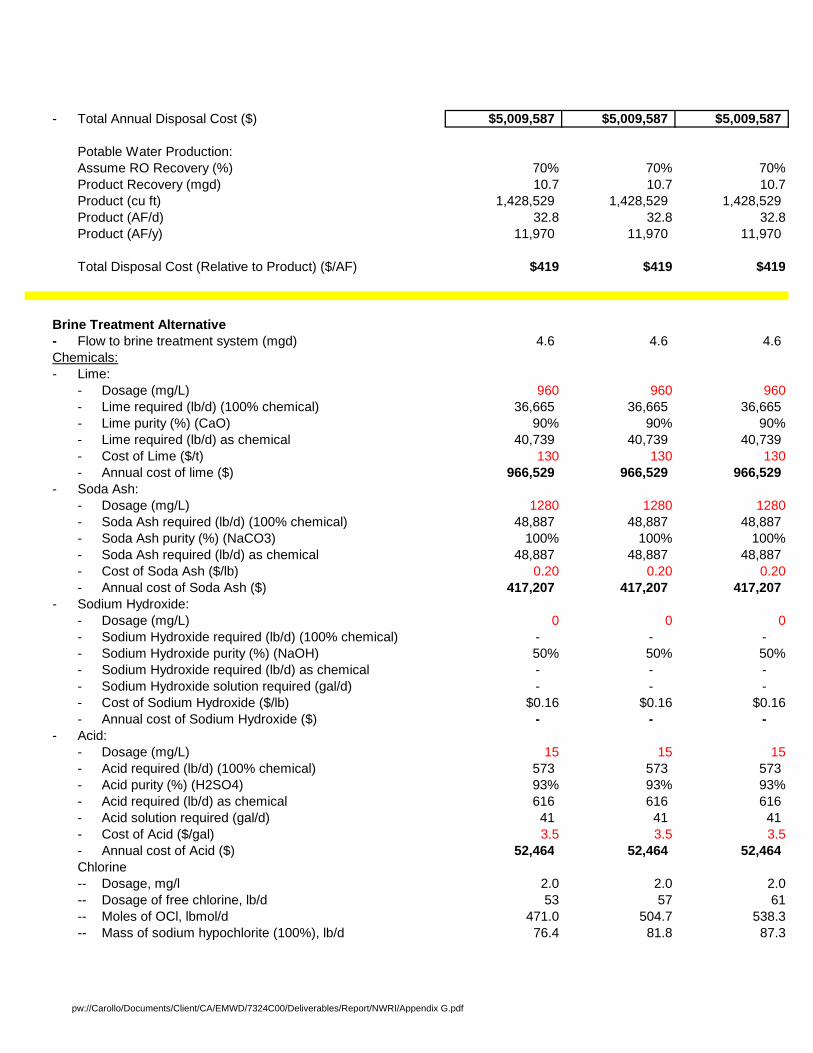
- Total Annual Disposal Cost ($) $5,009,587 $5,009,587 $5,009,587
Potable Water Production:Assume RO Recovery (%) 70% 70% 70%Product Recovery (mgd) 10.7 10.7 10.7Product (cu ft) 1,428,529 1,428,529 1,428,529 Product (AF/d) 32.8 32.8 32.8Product (AF/y) 11,970 11,970 11,970
Total Disposal Cost (Relative to Product) ($/AF) $419 $419 $419
Brine Treatment Alternative- Flow to brine treatment system (mgd) 4.6 4.6 4.6 Chemicals:- Lime:
- Dosage (mg/L) 960 960 960- Lime required (lb/d) (100% chemical) 36,665 36,665 36,665 - Lime purity (%) (CaO) 90% 90% 90%- Lime required (lb/d) as chemical 40,739 40,739 40,739 - Cost of Lime ($/t) 130 130 130- Annual cost of lime ($) 966,529 966,529 966,529
- Soda Ash:- Dosage (mg/L) 1280 1280 1280- Soda Ash required (lb/d) (100% chemical) 48,887 48,887 48,887 - Soda Ash purity (%) (NaCO3) 100% 100% 100%- Soda Ash required (lb/d) as chemical 48,887 48,887 48,887 - Cost of Soda Ash ($/lb) 0.20 0.20 0.20- Annual cost of Soda Ash ($) 417,207 417,207 417,207
- Sodium Hydroxide:- Dosage (mg/L) 0 0 0- Sodium Hydroxide required (lb/d) (100% chemical) - - - - Sodium Hydroxide purity (%) (NaOH) 50% 50% 50%- Sodium Hydroxide required (lb/d) as chemical - - - - Sodium Hydroxide solution required (gal/d) - - - - Cost of Sodium Hydroxide ($/lb) $0.16 $0.16 $0.16- Annual cost of Sodium Hydroxide ($) - - -
- Acid:- Dosage (mg/L) 15 15 15- Acid required (lb/d) (100% chemical) 573 573 573 - Acid purity (%) (H2SO4) 93% 93% 93%- Acid required (lb/d) as chemical 616 616 616 - Acid solution required (gal/d) 41 41 41 - Cost of Acid ($/gal) 3.5 3.5 3.5- Annual cost of Acid ($) 52,464 52,464 52,464 Chlorine-- Dosage, mg/l 2.0 2.0 2.0-- Dosage of free chlorine, lb/d 53 57 61-- Moles of OCl, lbmol/d 471.0 504.7 538.3-- Mass of sodium hypochlorite (100%), lb/d 76.4 81.8 87.3
pw://Carollo/Documents/Client/CA/EMWD/7324C00/Deliverables/Report/NWRI/Appendix G.pdf
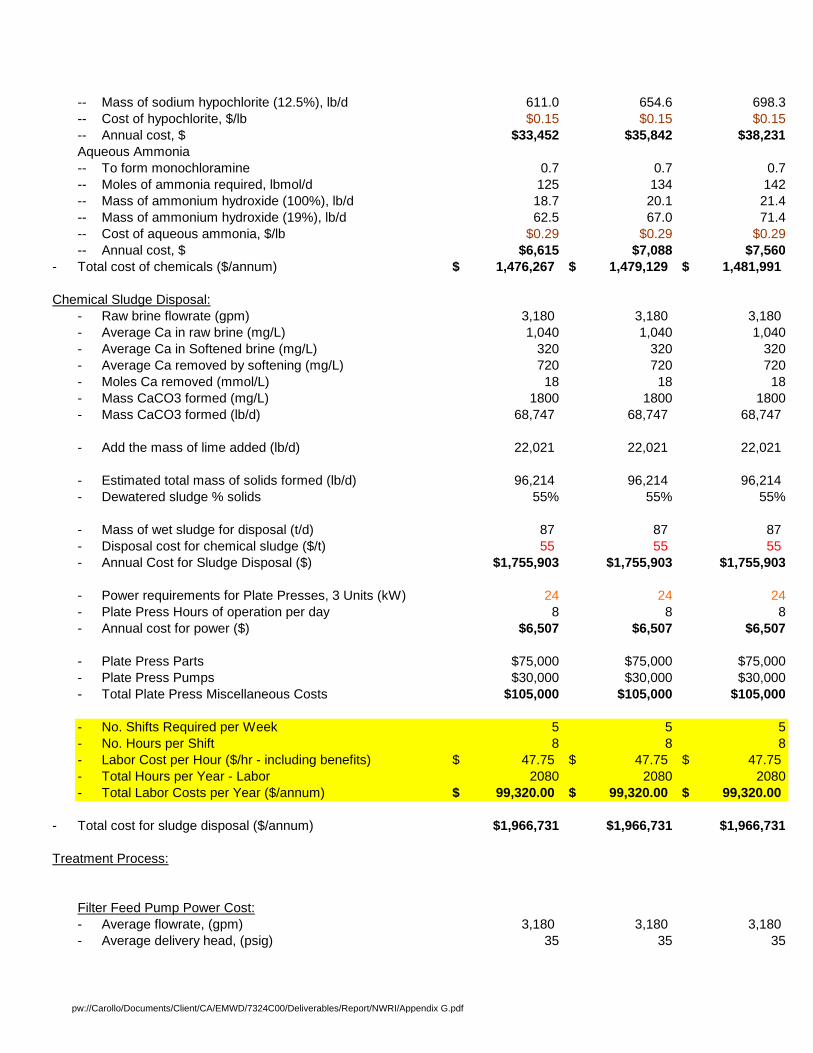
-- Mass of sodium hypochlorite (12.5%), lb/d 611.0 654.6 698.3-- Cost of hypochlorite, $/lb $0.15 $0.15 $0.15-- Annual cost, $ $33,452 $35,842 $38,231Aqueous Ammonia-- To form monochloramine 0.7 0.7 0.7-- Moles of ammonia required, lbmol/d 125 134 142-- Mass of ammonium hydroxide (100%), lb/d 18.7 20.1 21.4-- Mass of ammonium hydroxide (19%), lb/d 62.5 67.0 71.4-- Cost of aqueous ammonia, $/lb $0.29 $0.29 $0.29-- Annual cost, $ $6,615 $7,088 $7,560
- Total cost of chemicals ($/annum) 1,476,267$ 1,479,129$ 1,481,991$
Chemical Sludge Disposal:- Raw brine flowrate (gpm) 3,180 3,180 3,180 - Average Ca in raw brine (mg/L) 1,040 1,040 1,040- Average Ca in Softened brine (mg/L) 320 320 320- Average Ca removed by softening (mg/L) 720 720 720- Moles Ca removed (mmol/L) 18 18 18- Mass CaCO3 formed (mg/L) 1800 1800 1800- Mass CaCO3 formed (lb/d) 68,747 68,747 68,747
- Add the mass of lime added (lb/d) 22,021 22,021 22,021
- Estimated total mass of solids formed (lb/d) 96,214 96,214 96,214 - Dewatered sludge % solids 55% 55% 55%
- Mass of wet sludge for disposal (t/d) 87 87 87 - Disposal cost for chemical sludge ($/t) 55 55 55 - Annual Cost for Sludge Disposal ($) $1,755,903 $1,755,903 $1,755,903
- Power requirements for Plate Presses, 3 Units (kW) 24 24 24- Plate Press Hours of operation per day 8 8 8- Annual cost for power ($) $6,507 $6,507 $6,507
- Plate Press Parts $75,000 $75,000 $75,000- Plate Press Pumps $30,000 $30,000 $30,000- Total Plate Press Miscellaneous Costs $105,000 $105,000 $105,000
- No. Shifts Required per Week 5 5 5- No. Hours per Shift 8 8 8- Labor Cost per Hour ($/hr - including benefits) 47.75$ 47.75$ 47.75$ - Total Hours per Year - Labor 2080 2080 2080- Total Labor Costs per Year ($/annum) 99,320.00$ 99,320.00$ 99,320.00$
- Total cost for sludge disposal ($/annum) $1,966,731 $1,966,731 $1,966,731
Treatment Process:
Filter Feed Pump Power Cost:- Average flowrate, (gpm) 3,180 3,180 3,180 - Average delivery head, (psig) 35 35 35
pw://Carollo/Documents/Client/CA/EMWD/7324C00/Deliverables/Report/NWRI/Appendix G.pdf

- Pump motor efficiency, % 98% 98% 98%- Pump efficiency, % 85% 85% 85%- Average pump power, Hp 76.4 76.4 76.4- Average pump power, kW 57.0 57.0 57.0- Electrical Cost for this Pump, $/year $77,884 $77,884 $77,884
High Lift Pumps Power Cost- Average flowrate, (gpm) 2,226 2,385 2,544 - Average delivery head, (psig) 120 120 120- Average suction water depth, (ft) 25 25 25- Suction depth, (psig) 10.8 10.8 10.8- Average total dynamic head, (psig) 16.55 16.55 16.55- Pump motor efficiency, % 98% 98% 98%- Pump efficiency, % 85% 85% 85%- Average pump power, Hp 183.4 196.5 209.5- Average pump power, kW 136.7 146.5 156.3- Electrical Cost for this Pump, $/year $186,921 $200,273 $213,624
RO Power Cost:- RO Feed Flowrate (mgd) 4.58 4.58 4.58- RO Feed Flow (gpm) 3,180 3,180 3,180
- Average Operating Pressure (psi) 215 215 215- Pumping Power (hp) 398.8 398.8 398.8- Overall Efficiency (%) 70% 70% 70%- Power Consumed (kWh/y) 3,718,511 3,718,511 3,718,511 - Power Cost ($/kWh) 0.13 0.13 0.13- Power Cost ($/year) $483,406 $483,406 $483,406- Power costs as $/1000 gal $0.29 $0.29 $0.29
Membrane Replacement:- Assume typical life ($/1000 gal) 0.16 0.16 0.16- Annual Cost for Membranes ($) $267,440 $267,440 $267,440
Chemicals (Antiscalant, cleaning solution etc):- Assume Typical operation ($/1000 gal) 0.07 0.07 0.07- Annual Cost for RO Chemicals ($) $117,005 $117,005 $117,005
- Total O&M Cost for Media, Secondary RO, and Pumping ($/annum) $1,132,657 $1,146,008 $1,159,360
Capital Cost:- RO Feed Flowrate (mgd) 4.58 4.58 4.58- Unit cost of RO Equipment ($/gal) $1.00 $1.00 $1.00- Capital Cost of RO Equipment ($) $4,579,457 $4,579,457 $4,579,457- $300,000 $300,000 $300,000
- $1,000,000 $1,000,000 $1,000,000- Solids Contact Clarifier ($) $1,303,000 $1,303,000 $1,303,000
- Truck Unloading Facility ($) $1,500,000 $1,500,000 $1,500,000
- Dewatering Equipment ($) $2,310,000 $2,310,000 $2,310,000
Media Filters - Deep Bed Pressure Vessels
Media Filter Feed Pumps
pw://Carollo/Documents/Client/CA/EMWD/7324C00/Deliverables/Report/NWRI/Appendix G.pdf

- Lime Dosing System $800,000 $800,000 $800,000
- Soda Ash Dosing System $540,000 $540,000 $540,000
- Sodium Hydroxide Dosing System $0 $0 $0
- Finished Water Clearwell ($0.75/gallon) $601,054 $643,986 $686,919
- High Lift Pumps $300,000 $300,000 $300,000- Sub-total 1 Treatment Equipment ($) $13,233,511 $13,276,443 $13,319,375- Interconnecting Pipework 15% $1,985,027 $1,991,466 $1,997,906- Electrical and Instrumentation 18% $2,382,032 $2,389,760 $2,397,488
- $450,000 $450,000 $450,000- RO Building (@ $250/sq ft and 1500 sq ft/mgd)) $1,717,296 $1,717,296 $1,717,296- Sub-total 2 Construction Cost Estimate ($) $19,767,865 $19,824,965 $19,882,066- Contractor General Conditions 5% $988,393 $991,248 $994,103- Contractor Overhead and Profit 12% $2,372,144 $2,378,996 $2,385,848- Bid Market Allowance 0% $0 $0 $0- Engineering 15% $2,965,180 $2,965,180 $2,965,180- Legal and Admin 10% $1,976,787 $1,976,787 $1,976,787- Contingency 25% $4,941,966 $4,941,966 $4,941,966- Estimated Project Cost ($) $33,012,335 $33,079,142 $33,145,949
Capital $/gal 10.30 9.63 9.05
Annual Cost of Capital:- Average Annual Interest Rate (%) 6% 6% 6%- Loan Period (years) 20 20 20- Annual Payment ($) $2,878,166 $2,883,990 $2,889,815- Annual Payment ($/AF) $801.49 $749.58 $704.15
Revenue from New Water Production:- Assumed Secondary RO Recovery (%) 70% 75% 80%- Potable Water Produced (mgd) 3.21 3.43 3.66- Potable Water Produced (AF/y) 3,591 3,848 4,104 - Selling price of New Water ($/AF) 888.25 888.25 888.25- Revenue from Produced Water ($) 3,189,706$ 3,417,542$ 3,645,378$ - Import Water Rate ($/AF) 503 503 503- Avoided Import Water Savings ($/annum) 1,806,273$ 1,935,293$ 2,064,312$ - Total Revenue from New Water Source ($) 4,995,979$ 5,352,834$ 5,709,690$
Dewatering and Chemicals Building (@$150/sq ft and 3000 sf)
pw://Carollo/Documents/Client/CA/EMWD/7324C00/Deliverables/Report/NWRI/Appendix G.pdf

Disposal Cost of Remaining Brine:- Remaining brine flowrate (mgd) 1.37 1.14 0.92
OCSD Treatment Capacity Cost ($/mgd) 4,547,249 4,547,249 4,547,249 - EMWD Total treatment cap needed (mgd) 1.4 1.1 0.9 - Treatment Cost ($) 6,247,179 5,205,983 4,164,786 SARI Line Capacity Cost ($/mgd) 3,750,000 3,750,000 3,750,000 - Capacity needed (mgd) 1.4 1.1 0.9 - SARI Line Cost ($) 5,151,889 4,293,241 3,434,593 Total Capital Expenditure ($) 11,399,068 9,499,223 7,599,379
- Interest Rate (%) 6% 6% 6%- Loan Period (years) 20 20 20- Annual Payment ($) $993,823 $828,186 $662,548
Disposal Cost:- Final Concentrate BOD, mg/L 0.8 0.8 0.8- BOD, ppd 9 8 6- Final Concentrate TSS, mg/L 13.3 13.3 13.3- SS, ppd 152 127 102- Brine Volume for disposal (mgd) 1.4 1.1 0.9 - Disposal Cost ($/y) $553,935 $479,679 $405,422- NPV Disposal Cost (20 years) $11,754,059 $10,178,395 $8,602,731
Summary:
Status Quo: $5,009,587 $5,009,587 $5,009,587
Capital Costs:- Project Cost $33,012,335 $33,079,142 $33,145,949- Annual Cost $2,878,166 $2,883,990 $2,889,815
Operating Costs:- Chemicals, Power, Disposal 5,129,590$ 5,071,546$ 5,013,503$ - Potable Water Income 4,995,979$ 5,352,834$ 5,709,690$ - Total Annual Operating Costs 133,611$ (281,288)$ (696,187)$
Total Annual Costs $3,011,777 $2,602,702 $2,193,628- $/AF $839 $676 $535
Total Annual Savings $1,997,811 $2,406,885 $2,815,959
pw://Carollo/Documents/Client/CA/EMWD/7324C00/Deliverables/Report/NWRI/Appendix G.pdf