deriving protein networks by combining gene - diva portal
TRANSCRIPT

Deriving Protein Networks by Combining GeneExpression and Protein Chip Analysis
(HS-IDA-MD-02-202)
Ida Gunnarsson ([email protected])
Institutionen för datavetenskapHögskolan i Skövde, Box 408S-54128 Skövde, SWEDEN
Magisteravhandling inom Datavetenskap, våren 2002
Program för bioinformatik
Handledare: Angelica Lindlöf, Jesper Tegnér

Deriving Protein Networks by Combining Gene Expression and Protein ChipAnalysis
Submitted by Ida Gunnarsson to Högskolan Skövde as a dissertation for the degree ofM.Sc., in the Department of Computer Science.
[2002-06-07]
I certify that all material in this dissertation which is not my own work has beenidentified and that no material is included for which a degree has previously beenconferred on me.
Signed: _______________________________________________

Deriving Protein Networks by Combining Gene Expression and Protein ChipAnalysis
Ida Gunnarsson ([email protected])
Abstract
In order to derive reliable protein networks it has recently been suggested that the
combination of information from both gene and protein level is required. In this thesis
a combination of gene expression and protein chip analysis was performed when
constructing protein networks. Proteins with high affinity to the same substrates and
encoded by genes with high correlation is here thought to constitute reliable protein
networks. The protein networks derived are unfortunately not as reliable as were
hoped for. According to the tests performed, the method derived in this thesis does not
perform more than slightly better than chance. However, the poor results can depend
on the data used, since mismatching and shortage of data has been evident.
Keywords: Protein networks, protein chips, gene expression analysis

I
Table of contents
1 Introduction.........................................................................................1
2 Background .........................................................................................52.1 Biological networks ....................................................................................... 6
2.2 Protein networks ........................................................................................... 7
2.3 Gene expression technique .......................................................................... 10
2.3 Protein chip technique................................................................................. 12
3 Related work......................................................................................153.1 Derivation of protein networks ................................................................... 15
3.2 Gene expression analysis ............................................................................. 16
3.3 Protein chip analysis.................................................................................... 17
3.5 Relevance of related work ........................................................................... 19
4 Problem statement ............................................................................204.1 Problem definition ....................................................................................... 20
4.2 Hypothesis.................................................................................................... 21
4.3 Aims and objectives..................................................................................... 22
4.4 Motivation.................................................................................................... 23
4.5 Limitations................................................................................................... 24
5 Method...............................................................................................265.1 Course of action........................................................................................... 26
5.1.1 Obtaining suitable data........................................................................ 26
5.1.2 Extraction of genes from gene expression data encoding proteins onchip ................................................................................................................ 28
5.1.3 Investigate the correlation between genes whose proteins interact on aprotein chip ................................................................................................... 28
5.1.4 Derivation of protein network ............................................................. 29
5.1.5 Evaluation of derived protein network ............................................... 29
5.2 Experimental data ....................................................................................... 30
5.2.1 Gene expression data ........................................................................... 30
5.2.2 Protein chip data.................................................................................. 32
5.2.3 Protein network ................................................................................... 33
5.3 Correlation measurement ........................................................................... 33
5.4 Experiments................................................................................................. 35
5.5 Method for evaluation ................................................................................. 38
II
6 Results and analysis ..........................................................................406.1 Experiment 1 ............................................................................................... 40
6.2 Experiment 2 ............................................................................................... 45
6.3 Experiment 3 ............................................................................................... 50
6.3.1 Experiment 3a ...................................................................................... 50
6.3.2 Experiment 3b...................................................................................... 53
7 Discussion ..........................................................................................567.1 Future work ................................................................................................. 59
8 Conclusions........................................................................................62
References.............................................................................................63
Appendix...............................................................................................68
1
1 Introduction
The characterization of several entire genomes has resulted in the discovery of many
new genes whose functions are yet unknown. For example, in yeast the function of
nearly a third of all genes have not yet been determined (Snyder et al., 2002; Uetz et
al., 2000). In an attempt to reveal their function and regulation, the use of gene
expression analysis through microarrays has become a common and effective way of
studying genes. One of the most important uses of microarrays is to study changes in
gene expression that accompany changes in cell physiology, such as during
development, cell-cycle progression, drug treatment or disease progression (He and
Friend, 2001). A number of studies over the last few years have implied that the
cellular state can be characterized and classified by gene expression patterns (He and
Friend, 2001).
A great amount of information about gene function comes from the analysis of the
biochemical activities of the encoded protein (Zhu et al., 2000). Therefore, research
has been directing towards the proteomic field, i.e. the identification and
characterization of proteins. There are several different methods to perform studies on
protein level, for example two-hybrid interactions (Uetz et al., 2000), protein chips
(Zhu et al., 2000; MacBeath and Schreiber, 2000; Zhu et al., 2001), mass
spectrometry (Gavin et al., 2002; Ho et al., 2002) and protein network development
(Schwikowski et al., 2000; D’haeseleer and Fuhrman, 1999).
The absence of a direct functional correlation between gene transcripts and their
corresponding proteins, however, represents a significant obstacle for improving the
2
efficiency of drug discovery (Hazbun and Fields, 2001). The expression arrays allow
us to monitor thousands of individual genes in a single experiment. In addition to the
classification of disease specimens, this technology has led to a broad spectrum of
applications such as drug target validation, pathway dissection, discovery of gene
function and annotation of the human genome (He and Friend, 2001). The correlation
between mRNA level and protein abundance is not direct, it is in this case more
valuable to measure the protein activity. The availability of an entire genome
sequence makes it possible to perform biochemical assays on every protein encoded
by the genome (Zhu et al., 2000). In addition, using protein microarrays, hundreds or
thousands of protein samples can be analysed in parallel (Zhu et al., 2001).
Fully sequenced genomes lead to additional insights into the functional properties of
the encoded proteins. These functional insights emerge as networks of interacting
proteins (Xenarios and Eisenberg, 2001). Networks provide testable hypotheses,
which eventually would improve our understanding of the cells molecular machinery.
Such hypothetical networks or protein complexes would also serve as the appropriate
targets for proteomics-based analysis (Ito et al., 2001) and functional genomic
analysis (Xenarios and Eisenberg, 2001).
This thesis deals with the area of protein networks, which is defined by the
interactions that exist between different proteins in an organism. Protein networks
point out global patterns of interactions among proteins. The proteins constituting a
network belong to the same protein complex or have the same cellular localization
(Schwikowski et al., 2000). Networks can be derived in several different manners, but
one important aspect that recently has been placed emphasis on, is the combination of
different approaches in order to increase reliability (Hatzimanikatis and Lee, 1999).
3
Gene expression analysis and protein-protein interactions have previously been used
individually to form different networks. Protein chips are a relatively new form of
studying the expression of several proteins at one time. This approach is the
counterpart for proteins that microarrays are for genes.
In this thesis gene expression and protein chip analysis are used in combination for
the derivation of reliable protein networks. The hypothesis stated is that protein
networks can be derived from the combination of gene expression analysis and
protein chip data. The hypothesis is verified when the derived protein network
agrees with the existing network used for validation. The hypothesis is on the other
hand falsified if there is evidence that the derived protein network do not agree with a
reliable existing network.
Co-expressed genes or proteins that are found in the same protein complex or in the
same location are likely to be involved in the same or related cellular process (Hazbun
and Fields, 2001). Consequently, genes encoding these proteins would be expected to
be co-expressed. Co-expressed genes have the same expression profiles over different
time-points but need not to necessarily share the same regulation (D´haeseleer et al.,
2000).
In chapter 2 the concepts and definitions of protein networks, protein chips and gene
expression analysis are being brought up. In chapter 3 related works being made in
the areas of interest are considered. Problem definition, hypothesis, aims and
objectives are described together with the motivation behind this thesis in chapter 4.
Chapter 5 contains the method, where there is to be found a description of the course
of action, 5.1, together with a survey of the experimental data used in the experiments,

4
5.2. The chapter continues with a description of the correlation measurement, 5.3, and
the method used for evaluation, 5.4. Finally, a thorough review of the experiments
and how they are performed completes this chapter. Results and analysis of the
different experiments are depicted in chapter 6, and a discussion about the method is
found in the final chapter 7, together with a section (7.1) discussing future work. The
entire thesis is brought to an end in chapter 8, where conclusions are being
summarized.
5
2 Background
In recent years the focus has shifted from comparative analysis of gene sequences and
the sequencing of genomes to the analysis of function and regulation of genes and
their encoding proteins. Proteins are the final products of genes where one gene is
responsible for the production of a single polypeptide chain (Weaver and Hedrick,
1997). Each protein consists of one or several polypeptide chains and its function is
determined by the proteins unique three-dimensional conformation. Transportation of
substances, structural support, protection against diseases and catalyzing chemical
reactions as enzymes or hormones are a few of the functions carried out by different
proteins (Campbell et al., 1999).
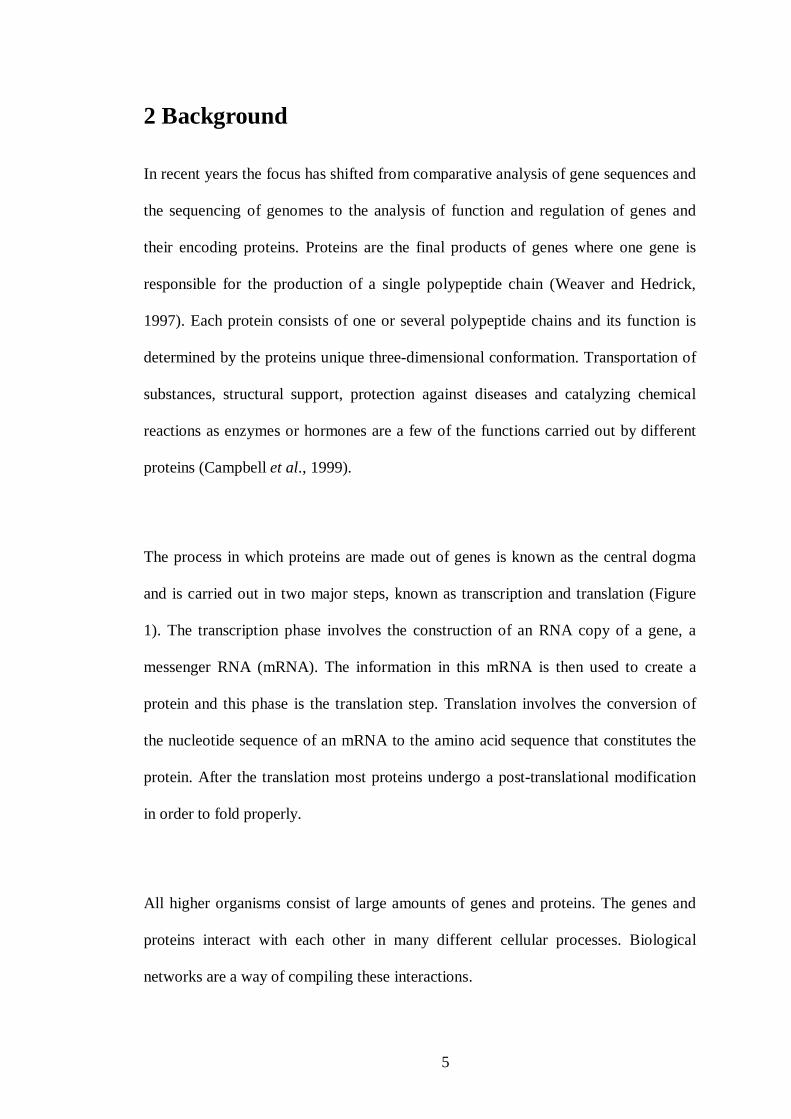
The process in which proteins are made out of genes is known as the central dogma
and is carried out in two major steps, known as transcription and translation (Figure
1). The transcription phase involves the construction of an RNA copy of a gene, a
messenger RNA (mRNA). The information in this mRNA is then used to create a
protein and this phase is the translation step. Translation involves the conversion of
the nucleotide sequence of an mRNA to the amino acid sequence that constitutes the
protein. After the translation most proteins undergo a post-translational modification
in order to fold properly.
All higher organisms consist of large amounts of genes and proteins. The genes and
proteins interact with each other in many different cellular processes. Biological
networks are a way of compiling these interactions.
6
TTACGCGATGAG DNA strand
AATGCGCTACTC Complementary DNA strand
Transcription ↓UUACGCGAUGAG mRNA
Translation ↓LeuArgAspGlu Protein
Post-Translational ↓Modifications
Folded protein
Figure 1. A summary of the conversion from gene to protein.
2.1 Biological networks
A network can be viewed as a set of subunits that interact with each other. The
subunits can be either genes or proteins and the links between these genes or proteins
describe the connections. Cellular processes are controlled by various types of
biological networks. For example, a metabolic network controls the processes which
generate mass and energy from nutritive matter. The nodes in such a network are the
substrates. Two substrates are connected by a link if both of them participate in the
same biochemical reaction.
In a protein-protein interaction network, the nodes represent the proteins. A link exists
between two nodes if the corresponding proteins have a direct physical interaction.
Protein networks are discussed in greater detail in Section 2.2.

7
A metabolic network is one of several different types of cellular networks, other types
are the cell cycle network and the apoptosis network (Jeong et al., 2000). Metabolic
networks differ in some way in their definition from protein networks. A metabolic
network is described as a collection of enzymatic reactions that serve to biochemically
process metabolites within the cell and transport processes that convert extra cellular
metabolites to intracellular metabolites and vice versa (Edwards and Palsson, 2000).
A metabolic network is built up of nodes, the substrates, which are connected to one
another through links, which are the actual metabolic reactions. The physical entity
of the link is the temporary educt-educt complex itself, in which enzymes provide the
catalytic scaffolds for the reactions yielding products, which in turn can become
educts for subsequent reactions (Jeong et al., 2000). The protein network is, as
already mentioned, a description of the interactions among proteins. The protein
network provides only protein interactions, whereas the metabolic network consists of
a more detailed description. The metabolic networks prove to have the same
properties as the protein networks, i.e. they show a scale-free appearance, and are
tolerant to random errors (Jeong et al., 2000). The construction of metabolic networks
is a demanding, small-scale method that can be very time-consuming (Edwards and
Palsson, 2000; Jeong et al., 2000).
2.2 Protein networks
A protein network is a visualisation of the interactions that exist between different
proteins in an organism, and is defined by the sum of interactions. Networks and the
accompanying computational approaches can be used to view global patterns of
interactions among proteins belonging to the same protein complex or having the

8
same cellular localization (Schwikowski et al., 2000). In higher metazoa, each gene or
protein is estimated on average to interact with four to eight other genes and to be
involved in ten biological functions (D´haeseleer et al., 2000).
Proteins can have direct or indirect interactions with one another. Direct interactions
refer to two proteins that bind to each other. Indirect interaction on the other hand
refers to being a member of the same functional module (e.g., transcription initiation
complex, ribosome etc.). Proteins belonging to the same module are not necessarily
directly bond to one another (Jeong et al., 2001b). The environment or developmental
status of the cell affects the presence or absence of the interactions; hence these
interactions reflect the dynamic state of the cell.
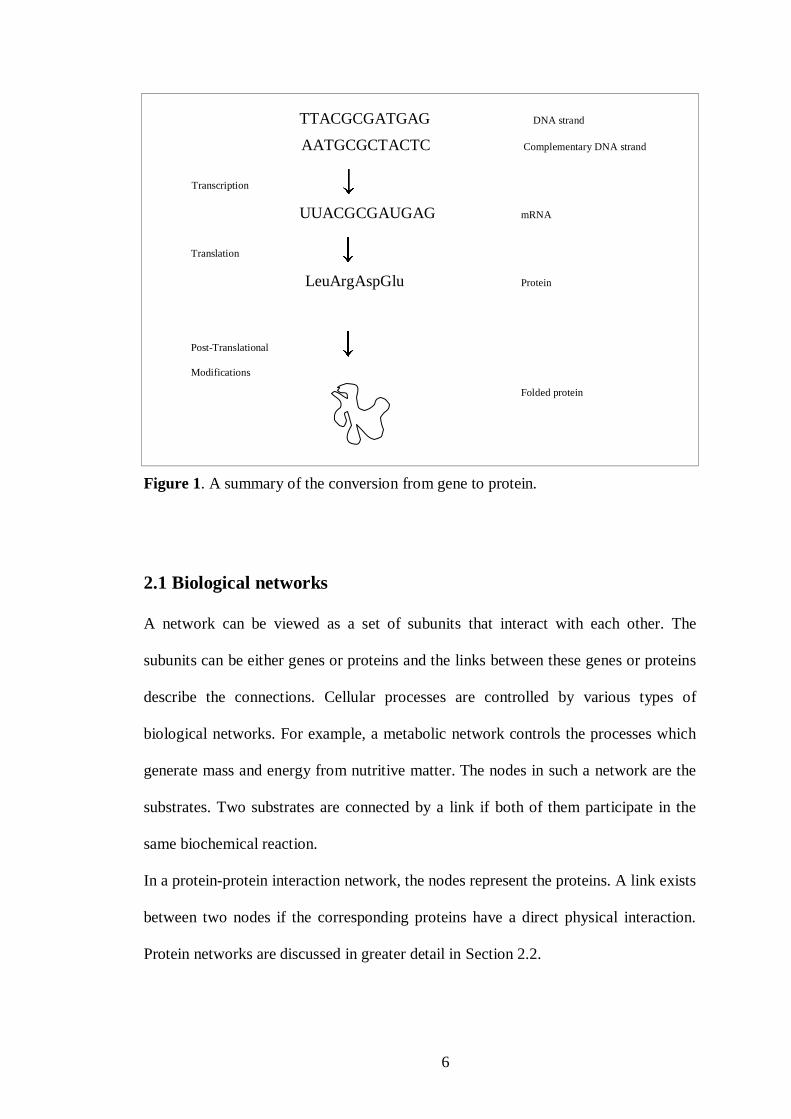
A general network is either exponential or scale-free. In an exponential network all
the nodes are connected with about the same number of nodes, unlike scale-free
networks. The scale-free network consists of a small number of nodes that are
connected to several other nodes and remaining nodes are only connected to one or a
few other nodes (Figure 2). Protein networks are extremely heterogeneous, in
difference from exponential networks, and are commonly found to be scale-free. This
means that a few highly connected proteins link the rest of the less connected proteins
to the system (Jeong et al., 2001a). This inhomogeneous structure contributes to the
network's tolerance to random errors simultaneously to its sensitivity to loss of the
most connected proteins (Jeong et al., 2001a). Highly connected proteins with a
central role in the networks architecture are three times more likely to be essential
than proteins with only a small number of links to other proteins (Jeong et al., 2001b).
9
Figure 2. Networks where circles represent proteins and edges links betweenproteins. a) demonstrates a scale-free network, where most nodes have only a fewedges, but a few nodes have a very large number of edges (black circles). b) is anexponential network, where all proteins is connected to about the same number ofother proteins.
Furthermore, proteins with higher connectivity might have a higher probability of
being lethal (Jeong et al., 2001b).
The links between proteins in the network can either be directed or undirected. A
network is directed when one protein is known to affect another protein but not the
other way around. If protein A affects protein B the connection is directed from A
towards B. In an undirected network the connections are not known to affect each
other in a specific manner. See Figure 3 for an illustration of directed and undirected
protein interactions. When the functions of proteins linked together are known, it is
possible to establish the directionality of the interaction, i.e. if there is a direction.
Even though the directions are not established it is feasible to uncover the structure of
the network (Jeong et al., 2001b).

10
Figure 3. Two different types of protein networks represented by circles and edges. Ina) a directed protein network, where a circle is a protein and the directed edgesrepresents how a protein affects another protein. A affects B, which in turn affects C.In b) an undirected protein network. It is possible to detect that A and B affects eachother, but not how. B and C are also affecting each other in some undefined way.
2.3 Gene expression technique
Since several eukaryote genomes are known, the interest has been turned towards
using these known genome sequences to understand how the genomes function
(Brazma and Vilo, 2000). Of special interest is, among other things, the functional
role of different genes and in which cellular processes they participate, how genes are
regulated and how they interact with each other and other gene products. Other
intriguing issues are how the expression patterns differentiate in different types of
cells, during different conditions, and how diseases and treatments affect these
patterns. This is for example of great significance in drug discovery (Fannon, 1996;
D´haeseleer et al., 1999).
By using advanced techniques it has now become feasible to measure the expression
levels for most, and sometimes all of the genes in an organism simultaneously.
Hopefully this will enable the reconstruction of gene regulatory networks and hence
result in greater insight in how genes are co-regulated, how they regulate other genes
11
and what their functions are (D´haeseleer et al., 1999). Gene expression analysis is an
important method for deriving information about the amount of transcribed genes in
different tissues, developmental stages and different conditions for cells. Different
techniques have quickly been developed allowing an efficient measure of the
abundance of an organisms transcribed genes (Brazma and Vilo, 2000).
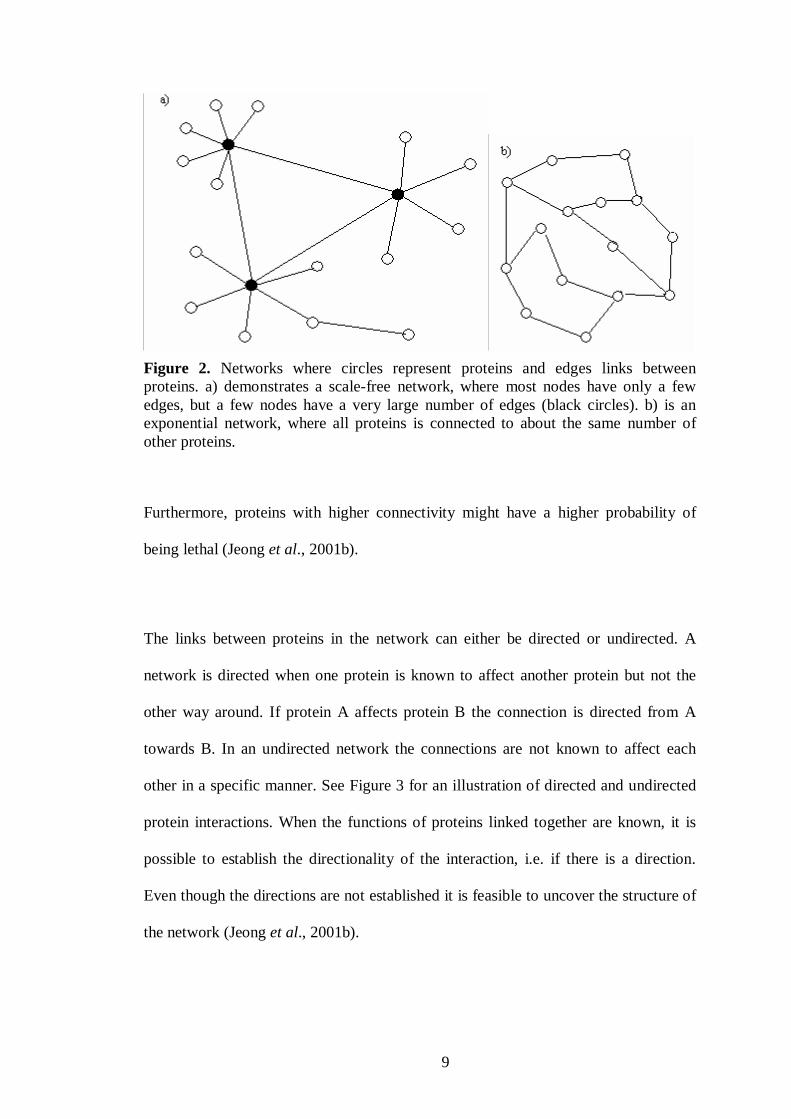
DNA microarrays are one of the later breakthroughs in experimental biology,
measuring the expressions for thousands of genes in a single experiment (Figure 4). A
microarray is a glass surface where single stranded DNA-molecules (cDNA) are
attached on specific spots. On each glass surface there are tens of thousands of spots
and each spot is related to a single gene. The microarray takes advantage of the fact
that single stranded DNA easily bind to a complementary mRNA sequence. The glass
surface is washed with fluorescent mRNA, which binds to the cDNA on the surface.
The magnitude of fluorescence is measured and the expression level for the
participating genes can be determined. This is done during different conditions and in
different tissues (Brazma and Vilo, 2000).
12
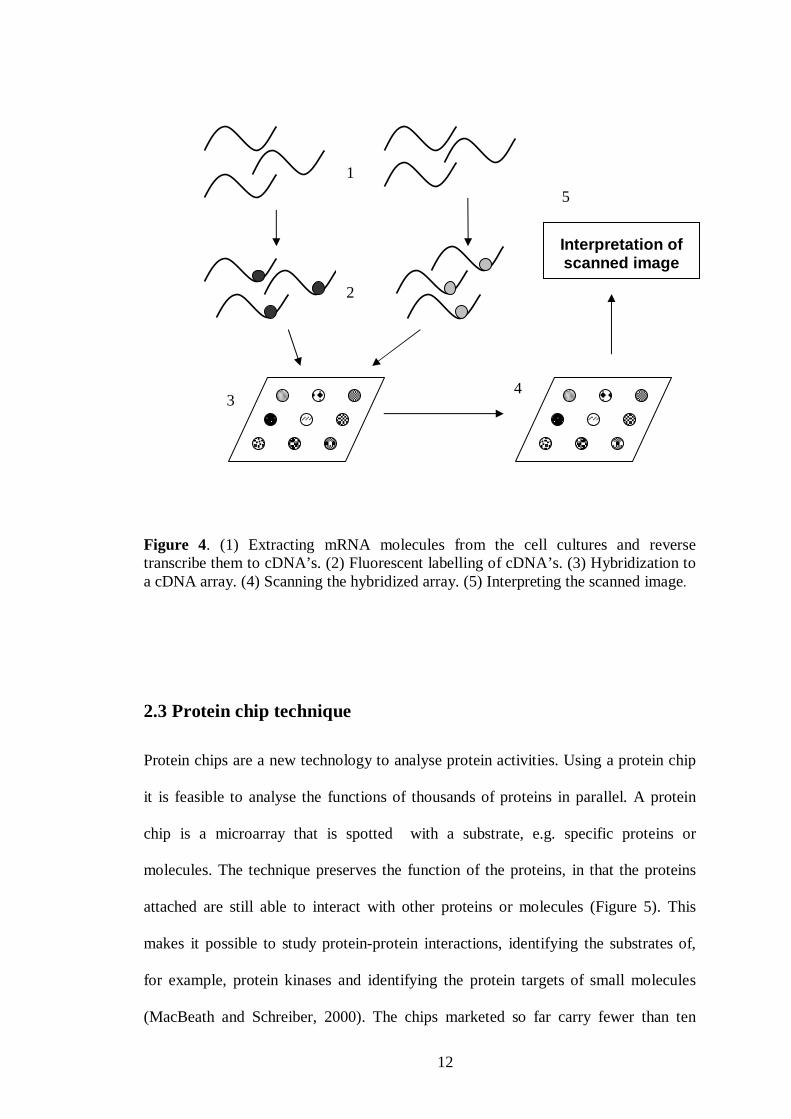
Figure 4. (1) Extracting mRNA molecules from the cell cultures and reversetranscribe them to cDNA’s. (2) Fluorescent labelling of cDNA’s. (3) Hybridization toa cDNA array. (4) Scanning the hybridized array. (5) Interpreting the scanned image.
2.3 Protein chip technique
Protein chips are a new technology to analyse protein activities. Using a protein chip
it is feasible to analyse the functions of thousands of proteins in parallel. A protein
chip is a microarray that is spotted with a substrate, e.g. specific proteins or
molecules. The technique preserves the function of the proteins, in that the proteins
attached are still able to interact with other proteins or molecules (Figure 5). This
makes it possible to study protein-protein interactions, identifying the substrates of,
for example, protein kinases and identifying the protein targets of small molecules
(MacBeath and Schreiber, 2000). The chips marketed so far carry fewer than ten
1
2
34
Interpretation ofscanned image
5

13
capture molecules, but a chip that could simultaneously analyse the production of tens
of thousands of proteins is sought after, both from those engaged in fundamental
research and from the drug industry (Abbott, 2002). The chips available today are
suitable for certain applications, such as simple medical diagnostics. However, since
the current chips manage to carry about a dozen proteins it would be possible to
follow a number of proteins in a pathway and on this basis derive the whole pathway.
On the other hand, for the large-scale proteomics projects that aim to determine how
complex patterns of protein production vary with disease, they are presently
inadequate (Abbott, 2002).
Earlier methods for studying interactions among proteins, like 2-hybrid screens and
mass spectrometry, involve only two proteins at a time (Uetz et al., 2000; Gavin et al.,
2002). The most obvious advantage of the protein chip technology is that it enables
the large-scale analysis of several different proteins towards the target protein,
detected on the chip.
Figure 5. A protein chip with attached proteins. Free proteins are washed over themicroarray and the proteins on the chip are able to interact with the free proteins.

14
Protein chip is a generic term for a number of different specialized chips that have
been developed by different companies. Cambridge Antibody Technology is a
company that attach antibodies to their chips, which is the most common way. The
antibodies can be proteins, carbon hydrates or hormones and they have been chosen
because they bind specifically to some substance of interest (Gustafsson, 2002).
Finding a capture molecule that will bind with high affinity to one protein alone is
extremely difficult. The capture molecules on a protein chip need to bind with high
affinity because some of the most interesting proteins in a biological sample - such as
hormones, growth factors and intracellular signalling proteins - are present only at
very low concentrations (Abbott, 2002). The disadvantage of using antibodies is their
tendency to be denatured when heated or exposed to other stresses. This means that
they lose their structure and hence the ability to bind to other proteins.
Affibody is a company that uses another approach. They adopt a method where they
develop special designed proteins, so called affibodies. These affibodies can find one
single molecule among thousands of others in a sample and bind it.

15
3 Related work
A popular research area has been the development of protein networks. Several
different approaches have been used and a few of them are described in the sections
below. Gene expression analysis and protein chips have been used for not solely the
purpose of deriving protein or gene networks, but these other applications are only
mentioned briefly in this thesis.
As shown in sections below, both gene expression analysis, Section 3.2, and protein-
protein interactions, Section 3.1, have been used for the purpose of constructing
networks, but the use of expression of both genes and proteins in concert are still not
explored. Nevertheless, there are indications given for the benefits of this
combination, Section 3.4. Altogether, these related works assemble the separate
aspects used in the hypothesis for this thesis.
3.1 Derivation of protein networks
Several methods for developing protein networks have been proposed. The analysis of
protein complexes with mass spectrometry in order to form protein networks have
been done by Gavin et al. (2002) and Ho et al. (2002). A two-hybrid interaction test
has been performed by Tong et al. (2002) for the purpose of forming protein
interaction networks.
Schwikowski et al. (2000) have constructed a network of 2 358 interactions among
1 548 proteins from Saccharomyces cerevisiae. The interactions between these

16
proteins are detected using two-hybrid analysis. Interestingly enough, it has been
found that proteins of known function and cellular location tend to cluster together
and possible functions can be assigned to a protein based on the known functions of
its interacting partners. This approach correctly predicts a functional category for 72%
of the 1 393 characterized proteins with at least one partner of known function, and
has predicted functions for 364 previously uncharacterized proteins.
3.2 Gene expression analysis
The abundance of information received with gene expression analysis demands
powerful methods for deriving knowledge about the cell's expression profile (Eisen et
al., 1998). Several methods have been developed, amongst others different clustering
algorithms. By clustering the expression profiles, patterns of similarity can be found
in the data (Tamayo et al., 1999). Since genes that share similar regulation and
function supposedly have similar gene expression profiles, clustering algorithms are
used for their ability to group these genes together (Eisen et al., 1998; Zhu and
Zhang, 2000; D’haeseleer et al., 2000). Gene clustering tries to infer co-regulation
and not the regulatory interactions between genes. For this purpose several other
different approaches have been evolved (D’haeseleer et al., 2000).
Reverse engineering is a method for extracting networks of regulatory interactions
between genes from gene expression data (D’haeseleer et al., 1999). Several
algorithms have been developed for reverse engineering, for example, Liang et al.
(1998) used Mutual Information for their procedure and Ideker et al. (2000)
developed an algorithm using the branch and bound technique.

17
Another useful method to construct genetic networks from gene expression data by
reverse engineering is by using the Boolean network approach. This approach
radically simplifies the individual interactions between genes by representing each
gene by a binary variable. A gene is either ON or OFF, representing the ON state
when the mRNA level is above a certain threshold and OFF otherwise. When using
Boolean networks the continuous values are exchanged to binary values, which are a
major simplification of the genes representation (D’haeseleer et al., 2000). The effect
one gene has on another gene is represented by Boolean logical rules. Despite the
simplifications made, the network is still very complex, and hence it is still difficult
to derive interactions.
3.3 Protein chip analysis
Protein chips in general provide information about interactions between a vast amount
of proteins with a specific target protein on the chip. See Section 2.3 for a detailed
description.
Zhu et al. (2000) have developed a novel protein chip technology for analysis of
biological activities and studied the protein kinases from Saccharomyces cerevisiae.
119 out of 122 known and predicted yeast protein kinases were overexpressed and
analysed using 17 different substrates on different protein chips. This experiment
resulted in the findings of several novel protein activities and that a large number of
protein kinases are capable of phosphorylating tyrosine. In addition to these results
Zhu et al. (2000) also identified a number of features of protein kinases not known

18
before, as well as stated the usefulness of protein chip technology for high-throughput
screening of protein biochemical activity.
Zhu et al., (2000) concluded that particular proteins are preferred substrates for
particular protein kinases and vice versa. The experiments were performed for in vitro
kinase activity and hence not ensured to be phosphorylated by the same kinases in
vivo. The technology described in this article has some substantial advantages over
conventional methods. The chip-based assays have for example very high signal-to-
noise ratios and the amount of material needed is very small. Another advantage is the
extreme sensitivity of the enzymatic assays the protein chips are using, and the
inexpensiveness of the chips contributes as well to the favours of this approach.
MacBeath and Schreiber (2000) have developed miniaturized assays that
accommodate extremely low sample volumes and enable the rapid, simultaneous
processing of thousands of proteins. They spotted proteins onto chemically
derivatized glass slides at extremely high spatial densities. The attached proteins yet
retained their ability to interact specifically with other proteins. MacBeath and
Schreiber demonstrated three different applications for the protein microarrays:
screening for protein-protein interactions, identifying the substrates of protein kinases
and identifying the protein targets of small molecules.
Zhu et al. (2001) have identified several new calmodulin- and phospholipid-
interacting proteins by using protein microarrays. 5 800 open reading frames (ORFs)
from the yeast proteome were screened for their ability to interact with proteins and
phospholipids. A majority of the calmodulin-binding proteins were found to have a
common potential binding motif. In addition to known partners, the calmodulin probe
19
identified 33 additional potential partners. These include many different types of
proteins, consistent with a role for calmodulin in many diverse cellular processes.
3.4 Mathematical modelling of gene networks
Hatzimanikatis and Lee (1999) argues that a combination of gene expression
information at the message level and at the protein level is required to describe even
simple models of gene networks. They tested whether gene expression data, either
mRNA or protein, is sufficient to elucidate the relationship between genome
sequence, gene regulation and cellular dynamics. This was done by studying and
comparing two different mathematical modelling methods for genetic networks,
Boolean and continuous. The result of this investigation was that gene regulation
studies based on expression data or protein array data solely not withholds enough
information and this can lead to incorrect conclusions about which genes are
important to a particular phenotype.
3.5 Relevance of related work
Since there are no articles found that has done the same type of combination of
protein chip and gene expression analysis made in this thesis, the related works
considers only one aspect each of the derived method. These articles can be used in
order to validate the results given in this thesis, or to point out different aspects that
are not always making the results totally reliable. When combining different methods
the possibility of circumvent these kind of ambiguities can be decreased.

20
4 Problem statement
This chapter introduces the problem, hypothesis and motivation behind this thesis.
Section 4.1 constitutes the problem definition and Section 4.2 the hypothesis. A
preliminary course of action is outlined together with the aims in Section 4.3 and
finally the motivation behind this thesis is discussed in Section 4.4
4.1 Problem definition
Now when many genomes have been sequenced, the challenge is to study and
understand the functions and regulations of the corresponding proteins (Zhu et al.,
2000; Xenarios and Eisenberg, 2001). There are several ways of studying the
expression of both genes and proteins. For example, the gene expression analysis
approach has become very popular for interpreting the co-expression of thousands of
genes simultaneously. The gene expressions can be measured by using cDNA
microarrays. It is generally assumed that genes with similar expression pattern are co-
regulated and therefore presumably functionally related (D’haeseleer et al., 2000). A
new technology for analysis of protein activities is the use of protein chips. With the
protein chip it is possible to study thousands of proteins in parallel (Zhu et al., 2001)
and makes it possible to study protein-protein interactions, identifying the substrates
of for example protein kinases and identifying the protein targets of small molecules
(MacBeath and Schreiber, 2001).
One limitation with the protein analysis approach at the moment is that it is not
possible to draw any conclusions about which proteins correlate to each other. It is
possible to find out which of the proteins that bind to the specific protein used on the

21
chip, but the connection between all these proteins that bind to the chip protein is not
possible to detect.
The information derived from gene expression experiments can be used for analysing
genes encoding specific proteins. Investigations can be made whether a gene encoding
a specific protein attached to the chip protein, has the same or similar expression
pattern as the genes encoding the other proteins that bind to the chip protein. By doing
this, there is a possibility to draw conclusions about the correlation between the
proteins and hence find the protein network they belong to. Proteins that bind to the
same chip protein and on the same time are encoded by genes with a high correlation,
would together be able to constitute a reliable protein network.
4.2 Hypothesis
The hypothesis is that protein networks can be derived from the combination of gene
expression analysis and protein chip data.
The proteins that bind to the same substrate are possibly located in the same area or
members of the same protein complex. The hypothesis made is that if genes in an
expression set are highly correlated, they could share regulation and hence be part of
the same protein network. Thus, proteins adjacent in a network are expected to
strongly correlate in their respective gene expressions. Therefore, combining data
from protein chip and gene microarrays, it may be possible to propose new networks
with genes that yet not have any known function.
Consequently, the hypothesis is verified when the derived protein network agrees with
the existing network used for validation. The hypothesis is on the other hand falsified

22
if there is evidence that the derived protein network do not agree with a reliable
existing network.
If proteins highly correlated do not appear to be neighbours they could be situated
close to each other in the protein network.
4.3 Aims and objectives
The aim for this thesis is to investigate if it is possible to derive protein networks from
the combination of gene expression analysis and data extracted from protein chips.
The derived network will be evaluated against a predefined protein network.
In order to achieve this aim, the following objectives need to be attained:
� Choose suitable gene expression data and protein chip data
� Choose a suitable known network for evaluation
� Develop a method for deriving protein networks
� Apply developed method on test data - four different experiments will
be performed.
� Evaluate the performance of the method against the known network
In order to derive a protein network, genes will be extracted from the chosen gene
expression set if they encode proteins that interacts with substrates attached to a chip
in the protein data set. The next step will be to investigate if it is possible to derive a
network on the basis of the protein chip analysis together with gene expression data,
by the developed method. Four different experiments will be performed. The first two

23
experiments are carried out with two different gene expression data sets. The last two
will combine the data used in the first two experiments in order to find the best
results. Finally, the derived protein network is evaluated against an existing network.
If the produced protein network agrees with the existing network, it should be
possible to derive new protein networks by using this method. These new networks
could also contain genes with unknown function, which are not present in networks
derived by using other methods. If this approach proves to produce reliable protein
networks, the hypothesis is not to be falsified.
One limitation with the use of protein chips is, only proteins that bind directly to the
chip protein will participate in the derived network. The possibility that other proteins,
which do not directly bind to the chip protein, also would be part of the same protein
network is evident.
Possible delimitations that may be necessary could be to reduce the amount of data
used in the process of deriving a network. The protein data could be diminished as
well as the gene expression data.
4.4 Motivation
The microarray technique has made it possible to effectively achieve large amounts of
data about the expression level of genes. Despite many advantages there are although
some limitations with this approach. One of the drawbacks is the absence of a direct
correlation to the corresponding protein levels, since proteins are the final product and
the usual target for drugs ( Brazma and Vilo, 2000; Hazbun and Fields, 2001; Ideker

24
et al., 2001). Instead of studying the gene expressions it is interesting to study protein
levels. Protein chips are used for this purpose. It is a much more complex procedure
and the techniques are not yet as effective as the gene level approach. Thus, the
combination of these two different techniques takes into consideration the different
advantages proposed by the different approaches.
Hatzimanikatis and Lee (1999) states that investigations of the regulation of genetic
circuits based on quantitative mRNA expression levels alone neglect critical
information, and argue for the need to combine data from mRNA expression levels
and their protein counterparts to develop accurate descriptions of gene networks.
Expression levels of many genes measured by mRNA analysis are significantly
different from the levels measured with a proteomic strategy. Thus, the combination
of these methods could improve reliability in predicting protein networks.
4.5 Limitations
In order to construct protein networks that are reliable and useful, all the proteins
interacting with each other need to be participating in that network. With the approach
used in this thesis, the collection of proteins restricts this possibility. This is because
there is not, so far, enough information available with the protein chips, due to the
amount of proteins on the chip is limited. Each chip only contain one protein that
binds to other proteins that the chip is washed with, which means that whole protein
networks is almost impossible to construct. The resulting interactions will instead
form protein complexes, i.e. smaller subunits of the network.
25
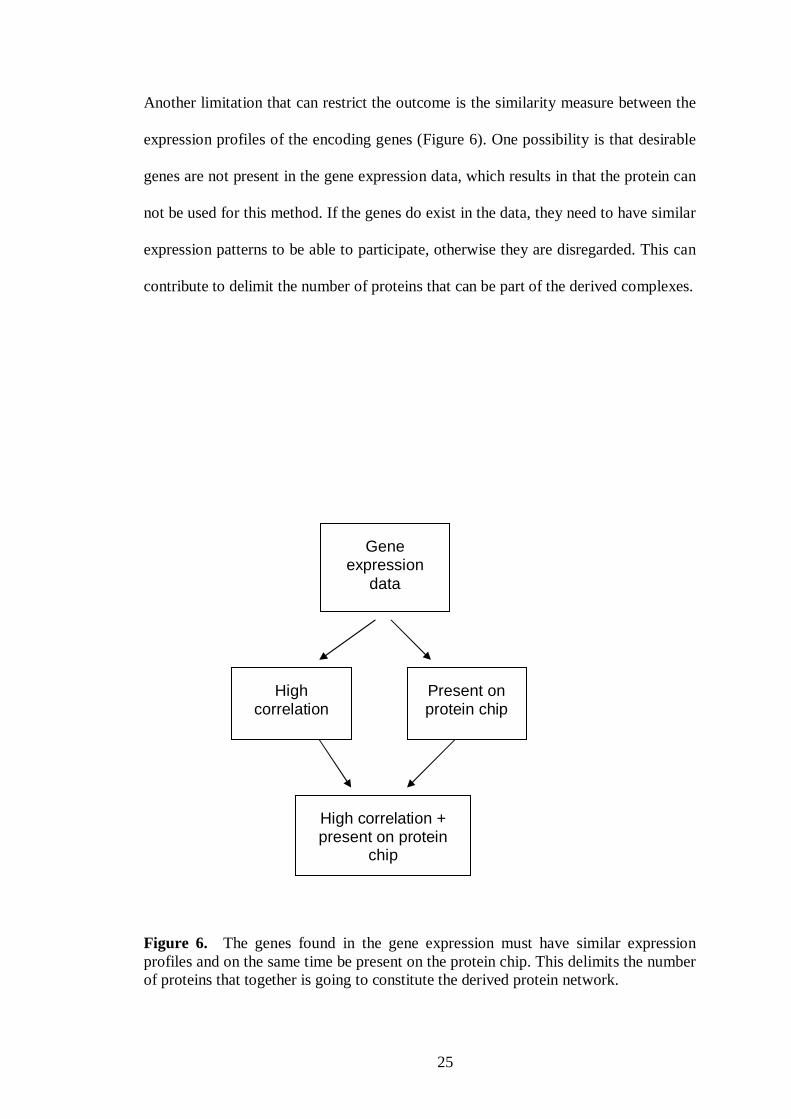
Another limitation that can restrict the outcome is the similarity measure between the
expression profiles of the encoding genes (Figure 6). One possibility is that desirable
genes are not present in the gene expression data, which results in that the protein can
not be used for this method. If the genes do exist in the data, they need to have similar
expression patterns to be able to participate, otherwise they are disregarded. This can
contribute to delimit the number of proteins that can be part of the derived complexes.
Figure 6. The genes found in the gene expression must have similar expressionprofiles and on the same time be present on the protein chip. This delimits the numberof proteins that together is going to constitute the derived protein network.
Highcorrelation
Present onprotein chip
High correlation +present on protein
chip
Geneexpression
data

26
5 Method
This chapter provides a description of the method developed in this thesis and how the
aims and objectives are met. First, Section 5.1 a general description of the course of
action is explained and thereafter Section 5.2, information about the different sources
of data that have been used is gathered. The correlation measurement used in this
method is described in Section 5.3. Section 5.4 contains a description of how the
experiments are performed and the method for evaluation is discussed in Section 5.5.
5.1 Course of action
The different steps that constitute this method were briefly mentioned in the Aims and
objectives, Section 4.3. A more thorough description of the individual steps is
discussed below. The development and testing of the hypothesis of this thesis is
visually described in Figure 7.
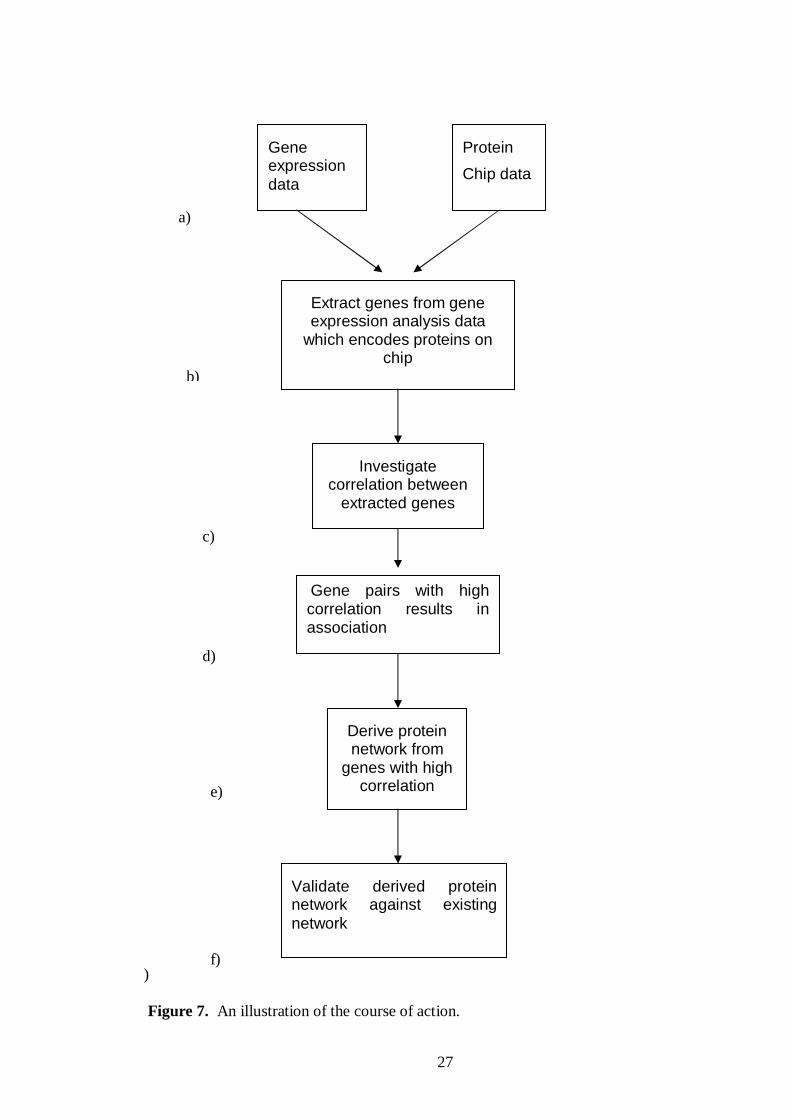
5.1.1 Obtaining suitable data
Several different data sets are required, a set of gene expression data as well as a
protein chip data set are necessary for the creation of a protein network, Figure 7a).
Another data set made up of a protein network is required for the verification of the
derived network. Important aspects to take under consideration when collecting data
sets are that they are reliable and large enough to create a protein network from. There
is a risk that not all proteins present on the protein chip are available in the gene
expression data, as well as a low correlation between the genes, which can reduce the
size of the protein network.
27
)
Figure 7. An illustration of the course of action.
Extract genes from geneexpression analysis data
which encodes proteins onchip
Investigatecorrelation between
extracted genes
Validate derived proteinnetwork against existingnetwork
Derive proteinnetwork from
genes with highcorrelation
Geneexpressiondata
Protein
Chip data
Gene pairs with highcorrelation results inassociation
a)
c)
b)
d)
e)
f)
28
5.1.2 Extraction of genes from gene expression data encoding proteins on chip
The chosen data sets containing protein interaction data and gene expression data
respectively are compared in order to extract the genes encoding proteins participating
on the protein chip, Figure 7b). It is expected that the majority of the proteins found
on the chip have their counterpart genes found in the chosen gene expression data set.
The genes that do not encode proteins found on the chip data are then disregarded and
not used in forthcoming examinations.
5.1.3 Investigate the correlation between genes whose proteins interact on a
protein chip
The genes remaining after extraction is used for calculating similarity in expression
profiles, Figure 7c). The similarity is measured by using the Pearson correlation
coefficient, Section 5.4. The correlation is measured between every pair of gene
expression profiles in the remaining data set. By deciding on a specific cut-off,
profiles with a correlation similar or higher than this cut-off are kept for further
studies. Expression profiles with correlation below chosen cut-off are in this step
disregarded. The correlation measurement is used because a high correlation should
indicate an interaction, since proteins in the same cellular processes should appear to
have similar expression profiles. The Pearson correlation coefficient estimates the
similarity in expression profiles. The hypothesis stated in this thesis assumes a high
correlation between genes.

29
Figure 8. Derivation of protein network. The proteins attached to a chip can be usedfor deriving a protein network. Since it then is impossible to know which proteins areassociated with each other, it will be a fully connected network. By using thecorrelation between genes encoding the proteins the associations will be dependingon the correlation. Hence, the protein network will be a less connected proteinnetwork.
5.1.4 Derivation of protein network
The gene expressions now decide which proteins that are going to participate in the
protein network. The proteins utilized are the ones encoded by genes that have a high
correlation, Figure 7d). What is now remaining from the original gene expression data
set are the genes that both encodes proteins interacting on the protein chip and have a
high correlation to other genes encoding proteins on chosen chip. Proteins encoded by
these genes are chosen to be part of the derived protein network, Figure 7e). Figure 8
is summarizing the derivation of a protein network.
5.1.5 Evaluation of derived protein network
The protein network constructed has to be evaluated in order to receive a satisfying
result, i.e. investigate if the derived protein network is reliable, Figure 7f). This
evaluation will be done by comparing the derived protein network against an existing
network. The comparison consists of two measurements, sensitivity and specificity
Calculatingcorrelationbetween pairsof genes
30
(Ideker et al., 2000), Section 5.4. Preferably, both these measurements result in high
percentage levels.
5.2 Experimental data
The data used for the investigations made in this thesis is collected from publicly
available data on the Internet. Data chosen is from the organism Saccharomyces
cerevisiae, or baker’s yeast. This choice is motivated by the fact that the yeast
Saccharomyces cerevisiae is clearly the most ideal eukaryotic micro-organism for
biological studies (Sherman, 1998). A highly versatile DNA transformation system,
rapid growth, dispersed cells, the ease of replica plating and mutant isolation are some
of the properties that make yeast particularly suitable for biological studies. The
complete sequence of its genome has proven to be extremely useful as a reference
against the sequences of human and other higher eukaryotic genes. Furthermore, the
ease of genetic manipulation of yeast allows its use for conveniently analyzing and
functionally dissecting gene products from other eukaryotes (Sherman, 1998).
All data collected is publicly available on the Internet and the intention has been to
choose data that is widely studied and used in several different previous experiments.
This indicates that the data is more reliable.
5.2.1 Gene expression data
There is a huge amount of publicly available gene expression data. Many of these data
sets contain gene expression profiles collected from organisms often used for
experimental analysis, for example yeast or mouse cells. The different data sets

31
contain data collected at several time points or during different conditions. The
number of time points or conditions varies among the data sets.
Gene expression data gives information about the expression patterns of several
thousands of genes simultaneously. However, there is always the possibility that these
patterns can be somewhat misleading due to noise in the data. This can result in
correlations between pairs of genes that do not correspond to the actual patterns.
Another aspect to take into consideration is the correlation measurement. The
correlation measurement is not always the most proper method for comparing
different genes against each other, since it might fail in extracting the best patterns
between different genes. Nevertheless, it is a common method for comparing gene
expression profiles and no other method has been stated to create more reliable
results.
In this thesis, two different data sets have been used. Both of these data sets contain
genes from the budding yeast Saccharomyces cerevisiae, but different conditions are
studied in the experiments.
The first data set chosen in this thesis is originally performed by DeRisi et al., (1997).
This data set has been widely studied and used in many subsequent studies. It contains
gene expressions during the diauxic shift, all in all during seven different time points.
The microarray used contained essentially every ORF from the yeast Saccharomyces
cerevisiae.

32
The second data set is retrieved from Chu et al., (1998). In this article, diploid cells of
budding yeast producing haploid cells through the developmental program of
sporulation were examined. As well as in the data set from DeRisi et al., seven
different time points are studied and DNA micro arrays containing 97 % of the known
or predicted yeast genes is used to assay changes in gene expression during
sporulation. Time points for taken samples were based on expression patterns of
known early, middle, mid-late and late genes in order to receive the most information
possible about the expression patterns of genes involved in sporulation.
5.2.2 Protein chip data
The amount of publicly available protein chip data is much smaller than the gene
expression data. It depends on the relatively new technique for this kind of
information retrieval. In the future this information is probably going to be much
more frequently found on the Internet.
The data chosen here is collected from Zhu et al, (2000). The data set is composed of
119 different yeast protein kinases and their affinity to 17 different substrates on 17
different protein chips. The affinity of the protein kinases to the substrates is indeed
interesting, but not further studied in this thesis. Nevertheless, the substrates can be of
some significance. Instead, it is the connections between the kinase proteins that are
the focus of interest. When investigating all of the kinases and their cellular roles
conclusions could be drawn that the majority of the 119 kinases are related in their
functions. For that reason, the proteins that bind should have a connection, i.e. they
should participate and be closely situated in the same network. The different kinases
and their cellular roles can be found in Appendix 1. Section 3.3 contains further
information about the experiment.

33
5.2.3 Protein network
The protein network used for validation originates from the article by Schwikowski et
al. (2000). This network consists of 2 358 interactions between 1 548 proteins of the
yeast Saccharomyces cerevisiae. Details about the article can be found in Section 3.1.
Since not all these genes are present in the gene expression data and on the protein
chip, the network is reduced to only contain the genes relevant, i.e. the network is
diminished to only contain the same genes as the ones present in the derived network.
Of the 113 genes present on the gene expression data by DeRisi et al. (1997), 62 of
them are also present in Schwikowskis et al. data set and thus used in the evaluation.
The same genes that agree with the DeRisi et al. data set also agree with the data set
from Chu et al. (1998). The 62 genes were only connected through 17 associations,
which means that not all of them were connected. Only the genes connected to each
other are of some interest and therefore only the 20 genes that were connected through
the 17 associations were used in the validation. This reduces the derived protein
network as well, since not the entire derived network could be validated against these
20 genes.
5.3 Correlation measurement
When trying to derive interesting information from the gene expression analysis data,
some kind of measurement is required. In order to extract information of whether
genes share similar expression patterns, numerous measures are available. Examples
of such measures are correlation, Spearman rank correlation, Euclidean distance and
the angle between vectors of observations (Heyer et al., 1999). All of the methods
34
have their advantages and disadvantages, for example the Euclidean distance do not
score well if the ORF pairs whose expression patterns are measured have the same
shape but different magnitudes (Heyer et al., 1999). The Spearman´s rank correlation
coefficient is designed for ordinal variables and hence requires ranked values (Heath,
2000) and neither the angle between vectors of observations does not perform high
values only for related gene pairs (Heyer et al., 1999).
A widely-used type of correlation coefficient is Pearson correlation. Pearson's
correlation reflects the degree of linear relationship between two variables, i.e. it
reflects the degree to which the variables are related. In this case the variables are
genes. The Pearson correlation identifies positive as well as negative correlation and
ranges from +1 to -1. A correlation of +1 means that there is a perfect positive linear
relationship between genes and -1 means that there is a perfect negative linear
relationship between the genes. Hence, positive correlation identifies similar
expression profiles and negative correlation identifies antagonistic expression
profiles. A correlation of 0 means there is no linear relationship between the two
variables.
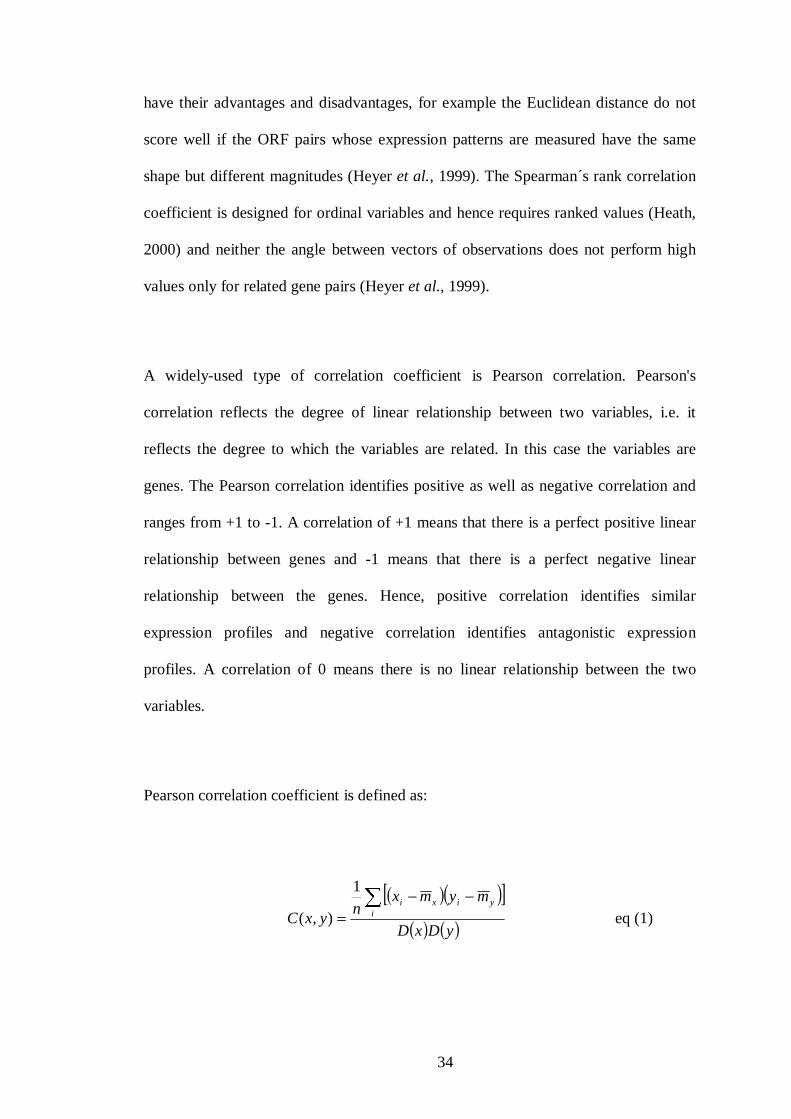
Pearson correlation coefficient is defined as:
( )( )[ ]( ) ( )yDxD
mymxn
yxC iyixi∑ −−
=
1
),( eq (1)
35
where n is the number of time points, ix and iy are the gene expression levels of x and
y at time i, xm and ym are the average expression levels for x and y, and D(x) and D(y)
are the standard deviations for x and y, respectively.
Since the Pearson correlation coefficient manages both positive and negative
correlation it has been the choice of use over for example the Euclidean distance in
this method. The most negative aspect with the Pearson correlation is that only linear
relationships can be measured, which could affect the outcome.
5.4 Experiments
This section provides an overview of the experiments performed in this work. Four
different experiments were performed but they were all conducted in the same way.
The only differences between the experiments were the data sets used. The two first
experiments used two different gene expression data sets, and in the two remaining
experiments these two data sets were combined in different ways.
From the original gene expression data set, the genes encoding proteins bound to the
substrates on the protein chip were extracted. These remaining genes were further
used for calculations of similarity, i.e. the Pearson correlation coefficient was
calculated between all pairs of gene expression profiles. This is done since genes with
high correlation in this thesis are thought to share the same regulation and hence be
part of the same protein network.

36
The Pearson correlation coefficient is used for defining the associations between
proteins when constructing a network. Every single association between two proteins
in the derived protein network exists only where the correlation value between their
encoding genes exceeds the chosen correlation cut off value. Since there is no
standard in choosing cut off, several different values were tested. Here, three different
cut offs were used to distinguish the associated genes: │0.6│, │0.7│ and │0.8│.
Using different cut offs results in protein networks differing in appearance and hence
it is an important task finding the most appropriate cut off value. If the cut off is set
too low, the network will consist of too many false positive associations. Otherwise, if
the cut off instead is set too high, many associations that is true will not be found and
the protein network will be missing important information.
Proteins encoded by genes that have correlations above chosen cut off are
consequently participating in the derived protein network. The cut off chosen
discriminates correct associations from falsely predicted associations.
Gene expression profiles depend on the situation when the expressions are measured,
different profiles is produced during cell-cycle and diauxic shift as well as during
sporulation. The protein chip data is not dependent on any situation, and hence there
can exist associations despite a low correlation.
Networks created accordingly have to be validated, and the protein network created
by Schwikowski et al. (2000) is used for this purpose. The protein network used as
verification is considerably larger than the derived network, and hence containing
several genes that were irrelevant considering the networks derived using the method
and data sets described earlier. Only a fraction of the genes present in the

37
Schwikowski et al. network is also present in the derived networks. Therefore, in
order to make the Schwikowski et al. (2000) network more relevant and efficient
considering analysing the results, genes not participating in the derived networks were
to be excluded. In this manner, analysis of the results was made easier, since no
respect had to be taken to irrelevant genes. Hence, the data set collected from
Schwikowski et al. (2000) originally contained 1 548 proteins, but was reduced to
only consider the genes participating in the derived protein networks.
The associations between the proteins participating in the known protein network
were compared against the associations constituting the networks derived by the
method developed in this thesis. Not all the proteins that together creates the derived
protein network is evident to be found in the protein network developed by
Schwikowski et al. (2000). Although the verified network consists of many genes
there is a possibility that all the genes participating in the derived networks not exists
in the verified network anyhow. Hence, the derived network possibly has to be
reduced to only contain the genes also present in the validation network by
Schwikowski et al. (2000) in order to make the validation possible for all these
putative interactions.
The method for comparison is the sensitivity and specificity measurement, Section
5.4. The number of existing associations relative the number of identical associations
in the derived and verified networks is studied in order to find the ratio between them.
This gives an indication whether the derived method for constructing protein
networks is reliable.

38
5.5 Method for evaluation
The performance of the method is evaluated by comparing the derived network
against an already known, reliable network. The comparison between the two
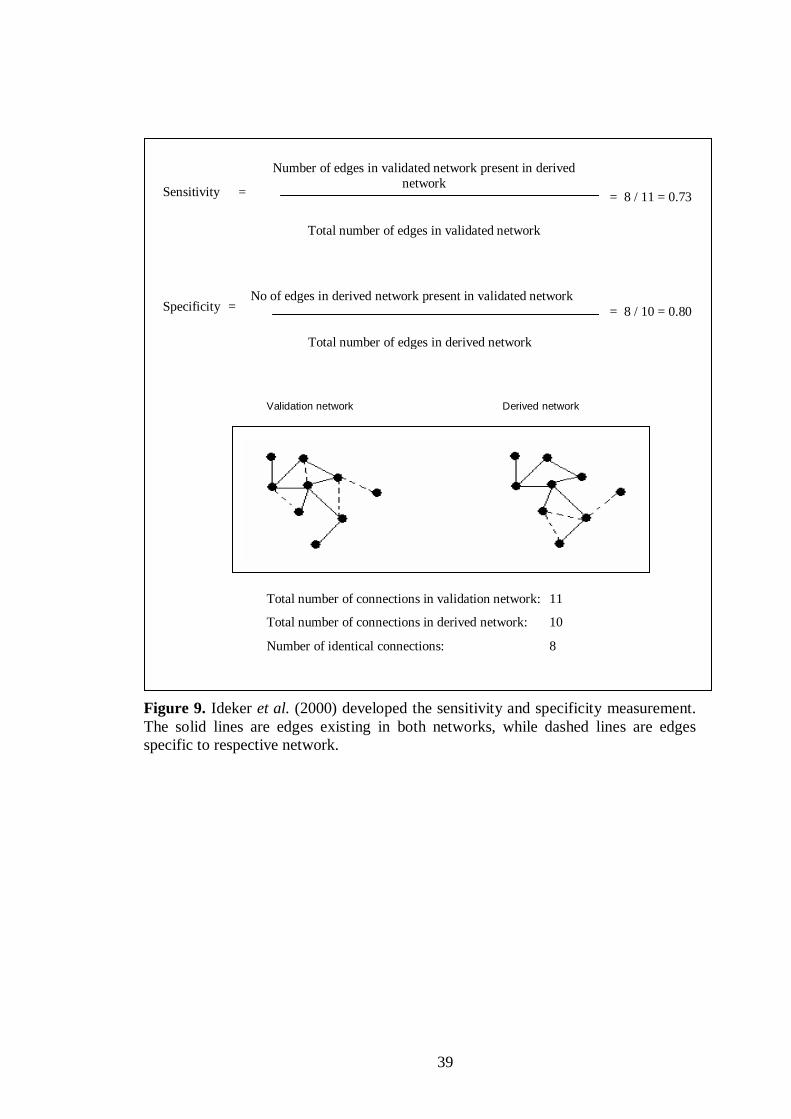
networks consists of a method developed by Ideker et al. (2000). Two measurements
were developed in order to specify the correctness of the developed network (Figure
9). The measurements were called sensitivity and specificity, respectively, and are
defined as:
sensitivity: the percentage of edges in validated network that are also
present in the derived network
specificity: the percentage of edges in the derived network that are also
present in the validated network
The validated network in this case is the protein network that is used for validation of
the derived protein network. It is desirable for both the sensitivity and specificity to
have high percentage levels, since it indicates that the derived network is highly
similar to the validation network. This measurement is chosen because of its ease of
use and the lack of complex calculations required.
The sensitivity and specificity measurements are dependent on the size of the
networks compared. This affects the results when calculating the sensitivity and
specificity. If the protein networks are small and, it is easier to find the right
connections and hence the sensitivity and specificity will increase. If instead the
protein networks are large it is possible that the measurement values decreases.
39
Figure 9. Ideker et al. (2000) developed the sensitivity and specificity measurement.The solid lines are edges existing in both networks, while dashed lines are edgesspecific to respective network.
Sensitivity =
Number of edges in validated network present in derivednetwork
Total number of edges in validated network
Specificity =No of edges in derived network present in validated network
Total number of edges in derived network
Validation network Derived network
Total number of connections in validation network: 11
Total number of connections in derived network: 10
Number of identical connections: 8
= 8 / 11 = 0.73
= 8 / 10 = 0.80
40
6 Results and analysis
When examining the hypothesis stated in this thesis, three different experiments were
performed. The experiments were executed in the same way and all of the
experiments used the same protein chip data originally collected from Zhu et al.
(2000). The significant difference between the tests was that two different gene
expression data sets were used. The data sets were first examined individually and in
the third experiment they were combined in two different ways. By testing the
hypothesis more than once, the probability of the results increases strongly. In Section
6.1 the experiment performed with gene expression data from DeRisi et al. (1997) is
thoroughly described along with an analysis of the results. This experiment is
followed by the experiment using data from Chu et al. (1998) in Section 6.2. Also
here an analysis of the results is enclosed. Section 6.3 considers experiments
combining the two gene expression data sets used in the previous experiments.
All the results are summarized in Appendix 5.
6.1 Experiment 1
In this experiment the DeRisi et al. (1997) data set is made use of together with the
protein chip data set from Zhu et al. (2000). DeRisi et al. created a gene expression
data set containing almost the entire set of genes from yeast. A reduction from these
approximately 6 400 genes down to 113 genes was performed in order to make the
data set contain only the genes corresponding to the proteins on the protein chip.
Appendix 2 contains the genes selected. The protein chip data contains 119 proteins
and hence the corresponding gene for six of the proteins was not to be found.
41
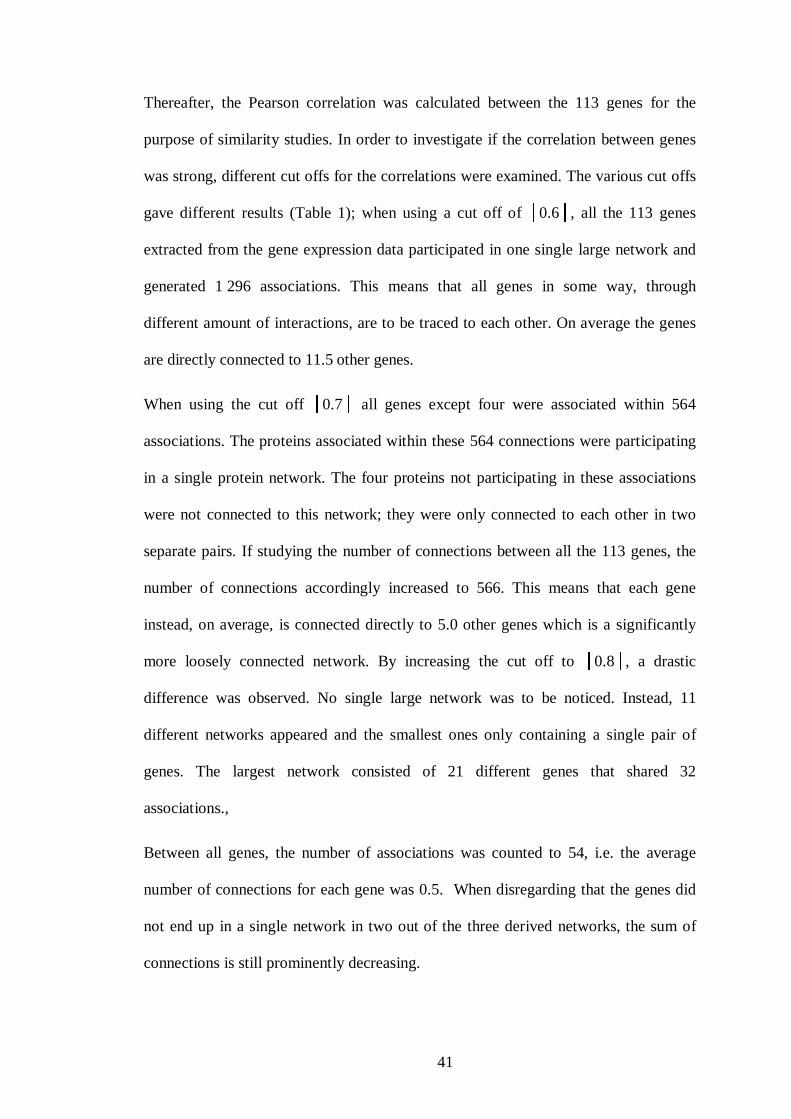
Thereafter, the Pearson correlation was calculated between the 113 genes for the
purpose of similarity studies. In order to investigate if the correlation between genes
was strong, different cut offs for the correlations were examined. The various cut offs
gave different results (Table 1); when using a cut off of │0.6│, all the 113 genes
extracted from the gene expression data participated in one single large network and
generated 1 296 associations. This means that all genes in some way, through
different amount of interactions, are to be traced to each other. On average the genes
are directly connected to 11.5 other genes.
When using the cut off │0.7│ all genes except four were associated within 564
associations. The proteins associated within these 564 connections were participating
in a single protein network. The four proteins not participating in these associations
were not connected to this network; they were only connected to each other in two
separate pairs. If studying the number of connections between all the 113 genes, the
number of connections accordingly increased to 566. This means that each gene
instead, on average, is connected directly to 5.0 other genes which is a significantly
more loosely connected network. By increasing the cut off to │0.8│, a drastic
difference was observed. No single large network was to be noticed. Instead, 11
different networks appeared and the smallest ones only containing a single pair of
genes. The largest network consisted of 21 different genes that shared 32
associations.,
Between all genes, the number of associations was counted to 54, i.e. the average
number of connections for each gene was 0.5. When disregarding that the genes did
not end up in a single network in two out of the three derived networks, the sum of
connections is still prominently decreasing.
42
Cut off│0.6│ │0.7│ │0.8│
Number of derivedassociations in data set fromDeRisi et al. (1997)
1296 564 54
Number of reducedassociations in data set fromDeRisi et al. (1997)
36 17 3
Table 1. The different cut offs results in networks with a different amount ofassociations. Increasing the value of cut off gives protein networks significantly moreloosely connected. Also the number of associations possible to validate against thedata set from Schwikowski et al. (2000) is shown in row three.
When using the gene expression data from DeRisi et al., 113 of the 119 proteins had
their encoding gene in this data set. Of these 113 genes, 62 are present in the verified
protein network by Schwikowski et al. (2000), (Appendix 3). Hence, only these 62
proteins in the gene expression data are studied, with the possibility to be evaluated
against the Schwikowski et al. network. In the verified network, 17 associations are
detected between these 62 genes. Since it is not possible for 62 different proteins to be
connected with only 17 different associations, the conclusion can be drawn that all of
these 62 genes are not connected. The only genes interesting for further studies are
those genes connected by the associations, since genes that do not form connections
with any other genes neither participate in a network, (Appendix 4).
The number of genes connected with the 17 associations was only counted to 20.
These twenty genes are the only ones that can be validated using the protein network
by Schwikowski et al. (2000) as evaluation method. When calculating sensitivity and
specificity for the derived network, only these twenty genes are considered. The
number of associations found in the derived network, considering this diminished set
of genes was 36, 17 and 3 respectively for the three different cut offs used.
43
To sum up, the validation network was in several steps reduced from 1 548 genes and
2 358 associations down to 20 genes and 17 associations. On the same time as the
gene expression data set was reduced from ~ 6 400 to the same 20 genes.
Consequently, the protein chip data set that originally contained 119 protein kinases
was reduced to the 20 proteins encoded by the 20 genes possible to validate.
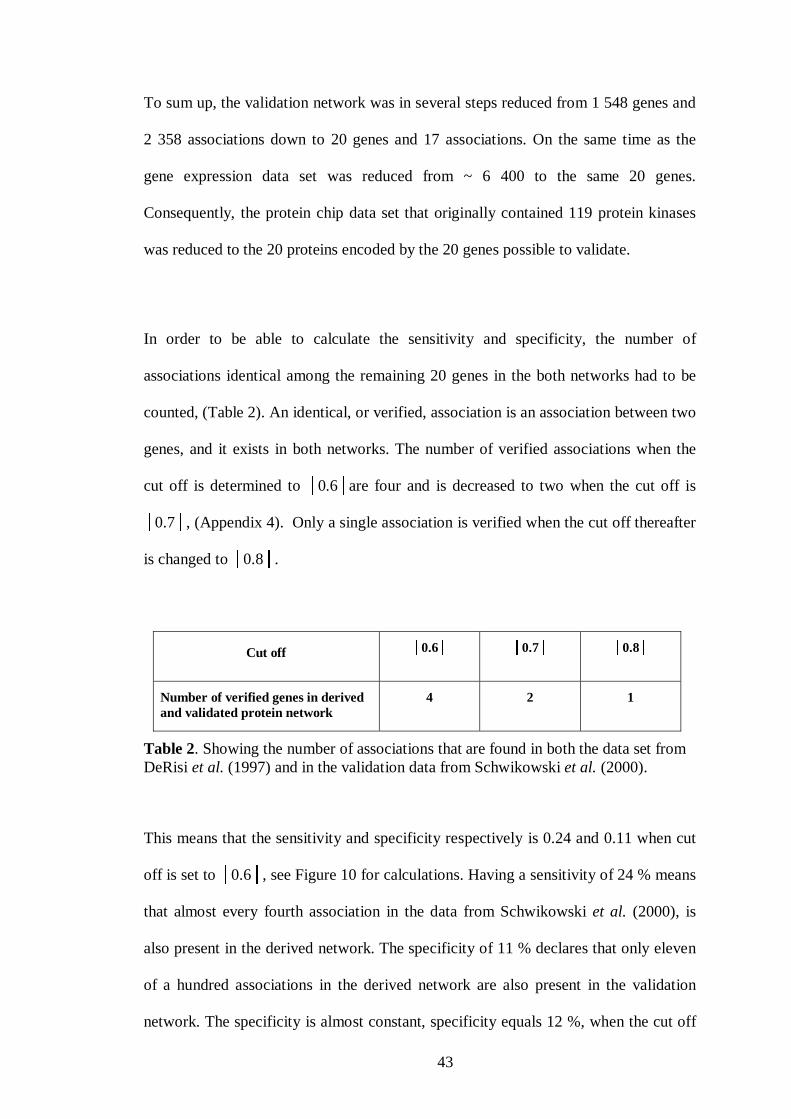
In order to be able to calculate the sensitivity and specificity, the number of
associations identical among the remaining 20 genes in the both networks had to be
counted, (Table 2). An identical, or verified, association is an association between two
genes, and it exists in both networks. The number of verified associations when the
cut off is determined to │0.6│are four and is decreased to two when the cut off is
│0.7│, (Appendix 4). Only a single association is verified when the cut off thereafter
is changed to │0.8│.
Cut off │0.6│ │0.7│ │0.8│
Number of verified genes in derivedand validated protein network
4 2 1
Table 2. Showing the number of associations that are found in both the data set fromDeRisi et al. (1997) and in the validation data from Schwikowski et al. (2000).
This means that the sensitivity and specificity respectively is 0.24 and 0.11 when cut
off is set to │0.6│, see Figure 10 for calculations. Having a sensitivity of 24 % means
that almost every fourth association in the data from Schwikowski et al. (2000), is
also present in the derived network. The specificity of 11 % declares that only eleven
of a hundred associations in the derived network are also present in the validation
network. The specificity is almost constant, specificity equals 12 %, when the cut off

44
is changed to │0.7│, but the sensitivity is reduced to half, i.e. 12 %. When increasing
the cut off to │0.8│, the sensitivity is reduced by half once again, down to 6 % while
the specificity is improved to 33 % (Figure 10).
The sensitivity and specificity measurement is somewhat difficult to interpret and in
order to understand what these figures say, they should be compared to what can be
expected by chance. 20 genes were used and a fully connected network of that size
would generate 20*19/2 (190) associations. In the protein network by Schwikowski et
al. (2000), only 17 associations were found. That is 9 % of the fully connected
network. In the derived network, 36, 17 respectively 3 associations were found. When
generating 36 associations by chance among the 190 possible associations, the result
should be about 3.2 correct associations (Figure 10 ). The resulting sensitivity and
specificity should hence be 19 % respectively 9 % when deriving associations by
chance. Comparing these results (19 % and 9 %) with the results generated with the
developed method (24 % and 11 %), there is no evident difference. When doing these
calculations for the cut offs │0.7│ and │0.8│ as well, the sensitivity is by chance
9 % respectively 2 %. All these results indicate that the method developed in this
thesis is only marginally better in performance than deriving protein networks by
chance.

45
Figure 10. A description of the calculations performed in order to compare thedeveloped method against the performance when deriving protein networks bychance.
6.2 Experiment 2
This second experiment was carried out in the same manners as the first experiment.
The same protein chip data by Zhu et al. (2000) were used, but the gene expression
data that together with the protein chip data constituted the foundation when
constructing the protein networks, was a different set. This gene expression data set is
originated from the article by Chu et al. (1998) and is composed of genes from
Saccharomyces cerevisiae studied during sporulation. The data set constructed by
Total number of associations in validation network: 17
│0.6│ │0.7│ │0.8│
Total number of associations in derived network: 36 17 3
Number of identical associations by derived method: 4 2 1
Number of identical associations derived by chance: 3.2 1.5 0.3
Sensitivity - developed method Sensitivity - by chance
│0.6│ =(4/17 = 0.24) 24 % (3.2/17 = 0.19) 19 %
│0.7│ =(2/17 = 0.12) 12 % (1.5/17 = 0.09) 9 %
│0.8│ =(1/17 = 0.06) 6% (0.3/17 = 0.02) 2 %
Specificity - developed method Specificity - by chance
│0.6│ =(4/36 = 0.11) 11 % (3.2/36 = 0.09) 9 %
│0.7│ =(2/17 = 0.12) 12 % (1.5/17 = 0.09) 9 %
│0.8│ = (1/3 = 0.33) 33% (0.3/3 = 0.09) 9 %

46
Chu et al, originally contained approximately 6100 genes and these had to be reduced
to a set only containing genes found on the protein chip. Out of the 119 protein
kinases found on the chip, 109 of them were also found in the gene expression data
from Chu et al. (1998). Already at this stage, the proteins constituting the final
network was diminished by ten proteins.
Next step was to calculate the Pearson correlation between the remaining 109 genes.
The same cut off values were used as in the first experiment, i.e. │0.6│, │0.7│ and
│0.8│. As in the first experiment, the number of associations decreased with the
increase of cut off value. When having the cut off set to │0.6│, the number of
associations was 1425, which means that each gene on average is connected to 13.1
other genes. When increasing the cut off to │0.7│, the associations dropped to 696,
meaning an average of 6.4 associations for each gene. The average number of
associations decreased further down to 0.7 when cut off value equals │0.8│, since
totally only 83 associations were found. D’haeseleer et al. (2000) stated that each
gene or protein is estimated on average to interact with four to eight other genes or
proteins. When having a cut off value of │0.6│, the average number in this
experiment is 13.1 other genes. In the first experiment the number of average
connected genes was 11.5. This indicates that the cut off │0.6│ not is a good choice
of cut off value. Instead it would be increased. The number of connections when
having the cut off │0.7│ is more accurate considering the number of genes connected
to each other.
In all three cases the derived protein networks were more strongly connected, i.e.
more associations existed amongst fewer proteins than in the first experiment. A
probable consequence would be that the number of networks produced, especially

47
when using the cut off value │0.8│, should be fewer. When examining this, the
conclusion was right, although with a small marginal, since ten different networks
was created instead of eleven as in the experiment using data from DeRisi et al.
(1997).
In order to validate the protein networks constructed in this experiment, the protein
network performed by Schwikowski et al. (2000) was used for validation, exactly like
in the previous experiment. When designating which genes could be found in both the
constructed network and the network by Schwikowski et al. (2000), exactly the same
62 genes as in the first experiment was found in the validation network. These genes
are found in Appendix 3.
Obviously, the same 17 associations amongst the 62 genes from Schwikowski et al,
(2000) were still present and the genes associated by these 17 associations were
selected from this collection, (Appendix 4). The same 20 genes as in the first
experiment was connected by these 17 associations and appointed for forthcoming
studies. The derived protein network was then reduced to contain only the genes
possible to evaluate as well. As a consequence, the number of associations in the
derived network decreased remarkably, (Table 3).
Cut off│0.6│ │0.7│ │0.8│
Number of derivedassociations in data set fromChu et al. (1998)
1425 696 83
Number of reducedassociations in data set fromChu et al. (1998)
29 8 2
Table 3. Different cut off values creates different protein networks. The number ofassociations is illustrated together with the number of associations possible to verify.

48
Studying the associations in order to find how many of them that could be found in
the derived protein network as well as in the validation network, five verified
associations were encountered with the cut off │0.6│, (Table 4). Increasing the cut
off resulted in that the number of verified associations decreased to 1 for both of the
remaining cut offs. The five different pairs of genes found in both data sets were not
the same in the both experiments. None of the four identical associations found in the
first experiment were found in this experiment. On the other hand, five completely
new pairs of genes were detected instead.
When calculating sensitivity and specificity, the results appeared to be quite similar to
the results given in the first experiment, (Figure 11). The specificity when using cut
off │0.6│, gave approximately 17 %, and when using│0.7│as cut off, the specificity
is decreased to 12 %. When changing cut off to │0.8│, the specificity is dramatically
improved and ends up on 50 %, which depends on that it is one association out of two
possible. This number of associations is too small for drawing any reliable
conclusions. These results were somewhat slightly better than in the first experiment,
on the contrary to the sensitivity measures. Cut off │0.6│showed a sensitivity of
29 %, which is the only sensitivity result better in this experiment than in the first one.
│0.7│and │0.8│as cut off values gave both sensitivities of 6 %, which is half of the
resulting value on the sensitivity measured in the first experiment using cut off set to
│0.7│.

49
Cut off
│0.6│ │0.7│ │0.8│
Number of verified associations inderived and validated proteinnetwork
5 1 1
Table 4. Showing the number of associations that are found in both the data set fromChu et al. (1998) and in the validation data from Schwikowski et al. (2000).
Also here the sensitivity and specificity measurements were compared when
calculations were made from results derived from the developed method and results
derived by chance, (Figure 11). The values of sensitivity derived by chance for the
different cut offs are in order: 15 %, 4 % and 1%. There is a more evident difference
between these figures than there were between the sensitivity measures in experiment
1, which indicates that this data set is performing somewhat better.
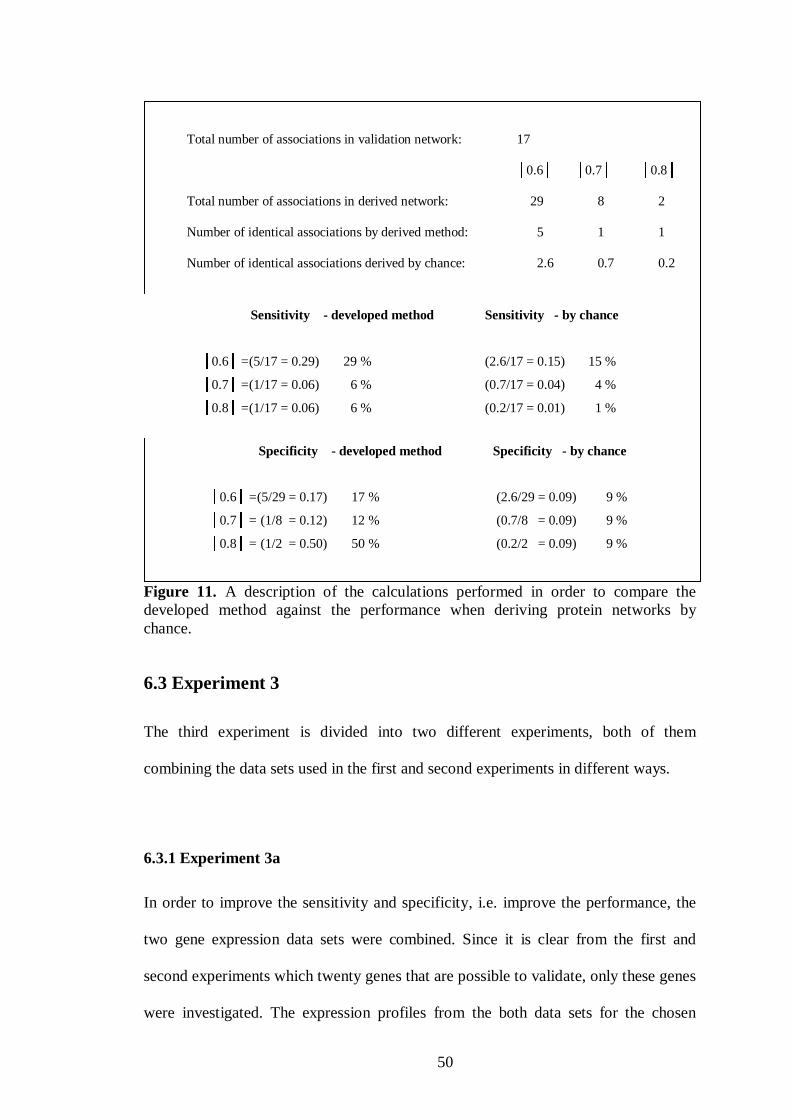
50
Figure 11. A description of the calculations performed in order to compare thedeveloped method against the performance when deriving protein networks bychance.
6.3 Experiment 3
The third experiment is divided into two different experiments, both of them
combining the data sets used in the first and second experiments in different ways.
6.3.1 Experiment 3a
In order to improve the sensitivity and specificity, i.e. improve the performance, the
two gene expression data sets were combined. Since it is clear from the first and
second experiments which twenty genes that are possible to validate, only these genes
were investigated. The expression profiles from the both data sets for the chosen
Total number of associations in validation network: 17
│0.6│ │0.7│ │0.8│
Total number of associations in derived network: 29 8 2
Number of identical associations by derived method: 5 1 1
Number of identical associations derived by chance: 2.6 0.7 0.2
Sensitivity - developed method Sensitivity - by chance
│0.6│ =(5/17 = 0.29) 29 % (2.6/17 = 0.15) 15 %
│0.7│ =(1/17 = 0.06) 6 % (0.7/17 = 0.04) 4 %
│0.8│ =(1/17 = 0.06) 6 % (0.2/17 = 0.01) 1 %
Specificity - developed method Specificity - by chance
│0.6│ =(5/29 = 0.17) 17 % (2.6/29 = 0.09) 9 %
│0.7│ = (1/8 = 0.12) 12 % (0.7/8 = 0.09) 9 %
│0.8│ = (1/2 = 0.50) 50 % (0.2/2 = 0.09) 9 %

51
genes were concatenated into one data set, which was used in the same way as they
were used separately in the previous two experiments. The Pearson correlation was
calculated and the result is slightly better when combining the two sets compared to
investigate them one by one (Figure 12).
The number of associations found using the cut offs │0.6│, │0.7│ and │0.8│ are
31, 23 and 4 respectively, (Table 5). The associations found verified in the combined
data set and the validation data set were 5, 4 and 1, respectively for the three different
cut offs, (Table 5). Three of these verified associations were identical also in the first
experiment, when only the DeRisi et al. (1997) data set was used. One association
were identical in this experiment as well as in the second experiment performed with
the data set originated from Chu et al. (1998), and one identical association were not
to be found in either of the data sets on their own. One might think that the verified
associations to be found would be the nine different associations found identical when
examining the gene expression data sets by their own in the first and second
experiments. This is evidently not the case and it might depend on the expression
profiles. It can also depend on noise in the data sets or that the different data sets
expresses profiles from different situations. The data set from DeRisi et al. (1997)
considers the yeast genes during diauxic shift whereas the Chu et al. (1998) data set
studies the same genes during sporulation. Probably, the profiles from the different
sets are very dissimilar. So, even if the expression profiles from one of the data sets is
very similar for two genes and results in a very high correlation for that experiment,
the profiles extracted from the other data set can differ from each other very strongly.
When these expression profiles then are combined, it causes the Pearson correlation to
decrease to the extent that it ends up being lower than chosen cut off. The associations
is then no longer part of the protein network.
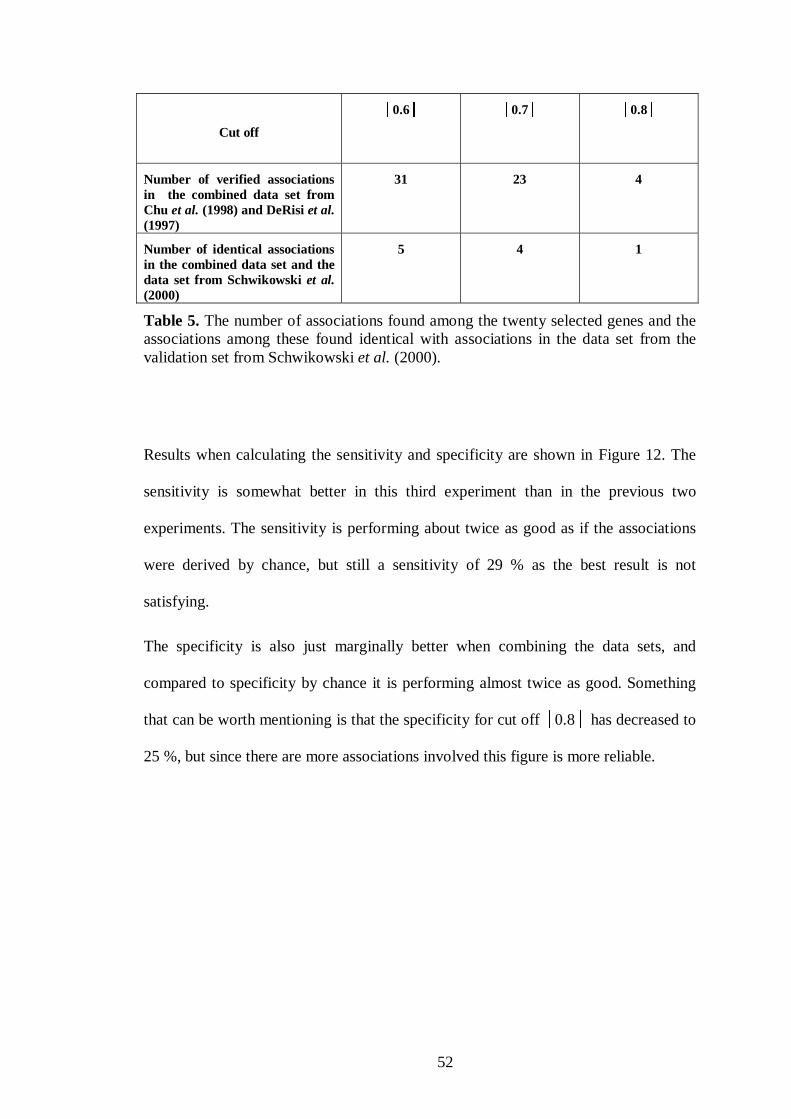
52
Cut off
│0.6│ │0.7│ │0.8│
Number of verified associationsin the combined data set fromChu et al. (1998) and DeRisi et al.(1997)
31 23 4
Number of identical associationsin the combined data set and thedata set from Schwikowski et al.(2000)
5 4 1
Table 5. The number of associations found among the twenty selected genes and theassociations among these found identical with associations in the data set from thevalidation set from Schwikowski et al. (2000).
Results when calculating the sensitivity and specificity are shown in Figure 12. The
sensitivity is somewhat better in this third experiment than in the previous two
experiments. The sensitivity is performing about twice as good as if the associations
were derived by chance, but still a sensitivity of 29 % as the best result is not
satisfying.
The specificity is also just marginally better when combining the data sets, and
compared to specificity by chance it is performing almost twice as good. Something
that can be worth mentioning is that the specificity for cut off │0.8│ has decreased to
25 %, but since there are more associations involved this figure is more reliable.
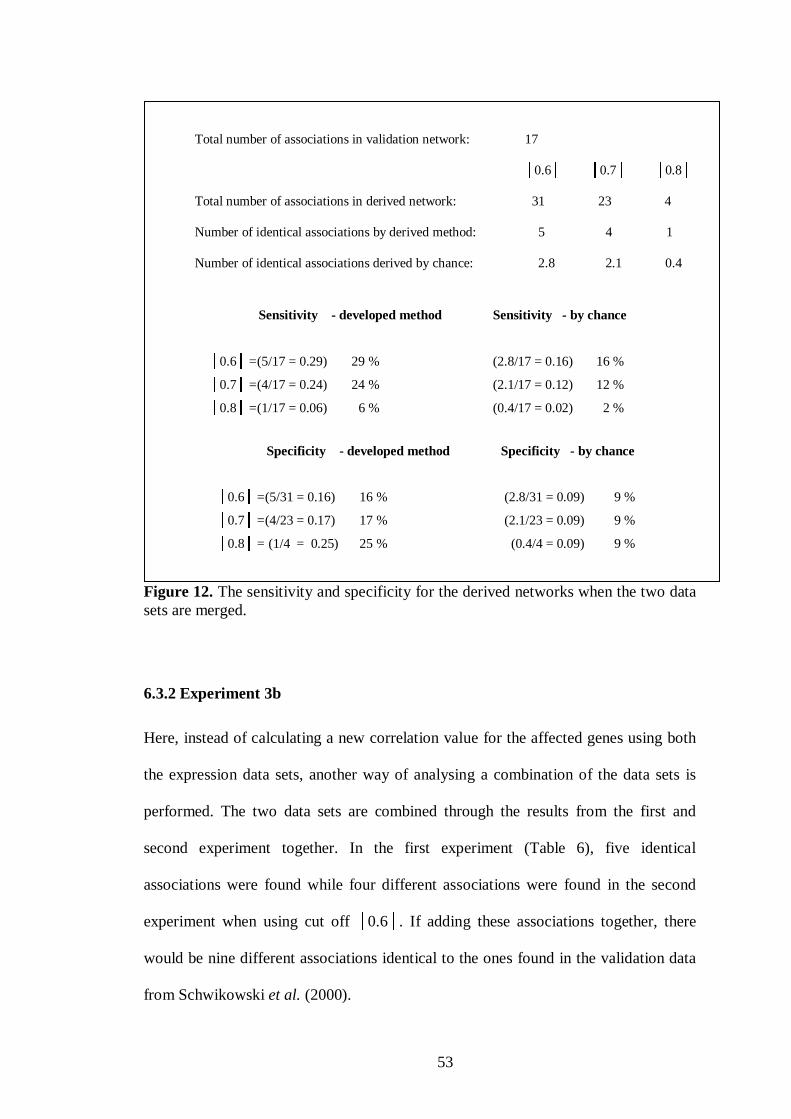
53
Figure 12. The sensitivity and specificity for the derived networks when the two datasets are merged.
6.3.2 Experiment 3b
Here, instead of calculating a new correlation value for the affected genes using both
the expression data sets, another way of analysing a combination of the data sets is
performed. The two data sets are combined through the results from the first and
second experiment together. In the first experiment (Table 6), five identical
associations were found while four different associations were found in the second
experiment when using cut off │0.6│. If adding these associations together, there
would be nine different associations identical to the ones found in the validation data
from Schwikowski et al. (2000).
Total number of associations in validation network: 17
│0.6│ │0.7│ │0.8│
Total number of associations in derived network: 31 23 4
Number of identical associations by derived method: 5 4 1
Number of identical associations derived by chance: 2.8 2.1 0.4
Sensitivity - developed method Sensitivity - by chance
│0.6│ =(5/17 = 0.29) 29 % (2.8/17 = 0.16) 16 %
│0.7│ =(4/17 = 0.24) 24 % (2.1/17 = 0.12) 12 %
│0.8│ =(1/17 = 0.06) 6 % (0.4/17 = 0.02) 2 %
Specificity - developed method Specificity - by chance
│0.6│ =(5/31 = 0.16) 16 % (2.8/31 = 0.09) 9 %
│0.7│ =(4/23 = 0.17) 17 % (2.1/23 = 0.09) 9 %
│0.8│ = (1/4 = 0.25) 25 % (0.4/4 = 0.09) 9 %

54
Cut off
│0.6│ │0.7│ │0.8│
Number of identicalassociations when the two datasets are added together.
9 3 2
Table 6. The number of identical associations in the two different data sets was addedtogether. No identical association were found in data sets from both DeRisi et al.(1997) and Chu et al. (1998).
In order to calculate the sensitivity and specificity, the number of associations in the
derived networks has to be counted and added together. There would then be 65 (29 +
36) associations, but since three of these associations occurred in both data sets the
final number is 62, for cut off │0.6│. Cut off │0.7│and│0.8│gave 24 respectively 5
associations. When combining the data sets in this manner, a different appearance
occur for the sensitivity and specificity, (Figure 13). The results from this experiment
gave the best figures of all the experiments done in this thesis, except for the
specificity for │0.6│.
By combining the two different data sets in different ways, the results differ. This
indicates that different ways of combinations is relevant to do. It is not obvious that
one way of combining is always better than the other and hence it is not always the
best thing to concatenate different data sets into one, which is commonly done.
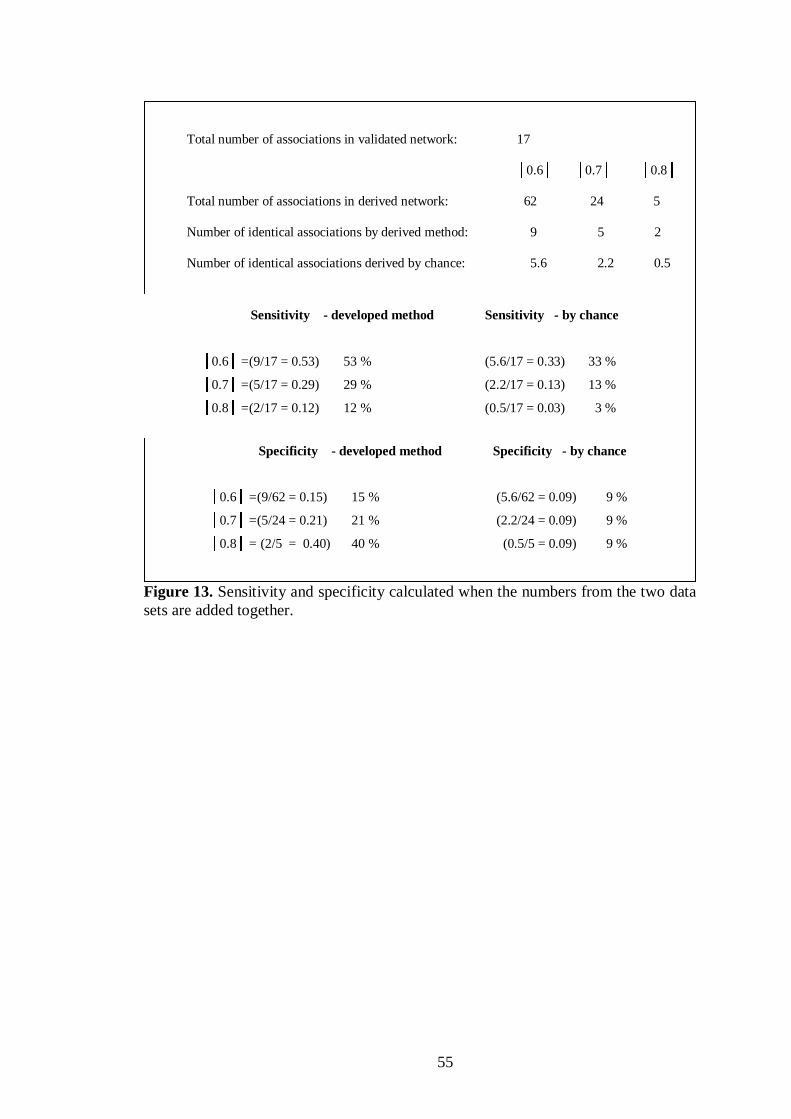
55
Figure 13. Sensitivity and specificity calculated when the numbers from the two datasets are added together.
Total number of associations in validated network: 17
│0.6│ │0.7│ │0.8│
Total number of associations in derived network: 62 24 5
Number of identical associations by derived method: 9 5 2
Number of identical associations derived by chance: 5.6 2.2 0.5
Sensitivity - developed method Sensitivity - by chance
│0.6│ =(9/17 = 0.53) 53 % (5.6/17 = 0.33) 33 %
│0.7│ =(5/17 = 0.29) 29 % (2.2/17 = 0.13) 13 %
│0.8│ =(2/17 = 0.12) 12 % (0.5/17 = 0.03) 3 %
Specificity - developed method Specificity - by chance
│0.6│ =(9/62 = 0.15) 15 % (5.6/62 = 0.09) 9 %
│0.7│ =(5/24 = 0.21) 21 % (2.2/24 = 0.09) 9 %
│0.8│ = (2/5 = 0.40) 40 % (0.5/5 = 0.09) 9 %

56
7 Discussion
The purpose of this work was to derive a method for constructing reliable protein
networks by combining protein chips with gene expression analysis. The intention of
combining different approaches is to create protein networks using more than one
source and hence obtain networks that are more accurate than those constructed from
only a single source. The effect of combining different methods were hoped to
diminish results that are not correct, depending on mistakes or deficiencies in the
method used. Considering these circumstances, the method derived in this thesis was
expected to perform better than has been proven by the experiments performed.
The sensitivity and specificity measurements that were used for the validation gave
poor results for the method derived in this thesis. Factors that can affect the results are
that the data sets were too small or that the network used for validation not contained
enough genes, which can cause the validation to be performed on very few genes. If
the validation is done on only a small fraction of genes it can be far from reliable,
since the risk that the proportions can be misleading increases.
The major drawback in this thesis is that the different data sets are not matching, and
that applies mainly to the validation set from Schwikowski et al. (2000). Out of the
1 548 proteins participating in this network, only 62 of them were found at all in the
derived network, and this figure was diminished down to 20 that actually were
possible to validate against. This is too few proteins when trying to falsify the
hypothesis. The different data sets should have been more thoroughly studied before
the experiments were performed to see if they were compatible against each other. If

57
that had been done, data sets could have been used that contained more of the same
genes and proteins.
It was not only the dataset from Schwikowski et al. (2000) that made the experiment
results so poor. In the first place, the protein chip data from Zhu et al. (2000), which
the whole experiment started from, only contained 119 proteins. This is a very
restricted amount of data to start with. Another drawback that was not counted for
was the extent of reduction of these proteins that actually took place. A protein
network consisting of all the 119 proteins the experiments started with is perhaps not
a large network, but if all these proteins could be found in and validated against the
other data sets, the results would be much more reliable.
In addition, it is not only the validation data set that has caused problems. There are
also aspects needed to be respected considering the other data sets. Not all the genes
encoding the proteins found on the chip were found on the gene expression data sets
that were used. This as well reduces the number of proteins that possibly should
participate in the derived network.
Another aspect that can explain why the last two experiments where the two gene
expression data sets were combined performed so poorly, can be that the different
data sets considers different situations. Since genes are expressed differently during
diauxic shift and sporulation the concatenation of these expression profiles can be
misleading.

58
The sensitivity and specificity is very low, but there are several reasons for that,
which affect the reliability of the hypothesis. For example, it is assumed that the
Schwikowski et al. (2000) network is true and reliable, but it does not have to be
complete. Not all the connections that exist between the proteins that together
construct this network are known. A great amount of information about these
connections is still missing or is not public information. If there were more knowledge
about associations between proteins this perhaps could increase the sensitivity and
specificity for the method derived in this thesis.
In order to increase the values of the sensitivity and specificity measures, literature
studies should be performed. In this way there is a possibility to come across many
associations not found in the validation network. Hence, the number of associations
and proteins connected by these associations could be increased and used for
validating parts of the derived networks that were not able to be validated using the
Schwikowski et al. network. The hypothesis would be more reliable if there was a
possibility of increasing the sensitivity and specificity. As it looks right now, the
method does not perform much better than if the networks were derived by chance.
If proteins chosen to be included in the network because of their similarity in
expression patterns should appear not to be adjacent in the derived protein network,
the distance between them could be calculated. The assumption is being made that
proteins encoded by genes with similar expression pattern then is at least located near
each other in the network. This could give indications on the appearance of the
protein networks.
59
The gene expression profiles are measured during different time points and
conditions. Hence, the resulting data are dependent on those time points and
conditions. The data from the protein chips are not dependent of these aspects and this
can cause the results to be less accurate. Since the correlation between different genes
differ during different conditions it is important to take into consideration which
conditions that are studied. The results might have been better if the gene expression
data came from time points during the cell cycle.
Protein kinases are phosphorylating proteins and are often responsible for post-
translational modifications of other proteins. This is not always expressed in genetic
or protein networks. Since the protein kinases not always are commonly expressed in
these networks, it might be a higher degree of agreement between the derived results
and a true metabolic network than has been revealed in this thesis.
7.1 Future work
When comparing the first two experiments with the ones where the two gene
expression data sets were combined, the conclusion is that the combined data sets are
performing slightly better. This indicates that as much information as possible should
be used, since the chances of getting better results then increases. The most
information is retrieved by using several different types of experiments, instead of
huge amounts of data from similar experiments. These different types reflect different
reactions, and can consequently complement each other in order to achieve large
amounts of valuable data.
60
So, a consequence of this would be to investigate the hypothesis stated in this thesis
with a larger protein data set as well as a larger gene expression data set. The chances
of constructing a network with more genes that is possible to evaluate, then increases.
A procedure that could increase the amount of proteins possible to validate in the
derived protein network would be to supplement the Schwikowski et al. validation
network with literature surveys. This could improve the results since the results now
only are based on twenty proteins, which actually is far too few in order to derivate
reliable results on. The literature surveys can make it possible to find associations not
found in the validation network.
It would also be of interest to validate the derived networks against another protein
network containing more genes that can be found in the data sets used when deriving
the protein networks.
Another interesting aspect to continue with would be to see how much the gene
expression data actually contribute to increase the reliability of the derived protein
network. Assuming that all the proteins found on the protein chip can be put together
in a single network, is it then possible to verify all these associations with the help of
the protein network by Schwikowski et al. (2000)? How much do the gene expression
data affect the result, is it getting better or even worse?
Since so few of the associations derived were to be found in the validation network, it
would be of interest studying the distance between the different genes that had a high
correlation. It could be of significant interest if the genes with high correlation instead
of being directly connected, at least were situated near each other in the network. This

61
would indicate the method derived possibly could give some hints about the
appearance of the network.
62
8 Conclusions
The hypothesis stated in this thesis is that the combination of protein chips and gene
expression data can predict reliable protein networks. This hypothesis could not, with
the experiments and the validation performed here, be said to be true. But, since the
experiments performed not are rigorous enough, it would be a rash conclusion if the
hypothesis was altogether falsified. The hypothesis could not be considered
completely worthless since the method derived some true associations, but too many
false positive associations were derived as well. Consequently, the hypothesis is still
unanswered, but the method validated in this thesis is at the moment not to be stated
successful. There are many factors affecting the results, and that need to be
investigated further. The main factors that have affected the results above all, are the
mismatching and shortage of data. Therefore, it is necessary to see how the method
performs with data more suitable for examining this method. Further investigations
are required.
The approach developed for deriving protein networks is intriguing, but there are
some aspects that can affect the results negatively. One of the major obstacles is that
the protein chip data is not depending on different time points or conditions, as the
gene expression data are. Maybe there are ambiguities when combining the different
data sets, or the information gained is not good enough since they are not depending
on the same conditions.

63
References
Abbott, A. (2002) Betting on tomorrow's chips. Nature, 415, 112-114.
Brazma, A. and Vilo, J. (2000) Gene expression data analysis. Federation of
European Biochemical Societies, 480, 17-24.
Campbell, N. A., Reece, J. B. and Mitchell L. G. (1999) Biology (5th Edition).
Addison Wesley Longman, Inc. USA.
Chu, S., DeRisi, J., Mulholland, J., Botstein. D., Brown, P. O. and Herskowitz, I.
(1998) The Transcriptional Program of Sporulation in Budding Yeast.
Science, 282, 699-705.
DeRisi, J. L., Iyer, V. R. and Brown, P. O. (1997) Exploring the metabolic and
genetic control of gene expression on a genomic scale. Science, 278, 680-686.
D'haeseleer, P., Liang, S., and Somogyi, R., (2000) Genetic Network Inference: From
Co-Expression Clustering to Reverse Engineering. Bioinformatics 16(8), 707-
726.
D'haeseleer, P., Wen, X., Fuhrman, S., and Somogyi, R. (1999) Linear Modeling of
mRNA expression levels during CNS development and injury. Pacific
Symposium on Biocomputing ´99, 41-52. World Scientific Publishing Co.
Edwards, J. S. and Palsson. B. O. (2000) Robustness Analysis of the Escherichia coli
Metabolic Network. Biotechnol Prog., 16, 927-939.
Eisen, M. B., Spellman, P. T., Brown, P. O. and Botstein, D. (1998) Cluster analysis
and display of genome-wide expression patterns. PNAS, USA 95, 14863-
14868.

64
Fannon, M. R. (1996) Gene expression in normal and disease states- identification of
therapeutic targets. Trends in Biotech, 14, 294-298.
Gavin, A-C., Bösche M., Krause, R., Grandi, P., Marzioch, M., Bauer, A., Schultz, J.,
Rick, J. M., Michon, A-M., Cruciat, C-M., Remor, M., Höfert, C., Schelder,
M., Brajenovic, M., Ruffner, H., Merino, A., Klein, K., Hudak, M., Dickson,
D., Rudi, T., Gnau, V., Bauch, A., Bastuck, S., Huhse, B., Leutwein, C.,
Heurtier, M-A., Copley, R. R., Edelmann, A., Querfurth, E., Rybin, V.,
Drewes, G., Raida, M., Bouwmeester. T, Boork, P., Seraphin, B., Kuster, B.,
Neubauer, G and Superti-Furga, G. (2002) Functional organization of the
yeast proteome by systematic analysis of protein complexes. Nature, 415,
141-147.
Gustafsson, A. (2002) Proteiner på chip genomskådar sjukdomar. NyTeknik, 6, 19.
Ho, Y., Gruhler, A., Heilbut, A., Bader, G. D., Moore, L., Adams, S-L., Millar, A.,
Taylor, P., Bennett, K., Boutilier, k., Yang, L., Wolting, C., Donaldson, I.,
Schandorff, S., Shewnarane, J., Vi, M., Taggart, J., Goudreault, M., Muskat,
B., Alfarno, C., Dewar, D., Lin, Z., Michalickova, K., Willems, A. R., Sassi,
H., Nielsen, P. A., Rasmussen, K. J., Andersen, J. R., Johansen,, L. E., Hansen
L. H., Jespersen, H., Podtelejnikov, A., Nielsen, E., Crawford, J., Poulsen, V.,
Sörensen, B. D., Matthiesen. J., Hendrickson, R. C., Gleeson, F., Pawson, T.,
Moran, M. F., Durocher, D., Mann, M., Hogue, C. W. V., Figeys, D and
Tyers, M. (2002) Systematic identification of protein complexes in
Saccharomyces cerevisiae by mass spectrometry. Nature, 415, 180-183.
Hazbun, T. R. and Fields, S. (2001) Networking proteins in yeast. PNAS, 98, 4277-
4278.

65
Hatzimanikatis, V. and Lee, K. H. (1999) Dynamical analysis of gene networks
requires both mRNA and protein expression information. Metabolic
Engineering, 1(4), 275-281 (1999).
He, Y. D. and Friend, S. H. (2001) Microarrays-the 21st century divining rod? Nature
Medicine, 7, 658-659.
Heath, D. (2000) An introduction to experimental design and statistics for biology
(4th Edition) Butler & Tanner Ltd, Frome and London.
Heyer, L. J., Kruglyak. S., Yooseph, S. (1999) Exploring expression data:
identification and analysis of coexpressed genes. Genome Research, 9, 1106-
1115.
Ideker, T. E., Thorsson, V., Karp, M. R. (2000) Discovery of regulatory interactions
through perturbation: inference and experimental design. Pacific Symposium
on Biocomputing, 5, 302-313.
Ito, T., Chiba, T., Ozawa, R., Yoshida, M., Hattori, M. and Sakaki Y. (2001) A
comprehensive two-hybrid analysis to explore the yeast protein interactome.
PNAS, 98, 4569-4574.
Jeong, H., Tombor, B., Albert, R., Oltvai Z. N., and Barabási, A-L. (2000) The large-
scale organization of metabolic networks. Nature, 407, 651-654.
Jeong, H., Barabási, A-L., Tombor, B., and Oltvai Z. N., (2001a.) The global
organization of cellular networks. Proceeding of Workshop on computation of
biochemical pathways and genetic networks, Heidelberg.
Jeong, H., Mason, S. P., Barabási A-L. and Oltvai Z. N. (2001b) Lethality and
centrality in protein networks. Nature, 411, 41-42.

66
Kumar, A. and Snyder, M. (2002) Protein complexes take the bait. Nature, 415, 123-
124.
MacBeath, G. and Schreiber, S. L. (2000) Printing proteins as microarrays for high-
throughput function determination. Science, 289, 1760-1763.
Schwikowski, B., Uetz, P. and Fields, S. (2000) A network of protein-protein
interactions in yeast. Nature Biotechnology, 18, 1257-1261.
Sherman, F. (1998) An Introduction to the Genetics and Molecular Biology of the
Yeast Saccharomyces cerevisiae. The Encyclopedia of Molecular Biology and
Molecular Medicine, 6, 302-325.
Snyder, M., Kumar A., Agarwal, S., Heyman, J. A., Matson, S., Heidtman, M.,
Piccirillo, S., Umansky, L., Drawid, A., Jansen, R., Liu, Y., Cheung, K-H.,
Miller, P., Gerstein, M. and Roeder, G. S. (2002) Subcellular localization of
the yeast proteome. Genes & Development, 16, 707-719.
Tamayo, P., Slonim, D., Mesirov, J., Zhu, Q., Kitareewan, S., Dmitrovsky, E.,
Lander, E. S. and Golub, T. R. (1999) Interpreting patterns of gene expression
with self-organizing maps: Methods and application to hematopoietic
differentiation. PNAS, USA 96(6), 2907-2912.
Uetz, P., Giot, L., Cagney, G., Mansfield, T. A., Judson, R. S., Knight, J. R.,
Lockshon, D., Narayan, V., Srinivasan, M., Pochart, P., Qureshi-Emili, A., Li,
Y., Godwin, B., Conover D., Kalbfleisch, T., Vijayadamodar, G., Yang, M.,
Johnston, M., Fields, S and Rothberg, J. M. (2000) A comprehensive analysis
of protein-protein interactions in Saccharomyces cerevisiae. Nature, 403, 623-
627.

67
Weaver, R. F. and Hedrick P. W. (1997). Genetics (2nd Edition). Wm. C. Brown
Publishers, USA.
Xenarios, I. and Eisenberg, D. (2001) Protein interaction databases. Current Opinion
in Biotechnology, 12, 334-339.
Zhu, H., Bilgin, M., Bangham, R., Hall, D., Casamayor, A., Bertone, P., Lan, N.,
Jansen R., Bidlingmaier S., Houfek, T., Mitchell T., Miller P., Dean, R. A.,
Gerstein, M. and Snyder, M. (2001) Global analysis of protein activities using
proteome chips. Science, 293, 2101-2105.
Zhu, H., Klemic, J. F., Chang, S., Bertone, P., Casamayor, A., Klemic, K. G., Smith,
D., Gerstein, M., Reed, M. A. and Snyder, M. (2000) Analysis of yeast protein
kinases using protein chips. Nature Genetics, 26, 283-289.
Zhu, J. and Zhang, M. Q. (2000). Cluster, function and promoter: analysis of yeast
expression array. Proceedings of Pacific Symposium on Biocomputing, 5:476-
487.

68
Appendix
Appendix 1
The 119 kinases and their cellular roles. Information is collected from the KEGGdatabase.
Starch and sucrose metabolism, Inostol phosphate metabolism, Sphingoglycolipid metabolism,Nicotinate and nicotinamide metabolism and Porphyrin and chlorofyll metabolism:
YAL017W YALO18C YBL105C YAR018C YBR059C YBR160WYCR091W YCR008W YDL079C YDL101C YDL108W YDR052CYDR122W YDR477W YDR523C YER123W YER129W YGL158WYGL179C YGL180W YGR040W YGR052W YHL007C YHR030CYHR079C YHR082C YHR102W YHR135C YIL095W YJL006CYJL057C YJL106W YJL128C YJL141C YJL165C YJR059WYKL048C YKL116C YKL126W YKL139W YKL161C YKL168CYKL171W YKL198C YLL019C YLR096W YLR113W YLR248WYLR362W YML112W YMR104C YMR139W YMR216C YMR291WYNL020C YNL154C YNL161W YNL183C YNL298W YNL307CYNR047W YOL100W YOL113W YOL128C YOL045W YOR231WYOR233W YPL026C YPL042C YPL140C YPL204W YPL209CYPR054W YPR161C YOR351C
MAPK signalling pathway:
YBL105C YDR052C YGR040W YHL007C YHR030C YIL147CYJL095W YJL128C YLR113W YLR362W YNR031C YOR231WYPL140C
Two-component system:
YIL147C
Second messenger signalling pathway:
YJL164C YKL166C YPL203W
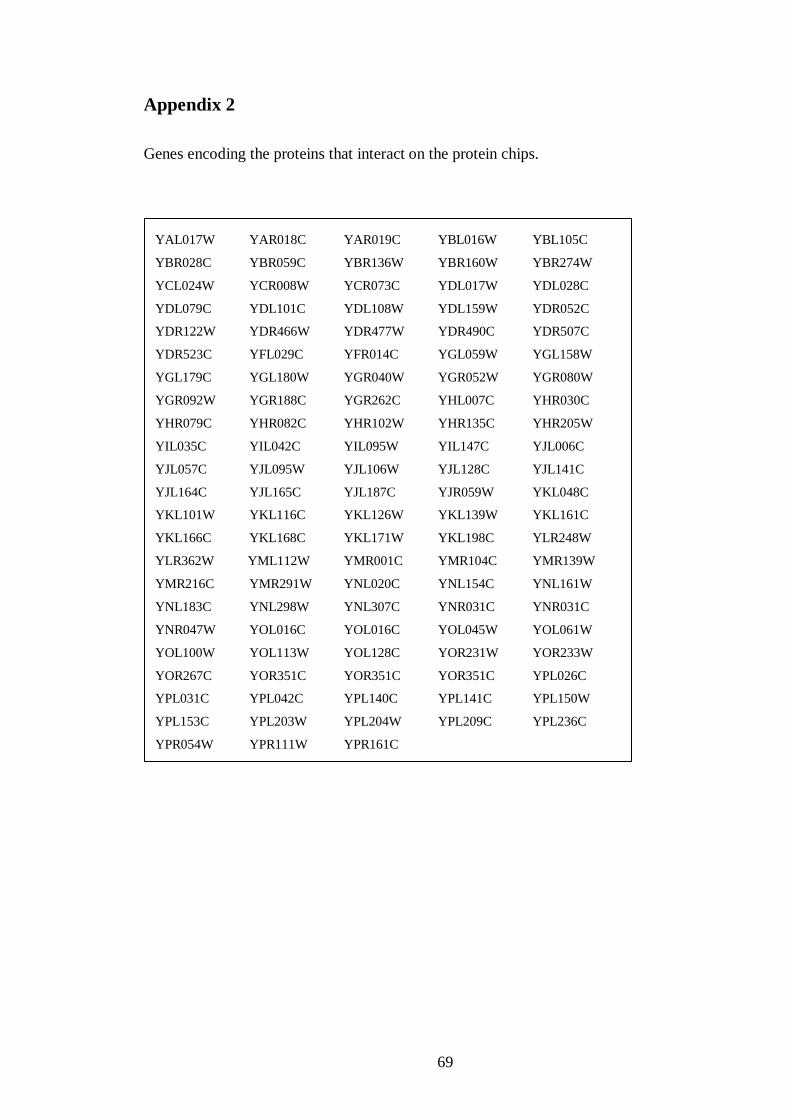
69
Appendix 2
Genes encoding the proteins that interact on the protein chips.
YAL017W YAR018C YAR019C YBL016W YBL105C
YBR028C YBR059C YBR136W YBR160W YBR274W
YCL024W YCR008W YCR073C YDL017W YDL028C
YDL079C YDL101C YDL108W YDL159W YDR052C
YDR122W YDR466W YDR477W YDR490C YDR507C
YDR523C YFL029C YFR014C YGL059W YGL158W
YGL179C YGL180W YGR040W YGR052W YGR080W
YGR092W YGR188C YGR262C YHL007C YHR030C
YHR079C YHR082C YHR102W YHR135C YHR205W
YIL035C YIL042C YIL095W YIL147C YJL006C
YJL057C YJL095W YJL106W YJL128C YJL141C
YJL164C YJL165C YJL187C YJR059W YKL048C
YKL101W YKL116C YKL126W YKL139W YKL161C
YKL166C YKL168C YKL171W YKL198C YLR248W
YLR362W YML112W YMR001C YMR104C YMR139W
YMR216C YMR291W YNL020C YNL154C YNL161W
YNL183C YNL298W YNL307C YNR031C YNR031C
YNR047W YOL016C YOL016C YOL045W YOL061W
YOL100W YOL113W YOL128C YOR231W YOR233W
YOR267C YOR351C YOR351C YOR351C YPL026C
YPL031C YPL042C YPL140C YPL141C YPL150W
YPL153C YPL203W YPL204W YPL209C YPL236C
YPR054W YPR111W YPR161C
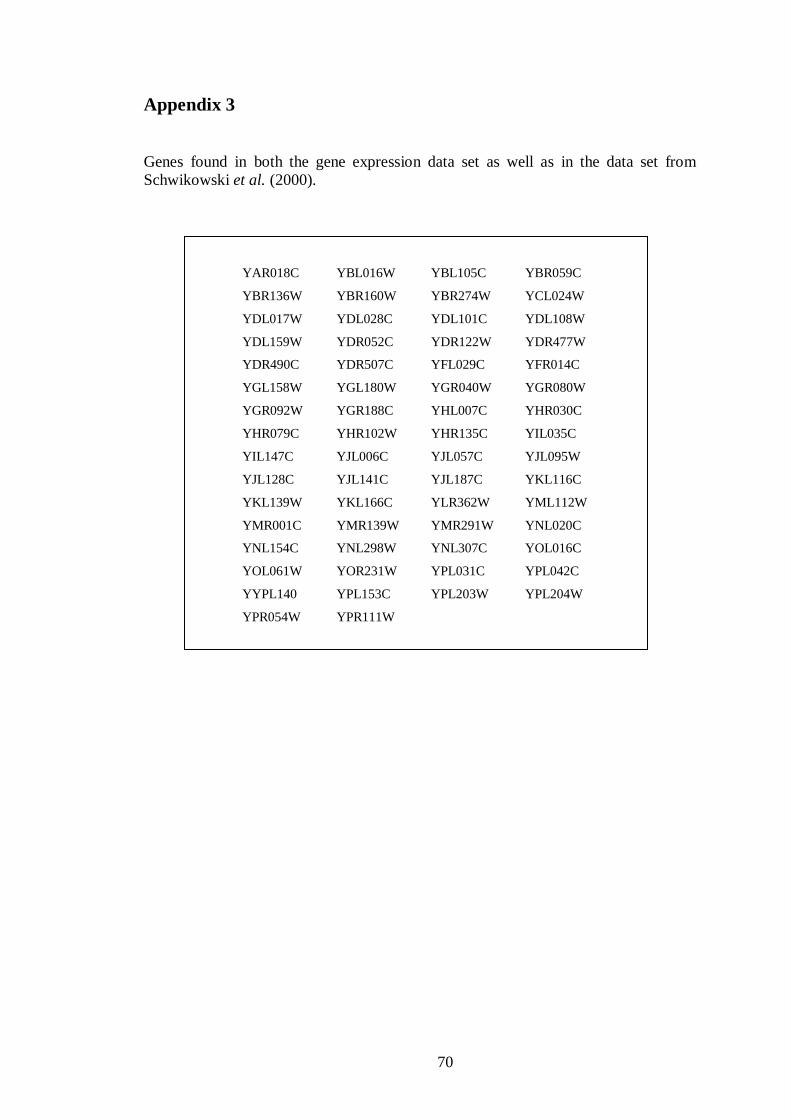
70
Appendix 3
Genes found in both the gene expression data set as well as in the data set fromSchwikowski et al. (2000).
YAR018C YBL016W YBL105C YBR059C
YBR136W YBR160W YBR274W YCL024W
YDL017W YDL028C YDL101C YDL108W
YDL159W YDR052C YDR122W YDR477W
YDR490C YDR507C YFL029C YFR014C
YGL158W YGL180W YGR040W YGR080W
YGR092W YGR188C YHL007C YHR030C
YHR079C YHR102W YHR135C YIL035C
YIL147C YJL006C YJL057C YJL095W
YJL128C YJL141C YJL187C YKL116C
YKL139W YKL166C YLR362W YML112W
YMR001C YMR139W YMR291W YNL020C
YNL154C YNL298W YNL307C YOL016C
YOL061W YOR231W YPL031C YPL042C
YYPL140 YPL153C YPL203W YPL204W
YPR054W YPR111W
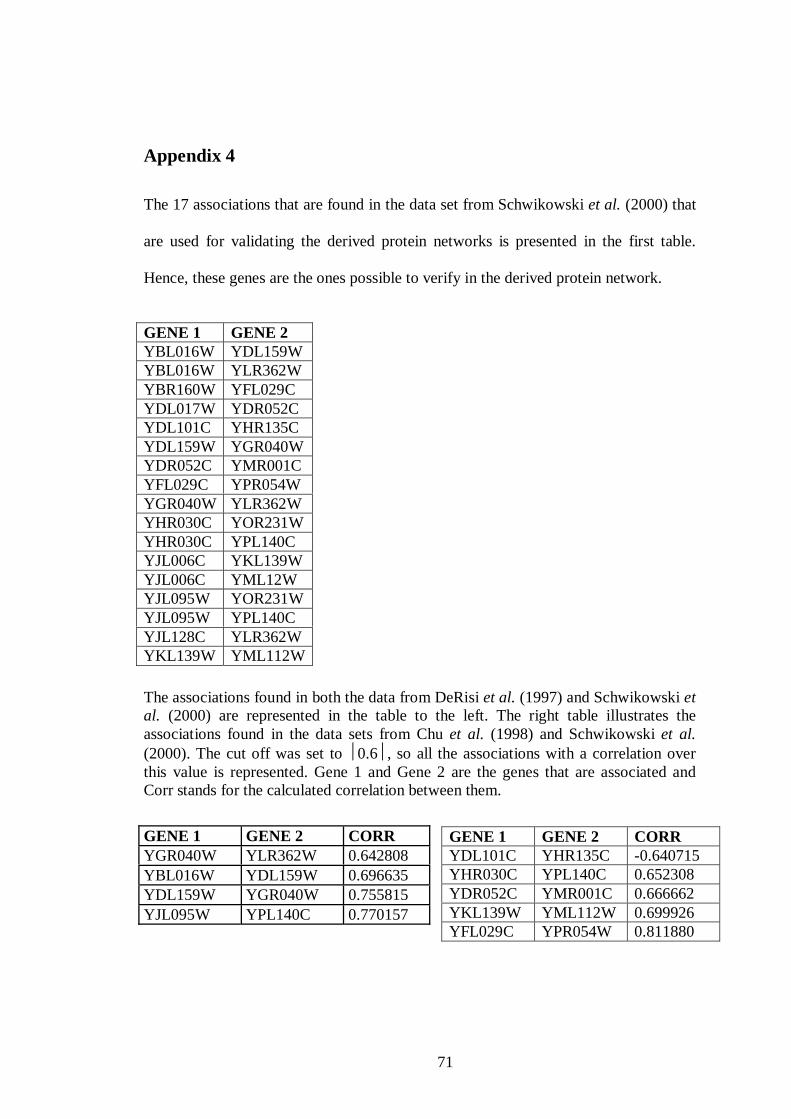
71
Appendix 4
The 17 associations that are found in the data set from Schwikowski et al. (2000) that
are used for validating the derived protein networks is presented in the first table.
Hence, these genes are the ones possible to verify in the derived protein network.
The associations found in both the data from DeRisi et al. (1997) and Schwikowski etal. (2000) are represented in the table to the left. The right table illustrates theassociations found in the data sets from Chu et al. (1998) and Schwikowski et al.(2000). The cut off was set to ⏐0.6⏐, so all the associations with a correlation overthis value is represented. Gene 1 and Gene 2 are the genes that are associated andCorr stands for the calculated correlation between them.
GENE 1 GENE 2YBL016W YDL159WYBL016W YLR362WYBR160W YFL029CYDL017W YDR052CYDL101C YHR135CYDL159W YGR040WYDR052C YMR001CYFL029C YPR054WYGR040W YLR362WYHR030C YOR231WYHR030C YPL140CYJL006C YKL139WYJL006C YML12WYJL095W YOR231WYJL095W YPL140CYJL128C YLR362WYKL139W YML112W
GENE 1 GENE 2 CORRYDL101C YHR135C -0.640715YHR030C YPL140C 0.652308YDR052C YMR001C 0.666662YKL139W YML112W 0.699926YFL029C YPR054W 0.811880
GENE 1 GENE 2 CORRYGR040W YLR362W 0.642808YBL016W YDL159W 0.696635YDL159W YGR040W 0.755815YJL095W YPL140C 0.770157
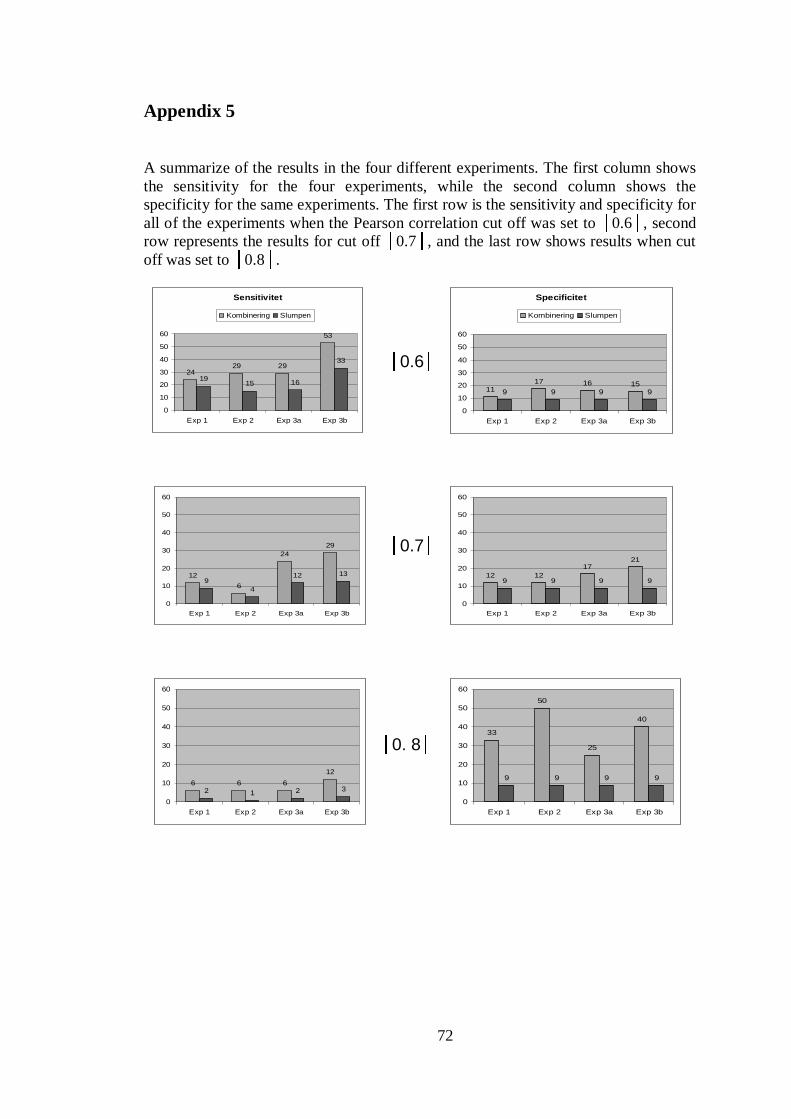
72
Appendix 5
A summarize of the results in the four different experiments. The first column showsthe sensitivity for the four experiments, while the second column shows thespecificity for the same experiments. The first row is the sensitivity and specificity forall of the experiments when the Pearson correlation cut off was set to │0.6│, secondrow represents the results for cut off │0.7│, and the last row shows results when cutoff was set to │0.8│.
Sensitivitet
2429 29
53
1915 16
33
0
10
20
30
40
50
60
Exp 1 Exp 2 Exp 3a Exp 3b
Kombinering Slumpen
12
6
2429
94
12 13
0
10
20
30
40
50
60
Exp 1 Exp 2 Exp 3a Exp 3b
6 6 6
12
2 1 2 3
0
10
20
30
40
50
60
Exp 1 Exp 2 Exp 3a Exp 3b
Specificitet
1117 16 15
9 9 9 9
0
10
20
30
40
50
60
Exp 1 Exp 2 Exp 3a Exp 3b
Kombinering Slumpen
12 1217
21
9 9 9 9
0
10
20
30
40
50
60
Exp 1 Exp 2 Exp 3a Exp 3b
33
50
25
40
9 9 9 9
0
10
20
30
40
50
60
Exp 1 Exp 2 Exp 3a Exp 3b
│0.6│
│0.7│
│0. 8│