deriveties in india
DESCRIPTION
brief about derivativesTRANSCRIPT

1
A
Grand ProjectGrand ProjectGrand ProjectGrand Project On
Growth of Derivatives in Indian market
SUBMITTED TO:
GUJARAT UNIVERSITY
In partial fulfillment of the requirement of MBA pr ogram of Gujarat University (Batch: 2006-08)
SUBMITTED BY:
Dhaval Bachandani (03)
Alpesh Parmar (30)
Prof.Falguni Pandya
AES POST GRADUATE INSTITUTE OF
BUSINESS MANAGEMENT, AHMEDABAD

2
PREFACE
MBA is a professional course wherein for a student to posses only
theoretical knowledge alone is not enough but also to improve practical skill
which is helpful to them in every field of life in their future. Students needs
to have a practical implementation in the current scenario.
As a part of final semester syllabus of MBA we visited Stock Broking
Companies for practical training and also studied on the working of its
different services and prepare report on particular topic.
This training has expanded our horizon of knowledge in practical as well as
theoretical which are vital for any student in management level studies.
After completion of this Project we came to know that when we study
theory but practice it is very difficult to understand. Therefore to serve
dual purpose of practical training has been made compulsory for the student
of MBA.
Such training promotes a student to boost his potentials and the inner
qualities, and thereby students come to know about their reality that how
the theoretical knowledge works in actual sense in any unit. This has indeed
proved to be very useful to us.

3
ACKNOWLEDGEMENT
It gives us a great pleasure and personal satisfaction in presenting this report as a
part of our Grand Project on “Satisfaction level of Investors with their broking firm”
which has helped us to understand the preferences of investors for choosing any stock
broking firm..
We are indebted to many individuals who have either directly or indirectly made an
important contribution in the preparation of this report.
we are also grateful to Dr.A.H.Kalro , (Director, AES PGIBM), for giving us an
opportunity to experience the corporate world, and for his valuable inputs on the project.
.We are also thankful to our co guide Prof Falguni Pandya
We would like to thank the entire staff of AESPGIBM library, computer lab especially
Hitanshu sir and Anvesha madam for their immense support. We would also like to
thank all the respondents, without whom the report would not have been completed.
Last but not the least We would like to place special thanks to our parents and friends for
their help and support.

4
Sr No Title Pg NO 1 Introduction to Derivatives 02 2 Development of Derivatives in
India 03
3 Derivative Instrument 04 4 Derivative User 06 5 Types of Derivatives
a. forward b. futures c. option d. swap
07
6 Uses of Derivatives 21 7 History of derivatives 23 8 Recent Development 25 9 Strategies of Derivatives
a. Bull Spread b. Bear Spread c. Butterfly d. Strangle e. Straddle
27
10 Risk involved 39 11 FII and Derivatives 42 12 Technical analysis 46 13 Derivatives system 49 14 Derivative product 51 15 Derivatives concepts A-Z 55 16 Summarization of derivatives
market 69
17 Bibliography 79

5
INTRODUCTION TO DERIVATIVES
Derivatives are financial instruments whose value is derived from the value of something else. They generally take the form of contracts under which the parties agree to payments between them based upon the value of an underlying asset or other data at a particular point in time. The main types of derivatives are futures, forwards, options, and swaps.
The main use of derivatives is to reduce risk for one party while offering the potential for a high return (at increased risk) to another. The diverse range of potential underlying assets and payoff alternatives leads to a huge range of derivatives contracts available to be traded in the market. Derivatives can be based on different types of assets such as commodities, equities (stocks), bonds, interest rates, exchange rates, or indexes (such as a stock market index, consumer price index (CPI) — see inflation derivatives — or even an index of weather conditions, or other derivatives). Their performance can determine both the amount and the timing of the payoffs.
'By far the most significant event in finance during the past decade has been the extraordinary development and expansion of financial derivatives. These instruments enhance the ability to differentiate risk and allocate it to those investors most able and willing to take it - a process that has undoubtedly improved national productivity growth and standards of living.' -- Alan Greenspan, Chairman, Board of Governors of the US Federal Reserve System.

6
Development of Derivative Markets in India Derivatives markets have been in existence in India in some form or other for a long time. In the area of commodities, the Bombay Cotton Trade Association started futures trading in 1875 and, by the early 1900s India had one of the world’s largest futures industry. In 1952 the government banned cash settlement and options trading and derivatives trading shifted to informal forwards markets. In recent years, government policy has changed, allowing for an increased role for market-based pricing and less suspicion of derivatives trading. The ban on futures trading of many commodities was lifted starting in the early 2000s, and national electronic commodity exchanges were created. In the equity markets, a system of trading called “badla” involving some elements of forwards trading had been in existence for decades.6 However, the system led to a number of undesirable practices and it was prohibited off and on till the Securities and Derivatives Exchange Board of India (SEBI) banned it for good in 2001. A series of reforms of the stock market between 1993 and 1996 paved the way for the development of exchange-traded equity derivatives markets in India. In 1993, the government created the NSE in collaboration with state-owned financial institutions. NSE improved the efficiency and transparency of the stock markets by offering a fully automated screen-based trading system and real-time price dissemination. In 1995, a prohibition on trading options was lifted. In 1996, the NSE sent a proposal to SEBI for listing exchange-traded derivatives. The report of the L. C. Gupta Committee, set up by SEBI, recommended a phased introduction of derivative products, and bi-level regulation (i.e., self-regulation by exchanges with SEBI providing a supervisory and advisory role). Another report, by the J. R. Varma Committee in 1998, worked out various operational details such as the margining systems. In 1999, the Securities Contracts (Regulation) Act of 1956, or SC(R)A, was amended so that derivatives could be declared “securities.” This allowed the regulatory framework for trading securities to be extended to derivatives. The Act considers derivatives to be legal and valid, but only if they are traded on exchanges. Finally, a 30-year ban on forward trading was also lifted in 1999. The economic liberalization of the early nineties facilitated the introduction of derivatives based on interest rates and foreign exchange. A system of market-determined exchange rates was adopted by India in March 1993. In August 1994, the rupee was made fully convertible on current account. These reforms allowed increased integration between domestic and international markets, and created a need to manage currency risk. Figure 1 shows how the volatility of the exchange rate between the Indian Rupee and the U.S.

7
dollar has increased since 1991. The easing of various restrictions on the free movement of interest rates resulted in the need to manage interest rate risk.

8
Derivatives Instruments Traded in India In the exchange-traded market, the biggest success story has been derivatives on equity products. Index futures were introduced in June 2000, followed by index options in June 2001, and options and futures on individual securities in July 2001 and November 2001, respectively. As of 2005, the NSE trades futures and options on 118 individual stocks and Derivatives . 3 stock indices. All these derivative contracts are settled by cash payment and do not involve physical delivery of the underlying product (which may be costly).8 Derivatives on stock indexes and individual stocks have grown rapidly since inception. In particular, single stock futures have become hugely popular, accounting for about half of NSE’s traded value in October 2005. In fact, NSE has the highest volume (i.e. number of contracts traded) in the single stock futures globally, enabling it to rank 16 among world exchanges in the first half of 2005. Single stock options are less popular than futures. Index futures are increasingly popular, and accounted for close to 40% of traded value in October 2005. Figure 2 illustrates the growth in volume of futures and options on the Nifty index, and shows that index futures have grown more strongly than index options.9
. NSE launched interest rate futures in June 2003 but, in contrast to equity derivatives, there has been little trading in them. One problem with these instruments was faulty contract specifications, resulting in the underlying interest rate deviating erratically from the reference rate used by market participants. Institutional investors have preferred to trade in the OTC markets, where instruments such as interest rate swaps and forward rate agreements are thriving. As interest rates in India have fallen, companies have swapped their fixed rate borrowings into floating rates to reduce funding costs.10 Activity in OTC markets dwarfs that of the entire exchange-traded markets, with daily value of trading estimated to be Rs. 30 billion in 2004. Foreign exchange derivatives are less active than interest rate derivatives in India, even though they have been around for longer. OTC instruments in currency forwards and swaps are the most popular. Importers, exporters and banks use the rupee forward market Derivatives . To hedge their foreign currency exposure. Turnover and liquidity in this market has been increasing, although trading is mainly in shorter maturity contracts of one year or less. In a currency swap, banks and corporations may swap its rupee denominated debt into another currency (typically the US dollar or Japanese yen), or vice versa. Trading in OTC currency options is still muted. There are no exchange-traded currency derivatives in India.

9
Exchange-traded commodity derivatives have been trading only since 2000, and the growth in this market has been uneven. The number of commodities eligible for futures trading has increased from 8 in 2000 to 80 in 2004, while the value of trading has increased almost four times in the same period. However, many contracts barely trade and, of those that are active, trading is fragmented over multiple market venues, including central and regional exchanges, brokerages, and unregulated forwards markets. Total volume of commodity derivatives is still small, less than half the size of equity derivatives .

10
Derivatives Users in India The use of derivatives varies by type of institution. Financial institutions, such as banks, have assets and liabilities of different maturities and in different currencies, and are exposed to different risks of default from their borrowers. Thus, they are likely to use derivatives on interest rates and currencies, and derivatives to manage credit risk. Non-financial institutions are regulated differently from financial institutions, and this affects their incentives to use derivatives. Indian insurance regulators, for example, are yet to issue guidelines relating to the use of derivatives by insurance companies. In India, financial institutions have not been heavy users of exchange-traded derivatives so far, with their contribution to total value of NSE trades being less than 8% in October 2005. However, market insiders feel that this may be changing, as indicated by the growing share of index derivatives (which are used more by institutions than by retail investors). In contrast to the exchange-traded markets, domestic financial institutions and mutual funds have shown great interest in OTC fixed income instruments. Transactions between banks dominate the market for interest rate derivatives, while state-owned banks remain a small presence (Chitale, 2003). Corporations are active in the currency forwards and swaps markets, buying these instruments from banks. Why do institutions not participate to a greater extent in derivatives markets? Some institutions such as banks and mutual funds are only allowed to use derivatives to hedge their existing positions in the spot market, or to rebalance their existing portfolios. Since banks have little exposure to equity markets due to banking regulations, they have little incentive to trade equity derivatives.11 Foreign investors must register as foreign institutional investors (FII) to trade exchange-traded derivatives, and be subject to position limits as specified by SEBI. Alternatively, they can incorporate locally as a Derivatives Retail investors (including small brokerages trading for themselves) are the major participants in equity derivatives, accounting for about 60% of turnover in October 2005, according to NSE. The success of single stock futures in India is unique, as this instrument has generally failed in most other countries. One reason for this success may be retail investors’ prior familiarity with “badla” trades which shared some features of derivatives trading. Another reason may be the small size of the futures contracts, compared to similar contracts in other countries. Retail investors also dominate the markets for commodity derivatives, due in part to their long-standing expertise in trading in the “havala” or forwards markets. .

11
. TYPES OF DERIVATIVES
OTC and exchange-traded
Broadly speaking there are two distinct groups of derivative contracts, which are distinguished by the way they are traded in market:
• Over-the-counter (OTC) derivatives are contracts that are traded (and privately negotiated) directly between two parties, without going through an exchange or other intermediary. Products such as swaps, forward rate agreements, and exotic options are almost always traded in this way. The OTC derivatives market is huge. According to the Bank for International Settlements, the total outstanding notional amount is USD 516 trillion (as of June 2007)
• Exchange-traded derivatives (ETD) are those derivatives products that are traded via specialized derivatives exchanges or other exchanges. A derivatives exchange acts as an intermediary to all related transactions, and takes Initial margin from both sides of the trade to act as a guarantee. The world's largest[2] derivatives exchanges (by number of transactions) are the Korea Exchange (which lists KOSPI Index Futures & Options), Eurex (which lists a wide range of European products such as interest rate & index products), and CME Group (made up of the 2007 merger of the Chicago Mercantile Exchange and the Chicago Board of Trade). According to BIS, the combined turnover in the world's derivatives exchanges totalled USD 344 trillion during Q4 2005. Some types of derivative instruments also may trade on traditional exchanges. For instance, hybrid instruments such as convertible bonds and/or convertible preferred may be listed on stock or bond exchanges. Also, warrants (or "rights") may be listed on equity exchanges. Performance Rights, Cash xPRTs(tm) and various other instruments that essentially consist of a complex set of options bundled into a simple package are routinely listed on equity exchanges. Like other derivatives, these publicly traded derivatives provide investors access to risk/reward and volatility characteristics that, while related to an underlying commodity, nonetheless are distinctive.

12
Common Derivative contract types
There are three major classes of derivatives:
• Futures/Forwards, which are contracts to buy or sell an asset at a specified future date.
• Options, which are contracts that give a holder the right (but not the obligation) to buy or sell an asset at a specified future date.
• Swaps, where the two parties agree to exchange cash flows.
Examples
• Economic derivatives that pay off according to economic reports ([1]) as measured and reported by national statistical agencies
• Energy derivatives that pay off according to a wide variety of indexed energy prices. Usually classified as either physical or financial, where physical means the contract includes actual delivery of the underlying energy commodity (oil, gas, power, etc)
• Commodities • Freight derivatives • Inflation derivatives • Insurance derivatives • Weather derivatives • Credit derivatives • Sports derivatives • Property derivatives

13
FORWARD CONTRACT
Forward contract is an agreement between two parties to buy or sell an asset (which can be of any kind) at a pre-agreed future point in time. Therefore, the trade date and delivery date are separated. It is used to control and hedge risk, for example currency exposure risk (e.g., forward contracts on USD or EUR) or commodity prices (e.g., forward contracts on oil).
One party agrees (obligated) to sell, the other to buy, for a forward price agreed in advance. In a forward transaction, no actual cash changes hands. If the transaction is collateralized, exchange of margin will take place according to a pre-agreed rule or schedule. Otherwise no asset of any kind actually changes hands, until the maturity of the contract.
The forward price of such a contract is commonly contrasted with the spot price, which is the price at which the asset changes hands (on the spot date, usually two business days). The difference between the spot and the forward price is the forward premium or forward discount.
A standardized forward contract that is traded on an exchange is called a futures contract.
Example of how the payoff of a forward contract works
Suppose that Bob wants to buy a house in one year's time. At the same time, suppose that Andy currently owns a $100,000 house that he wishes to sell in one year's time. Both parties could enter into a forward contract with each other. Suppose that they both agree on the sale price in one year's time of $104,000 (more below on why the sale price should be this amount). Andy and Bob have entered into a forward contract. Bob, because he is buying the underlying, is said to have entered a long forward contract. Conversely, Andy will have the short forward contract.
At the end of one year, suppose that the current market valuation of Andy's house is $110,000. Then, because Andy is obliged to sell to Bob for only $104,000, Bob will make a profit of $6,000. To see why this is so, one need only to recognize that Bob can buy from Andy for $104,000 and immediately sell to the market for $110,000. Bob has made the difference in profit. In contrast, Andy has made a loss of $6,000.

14
FUTURES CONTRACT
Futures contract is a standardized contract, traded on a futures exchange, to buy or sell a certain underlying instrument at a certain date in the future, at a specified price. The future date is called the delivery date or final settlement date. The pre-set price is called the futures price. The price of the underlying asset on the delivery date is called the settlement price.
A futures contract gives the holder the obligation to buy or sell, which differs from an options contract, which gives the holder the right, but not the obligation. In other words, the owner of an options contract may exercise the contract. Both parties of a "futures contract" must fulfill the contract on the settlement date. The seller delivers the commodity to the buyer, or, if it is a cash-settled future, then cash is transferred from the futures trader who sustained a loss to the one who made a profit. To exit the commitment prior to the settlement date, the holder of a futures position has to offset their position by either selling a long position or buying back a short position, effectively closing out the futures position and its contract obligations.
Futures contracts, or simply futures, are exchange traded derivatives. The exchange's clearinghouse acts as counterparty on all contracts, sets margin requirements, etc.
Futures contracts and exchanges
There are many different kinds of futures contracts, reflecting the many different kinds of tradable assets of which they are derivatives. For information on futures markets in specific underlying commodity markets, follow the links.
• Foreign exchange market • Money market • Bond market • Equity index market • Soft Commodities market
Settlement
Settlement is the act of consummating the contract, and can be done in one of two ways, as specified per type of futures contract:
• Physical delivery - the amount specified of the underlying asset of the contract is delivered by the seller of the contract to the exchange, and by the exchange to the buyers of the contract. Physical delivery is common with commodities and bonds. In practice, it occurs only on a minority of contracts. Most are cancelled out by purchasing a covering position - that is, buying a contract to cancel out an earlier sale (covering a short), or selling a contract to liquidate an earlier purchase (covering a long). The Nymex crude futures contract uses this method of settlement upon expiration.
• Cash settlement - a cash payment is made based on the underlying reference rate, such as a short term interest rate index such as or the closing value of a stock market index. A futures contract might also opt to settle against an index based on trade in a related spot market. Ice Brent futures use this method.
15
• Expiry is the time when the final prices of the future are determined. For many equity index and interest rate futures contracts (as well as for most equity options), this happens on the third Friday of certain trading month. On this day the t+1 futures contract becomes the t futures contract. For example, for most CME and CBOT contracts, at the expiry on December, the March futures become the nearest contract. This is an exciting time for arbitrage desks, as they will try to make rapid gains during the short period (normally 30 minutes) where the final prices are averaged from. At this moment the futures and the underlying assets are extremely liquid and any mispricing between an index and an underlying asset is quickly traded by arbitrageurs. At this moment also, the increase in volume is caused by traders rolling over positions to the next contract or, in the case of equity index futures, purchasing underlying components of those indexes to hedge against current index positions. On the expiry date, a European equity arbitrage trading desk in London or Frankfurt will see positions expire in as many as eight major markets almost every half an hour.
Standardization
Futures contracts ensure their liquidity by being highly standardized, usually by specifying:
• The underlying asset or instrument. This could be anything from a barrel of crude oil to a short term interest rate.
• The type of settlement, either cash settlement or physical settlement. • The amount and units of the underlying asset per contract. This can be the notional
amount of bonds, a fixed number of barrels of oil, units of foreign currency, the notional amount of the deposit over which the short term interest rate is traded, etc.
• The currency in which the futures contract is quoted. • The grade of the deliverable. In the case of bonds, this specifies which bonds can be
delivered. In the case of physical commodities, this specifies not only the quality of the underlying goods but also the manner and location of delivery. For example, the NYMEX Light Sweet Crude Oil contract specifies the acceptable sulfur content and API specific gravity, as well as the location where delivery must be made.
• The delivery month. • The last trading date. • Other details such as the commodity tick, the minimum permissible price fluctuation.

16
Futures vs. Forwards
While futures and forward contracts are both a contract to deliver a commodity on a future date at a prearranged price, they are different in several respects:
• Forwards transact only when purchased and on the settlement date. Futures, on the other hand, are rebalanced, or "marked to market," every day to the daily spot price of a forward with the same agreed-upon delivery price and underlying asset.
o The fact that forwards are not rebalanced daily means that, due to movements in the price of the underlying asset, a large differential can build up between the forward's delivery price and the settlement price.
� This means that one party will incur a big loss at the time of delivery (assuming they must transact at the underlying's spot price to facilitate receipt/delivery).
� This in turn creates a credit risk. More generally, the risk of a forward contract is that the supplier will be unable to deliver the required commodity, or that the buyer will be unable to pay for it on the delivery day.
o The rebalancing of futures eliminates much of this credit risk by forcing the holders to update daily to the price of an equivalent forward purchased that day. This means that there will usually be very little additional money due on the final day to settle the futures contract.
o In addition, the daily futures-settlement failure risk is borne by an exchange, rather than an individual party, limiting credit risk in futures.
o Example for a futures contract with a $100 price: Let's say that on day 50, a forward with a $100 delivery price (on the same underlying asset as the future) costs $88. On day 51, that forward costs $90. This means that the mark-to-market would require the holder of one side of the future to pay $2 on day 51 to track the changes of the forward price. This money goes, via margin accounts, to the holder of the other side of the future. (A forward-holder, however, would pay nothing until settlement on the final day, potentially building up a large balance. So, except for tiny effects of convexity bias or possible allowance for credit risk, futures and forwards with equal delivery prices result in the same total loss or gain, but holders of futures experience that loss/gain in daily increments which track the forward's daily price changes, while the forward's spot price converges to the settlement price.)
• Futures are always traded on an exchange, whereas forwards always trade over-the-counter, or can simply be a signed contract between two parties.
• Futures are highly standardised, whereas some forwards are unique. • In the case of physical delivery, the forward contract specifies to whom to make the
delivery. The counterparty for delivery on a futures contract is chosen by the clearinghouse.

17
Some exchanges tolerate 'nonconvergence', the failure of futures contracts and the value of the physical commodities they represent to reach the same value on 'contract settlement' day at the designated delivery points. An example of this is the CBOT (Chicago Board of Trade)Soft Red Winter wheat (SRW) futures. SRW futures have settled more than 20¢ apart on settlement day and as much as $1.00 difference between settlement days. Only a few participants holding CBOT SRW futures contracts are qualified by the CBOT to make or receive delivery of commodities to settle futures contracts. Therefore, it's impossible for almost any individual producer to 'hedge' efficiently when relying on the final settlement of a futures contract for SRW. The trend is the CBOT continuing to restrict those entities who can actually participate in settling contracts with commodity to only those that can ship or receive large quantities of railroad cars and multiple barges at a few selected sites. The CFTC (Commodity Futures Trading Commission - a regulatory agency headed by a political appointee), which has oversight of the futures market, has made no comment as to why this trend is allowed to continue since economic theory and CBOT publications maintain that convergence of contracts with the price of the underlying commodity they represent is the basis of integrity for a futures market. It follows that the function of 'price discovery', the ability of the markets to discern the appropriate value of a commodity reflecting current conditions, is degraded in relation to the discrepancy in price and the inability of producers to enforce contracts with the commodities they represent

18
OPTION
Options are financial instruments that convey the right, but not the obligation, to engage in a future transaction on some underlying security. For example, buying a call option provides the right to buy a specified quantity of a security at a set strike price at some time on or before expiration, while buying a put option provides the right to sell. Upon the option holder's choice to exercise the option, the party who sold, or wrote, the option must fulfill the terms of the contract.
The theoretical value of an option can be determined by a variety of techniques. These models, which are developed by quantitative analysts, can also predict how the value of the option will change in the face of changing conditions. Hence, the risks associated with trading and owning options can be understood and managed with some degree of precision.
Exchange-traded options form an important class of options which have standardized contract features and trade on public exchanges, facilitating trading among independent parties. Over-the-counter options are traded between private parties, often well-capitalized institutions that have negotiated separate trading and clearing arrangements with each other. Another important class of options, particularly in the U.S., is employee stock options, which are awarded by a company to their employees as a form of incentive compensation.
Other types of options exist in many financial contracts, for example real estate options are often used to assemble large parcels of land, and prepayment options are usually included in mortgage loans. However, many of the valuation and risk management principles apply across all financial options.
Contract specifications
Every financial option is a contract between the two counterparties with the terms of the option specified in a term sheet. Option contracts may be quite complicated; however, at minimum, they usually contain the following specifications:
• whether the option holder has the right to buy (a call option) or the right to sell (a put option)
• the quantity and class of the underlying asset(s) (e.g. 100 shares of XYZ Co. B stock) • the strike price, also known as the exercise price, which is the price at which the
underlying transaction will occur upon exercise • the expiration date, or expiry, which is the last date the option can be exercised • the settlement terms, for instance whether the writer must deliver the actual asset on
exercise, or may simply tender the equivalent cash amount • the terms by which the option is quoted in the market, usually a multiplier such as 100,
to convert the quoted price into actual premium amount

19
Types of options
The primary types of financial options are:
• Exchange traded options (also called "listed options") are a class of exchange traded derivatives. Exchange traded options have standardized contracts, and are settled through a clearing house with fulfillment guaranteed by the credit of the exchange. Since the contracts are standardized, accurate pricing models are often available. Exchange traded options include:
1. stock options, 2. commodity options, 3. bond options and other interest rate options 4. index (equity) options, and 5. options on futures contracts
• Over-the-counter options (OTC options, also called "dealer options") are traded between two private parties, and are not listed on an exchange. The terms of an OTC option are unrestricted and may be individually tailored to meet any business need. In general, at least one of the counterparties to an OTC option is a well-capitalized institution. Option types commonly traded over the counter include:
1. interest rate options 2. currency cross rate options, and 3. options on swaps or swaptions.
• Employee stock options are issued by a company to its employees as compensation.
The basic trades of traded stock options
These trades are described from the point of view of a speculator. If they are combined with other positions, they can also be used in hedging.
Long Call

20
Payoffs and profits from a long call.
A trader who believes that a stock's price will increase might buy the right to purchase the stock (a call option) rather than just buy the stock. He would have no obligation to buy the stock, only the right to do so until the expiration date. If the stock price increases over the exercise price by more than the premium paid, he will profit. If the stock price decreases, he will let the call contract expire worthless, and only lose the amount of the premium. A trader might buy the option instead of shares, because for the same amount of money, he can obtain a larger number of options than shares. If the stock rises, he will thus realize a larger gain than if he had purchased shares
Short Call
Payoffs and profits from a naked short call.
A trader who believes that a stock price will decrease, can sell the stock short or instead sell, or "write," a call. Because both strategies expose the investor to unlimited losses, they are generally considered inappropriate for small investors. The trader selling a call has an obligation to sell the stock to the call buyer at the buyer's option. If the stock price decreases, the short call position will make a profit in the amount of the premium. If the stock price increases over the exercise price by more than the amount of the premium, the short will lose money, with the potential loss unlimited

21
Long Put
Payoffs and profits from a long put.
A trader who believes that a stock's price will decrease can buy the right to sell the stock at a fixed price (a put option). He will be under no obligation to sell the stock, but has the right to do so until the expiration date. If the stock price decreases below the exercise price by more than the premium paid, he will profit. If the stock price increases, he will just let the put contract expire worthless and only lose his premium paid.
Short Put
Payoffs and profits from a naked short put.
A trader who believes that a stock price will increase can buy the stock or instead sell a put. The trader selling a put has an obligation to buy the stock from the put buyer at the put buyer's option. If the stock price increases, the short put position will make a profit in the amount of the premium. If the stock price decreases below the exercise price by more than the amount of the premium, the trader will lose money, with the potential loss being up to the full value of the stock.

22
SWAP
In finance, a swap is a derivative in which two counterparties agree to exchange one stream of cash flows against another stream. These streams are called the legs of the swap.
The cash flows are calculated over a notional principal amount, which is usually not exchanged between counterparties. Consequently, swaps can be used to create unfunded exposures to an underlying asset, since counterparties can earn the profit or loss from movements in price without having to post the notional amount in cash or collateral.
Swaps can be used to hedge certain risks such as interest rate risk, or to speculate on changes in the underlying prices.
Structure OF SWAP
Most swaps are traded Over The Counter (OTC), "tailor-made" for the counterparties. Some types of swaps are also exchanged on futures markets, for instance Chicago Mercantile Exchange Holdings Inc., the largest U.S. futures market, the Chicago Board Options Exchange and Frankfurt-based Eurex AG. David Swensen, a Yale Ph.D. at Salomon Brothers, engineered the first swap transaction according to "When Genius Failed: The Rise and Fall of Long-Term Capital Management" by Roger Lowenstein.
The five generic types of swaps, in order of their quantitative importance, are: interest rate swaps, currency swaps, credit swaps, commodity swaps and equity swaps.
Example of SWAP
Take the case of a plain vanilla fixed-to-floating interest rate swap. Here party A makes periodic interest payments to party B based on a variable interest rate of LIBOR +50 basis points.
Party B in turn makes periodic interest payments based on a fixed rate of 3%. The payments are calculated over the notional amount. The first rate is called variable, because it is reset at the beginning of each interest calculation period to the then current reference rate, such as LIBOR.

23
OTHER TYPES OF DERIVATIVES
Freight derivative, or Forward Freight Agreement (FFA), is a financial instrument for trading in future levels of freight rates, for dry bulk carriers and tankers. These instruments are settled against various freight rate indices published by the Baltic Exchange and Platt's. FFAs are usually traded over the counter, but screen-based trading is becoming more popular. Trades can be given up for clearing by the broker to one of the clearing houses that support such trades. There are four clearing houses on freight: Norwegian Futures and Options Clearing House (NOS, Norwegian), LCH.Clearnet, NYMEX Clearport, SGX (Singapore). Freight derivatives are primarily used by shipowners and operators, oil companies, trading companies and grain houses as tools for managing freight rate risk.
Inflation derivatives (or inflation-indexed derivatives) refer to over-the-counter and exchange-traded derivatives that are used to transfer inflation risk from one counterparty to another. Typically, real rate swaps also come under this bracket, such as asset swaps of inflation indexed bonds (commonly referred to as Treasury Inflation Protected Securities, TIPS, and/or inflation linked fixed income). Inflation swaps are the linear form of these derivatives. They can take a similar form to fixed versus floating interest rate swaps (which are the derivative form for fixed rate bonds), but use a real rate coupon versus floating, but also pay a redemption pickup at maturity (i.e., the derivative form of inflation indexed bonds).
Inflation swaps are typically priced on a zero-coupon basis (ZC), with payment exchanged at the end of the term. One party pays the compounded fixed and the other the actual inflation rate for the term. Inflation swaps can also be paid on a year-on-year basis (YOY) where the year-on-year rate of change of the price index is paid, typically yearly as in the case of most European YOY swaps, but also monthly for many swapped notes in the US market. Even though the coupons are paid monthly, the inflation rate used is still the year-on-year rate.
Options on inflation, including caps, floors and straddles, can also be traded. These are typically priced against YOY swaps, whilst the swaption is priced on the ZC curve.
Asset swaps also exist where the coupon payment of the linker (inflation bond) is exchanged for interest rate payments expressed as a premium or discount to LIBOR for the relevant bond coupon period, all dates are co-terminus.
Real rate swaps are the nominal interest swap rate less the corresponding inflation swap.

24
Weather derivatives are financial instruments that can be used by organizations or individuals as part of a risk management strategy to reduce risk associated with adverse or unexpected weather conditions. The difference from other derivatives is that the underlying asset (rain/temperature/snow) has no direct value to price the weather derivative. Farmers can use weather derivatives to hedge against poor harvests caused by drought or frost; theme parks may want to insure against rainy weekends during peak summer seasons; and gas and power companies may use heating degree days (HDD) or cooling degree days (CDD) contracts to smooth earnings.
Heating degree days are one of the most common types of weather derivative. Typical terms for an HDD contract could be: for the November to March period, for each day where the temperature falls below 18 degrees Celsius keep a cumulative count of the difference between 18 degrees and the average daily temperature. Depending upon whether the option is a put option or a call option, pay out a set amount per heating degree day that the actual count differs from the strike.
Credit derivative is a financial instrument or derivative whose price and value derives from the creditworthiness of the obligations of a third party, which is isolated and traded." Credit default products are the most commonly traded credit derivative product and include unfunded products such as credit default swaps and funded products such as synthetic CDOs (see further discussion below).
Credit derivatives in their simplest form are bilateral contracts between a buyer and seller under which the seller sells protection against certain pre-agreed events occurring in relation to a third party (usually a corporate or sovereign) known as a reference entity; which affect the creditworthiness of that reference entity. The reference entity will not (except in certain very limited circumstances) be a party to the credit derivatives contract, and will usually be unaware of the contract's existence.
A Property derivative is a derivative (finance) whose price and value derives from the value of a real estate asset, usually represented in the form of an index. The product usually takes the form of a total return swap or forward and can adopt a funded format where the property derivative is embedded into a note structure. Under the total return swap or forward the parties will usually take contrary positions on the price movements of a property index.
Uses of Property Derivatives
Property Derivatives provide the investor with the ability to;

25
• Gain or reduce exposure to the property market.
• Hedge a current position in the physical assets.
• Quickly change the composition of a portfolio, i.e. switch out of Retail property and into Industrial.
• To speculate on the property market
All of these objectives can be achieved without having to transact in physical property
Commodity Derivatives Futures contracts in pepper, turmeric, gur, hessian, jute sacking, castor seed, potato, coffee, cotton, and soybean and its derivatives are traded in 18commodity exchanges located in various parts of the country. Futures trading in other Edible oils, oilseeds and oil cakes have been permitted. Trading in futures in the new commodities, especially in edible oils, is expected to commence in the near future. The sugar industry is exploring the merits of trading sugar futures contracts. The policy initiatives and the modernisation programme include extensive training, Structuring a reliable clearinghouse, establishment of a system of warehouse receipts, and the thrust towards the establishment of a national commodity exchange. The Government Of India has constituted a committee to explore and evaluate issues pertinent to the establishment and funding of the proposed national commodity exchange for the nationwide trading of commodity futures contracts, and the other institutions and institutional processes such as warehousing and clearinghouses. With commodity futures, delivery is best effected using warehouse receipts (which are likedematerialised securities). Warehousing functions have enabled viable exchanges to augment their strengths in contract design and trading. The viability of the national commodity exchange is predicated on the reliability of the warehousing functions. The programme for establishing a system of warehouse receipts is in progress. The Coffee Futures Exchange India (COFEI) has operated a system of warehouse receipts since 1998.

26
USES OF DERIVATIVES 1. INSURANCE 2. HEDGING 3. SPECULATION 4. ARBITRAGE
Insurance and Hedging
One use of derivatives is as a tool to transfer risk by taking the opposite position in the futures market against the underlying commodity. For example, a farmer can sell futures contracts on a crop to a speculator before the harvest. By taking a position in the futures market, the farmer hopes to minimize his or her price risk
Speculation and arbitrage
Speculators may trade with other speculators as well as with hedgers. In most financial derivatives markets, the value of speculative trading is far higher than the value of true hedge trading. As well as outright speculation, derivatives traders may also look for arbitrage opportunities between different derivatives on identical or closely related underlying securities.
Other uses of derivatives are to gain an economic exposure to an underlying security in situations where direct ownership of the underlying security is too costly or is prohibited by legal or regulatory restrictions, or to create a synthetic short position. In addition to directional

27
plays (i.e. simply betting on the direction of the underlying security), speculators can use derivatives to place bets on the volatility of the underlying security. This technique is commonly used when speculating with traded options. Speculative trading in derivatives gained a great deal of notoriety in 1995 when Nick Leeson, a trader at Barings Bank, made poor and unauthorized investments in index futures. Through a combination of poor judgment on his part, lack of oversight by management, a naive regulatory environment and unfortunate outside events like the Kobe earthquake, Leeson incurred a $1.3 billion loss that bankrupted the centuries-old financial institution.
History of derivatives
The history of derivatives is surprisingly longer than what most people think. Some texts even find the existence of the characteristics of derivative contracts in incidents of Mahabharata. Traces of derivative contracts can even be found in incidents that date back to the ages before Jesus Christ.
However, the advent of modern day derivative contracts is attributed to the need for farmers to protect themselves from any decline in the price of their crops due to delayed monsoon, or overproduction.
The first 'futures' contracts can be traced to the Yodoya rice market in Osaka, Japan around 1650. These were evidently standardised contracts, which made them much like today's futures.
The Chicago Board of Trade (CBOT), the largest derivative exchange in the world, was established in 1848 where forward contracts on various commodities were standardised around 1865. From then on, futures contracts have remained more or less in the same form, as we know them today.
Derivatives have had a long presence in India. The commodity derivative market has been functioning in India since the nineteenth century with organized trading in cotton through the establishment of Cotton Trade Association in 1875. Since then contracts on various other commodities have been introduced as well.
Exchange traded financial derivatives were introduced in India in June 2000 at the two major stock exchanges, NSE and BSE. There are various contracts currently traded on these exchanges.
National Commodity & Derivatives Exchange Limited (NCDEX) started its operations in December 2003, to provide a platform for commodities trading.

28
The derivatives market in India has grown exponentially, especially at NSE. Stock Futures are the most highly traded contracts on NSE accounting for around 55% of the total turnover of derivatives at NSE, as on April 13, 2005.
DERIVATIVES IN INDIA In India, all attempts are being made to introduce derivative instruments in the capital market. The National Stock Exchange has been planning to introduce index-based futures. A stiff net worth criteria of Rs.7 to 10 corers cover is proposed for members who wish to enroll for such trading. But, it has not yet received the necessary permission from the securities and Exchange Board of India. In the forex market, there are brighter chances of introducing derivatives on a large scale. Infact, the necessary groundwork for the introduction of derivatives in forex market was prepared by a high-level expert committee appointed by the RBI. It was headed by Mr. O.P. Sodhani. Committee’s report was already submitted to the Government in 1995. As it is, a few derivative products such as interest rate swaps, coupon swaps, currency swaps and fixed rate agreements are available on a limited scale. It is easier to introduce derivatives in forex market because most of these products are OTC products (Over-the-counter) and they are highly flexible. These are always between two parties and one among them is always a financial intermediary. However, there should be proper legislations for the effective implementation of derivative contracts. The utility of derivatives through Hedging can be derived, only when, there is transparency with honest dealings. The players in the derivative market should have a sound financial base for dealing in derivative transactions. What is more important for the success of derivatives is the prescription of proper capital adequacy norms, training of financial intermediaries and the provision of well-established indices. Brokers must also be trained in the intricacies of the derivative-transactions.

29
Now, derivatives have been introduced in the Indian Market in the form of index options and index futures. Index options and index futures are basically derivate tools based on stock index. They are really the risk management tools. Since derivates are permitted legally, one can use them to insulate his equity portfolio against the vagaries of the market. Every investor in the financial area is affected by index fluctuations. Hence, risk management using index derivatives is of far more importance than risk management using individual security options. Moreover, Portfolio risk is dominated by the market risk, regardless of the composition of the portfolio. Hence, investors would be more interested in using index-based derivative products rather than security based derivative products. There are no derivatives based on interest rates in India today. However, Indian users of hedging services are allowed to buy derivatives involving other currencies on foreign markets. India has a strong dollar- rupee forward market with contracts being traded for one to six month expiration. Daily trading volume on this forward market is around $500 million a day. Hence, derivatives available in India in foreign exchange area are also highly beneficial to the users.
RECENT DEVELOPMENTS At present Derivative Trading has been permitted by the SEBI on derivative segment of the BSE and the F&0 segment of the NSE. The natures of derivative contracts permitted are: Ø Index Futures contracts introduced in June, 2000, Ø Index options introduced in June, 2001, and Ø Stock options introduced in July 2001. The minimum contract size of a derivative contract is Rs.2 lakhs. Besides the minimum contract size, there is a stipulation for the lot size of a derivative contract. The lot size refers to number of underlying securities in one contract. The lot size of the underlying individual security should be in multiples of 100 and tractions, if any should be rounded of to next higher multiple of 100. This requirement along with the requirement of minimum contract size from the basis for arriving at the lot size of contract. Apart from the above, there are market wide limits also. The market wide limit for index products in NIL. For stock specific products it is of open positions. But, for option and futures the following wide limits have been fixed. Ø 30 times the average number of shares traded daily, during the previous calendar month in the cash segment of the exchange. Or Ø 10% of the number of shares held by non-promoters, i.e., 10% of the free float in terms of number of shares of a company.

30
Strategies of Derivatives
Bull Spreads
Meaning of Bull Spread
Simple option positions carry unlimited profits, limited losses for buyers and limited profits, unlimited losses for sellers (writers). Spreads create a limited profit, limited loss profile for users. By limiting losses, you are limiting your risks and by limiting profits, you are reducing your costs.
Those spreads which will generate gains in a bullish market are bull spreads.
Creation of Bull Spread
We can create a Bull Spread by using two Calls or two Puts. If you are using Calls, you should buy a Call with a lower strike price and sell another Call with a higher strike price.
Example:
Call Strike Price Premium Pay/Receive Satyam May – Buy 260 24 Pay Satyam May – Sell 300 5 Receive Net 19 Pay

31
When an individual can enter in bull spread.
We are bullish on Satyam which is currently quoted around Rs 260. We believe it will rise during the month of May. However, you do not foresee Satyam rising beyond Rs 300 in that period.
If we simply buy a call with a Strike Price of Rs 260, the premium of Rs 24 that you are paying is for unlimited possible gains which include the possibility of Satyam moving beyond Rs 300 also. However, if we believe that Satyam will not move beyond Rs 300, why should you pay a premium for this upward move?
we might therefore decide to sell a call with a Strike Price of Rs 300. By selling this call, you earn a premium of Rs 5. You are sacrificing any gains beyond Rs 300. The gain on the 260 strike call which you bought will be offset by the loss on the 300 strike call which you are now selling.
Thus, above Rs 300 we will not gain anything.
Overall payoff profile of bull spread
Your maximum loss is Rs 19 i.e. the net premium you paid while entering into the bull spread. Your maximum receivable from the position on a gross basis is Rs 40 i.e. the difference between the two strike prices. Thus, your maximum net profit is Rs 21 (Rs 40 minus Rs 19).
Various closing prices (on the expiry day) will result in various payoffs shown in the following table:
You can observe from the above table that your maximum loss of Rs 19 will arise if Satyam closes at Rs 260 or below (i.e. the lower strike price) and the maximum profit of Rs 21 will arise if Satyam closes at Rs 300 or above (i.e. the higher strike price).
The payoff graph of the above bull spread will appear like this:
Closing Price
Profit on 260 Strike Call (Gross)
Profit on 300 Strike Call (Gross)
Premium paid on Day One
Net Profit
250 0 0 19 -19 255 0 0 19 -19 260 0 0 19 -19 270 10 0 19 -9 279 19 0 19 0 290 30 0 19 11 300 40 0 19 21 310 50 -10 19 21

32
Bull spread using Put option
Interestingly, the Bull Spread logic remains the same. You buy a Put Option with a lower strike price and sell another one with a higher strike price. In this case however, the Put Option with the lower strike price will carry a higher premium than that with the higher strike price.
For example, if you buy a Reliance Put Option Strike 280 for Rs 24 and sell another Reliance Put Option Strike Rs 320 for Rs 47, this would be a Bull Spread using Puts.
On Day One, you will receive Rs 23 (Rs 47 minus Rs 24). Your maximum profit is this amount of Rs 23 which will be realized if Reliance closes above Rs 320 (your higher strike price). Your maximum loss will be Rs 17 and will arise if Reliance closes below Rs 280 (your lower strike price). In this case, you will be required to pay Rs 40 on closing out of the position. The payout of Rs 40 minus the Option Premium Earned of Rs 23 will result in a loss of Rs 17.
The payoff profile as well as the graph will look very similar in character and are provided below:
The graph of the position will appear as under:
Closing Price
Profit on 280 Strike Put (Gross)
Profit on 320 Strike Put (Gross)
Premium Recd on Day One
Net Profit
250 30 -70 23 -17 270 10 -50 23 -17 280 0 -40 23 -17 297 0 -23 23 0 320 0 0 23 23 330 0 0 23 23 340 0 0 23 23 350 0 0 23 23

33
Bull Spread can be created one scrip
There are a minimum of 5 strike prices available. On volatile scrip’s, the number of strike prices are around 7 on an average. There are 7 Calls and 7 Puts on each scrip. You can create several spreads. On Calls alone, you combine Strike 1 with Strike 2, Strike 1 with Strike 3 and so on.
The number of spreads no Calls will be 21 and a similar number on Puts. Thus, there are 42 spreads on one scrip in one month series alone.
Factors to be consider while looking at Bull Spread
The most important factor would be your opinion of the range of prices over which the scrip is expected to sell in the period of reckoning. If you believe that:
You are bullish
You expect Satyam to quote above Rs 260
You do not expect Satyam to move up beyond Rs 300
Then the best spread available to you is the 260-300 bull spread.
You also need to consider the liquidity of the two options being traded. It is possible that options far away from the current price may not be traded heavily and you might find it difficult to get two-way quotes on them. In that case, it would be preferable to reduce the spread difference and trade on more liquid options.
Difference between Bull Spreads created using Calls and Puts?
In terms of payoff profile, there is no difference. In terms of Premium, in the case of Call Options, you need to pay the difference in Premium on Day One and you will receive your profits on the square up day. Thus, the Call Spread is also called as a Debit Spread.
In the case of Put based Bull Spreads, you will receive a Premium on Day One and might be required to pay up later. These are called Credit Spreads.
It would appear likely that margins on Call based Bull Spreads will be far lower than that on Put based Bull Spreads as the possibility of losses in Call based Bull Spreads is negligible having paid the differential premium upfront. However, in case of Put based Bull Spreads, the loss is yet to be paid.

34
Bear Spread
The various bearish strategies possible
The following major choices are available:
• Sell Scrip Futures • Sell Index Futures • Buy Put Option • Sell Call Option • Bear Spreads • Combinations of Options and Futures
1. What happens if an individual sell Scrip or Inde x Futures
In the current Indian system, when you sell Scrip Futures, you are not required to deliver the underlying scrip. You will be required to deposit a certain margin with the exchange on sale of Scrip Futures. If the Scrip actually falls (as per your belief), you can buy back the Futures and make a profit. For example, Satyam Futures are quoting at Rs 250 and you sell them today as you are bearish. You could buy them back after 10 days at say Rs 230 (if they fall as per your expectations), generating a profit of Rs 20. Question of delivering Satyam does not arise in the present set up.
You will be required to place a margin with the exchange which could be around 25% (an illustrative percentage). If you accordingly place a margin of Rs 62.50, a return of Rs 20 in 10 days time works out to a wonderful 30% plus return.
Obviously, if Satyam Futures move up (instead of down) you face an unlimited risk of losses. You should therefore operate with a stop loss strategy and buy back Futures if they move in reverse gear.
You could adopt the same strategy with Index Futures if you are bearish on the market as a whole. Similar returns and risks are attached to this strategy.
2. How does a Put Option help in a bearish framewor k
The Put Option will rise in value as the scrip (or index) drops. If you buy a Put Option and the scrip falls (as you believe), you can sell it at a later date. The advantage of a Put Option (as against Futures) is that your losses are limited to the Premium you pay on purchase of the Put Option.
For example, a Satyam 260 Put may quote at Rs 21 when Satyam is quoting at Rs 264. If Satyam falls to Rs 244 in 8 days, the Put will move up to say Rs 31. You can make a profit of Rs 10 in the process.
No margins are applicable on you when you buy the Put. You need to pay the Premium in cash at the time of purchase.
3. When should one sell a Call?

35
If you are moderately bearish (or neutral or bearish), you can consider selling a Call. You will receive a Premium when you sell a Call. If the underlying Scrip (or Index) falls as you expect, the Call value will also fall at which point you should buy it back.
For example, if Satyam is quoting at Rs 264 and the Satyam 260 Call is quoting at Rs 18, you might well find that in 8 days when Satyam falls to Rs 244, the Call might be quoting at Rs 7. When you buy it back at Rs 7, you will make a profit of Rs 11.
However, if Satyam moves up instead of down, the Call will move up in value. You might be required to buy it back at a loss. You are exposed to an unlimited loss, but your profits are limited to the Premium you collect on sale of the Call. You will receive the Premium on the date of sale of the Option. You will however be required to keep a margin with the exchange. This margin can change on a day to day basis depending on various factors, predominantly the price of the scrip itself.
You should be very careful while selling a Call as you are exposed to unlimited losses.
4. How does one use Bear Spreads?
In a bear spread, you buy a Call with a high strike price and sell a Call with a lower strike price. For example, you could buy a Satyam 300 Call at say Rs 5 and sell a Satyam 260 Call at Rs 26. You will receive a Premium of Rs 26 and pay a Premium of Rs 5, thus earning a Net Premium of Rs 21.
If Satyam falls to Rs 260 or lower, you will keep the entire Premium of Rs 21. On the other hand if Satyam rises to Rs 300 (or above) you will have to pay Rs 40. After set off of the Income of Rs 21, your maximum loss will be Rs 19.
The pay off profile appears as under:
Satyam Closing Price
Profit on 260 Strike Call (Gross)
Profit on 300 Strike Call (Gross)
Premium Received on Day One
Net Profit
250 0 0 21 21 255 0 0 21 21 260 0 0 21 21 270 -10 0 21 11 281 -21 0 21 0 290 -30 0 21 -9 300 -40 0 21 -19 310 -50 10 21 -19

36
In in a bear spread, your profits and losses are both limited. Thus, you are safe from an unexpected rise in Satyam as compared to a clean Option sale.
5. How does one use combinations of Futures and Opt ions?
If you sell Futures in a bearish framework, you run the risk of unlimited losses in case the scrip (or index) rises. You can protect this unlimited loss position by buying a Call. This combination will result effectively in a payoff similar to that of buying a Put.
You can decide the strike price of the Call depending on your comfort level. For example, Satyam is quoting at Rs 264 currently and you are bearish. You sell Satyam Futures at say Rs 265. If Satyam moves up, you will make losses. However, you do not want unlimited loss. You could buy a Satyam 300 Call by paying a small Premium of Rs 5. This will arrest your maximum loss to Rs 35.
If Satyam moves up beyond the Rs 300 level, you will receive compensation from the Call which will offset your loss on Futures. For example, if Satyam moves to Rs 312, you will make a loss of Rs 37 on Futures (312 – 265) but make a profit of Rs 12 on the Call (312 – 300). For this comfort, you shell out a small Premium of Rs 5 which is a cost.
BUTTERFLIES …
.
Meaning of Butterfly?
If you are a seller, you are exposed to unlimited losses in both straddles and strangles. This profile may make you uncomfortable and you might like to reduce or limit your loss possibilities.

37
The butterfly strategy helps you to achieve this result. You would in this case, cut the wings of your straddle. To cut the wings, you would buy a Call with a higher strike price and buy another put with a lower strike price than that of the Straddle.
Example:
You have sold a Straddle on Satyam with Strike Price 240 and generated an Income of Rs 24 (as above). You could buy a 260 Strike Call for Rs 5 and buy a 220 Strike Put for Rs 6. This would cost you Rs 11, thus reducing your Net Income to Rs 13. It will however insure you from losses at both ends.
The final payoff table will emerge as under:
Satyam Closing Price
Profit on 240 Call Sold
Profit on 260 Call Bought
Profit on 220 Put Bought
Profit on 240 Put Sold
Net Profit Including Initial Income of Rs 13
200 0 0 20 -40 -7 210 0 0 10 -30 -7 220 0 0 0 -20 -7 230 0 0 0 -10 3 240 0 0 0 0 13 250 -10 0 0 0 3 260 -20 0 0 0 -7 270 -30 10 0 0 -7 280 -40 20 0 0 -7
Thus, you will generate a maximum profit of Rs 13 if Satyam remains at your Straddle Strike price of Rs 240. Your maximum loss is restricted to Rs 7 which happens when Satyam moves either below Rs 220 or above Rs 260. This loss is capped on both sides.
The payoff diagram for Butterfly appears as under:
Why should I use Butterfly as a Straddle Buyer? As a Straddle Buyer, you are paying a fat premium (e.g. in the above example Rs 24). This premium is paid for the gains that you might make for unlimited possible movement in the stock. Now you might expect that the stock might not move unlimited both ways. For example, you might believe that Satyam might rise but not above Rs 260 and might fall but not below Rs 220.
Why should you therefore pay for movement which in your opinion might never happen? You should in that case, sell a 260 Call and generate Rs 5 as premium income. Similarly you should sell a 220 Put and generate Rs 6 as premium income. This will have two impacts:
One – you gain Rs 11 as income, thus reducing your cost to Rs 13 (from Rs 24)
Two – you are giving up gains above Rs 260 and below Rs 220
Limitations of Butterfly
The main problems with these strategies which require you to enter into a number of transactions are as under:
• Several transactions result into high brokerage costs (to enter into a butterfly and then square up makes it 8 transactions);
• Liquidity might not be available at all strike prices;

38
All four transactions might take time to execute at your desired prices – if prices change in
A covered call is a process in which one owns shares of a stock or other securities, and then sells (or "writes") a corresponding amount of call options. Payoffs on the stock are always the same, as with a short put option, hence the price (or premium) should always remain the same, as with a short put or naked put.
Writing a covered call generates income, in the form of a premium; however, the risk of stock ownership is not eliminated. Therefore, potential loss is equivalent to subtraction of the total amount paid as premium. Also there is potential upside down through this strategy.
Examples
An investor has 500 shares of XYZ stock, valued at $10,000. He sells 5 calls for $1500, thus covering the decrease of same value in the XYZ stock, or we can say that only after the stock has declined by more than $1500 would the investor face net decrease on the total amount. Losses could not be prevented, but merely reduced in covered call position, even if the large amount is subtracted from the stock. This "protection" has its own disadvantage in which the investor is forced to sell his stock, if he has option like "called out" in which he buys below market price or he buys the calls back when the price of the calls rises strike price. Investors normally exercise these options before expiration date and then repurchase the stock and thus selling more calls at higher strike price and repeating same process again and again. If the stock price does not reach the strike price before expiration, the investor may simply repeat the process for the next month if he or she believes the stock will remain on a rising or neutral trend.

39
The investor might repeat the same process again next month if he/she believes that stock will either rise or be neutral, if before expiration stock price does not reach strike price.
call can be initiated sometimes even without ownership of underlying stock. If XYZ trades at 33 and July 35 call trades at $1, than either can purchase 100 shares of XYZ and only sell one call. For this only $3200 is required to purchase the stock rather than $3300. The premium received for the call covers the decline made by the first $100 ($1 per share) in stock price. Thus $32 stock price is break-even point of the transaction. If the results are high, then profit and lower result means loss. In the above case, the upside potential limits more than $300 ($100 for selling call and $200 for increase in share price) to 35, which amounts to almost 10% return. The investor might repurchase the stock because he cannot participate, as he is required to sell call to 35. So he sell calls at higher strike price.
Stock price at expiration Net profit/loss Comparison to simple stock purchase $30 (200) (300) $32 0 (100) $33 100 0 $35 300 200 $37 300 400
In finance, a strangle is an investment strategy involving the purchase or sale of particular option derivatives that allows the holder to profit based on how much the price of the

40
underlying security moves, with relatively minimal exposure to the direction of price movement. It is related to a similar option strategy known as a straddle.
Long strangle
The long strangle is a neutral-outlook options trading strategy that involve the simultaneous buying of a slightly out-of-the-money put and a slightly out-of-the-money call of the same underlying security and expiration date. It is an unlimited profit, limited risk strategy that is taken when the options trader thinks that the price of the underlying security will experience high volatility in the near term. The long strangle is a debit spread as a net debit is taken to enter the trade.
Short strangle
The short strangle is a neutral-outlook options trading strategy that involves the simultaneous selling of a slightly out-of-the-money put and a slightly out-of-the-money call of the same underlying security and expiration date. It is a limited profit, unlimited risk strategy that is taken when the options trader thinks that the underlying stock will experience little volatility in the near term. The short strangle is a credit spread as a net credit is taken to enter the trade.
Straddle is an investment strategy involving the purchase or sale of particular option derivatives that allows the holder to profit based on how much the price of the underlying security moves, regardless of the direction of price movement.
A Long straddle involves going long (i.e. buying) both a call option and a put option on some stock, interest rate, index or other underlying. The two options are typically bought at the same strike price and expire at the same time. The owner of a long straddle makes a profit if the underlying price moves a long way from the strike price, either above or below. Thus, an investor may take a long straddle position if he thinks the market is highly volatile, but does not know in which direction it is going to move.
For example, company XYZ is set to release its quarterly financial results in two weeks. A trader believes that the release of these results will cause a large movement in the price of XYZ's stock, but does not know whether the price will go up or down. He can enter into a long straddle, where he gets a profit no matter which way the price of XYZ stock moves, if the price changes enough either way. If the price goes up enough, he uses the call option and ignores the put option. If the price goes down, he uses the put option and ignores the call option. If the price does not change enough, he loses.

41
The Short straddle is a non-directional options trading strategy that involves simultaneously selling a put and a call of the same underlying security, strike price and expiration date. The profit is limited to the premiums of the put and call, but it is risky if the underlying security's price goes up or down much. The deal breaks even if the intrinsic value of the put or the call equals the sum of the premiums of the put and call. This strategy is called "unidirectional" because the short straddle profits when the underlying security changes little in price before the expiration of the straddle. The short straddle can also be classified as a credit spread because the sale of the short straddle results in a credit of the premiums of the put and call.
A short straddle position is highly risky, because the potential loss is unlimited, whereas profitability is limited to the premium gained by the initial sale of the options.

42
The short straddle is a non-directional options trading
A Collar is an investment strategy that uses options to limit the possible range of positive or negative returns on an investment in an underlying asset to a specific range. To do this, an investor simultaneously buys a put option and sells (writes) a call option on that asset. The strike price on the call needs to be above the strike price for the put, and the expiration dates should be the same.
After establishing the portfolio in this manner, the return on the portfolio will be between the strike price on the call (potential profit), and the strike price on the put (potential loss), meaning the possible gains and losses will always be within a preset limit.
Example
Say you own 100 shares of a stock with a current price of $5. Calls on the stock are traded with a strike price of $7 and puts are traded with a strike price of $3. You could construct a collar where you know that your gain on the stock will be no higher than $2 and your loss will be no worse than $2, by buying 1 put and selling 1 call.
There are three possible scenarios when the options expire:

43
• If the stock price is above the $7 strike price on the call you sold, the person who bought the call from you will exercise his call, and you will have to sell him your shares at $7. This would lock in a $2 profit for you. You only make a $2 profit, no matter how high the share price goes.
• If the stock price has dropped below the $3 strike price on the put you bought, you will exercise your put and the person who sold it to you is forced to buy your shares at $3. You lose $2 on your stock, but you can only lose $2, no matter how low the price of the stock goes.
• If the stock price is between the two strike prices at the expiration date, both options expire unexercised, and you are left with your shares of the stock.
RISKS IN DERIVATIVES TRADING
Various risk involved in Derivative trading
Investors and traders are required to sign up a Risk Disclosure Document before they begin trading in Derivatives. This document sets out the various risks involved in this trading. These are significant and investors can lose huge amounts within a short span of time in derivatives (much more than possible losses in the cash market given similar invested amounts).
Practical issue on a day day to basis

44
Risk is a very live issue as was demonstrated by the April 10th saga. On this day, we saw Infosys fall by 27% and Mastek fall by 49%. These kind of price falls are unanticipated and most investors in short positions have lost substantial amounts of money on this day.
Margins able to cover these situations? Is the inve stor not aware that his entire margin could be lost on a bad day?
Margins are designed to cover 99% of the possible losses on a single day. Technically, margins are based on a statistically calculated level of possible losses based on historical stock price movements. However, once in 100 days a disaster is technically possible where price movements can go beyond the limits set up the statistical model.
When this happens, the statistical model limits get violated. As a result, investors can lose more than their margins, brokers can lose if investors do not pay up the incremental margins and exchanges and the entire settlement system can be at risk if many brokers fail to pay up.
Margins become insufficient. Can the exchanges not foresee the maximum possible losses?
Margins are calculated in the following fashion (a simplified explanation for ease of clarity):
1. Take the daily closing prices 2. Work out the daily change in prices (termed as daily return) 3. Express this daily change in percentage 4. Work out the standard deviation of this daily change 5. Apply a factor of 3.5 to this standard deviation
A period of one year is considered for these calculations, but a weightage factor is applied in the sense that recent data is given more weightage and earlier data is given lesser importance.
The essence is that the volatility of the past one year is the basis for assuming future volatility. Now in the past one year (and more particularly in the recent past), if the volatility has been at a level of say 3% per day, then the margin would be taken at 10.5% (on the basis of 3% x 3.5 times). Thus, if Infosys were trading at say Rs 4,100 a margin of 10.5% would have been collected on Infosys Futures.
Now the statistical model expects that the daily movement in Infosys would be within the range of 10.5% of the current price of Rs 4,100 (i.e. Rs 430 approx) on the next trading day. Accordingly, a margin of Rs 430 would be collected from investors (both buyers and sellers of Futures).
If Infosys moves more than Rs 430 (up or down) on the next day, the margin will be insufficient. The investor will find that the broker is calling him up the next day and asking for more margins. Brokers will find that investors need to pay up far more and they are (typically) not in a position to pay enormous amounts overnight and exchanges might find that brokers are unable to pay enormous amounts overnight either.
Thus, the entire system can be at risk in case of huge movements in stock prices.
The current system (Value at Risk Margining as it is termed) is the internationally followed practice inspite of whatever limitations it may have. At the systemic level, it is dangerous to follow this practice especially if some players have relatively large market share (which is quite possible in the Indian markets). If some large players suffer losses, the entire settlement system is at risk. Internationally, there are several players and the system is not so concentrated as it is in India and hence risk levels are much lower.
There no circuit filters which can stop stocks from moving so much within a day

45
Circuit filters are not applicable to stocks which are traded in the Futures & Options segment and to those stocks which are part of the Sensex thirty or the Nifty fifty. Hence, any level of movement is possible on these stocks.
There is instead, a market wide filter. If the entire market (meaning the Sensex or Nifty) moves up 10% or more within a day, the entire market will be closed for specified period (say half an hour or more).
On the 10th of April, the Sensex and Nifty did not move to this level (movements were less than 5%) and hence this filter did not apply.
Lesson for a retail investor
If you invest in Futures (buy or sell) or you sell Options, you need to be very careful. You should be mentally prepared to lose the entire margin that you paid to the broker. Further, once in a while (rarely), you might be called upon to pay double that margin amount and hence you should be mentally prepared for such losses.
If you buy Options (calls or puts), the losses are limited to the amount of premium you invested.
If you had sold Put Options on Infosys, you could have typically earned Rs 130 on an At the Money Put before April 10, and it could have gone up all the way to Rs 1,100 on that day. Thus, you could have lost nearly 700% or more of your Option Premium Income on a single day. The story on Mastek would have been worse.
Ways to protect positions in different manner
Yes you can. Some examples can be discussed. If you buy Futures, you face a downside risk. To cut off this downside risk, you could buy Puts. For example, you could buy Satyam Futures (assuming you are bullish). But if you go wrong, to cover you possible losses you could buy a Satyam Put. Depending on how much losses you can bear, you could buy an Out of the Money Put.
If you sell Futures, you face an upside risk. You can hedge this risk if you buy Calls. This combination will eliminate this upside risk.
If you sell an At the Money Call, you could buy another Out of the Money Call and limit your losses. If you sell an At the Money Put, you could buy another Out of the Money Put and limit your losses.
Hedging on a regular basis.
A hedged strategy is certainly advisable because of the huge potential for losses. As a retail investor, you should be prepared to compromise your profits a bit in return for some protection.
FIIs and Derivatives
FIIs allowed to invest in derivatives

46
Yes, FIIs are allowed to invest in equity derivatives as per SEBI guidelines. SEBI had issued a circular on 12th Feb 2002 wherein the regulations in this regard have been specified.
Initial RBI approval RBI had vide circular EC.CO.FII/ /11.01.01(16)/2000-01 dated August 7, 2000 permitted FIIs to trade in exchange traded index futures contracts on the Derivative Segment of BSE and the F & O Segment of NSE provided the overall open interest of the FII would not exceed 100% of market value of the concerned FII's total investment
Further SEBI Guidelines
The SEBI Board vide meeting dated December 28, 2001 has permitted FIIs to trade in all exchange traded derivative contracts and laid down the position limits for the trading of FIIs and their sub-accounts. RBI vide circular ECO.CO.FII/515/11.01.01/(16) 2000-01 dated February 4, 2002 permitted FIIs to trade in all the exchange traded derivative contracts subject to the position limits prescribed hereunder. The FIIs shall be under obligation to adhere to the position limits prescribed for them and their sub-accounts. The FIIs shall also comply with the procedure for trading, settlement and reporting as prescribed by the derivative exchange / Clearing House / Clearing Corporation from time to time.
Position Limits
The position limits for FII and their sub-accounts shall be as under:
I POSITION LIMITS
At the level of the FII
• In the case of index related derivative products there shall be a position limit at the level of FII at 15% of the open interest of all derivative contracts on a particular underlying index or Rs. 100 crores whichever is higher, per exchange.
• The FII position limit in derivative contracts on a particular underlying stock would be at 7.5% of the open interest of all derivative contracts on a particular underlying stock or Rs. 50 crores whichever is higher, at an exchange.
At the level of the sub-account
• Each Sub-account of a FII would have the following position limits:
• A disclosure requirement for any person or persons acting in concert who together own 15% or more of the open interest of all derivative contracts on a particular underlying index.
• The gross open position across all derivative contracts on a particular underlying stock of a sub-account of a FII should not exceed the higher of:
o 1% of the free float market capitalization (in terms of number of shares).
or
o 5% of the open interest in the derivative contracts on a particular underlying stock (in terms of number of contracts).
This position limits would be applicable on the combined position in all derivative contracts on an underlying stock at an exchange.

47
The Derivative Segment of the Exchanges and their Clearing House / Clearing Corporation would monitor the FII position limits at the end of each trading day. For this purpose, the Derivative Segment of the Exchanges and their Clearing House / Clearing Corporation would implement the following procedure for the monitoring of the FII and the sub-account's position limits:
1. The FII would be required to notify the names of the Clearing Member/s and Custodian through whom it would clear its derivative trades to exchanges and their Clearing House / Clearing Corporation.
2. A unique code would be assigned by the exchanges and / or the Clearing House / Clearing Corporation to each registered FII intending to trade in derivative contracts.
3. The FII would be required to confirm all its positions and the positions of all its sub-accounts to the designated Clearing Members online but before the end of each trading day.
4. The designated Clearing Member/s would at the end of each trading day would submit the details of all the confirmed FII trades to the derivative Segment of the exchange and their Clearing House / Clearing Corporation.
5. The exchanges and their Clearing House / Clearing Corporation would then compute the total FII trading exposure and would monitor the position limits at the end of each trading day. The cumulative FII position may be disclosed to the market on a T + 1 basis, before the commencement of trading on the next day.
6. In the event of an FII breaching the position limits on any derivative contract on an underlying, the FII would not be permitted by the exchanges and their Clearing House / Clearing Corporation / Clearing Member/s to take any fresh positions in any derivative contracts in that underlying. However, they would be permitted to execute off-setting transactions so as to reduce their open position.
7. The FIIs while trading for each sub-account would also assign a unique client code with a prefix or suffix of the code assigned by the exchange and their Clearing House / Clearing Corporation to the FII. The FII would be required to enter the unique sub-account code before executing a trade on behalf of the sub-account.
8. The sub-account position limits would be monitored by the FII itself, on the same lines as the trading member monitors the position limits of its client / customer. The FIIs would report any breach on position limits by the sub-account, to the derivative segment of the exchange and their Clearing House / Clearing Corporation and the FII / Custodian / Clearing Member/s would ensure that the sub-account does not take any fresh positions in any derivative contracts in that underlying. However the sub-account would be permitted to execute off-setting transactions so as to reduce its open position
9. The exchanges may assign unique sub-account codes on the lines of unique client codes to each sub-account of a FII, which would enable the derivative segment of the exchange and their Clearing House / Clearing Corporation to monitor the position limits specified for sub-accounts.
II COMPUTATION OF THE POSITION LIMITS
The position limits would be computed on a gross basis at the level of a FII and on a net basis at the level of sub-accounts and proprietary positions. The open position for all derivative contracts would be valued as the open interest multiplied with the closing price of the respective underlying in the cash market.
FIIs been inactive participants since Feb 2002
FIIs were inactive during the whole of 2002 and for the first 5 months of 2003 also. The equity markets were during this phase passing through a dull phase. Once the markets started moving up smartly, FII action has emerged in the derivatives markets along with an increasing exposure in the cash market itself.
The current position of FIIs as of 20th October 2003 is as under:

48
Details Buy
Sell Open Interest at the end of the day
No. of Contracts
Value
(Rs in crs)
No. of Contracts
Value
(Rs in crs)
No. of Contracts
Value
(Rs in crs)
Index Futures 469 14.54 783 24.35 12590 388.25 Index Options 0 0.00 72 1.94 1953 60.26 Stock Futures 689 34.99 1924 68.73 69772 2623.48 Stock Options 5 0.10 5 0.19 693 25.
Source: www.sebi.gov.in
Open Interest positions of FIIs constitute 10 – 15% of the total market open interest positions these days. On 21st October 2003, FII Open Interest constituted 15.71% of the total market open interest position (source www.nseindia.com).
Reason for interest in Derivatives
Derivative volumes and consequential liquidity is interesting these days. Derivative volumes touch upwards of Rs 10,000 crores per day, which is higher than the cash market volumes of both exchanges NSE and BSE put together. Hence, entry and exit is easy for FIIs. Further, advantages of derivatives as available to individual investors is any way available to FIIs also, mainly the advantage of leverage.
The strength of the rupee is a great attraction for investing in Indian markets, directly in the cash segment as well as through the derivative segment.
An arbitrage play by FIIs
Yes, it does appear that FIIs are active players in cash and carry arbitrage.
Methodology for it.
FIIs will buy securities in the cash market and at the same time sell corresponding futures in the derivatives market. In bullish times, stock futures trade at a decent premium to the cash market. If the premium is 10% plus on an annualized basis, that is very interesting arbitrage to the FII community who do not find such rich pastures abroad. The strength of the rupee might in some cases further add to dollar earnings, but even if the rupee remains stable, the 10% return itself is very interesting to the FII community who might be able to typically borrow at 4% or downwards.
This has increased FII interest in derivatives to a great degree. No clear statistics are available as to how much of futures positions are covered by underlying stocks. As you can see, open positions in stock futures constitute more than 85% of the total open positions of FIIs in the derivatives segment. This data seems to suggest a preponderance of arbitrage transactions.

49
FIIs continue their participation in the derivative s segment in future
So long as futures are quoted at reasonable premiums over cash market prices and FIIs see opportunities to earn upwards of 8% annualized, one can foresee a fairly healthy participation from their side. However, it is important to understand that futures differentials have not been always attractive if we look at the past 2 years of futures history. Till around May this year, futures were quoting at nominal differentials of 3-4% and in some cases, at a discount. If this scenario were to come back (once this bullishness subsides), then the arbitrage opportunity would also disappear or at least decrease. In such a situation, one would see FIIs reducing their derivatives exposures.
High level of arbitrage operation good and bad for market
High levels of arbitrage operations have their good and bad effects. Arbitrage will keep prices in check and bring discipline to futures markets. If futures were to move up sharply, they would be reined in by arbitrageurs so as to maintain a meaningful relationship vis-à-vis cash markets.
However, the downside could be in bear markets or stable markets. Once the differentials narrow down to uninteresting levels, the arbitrageurs would unwind their positions. Unwinding would imply that their long cash positions would not be sold. If a big selling wave emerges as a consequence of winding down (and as at last count, the values of such stocks could be of the order of Rs 2,600 crores), then these stocks would move down. Most of these stocks are likely to be majors with a significant role in the index and hence the market as a whole could be affected.
One therefore should be careful of hot money flowing into temporary arbitrage positions and disturbing the markets on exit.
FIIs working on a better turf than their Indian bro thers in this arbitrage
Yes, the FIIs have access to cheaper funds and their cost could be 4% or even lower per annum. The Indian arbitrageur’s inspite of the declining interest scenario in India over the last few years would not be able to find funds at such low rates of interest. Thus, an 8% cash and carry differential might be interesting and rewarding to an FII which the same differential might be unexciting to an Indian. I think to this extent, FII arbitrage operations will override their Indian counterparts in terms of volumes. This will lead to lesser opportunities for Indians because FIIs would snap up opportunities at 8% levels itself, leaving no scope for higher differentials which the Indians would be waiting for.
In a sense therefore, there is an uneven playing field in arbit operations, which might be beyond our control.

50
TECHNICAL ANALYSIS AND DERIVATIVES TRADING
In making decisions about where and when to take a position, investors, traders and analysts use two different approaches: fundamental analysis and technical analysis. Fundamental analysis is the appreciation of the economics underlying a particular trade. If you want to know where to invest and why, you use the techniques of fundamental analysis. Technical analysis is concerned with the when and the how of placing money. It determines the optimal timing for a position and its conclusions about how long to stay in a particular trade have significant importance for the kind of derivatives structure one may use to take a position.
For a foreign exchange trader, fundamental analysis is focused on the macroeconomics of the particular currencies involved, including the implications of the current account, the GDP growth rate, domestic consumption, domestic production and other political factors that influence the currency's relative value. As we move into more company-specific investments such as individual equities, fundamental analysis becomes more preoccupied with microeconomic questions related to the firm. Such an investigation might look at price/earnings ratios, debt/equity ratios, cash flow forecasts and similar data from financial statements, press releases and competitors.
Technical analysis is an art in which quasi-statistical techniques and formal statistics are used to determine the existence and strength of trends in financial time series and to identify turning points in these trends. If you can do this with a reasonable degree of accuracy, then you can improve your chances of making a profitable trade. Technical analysis is important in the structuring of derivative products because of the leverage involved and because of the inclusion of such features as barriers and compound strikes. Timing is everything.
EXAMPLES OF TECHNICAL ANALYSIS
There are two kinds of technical analysis.
First, there is the design and use of "indicators", changes in which present implications about the existence, strength or change in the trend of the financial time series in question. An indicator is a function of the time series and some parameters that the analyst chooses.
Second, there is the use of more primitive hands-on techniques such as the drawing of "support" and "resistance" lines on a chart, the violation of which is deemed to be a significant technical event. In its more complex manifestations, "patterns" are interpolated from market behavior with conclusions for future price evolution based upon the historical consequences of such patterns.

51
There is a growing voice in technical analysis that argues against this second school of thought. The argument against interpolating lines and patterns comes from a basic assumption about the psychology of money. In order for technical
analysis to be successful in forecasting future price movements, the analysis must be objective. Otherwise, the analyst will see what he wants to see. I myself have seen traders, especially ones with large positions that have started to lose money, fool themselves into thinking that they can justify their current positions with some lines on a chart. Hope is the principal obstacle to profitable trading.
Presume then that derivative traders who use technical analysis stick firmly to the first school, the use of indicators.
Advances in computer technology make it easy to automate this analysis by programming what are called expert rules. This obviates the problem of seeing what one wants to see quite clearly. And it allows the analyst to customize the indicator to time series in question in order to get the most optimal results.
For example, a momentum indicator is a simple formula involving the most recent price and some historical price that gauges the speed of the move in the financial time series.
A moving average is simply an average over the last few periods for the time series. Construct two moving averages with different periods and you have a trading signal when they cross. When the moving average with the longer indicator crosses the moving average with the shorter indicator, you have a good indicator of a trend in place.
By using contemporary software such as Omega Research's (see http://www.omegaresearch.com) Super Charts, the analyst can choose the two periods for the two moving averages that produce the optimal results. This will vary between different time series because every time series has its own peculiar quirks. The Canadian Dollar against the US dollar moves much more differently than the Japanese Yen against the US dollar. Reasonably, we would expect them to have different parameters for our moving average crossover trading signal.
Another indicator might track the "Stochastic". This is another crossover indicator that is more suitable for a non-trending market.
Indicators are typically suited for a particular kind of market, usually delineated by whether or not the market is trending.
There are many good resources for Technical Analysis, including books by John Murphy. Check out the Financial Pipeline bookstore.
TECHNICAL ANALYSIS AND DERIVATIVES IN PRACTICE

52
In practice, there are quite a few indicators that we can look at and that
we can automate to produce trading signals when the rules we specify are triggered. For example, we could design an Expert System that produces a trading signal every time our Moving Average Crossover system indicates that the two moving averages intersect.
The more indicators we have the better our picture will be. Some indicators are more suited for trending markets while other indicators are oriented towards consolidating markets.
If we can have a set of indicators that produce a consistent trading signal, then we have reduced the probability of being wrong about the trade.
If we have five automated trending signals, all of which indicate that our stock is in an upward trend that is a pretty interesting result.
It is even more interesting if the technical analysis confirms the picture our fundamental analysis paints. If the fundamental analysis suggests that this company is seriously undervalued, we would feel even more comfortable buying it.
If the technical indicators about the speed of the trend suggest an explosive move, we could use a structure with a highly leveraged payout for an explosive move to the upside. For example, we could use a very low delta call (i.e. a highly out-of-the-money call) on the stock if we thought its price would explode to the upside out of a well-defined range. Not only would we make money on the direction of the spot and the convexity of the spot movement but we would also make money from the rise in implied volatilities.
Or, we could attach a barrier on the downside to our out-of-the-money call if we were confident that spot would not move below a certain level before going higher. This would make the option cheaper and increase the leverage in the structure.
Or, we could attach a binary to the option enabling us to get the out-of-the-money option for free as long as spot did not close below the binary level at maturity.
One can see very quickly how flexible derivative products enable our investing approach to be.
The corollary to this argument is that it is dangerous to put on such derivatives structures without some combination of technical and fundamental analysis. Derivatives have the potential for tremendous gains but they require much more homework because of the leverage of the structures, the possibly reduced liquidity and the larger bid/offer spreads involved in transacting them.
Technical analysis and fundamental analysis are tools that the analyst and the trader can use to reduce the uncertainty involved in taking a position. The skilled trader will use these techniques to wait for the right opportunity and to structure the most profitable derivative strategy to take advantage of it.

53
DERIVATIVES SYSTEMS
A critical but often overlooked aspect of a competent derivatives trading operation are the computer systems used to manage the risk, account for the positions on a mark-to-market basis, track derivatives-related events (such as expiries and rollovers) and measure Value-at-Risk. Once you have read some of the articles in the Derivatives section of the Financial Pipeline, you will realize how quickly a portfolio of transactions can become complicated. In the section on hedging swaps, we discussed some of these complications including the problems associated with mismatched short term cash flows and maturity bucket grouping. Options produce their own problems because of the convexity of these products. Taking snapshots of delta, gamma and vega at an instantaneous specification of prices is insufficient (although necessary) for competent financial risk management.
One must also have an appreciation of how these risks change with the progress of time and the evolution of prices. In the first edition of Risk Professional magazine published by the Global Association of Risk Professionals (see http://www.garp.com), Geoff Kates establishes a framework for evaluating a financial risk management system and he uses this framework to assess some of the more common off-the-shelf products on the market. This article will discuss those criteria and it will explain the importance.
Integration
At the beginning of the global derivatives market's development, almost every bank pursued derivatives in a stand-alone asset-class-by-asset-class fashion. That is to say, one group managed interest rate derivatives, another group managed equity derivatives and a third group managed foreign exchange derivatives. For many banks, this is still the case.
However, an increasing number of financial institutions are turning to a more integrated approach, stripping the derivatives desks from each asset class' cash group and combining them into a more efficient cross-marketing machine. Once you understand interest rate derivatives, it

54
is straightforward to understand equity derivatives or foreign exchange derivatives. Conversely, it is not necessarily the case that a manager who has spent his entire career overseeing spot
foreign exchange salespeople will be able to understand the way in which a derivatives book works. It is not something you're likely to learn from a book or a classroom. You have to have experience.
To buy or to build
The next question the bank's senior management must ask itself is whether or not the bank should buy an off-the-shelf system or build one using its own internal IT resources.
Buying a system is convenient, particularly if it is one that is in widespread use. Popular systems have been tested and have had all of the kinks worked out. The more
popular the system, the less likely that it is vulnerable to internal control irregularities. That is, the more popular the system, the less likely it is possible for individuals to manipulate the bank's official records for fraudulent purposes. Systems are typically very expensive, with charges for both a site license and individual annual user permits. Many of the companies that sell these systems make it easy for the user to customize reports, batch files, pricing modules, etc.
However, many financial institutions are reticent to relinquish the responsibility for risk management computer systems to a third party. The managers of these institutions would prefer to have their own internal risk management personnel design the system that is then implemented by the bank's IT staff. Not only is this more expensive than buying an off-the-shelf system in terms of up-front dollar cost and delays in implementation but the system is vulnerable to the expertise of a handful of individuals. Let's say you are the head of trading at ABC Bank and you commission your risk management department, all of three people (Larry, Curly and Moe) to design and implement your interest rate risk management system. If Larry, Curly and Moe leave to go as a team to DEF Bank, you will have lost all of your core knowledge base and you will have to start from scratch. There is also the possibility that Larry, Curly or Moe designed secret entrances into the system for themselves so that they could manipulate tickets and positions and profit and loss statements.
Speed
In order to be effective, risk management information must be at least as fast as the markets to which it refers. On the face of it, for most people using applications designed for home use, this is not problematic. However, for financial institutions with portfolios consisting of thousands of different instruments, some of which use very complicated formulae, and arrays of parameters to revalue, this is a serious database design problem.
Interface

55
One of the key aspects of a well-designed system is its flexibility. A good risk management system will have a user interface that is customizable. Many of them are beginning to use the Internet as their interface platform. The interface is also the mechanism in which reports are designed. For an example of the kinds of reports dealers and risk managers require, see our earlier article entitled "How Do Options Traders Look At Their Portfolios".
Asset Class Coverage
Further to our discussion of the integration of asset classes in the management of derivatives sales and trading operations at leading financial institutions, a good risk management system will provide the senior management with the ability to immediately access information on all of the derivatives activities in which the financial institution is engaged, across all asset classes.
It is not uncommon for banks to have systems in place that enable their management to take a snapshot of the firm's financial price risk with the simple click of a button at any point during the trading day, in real-time.
Covering all of the asset classes also allows for greater overall risk-taking because it allows for the portfolio effects of diversification of risk across the different asset classes.
Pricing Model Flexibility
Model risk refers to the problems associated with discrepancies between the theoretical pricing of a financial instrument and the way in which it actually trades in the market. The difference in price, for a given set of input parameters, is a result of the assumptions that are necessary for solution of the mathematical model of the price of the financial product in question.
For some financial products, particularly the more exotic or novel ones, the choice of pricing model is a controversial one. A good risk management system will allow management to pick and choose the pricing model it prefers for a particular instrument and it will also allow management to compare the model risk in different market environments associated with individual pricing models.
Ability to Link to Other Systems
The derivatives risk management system is only one of a handful of systems with which the dealer at a financial institution must be familiar. Other systems include ticketing systems for cash instruments, accounting systems, credit risk management systems and, possibly, spreadsheets tracking customer portfolios.
A dealer's life is made much easier when the primary system he uses on a daily basis, the risk management system, can communicate its information to the other relevant systems automatically. Otherwise, the dealer (or more likely his assistant) will have to input multiple tickets for a single transaction. This is not just a question of personal effort. It is an operational risk issue, as well. Every time the dealer inputs a ticket, there is room for an error. Too many errors and the bank begins to lose customers as well as money.
The key point here is that technological sophistication leads to better management.

56
These are just some of the criteria that a financial institution risk manager may choose to apply to the selection of a financial risk management computer system. In the next wave of development, risk management platforms will be entirely web-based. Already, Goldman Sachs and other leading American investment banks are offering web-based risk management systems, including pricing models, to their clients. Helping their clients understand the financial price risk they face makes it easier for the client to understand the efficacy of financial products (products which they hopefully transact with Goldman Sachs).
COMBINING DERIVATIVE PRODUCTS
Financial engineering is a term that refers to the development of pricing methodologies and hedging techniques underlying financial derivative products. Black, Scholes and Merton were the first financial engineers in that they modeled mathematically the pricing of a plain vanilla option, something that has been around for hundreds of years. We have seen in a previous article that in developing the mathematics behind the option price, they suggested the way to hedge the risk. Their construct of the "delta" lies at the heart of the most basic hedging strategy.
One aspect of financial engineering that leverages the power of derivative products in a simple, elegant fashion is the combination of existing derivative products. Let's consider a few of these different combination products that can contain vanilla products, exotic products, products from different asset classes or just about any other pairing that one can imagine. In all of the following examples, I will use foreign exchange as the asset class for the sake of simplicity. It is just as easy to extend this to equities or fixed income or commodities. The actual strikes involved are contrived in order to demonstrate the behavioral characteristics of the products in question.
The Straddle
Let's consider the case where spot USD/JPY (i.e. the number of Japanese Yen per 1 US dollar) is at 115. The month is February. From our analysis, we have come to believe that spot USD/JPY is ready for a breakout in the month of April, following the Japanese fiscal year-end.

57
Or, at least, spot USD/JPY could be in for some real volatility. This is predicated on the view that Japanese corporations and investors, having placed money offshore to take advantage of better investment opportunities abroad, will repatriate these funds for fiscal year-end only to send them offshore again after closing the books. We also know that the US trade representative is conducting a review of improvements to Japanese trading practices and that she will present this report to Congress in early March. This report is likely to highlight tensions relating to the burgeoning US trade imbalance with Japan (and the rest of the world). The US government may seek to "jawbone" the dollar lower in order to improve the US terms-of-trade.
Spot USD/JPY could follow a roller-coaster over the next few months. Going much lower before going much higher. If we buy an at-the-money-spot 115 USD Call/Japanese Yen Put and we simultaneously buy an at-the-money-spot 115 USD Put/Japanese Yen Call on the same notional amount of $10 million US dollars and for the same expiry date of May 1, we have purchased a straddle on the USD/JPY. If spot is volatile with the volatility centered around the strike of 115, we stand to make a great deal of money by trading the delta (not to mention the increases in value from hikes in implied volatility) of this combination of options.
The Strangle
Instead of purchasing options with the same expiry date, notional amount and strike, we could have varied the strategy by buying two out-of-the-money options. For example, we could have purchased simultaneously a May 1 130 USD Call/JPY Put and a May 1 100 USD Put/JPY Call. Compared to the straddle, this strategy is cheaper, although we have to be careful when we are hedging the delta around the expiry that we are not left with a cash position that is unlikely to make money. For example, let us suppose that at expiry, spot is at 122 and from our delta hedging activities we are short US dollars against Japanese Yen. We must be sure to close out this position as soon as the options are expired if we do not have a firm view that the US dollar will weaken. Too often, traders will not be disciplined in managing positions that are created by their delta-hedging activities.
The Risk Reversal
Consider now the corporation that is hedging their exposure to a move higher in the US dollar against the Euro. Spot EUR/USD (i.e. the number of US dollars per 1 unit of the Euro) is quoted at $1.1335. They have a firm commitment to buy a factory in Germany in three months' time that will cost them Euro 10 Million. They are exposed to fluctuations in the EUR/USD exchange rate because they are a US-based company reporting their profits in US dollars.
The first hedge that comes to mind (and the one often chosen to benchmark risk management performance) is the forward outright. They could buy Euros against US dollars for delivery on

58
the same date that they need to make the payment from their account for a rate of $1.1294. However, they think that there is a possibility that the European Central Bank will not lower interest rates for at least six months, contrary to market expectations, and so the Euro could drift higher against the US dollar (i.e. EUR/USD could trade slightly lower).
Therefore, they enter into a risk reversal. They buy an out-of-the-money Euro call/USD put (with a strike of $1.15 against selling an out-of-the-money Euro Put/USD Call with a strike of $1.11 for zero cost. How does this work at expiry? If spot settles above $1.15, the corporation will exercise their Euro call and buy Euros at $1.15. If spot settles below $1.11, they will be exercised on their Euro put and they will consequently buy Euros at $1.11. Anywhere in between $1.11 and $1.15 and neither option is exercised, with the corporation buying their Euros at the market rate in the spot market. This structure is sometimes called a range forward because it enables the corporation to lock in a range within which they know with certainty that they will be buying Euros while giving them the flexibility of gaining from a small movement in their favor in the currency pair.
Beware of Geeks Bearing Gifts
Banks have made a lot of money from this structure and others like it because they have encouraged corporations to enter into hedges with no obvious upfront cost. Many Treasurers believe that there is no reason to buy an option, that options are products that should only be sold. This has worked to the advantage of the banks because like every other market, there are times to buy options and there are times to sell options. When they need to buy options, corporate Treasurers are flooded with these so-called "zero cost" alternatives.
Other times, as we shall see, zero cost strategies have costs embedded in them that are not obviously transparent to the user. Some sophisticated market participants can discern the true cost nevertheless and still proceed, believing that these structures are appropriately priced. Of course, not everyone is a sophisticated market participant. And sophistication like any other valuable commodity comes with a price.
The Trigger Forward
Consider now a currency pair that is only going in one direction. Think of the New Zealand dollar against the US dollar during much of the Asian crisis. This was a "gimme" as far as most market observers were concerned, bar the odd correction. It was only going to go down. The economy was heavily dependent upon exporting commodities to mainly Asian countries. And the Minister of Finance was a man with no experience in monetary or fiscal affairs who had a known propensity for getting into the newspaper for all of the wrong reasons.

59
Again, the simplest strategy might have been to sell NZD/USD (i.e. the number of US dollars per 1 unit of the New Zealand dollar) on a forward outright basis. If spot NZD/USD was at 0.6400 and the forward outright was 0.6362 for six months' time, then that meant that holding the period for six months had a funding cost. If spot NZD/USD stayed at 0.6400, the trader would be out 0.0038 points on whatever actual amount they traded. Instead they could have done the following, taking advantage of nervously high NZD/USD implied volatilities. They could have bought a six month NZD put/USD call struck at 0.6510 which knocked out if 0.6510 traded before the option expired and simultaneously sold a six month plain vanilla NZD call/USD put struck at 0.6510. The combination of the two options would cost nothing at inception. The higher the implied volatilities involved the higher the strike would be in reference to spot because the trader here is net selling volatility.
If NZD/USD went straight down, without touching the knockout option's trigger at 0.6510, the structure would have made more money for zero cost at inception than he would have on the forward outright in consideration for taking the risk of being short a potentially dangerous option without protection. One can see that structures can be developed that not only address a given view but also a specific tolerance for risk.
The Range Binary
Finally, let us consider the range binary, a structure that pays out a lump-sum if spot stays within a specific range without trading at either level in exchange for the payment of a relatively small upfront premium. Let's say that we are looking at USD/CAD (i.e. the number of Canadian dollars per 1 unit of the US dollar). We believe that USD/CAD is stuck in a range between 1.50 and 1.55 for the next two months. How do we take advantage of this view? We could buy simultaneously a double barrier USD call/CAD put with a strike of 1.50 that knocks out at either 1.50 or 1.55 and a double barrier USD put/CAD call with a strike of 1.55 that knocks out at either 1.50 or 1.55. If spot stays in the range without triggering either 1.50 or 1.55, we will make 0.0500 on the notional amount of the options. The options themselves are relatively cheap because they are so likely to be knocked out. The higher the implied volatility, the more likely they are to get knocked out, the cheaper these structures.
Summary
We have looked at just some of the different types of combinations of derivatives that are possible. Indeed, the proliferation of derivative products means that the tailoring an exposure to a particular view and tolerance for risk is getting easier all the time.

60
DERIVATIVES CONCEPTS A-Z
This article presents a glossary of derivatives-related terminology that will make the other articles in the Financial Pipeline's Derivatives section easier to understand, hopefully. It is not an exhaustive list. It will be updated from time to time. One of the characteristics of new financial products is the proliferation of different terms used to describe the same instrument, as each financial institution tries to brand its product name onto the financial community's awareness.
A
Actual

61
Financial instruments that exist in one of the four main asset classes: interest rates, foreign exchange, equities or commodities. Typically, derivatives are used to hedge actual exposure or to take positions in actual markets.
All or Nothings
An option whose payout is fixed at the inception of the option contract and for which the payout is only made if the strike price is in-the-money at expiry. If the strike price is out-of-the-money at expiry, there is no payout made to the option holder.
American Style Option
An option that can be exercised at any time from inception as opposed to a European Style option which can only be exercised at expiry. Early exercise of American options may be warranted by arbitrage. European Style option contracts can be closed out early, mimicking the early exercise property of American style options in most cases.
Accreting Swap
An exchange of interest rate payments at regular intervals based upon pre-set indices and notional amounts in which the notional amounts decrease over time.
Arbitrage
The act of taking advantage of differences in price between markets. For example, if a stock is quoted on two different equity markets, there is the possibility of arbitrage if the quoted price (adjusted for institutional idiosyncrasies) in one market differs from the quoted price in the other. The term has been extended to refer to speculators who take positions on the correlation between two different types of instrument, assuming stability to the correlation patterns. Many funds have discovered that correlation is not as stable as it is assumed to be.
Asset-Liability Management
Closing out exposure to fluctuations in interest rates by matching the timing of cash flows associated with assets and liabilities. This is a technique commonly used by financial institutions and large corporations.
At-the-Market
A type of financial transaction in which the order to buy or sell is executed at the current prevailing market price.
At-the-Money Spot
An option whose strike price is equal to the current, prevailing price in the underlying cash spot market.

62
At-the-Money Forward
An option whose strike price is equal to the current, prevailing price in the underlying forward market.
Average Rate Options
An option whose payout at expiry is determined by the difference between its strike and a calculated average market rate where the period, frequency and source of observation for the calculation of the average market rate are specified at the inception of the contract. These options are cash settled, typically.
Average Strike Options
An option, whose payout at expiry is determined by the difference between the prevailing cash spot rate at expiry and its strike, deemed to be equal to a calculated average market rate where the period, frequency and source of observation for the calculation of the average market rate are specified at the inception of the contract. These options are cash settled, typically.
B
Backwardation
A term often used in commodities or futures markets to refer to markets where shorter-dated contracts trade at a higher price than longer-dated contracts. Plotting the prices of contracts against time, with time on the x-axis, shows the commodity price curve as sloping downwards as time increases.
Barrier Options
An option contract for which the maturity, strike price and underlying are specified at inception in addition to a trigger price. The trigger price determines whether or not the option actually exists. In the case of a knock-in option, the barrier option does not exist until the trigger is touched. For a knock-out option, the option exists until the trigger is touched.
Basis
The difference in price or yield between two different indices.
Benchmarking
A benchmark is a reference point. Benchmarking in financial risk management refers to the practice of comparing the performance of an individual instrument, a portfolio or an approach to risk management to a pre-determined alternative approach.

63
Black-Scholes
A closed-form solution (i.e. an equation) for valuing plain vanilla options developed by Fischer Black and Myron Scholes in 1973 for which they shared the Nobel Prize in Economics.
C
Call Option
A call option is a financial contract giving the owner the right but not the obligation to buy a pre-set amount of the underlying financial instrument at a pre-set price with a pre-set maturity date.
Cap
A cap is a financial contract giving the owner the right but not the obligation to borrow a pre-set amount of money at a pre-set interest rate with a pre-set maturity date.
Cash Settlement
Some derivatives contracts are settled at maturity (or before maturity at closeout) by an exchange of cash from the party who is out-of-the-money to the party who is in-the-money.
Chooser Option
An option that gives the buyer the right at the choice date (before the option's expiry) to choose if the option is to be a call or a put.
Collar
A combination of options in which the holder of the contract has bought one out-of-the money option call (or put) and sold one (or more) out-of-the-money puts (or calls). Doing this locks in the minimum and maximum rates that the collar owner will use to transact in the underlying at expiry.
Commodity Swap
A contract in which counterparties agree to exchange payments related to indices, at least one of which (and possibly both of which) is a commodity index.
Contango
A term often used in commodities or futures markets to refer to markets where shorter-dated contracts trade at a lower price than longer-dated contracts. Plotting the prices of contracts against time, with time on the x-axis, shows the commodity price curve as sloping upwards as time increases.
Convexity
64
A financial instrument is said to be convex (or to possess convexity) if the financial instrument's price increases (decreases) faster (slower) than corresponding changes in the underlying price.
Correlation
Correlation is a statistical measure describing the extent to which prices on different instruments move together over time. Correlation can be positive or negative. Instruments that move together in the same direction to the same extent have highly positive correlations. Instruments that move together in opposite direction to the same extent have highly negative correlations. Correlation between instruments is not stable.
Covered Call Option Writing
A technique used by investors to help fund their underlying positions, typically used in the equity markets. An individual who sells a call is said to "write" the call. If this individual sells a call on a notional amount of the underlying that he has in his inventory, then the written call is said to be "covered" (by his inventory of the underlying). If the investor does not have the underlying in inventory, the investor has sold the call "naked".
Credit Risk
Credit risk is the risk of loss from counterparty in default or from a pejorative change in the credit status of a counterparty that causes the value of their obligations to decrease.
Currency Swap
An exchange of interest rate payments in different currencies on a pre-set notional amount and in reference to pre-determined interest rate indices in which the notional amounts are exchanged at inception of the contract and then re-exchanged at the termination of the contract at pre-set exchange rates.
D
Delta
The sensitivity of the change in the financial instrument's price to changes in the price of the underlying cash index.
Documentation Risk
The risk of loss due to an inadequacy or other unforeseen aspect of the legal documentation behind the financial contract.

65
Duration
A weighted average of the cash flows for a fixed income instrument, expressed in terms of time.
E
Embedded Derivatives
Derivative contracts that exist as part of securities.
Equity Swap
A contract in which counterparties agree to exchange payments related to indices, at least one of which (and possibly both of which) is an equity index.
European Style Option
An option that can be exercised only at expiry as opposed to an American Style option that can be exercised at any time from inception of the contract. European Style option contracts can be closed out early, mimicking the early exercise property of American style options in most cases.
Exchange Traded Contracts
Financial instruments listed on exchanges such as the Chicago Board of Trade.
Exercise Price
The exercise price is the price at which a call's (put's) buyer can buy (or sell) the underlying instrument.
Exotic Derivatives
Any derivative contract that is not a plain vanilla contract. Examples include barrier options, average rate and average strike options, lookback options, chooser options, etc.
F
Floor
66
A floor is a financial contract giving the owner the right but not the obligation to lend a pre-set amount of money at a pre-set interest rate with a pre-set maturity date.
Forward Contracts
An over-the-counter obligation to buy or sell a financial instrument or to make a payment at some point in the future, the details of which were settled privately between the two counterparties. Forward contracts generally are arranged to have zero mark-to-market value at inception, although they may be off-market. Examples include forward foreign exchange contracts in which one party is obligated to buy foreign exchange from another party at a fixed rate for delivery on a pre-set date. Off-market forward contracts are used often in structured combinations, with the value on the forward contract offsetting the value of the other instrument(s).
Forward or Delayed Start Swap
Any swap contract with a start that is later than the standard terms. This means that calculation of the cash flows does not begin straightaway but at some pre-determined start date.
Forward Rate Agreements (FRAs)
A forward rate agreement is a cash-settled obligation on interest rates for a pre-set period on a pre-set interest rate index with a forward start date. A 3x6 FRA on US dollar LIBOR (the London Interbank Offered Rate) is a contract between two parties obliging one to pay the other the difference between the FRA rate and the actual LIBOR rate observed for that period. An Interest Rate Swap is a strip of FRAs.
Futures Contracts
An exchange-traded obligation to buy or sell a financial instrument or to make a payment at one of the exchange's fixed delivery dates, the details of which are transparent publicly on the trading floor and for which contract settlement takes place through the exchange's clearinghouse.
G
Gamma
Gamma (or convexity) is the degree of curvature in the financial contract's price curve with respect to its underlying price. It is the rate of change of the delta with respect to changes in the underlying price. Positive gamma is favourable. Negative gamma is damaging in a sufficiently volatile market. The price of having positive gamma (or owning gamma) is time decay. Only instruments with time value have gamma.

67
H
Hedge
A transaction that offsets an exposure to fluctuations in financial prices of some other contract or business risk. It may consist of cash instruments or derivatives.
Historical Volatility
A measure of the actual volatility (a statistical measure of dispersion) observed in the marketplace.
Hybrid Security
Any security that includes more than one component. For example, a hybrid security might be a fixed income note that includes a foreign exchange option or a commodity price option.
I
Implied Volatility
Option pricing models rely upon an assumption of future volatility as well as the spot price, interest rates, the expiry date, the delivery date, the strike, etc. If we are given simultaneously all of the parameters necessary for determining the option price except for volatility and the option price in the marketplace, we can back out mathematically the volatility corresponding to that price and those parameters. This is the implied volatility.
In-The-Money Spot
An option with positive intrinsic value with respect to the prevailing market spot rate. If the option were to mature immediately, the option holder would exercise it in order to capture its economic value. For a call price to have intrinsic value, the strike must be less than the spot price. For a put price to have intrinsic value, the strike must be greater than the spot price.
In-The-Money-Forward
An option with positive intrinsic value with respect to the prevailing market forward rate. If the option were to mature immediately, the option holder would exercise it in order to capture its economic value. For a call price to have intrinsic value, the strike must be less than the spot price. For a put price to have intrinsic value, the strike must be greater than the spot price.
Index-Amortizing Swaps
An interest rate swap in which the notional amount for the purposes of calculating cash flows decreases over the life of the contract in a pre-specified manner.
Interest Rate Swap

68
An exchange of cash flows based upon different interest rate indices denominated in the same currency on a pre-set notional amount with a pre-determined schedule of payments and calculations. Usually, one counterparty will received fixed flows in exchange for making floating payments.
International Swaps Dealers' Association (ISDA) Agreements (see also Legal Risk)
In order to minimize the legal risks of transacting with one another, counterparties will establish master legal agreements and sidebar product schedules to govern formally all derivatives transactions into which they may enter with one another.
Intrinsic Value
The economic value of a financial contract, as distinct from the contract's time value. One way to think of the intrinsic value of the financial contract is to calculate its value if it were a forward contract with the same delivery date. If the contract is an option, its intrinsic value cannot be less than zero.
K
Knock-in Option
An option the existence of which is conditional upon a pre-set trigger price trading before the option's designated maturity. If the trigger is not touched before maturity, then the option is deemed not to exist.
Knock-out Option
An option the existence of which is conditional upon a pre-set trigger price trading before the option's designated maturity. The option is deemed to exist unless the trigger price is touched before maturity.
L
Legal Risk
The general potential for loss due to the legal and regulatory interpretation of contracts relating to financial market transactions.
LIBOR London Interbank Offer Rate
The rate of interest paid on offshore funds in the Eurodollar markets.
Liquidity Risk
The risk that a financial market entity will not be able to find a price (or a price within a reasonable tolerance in terms of the deviation from prevailing or expected prices) for one or

69
more of its financial contracts in the secondary market. Consider the case of a counterparty who buys a complex option on European interest rates. He is exposed to liquidity risk because of the possibility that he cannot find anyone to make him a price in the secondary market and because of the possibility that the price he obtains is very much against him and the theoretical price for the product.
Look-Back Options
An option which gives the owner the right to buy (sell) at the lowest (highest) price that traded in the underlying from the inception of the contract to its maturity, i.e. the most favourable price that traded over the lifetime of the contract.
M
Margin
A credit-enhancement provision to master agreements and individual transactions in which one counterparty agrees to post a deposit of cash or other liquid financial instruments with the entity selling it a financial instrument that places some obligation on the entity posting the margin.
Mark to Market Accounting
A method of accounting most suited for financial instruments in which contracts are revalued at regular intervals using prevailing market prices. This is known as taking a "snapshot" of the market.
Market Risk
The exposure to potential loss from fluctuations in market prices (as opposed to changes in credit status).
Market-Maker
A participant in the financial markets who guarantees to make simultaneously a bid and an offer for a financial contract with a pre-set bid/offer spread (or a schedule of spreads corresponding to different market conditions) up to a pre-determined maximum contract amount..
N
Naked Option Writing
The act of selling options without having any offsetting exposure in the underlying cash instrument.
Netting

70
When there are cash flows in two directions between two counterparties, they can be consolidated into one net payment from one counterparty to the other thereby reducing the settlement risk
involved.
O
OCC
The Office of the Comptroller of the Currency (US).
OSFI
Office of the Superintendent of Financial Institutions (Canada).
Open Interest
Exchanges are required to post the number of outstanding long and short positions in their listed contracts. This constitutes the open interest in each contract.
Operational Risk
The potential for loss attributable to procedural errors or failures in internal control.
Option
The right but not the obligation to buy (sell) some underlying cash instrument at a pre-determined rate on a pre-determined expiration date in a pre-set notional amount.
Out-of-The-Money Spot
An option with no intrinsic value with respect to the prevailing market spot rate. If the option were to mature immediately, the option holder would let it expire. For a call price to have intrinsic value, the strike must be less than the spot price. For a put price to have intrinsic value, the strike must be greater than the spot price.
Out-of-The-Money-Forward
An option with no intrinsic value with respect to the prevailing market forward rate. If the option were to mature immediately, the option holder would let it expire. For a call price to have intrinsic value, the strike must be less than the spot price. For a put price to have intrinsic value, the strike must be greater than the spot price.
Over-the-Counter

71
Any transaction that takes place between two counterparties and does not involve an exchange is said to be an over-the-counter transaction.
P
Path-Dependent Options
Any option whose value depends on the path taken by the underlying cash instrument.
Potential Exposure
An assessment of the future positive intrinsic value in all of the contracts outstanding with an individual counterparty who may choose (or may be unable) to make their obligated payments.
Premium
The cost associated with a derivative contract, referring to the combination of intrinsic value and time value. It usually applies to options contracts. However, it also applies to off-market forward contracts.
Put Option
A put option is a financial contract giving the owner the right but not the obligation to sell a pre-set amount of the underlying financial instrument at a pre-set price with a pre-set maturity date.
Put-Call Parity Theorem
A long position in a put combined with a long position in the underlying forward instrument, both of which have the same delivery date has the same behavioral properties as a long position in a call for the same delivery date. This can be varied for short positions, etc.
Q
Quanto Option
An option the payout for which is denominated in an index other than the underlying cash instrument.
R
Regulatory Risk
The potential for loss stemming from changes in the regulatory environment pertaining to derivatives and financial contracts, the utility of these instruments for different counterparties, etc.
Rho

72
The sensitivity of a financial contract's value to small changes in interest rates.
Risk Metrics
A parametric methodology for calculating Value-at-Risk using data conditioned by JP Morgan's spin-off company Risk Metrics that is most useful for assessing portfolios with linear risks.
S
Settlement Risk
The risk of non-payment of an obligation by a counterparty to a transaction, exacerbated by mismatches in payment timings.
Speculation
Taking positions in financial instruments without having an underlying exposure that offsets the positions taken.
Spot
The price in the cash market for delivery using the standard market convention. In the foreign exchange market, spot is delivered for value two days from the transaction date or for the next day in the case of the Canadian dollar exchanged against the US dollar.
Spread
The difference in price or yield between two assets that differ by type of financial instrument, maturity, strike or some other factor. A credit spread is the difference in yield between a corporate bond and the corresponding government bond. A yield curve spread is the spread between two government bonds of differing maturity.
Standard Deviation
In finance, a statistical measure of dispersion of a time series around its mean; the expected value of the difference between the time series and its mean; the square root of the variance of the time series.
Stress Testing
The act of simulating different financial market conditions for their potential effects on a portfolio of financial instruments.
Strike Price
The price at which the holder of a derivative contract exercises his right if it is economic to do so at the appropriate point in time as delineated in the financial product's contract.

73
Structured Notes
Fixed income instruments with embedded derivative products.
Swap Spread
The difference between the swap yield curve and the government yield curve for a particular maturity, referring to the market prices for the fixed rate in a plain vanilla interest rate swap.
Swaptions
Options on swaps.
T
Theta
The sensitivity of a derivative product's value to changes in the date, all other factors staying the same.
Time Value
For a derivative contract with a non-linear value structure, time value is the difference between the intrinsic value and the premium.
V
Value at Risk or VaR
The calculated value of the maximum expected loss for a given portfolio over a defined time horizon (typically one day) and for a pre-set statistical confidence interval, under normal market conditions
Value of a Basis Point
The change in the value of a financial instrument attributable to a change in the relevant interest rate by 1 basis point (i.e. 1/100 of 1%).
Vega
The sensitivity of a derivative product's value to changes in implied volatility, all other factors staying the same.
Volatility

74
In finance, a statistical measure of dispersion of a time series around its mean; the expected value of the difference between the time series and its mean; the square root of the variance of the time series.
Y
Yield Curve
For a particular series of fixed income instruments such as government bonds, the graph of the yields to maturity of the series plotted by maturity.
Yield Curve Risk
The potential for loss due to shifts in the position or the shape of the yield curve.
Z
Zero Coupon Instruments
Fixed income instruments that do not pay a coupon but only pay principal at maturity; trade at a discount to 100% of principal before maturity with the difference being the interest accrued.
Zero Coupon Yield Curve
For zero coupon bonds, the graph of the yields to maturity of the series plotted by maturity.

75
Summarization of derivatives market
1: Benefits and Risks of Derivative Markets Asian derivative markets go back to 17th century rice trading in Japan and have grown rapidly over the last decade. Derivative contracts allow the trading of agricultural or financial instruments in the future at predetermined prices. Those standardized contracts that are traded at an organized exchange are called exchange-traded derivatives (ETD) and those customized contracts that are traded individually are called over-the-counter (OTC) derivatives. A few examples can illustrate the substantial developmental benefits that derivative markets can create for the economy: The earliest innovation helped farmers to reduce uncertainty over future prices of their commodities, where buyers and sellers would contractually agree on next year’s price for standardized products such as corn, soybean, or wheat, Aluminum, copper, or crude-oil.
76
Producers have been able to reduce large cyclical swings and consumers have been able to rely on less volatile prices, which has increased economic efficiency More recently, the Asian crisis revealed the need for a “spare tire” whereby corporations would not only rely on bank loans but also seek financing from debt capital markets. When issuers offer floating-rate debt, borrowers can use interest rate swaps, options, or futures to lock-in future interest rates at a fee, which can help them gain flexibility for future production and reduce Volatility from economic cycles. Standardized futures contracts on agricultural commodities, metals, and interest rates are today commonly traded at over 20 derivative exchanges across Asia. More recent innovations reveal the vast benefits that risk sharing in capital markets can create. While flood insurance has been a traditional insurance product, more extreme catastrophic events such as earthquakes require stronger balance sheets than insurance (or even reinsurance) companies can provide. Investors in capital markets can choose to buy so-called CAT bonds that carry high interest rates but may loose their principal in case a predefined catastrophic event occurs during the agreed duration. In the area of housing finance, consumers enjoy lower mortgage rates when banks can bundle a large portfolio of mortgage loans and sell structured products in capital markets that differentiate pricing for tranches with different credit risk. Various credit derivatives, foreign exchange derivatives, and more exotic options are today traded in mostly unregulated OTC derivative markets. Various advantages and disadvantages of derivative markets have been studied in the literature. Concerns arise: Especially in the areas of accounting and transparency, leverage and corporate governance, as well as on counterparty and potential systemic risks in unregulated markets. An analogy may help to illustrate the trade-offs: Car insurance can be regarded as a derivative product where the insurance company makes a future contingent payment in case of car accidents in return for a premium paid by the car owner. By pooling the risk, insurance can lower the cost to car owners, and generate a profit for the intermediary. However, the protection might induce some motorists to become more reckless in their driving and ultimately drive up accident and premium rates.

77
Nobody would argue that economies are better off without car insurance. Obviously, solid regulatory frameworks, strong risk management practices, and close supervision are indispensable.
�Market efficiency � More leverage
�Risk sharing and transfer � Less transparency
�Low transaction costs � Dubious accounting
�Capital intermediation � Regulatory arbitrage
�Liquidity enhancement � Hidden systemic risk
�Price discovery � Counter-party risk
�Cash market development � Tail-risk future exposure
�Hedging tools � Weak capital requirements
�Regulatory savings � Zero-sum transfer tools
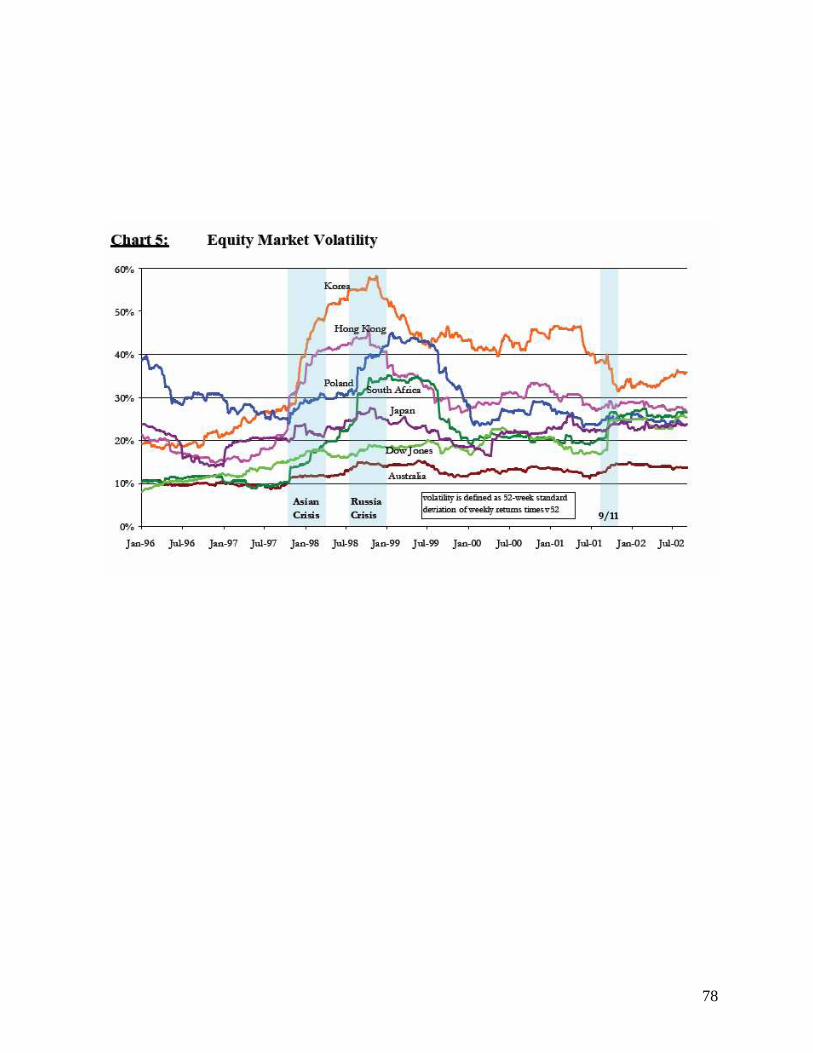
78
79
ROADMAP TOWARDS SOUND DERIVATIVEMARKETS: The analysis of benefits and risks of derivative instruments, the 20-year experience from OTC and ETD derivative markets, and the policy considerations discussed above lead to a roadmap that can facilitate the development of sound derivative markets. The following chart illustrates ten stylized building block which lead from cash markets to repo markets to ETD markets and eventually to OTC derivative markets. While there are always country specific differences, the following stylized building blocks should be developed: i. First, there should be an efficient, liquid, and integrated cash market (either for bonds, equities, other assets, or commodities) that is broadly market determined rather than driven by administered prices. Segmented markets and access restrictions can lead to less liquid and less efficient markets. In bond markets, the development of on-the-run benchmarks can help foster liquidity. In addition, modern IT, trading platforms, and internet trading often enhance liquidity. ii. There needs to be a compelling economic rationale to develop new derivative products. For example, credit derivatives are desirable in order to transfer credit risk to institutional investors, whereas exotic options may not be desirable if they mostly serve for retail speculation. 21 Then a derivatives law needs to be enacted that protects netting arrangements in bankruptcies and enables effective enforcement. In addition, appropriate regulation (functional and/or institutional) needs to be established which usually includes self regulatory organizations (SRO). iii. Prior to trading of derivatives, both long and short positions should be allowed in the underlying cash market. For bond markets, repurchase agreements need to be established, which requires the development of securities lending, and often is combined with margin trading. Short positions may be limited to hedge net long positions, but they are critical to develop liquidity and avoid the primary motivation for derivatives as substitutes for short cash positions. iv. Market participants that intend to deal in derivatives should be licensed and trained. They should be required to follow best practice governance and accounting standards and to hold sufficient capital for their respective risk positions. Also, intermediaries must be accountable to deal only with fit and proper clients who understand characteristics and risks of derivatives . v. Tax regulations should provide a level playing field for all cash and derivatives trading. If any one market segment is exempted from taxes, it may initially help market development, but will not be sustainable if that market becomes a substitute for tax arbitrage reasons. Typically, capital gains taxes are considered more efficient and less distortion than transaction taxes . vi. The major institutional setup of a derivatives exchange will ideally be implemented through a single demutualized exchange. Typically, index futures are among the first products before options on individual assets are introduced. Safety cushions of the exchange must include appropriate capital and a sound margining system.

80
vii. Clearing and settlement of derivatives products should be executed through a single counterparty (CCP) with multilateral multi-product close-out netting arrangements. Typically the exchange or its subsidiary will provide these services, which may also cover OTC trading as it will further strengthen the prevalent OTC design of bilateral ISDA master agreements. viii. Local accounting standards should be upgraded to IFRS, including mark-to-market principles as required under IAS39. Full disclosure of all derivative positions should be required. ix. Subsequently, more tailored or innovative OTC derivative products may be designed, such as credit default swaps. Typically, intermediaries are banks which should receive specific regulatory clearance and should support their risk positions with adequate capital. Counter-party 22 credit risk management requires special emphasis, which is typically facilitated through ISDA master-agreements, the use of counterparty credit ratings, and the posting of collateral. x. Finally, the investor base may be further broadened, for example by attracting a larger share of foreign institutional investors or by opening up new ETD markets for retail investors. This can be facilitated by strategic partnerships among exchanges, modern trading platforms, and reduced transaction costs, as well as by innovative products that meet new hedging needs.
In summary, solid product design, strong regulation, and sound market infrastructure are three key components for the development of sound derivative markets.

81
REFRENCES USED Encyclopedia Investopedia Nseindia.com Indian derivatives Bseindia.com Derivatives.com Financial Products John C. Hull (option, futures and derivatives) Global finance

82