depth and size limits for the visibility of veins using
TRANSCRIPT

University of Tennessee Health Science Center University of Tennessee Health Science Center
UTHSC Digital Commons UTHSC Digital Commons
Theses and Dissertations (ETD) College of Graduate Health Sciences
5-2007
Depth and Size Limits for the Visibility of Veins Using the Depth and Size Limits for the Visibility of Veins Using the
VeinViewer Imaging System VeinViewer Imaging System
Soujanya Ganesh University of Tennessee Health Science Center
Follow this and additional works at: https://dc.uthsc.edu/dissertations
Part of the Equipment and Supplies Commons, and the Medical Biotechnology Commons
Recommended Citation Recommended Citation Ganesh, Soujanya , "Depth and Size Limits for the Visibility of Veins Using the VeinViewer Imaging System" (2007). Theses and Dissertations (ETD). Paper 94. http://dx.doi.org/10.21007/etd.cghs.2007.0103.
This Thesis is brought to you for free and open access by the College of Graduate Health Sciences at UTHSC Digital Commons. It has been accepted for inclusion in Theses and Dissertations (ETD) by an authorized administrator of UTHSC Digital Commons. For more information, please contact [email protected].

Depth and Size Limits for the Visibility of Veins Using the VeinViewer Imaging Depth and Size Limits for the Visibility of Veins Using the VeinViewer Imaging System System
Abstract Abstract Administration of fluids or medication and blood draw procedures require the nurse or the phlebotomist to access the veins in patients at hospitals or phlebotomy centers. It is important to minimize the discomfort associated with sticking needles in the patient more than once and most often, necessary to find an appropriate vein within few minutes. However, problems involved in accessing veins in pediatric and obese patients make it very difficult to perform a successful stick in a short time. The VeinViewer Imaging System is an infrared imaging device that provides the nurses and phlebotomists a means for locating veins in the very first attempt and within a few seconds. A camera captures an image of the veins illuminated by infrared light and a contrast-enhanced image of the veins is projected back onto the patient’s skin in real-time using a projector, after being processed by a computer. Each vein in the VeinViewer image appears with different contrast against the background skin. To evaluate the performance of the device, a thorough investigation of the properties of the vein affecting its contrast can be of immense value. The goal of this research is to determine quantitatively the effect of physical properties of veins such as depth and diameter on its visibility in the VeinViewer image. The results of this study can be interpreted to understand the biological phenomena influencing the quality of the VeinViewer image. An extension of this study may lead to advancement in the hardware or software which potentially will benefit the phlebotomists and physicians.
Document Type Document Type Thesis
Degree Name Degree Name Master of Science (MS)
Program Program Biomedical Engineering
Research Advisor Research Advisor Jack A. Buchanan, M.D.
Keywords Keywords VeinViewer, vein, infrared imaging, ultrasound imaging, vein contrast, phlebotomy
Subject Categories Subject Categories Analytical, Diagnostic and Therapeutic Techniques and Equipment | Equipment and Supplies | Medical Biotechnology | Medical Sciences | Medicine and Health Sciences
This thesis is available at UTHSC Digital Commons: https://dc.uthsc.edu/dissertations/94

DEPTH AND SIZE LIMITS FOR THE VISIBILITY OF VEINS USING THE VEINVIEWER IMAGING SYSTEM
A Thesis Presented for
The Graduate Studies Council The University of Tennessee
Health Science Center
In Partial Fulfillment Of the Requirements for the Degree
Master of Science In the Joint Graduate Program in Biomedical Engineering
From the University of Tennessee And
The University of Memphis
By Soujanya Ganesh
May 2007

ii
Copyright © Soujanya Ganesh, 2007
All rights reserved

iii
Dedication
This thesis is dedicated to
my Lord, Sri Balaji for his grace and blessing
and to my parents
Mr. Ganesh Raghunathan and Smt. Latha Ganesh
in recognition of their love and encouragement
throughout my graduate study.

iv
Acknowledgements
I am grateful to my mentor Dr. Herbert Zeman for his direction, guidance and support all
through my graduate research. I would like to thank my advisor Dr. Jack Buchanan for his time
and valuable suggestions related to my research. I would also like to thank Dr. Frances Tylavsky
for her help with the statistical data analysis and interest in this project. I appreciate the helpful
contributions of my other committee members Dr. Thaddeus Wilson and Dr. Russell Chesney. I
am also grateful to Dr. Waleed Gaber for letting me use his office space and ultrasound machine
for my experiments. Thanks to Matthew Clemens and Carlos Vrancken for their useful inputs to
this project. Most importantly, I deeply appreciate the care, love and understanding of my
wonderful parents. Mom and Dad, I feel truly blessed to be your daughter. I also thank my sister
who has never failed to give the best advice when I needed it. Special thanks to my friends Vijay,
Raj, Ajay and Bharath for their concern and for always being there for me. I love you guys!

v
Abstract
Administration of fluids or medication and blood draw procedures require the nurse or
the phlebotomist to access the veins in patients at hospitals or phlebotomy centers. It is important
to minimize the discomfort associated with sticking needles in the patient more than once and
most often, necessary to find an appropriate vein within few minutes. However, problems
involved in accessing veins in pediatric and obese patients make it very difficult to perform a
successful stick in a short time. The VeinViewer Imaging System is an infrared imaging device
that provides the nurses and phlebotomists a means for locating veins in the very first attempt
and within a few seconds. A camera captures an image of the veins illuminated by infrared light
and a contrast-enhanced image of the veins is projected back onto the patient’s skin in real-time
using a projector, after being processed by a computer. Each vein in the VeinViewer image
appears with different contrast against the background skin. To evaluate the performance of the
device, a thorough investigation of the properties of the vein affecting its contrast can be of
immense value.
The goal of this research is to determine quantitatively the effect of physical properties of
veins such as depth and diameter on its visibility in the VeinViewer image. The results of this
study can be interpreted to understand the biological phenomena influencing the quality of the
VeinViewer image. An extension of this study may lead to advancement in the hardware or
software which potentially will benefit the phlebotomists and physicians.

vi
Table of Contents
Chapter 1. Background and Introduction 1
1.1 Introduction 1
1.2 Difficult Sticks 1
1.3 Venipuncture, IV Access and Phlebology 2
1.4 Devices to Locate Veins 3
1.5 VeinViewer – Background and Motivation 3
1.6 Optical Properties of Tissue 4
1.6.1 Skin Anatomy 4
1.6.2 Skin Optics 6
Chapter 2. VeinViewer Imaging 9
2.1 Introduction 9
2.2 Proof-of-Principle Device 9
2.3 Proof-of-Principle Vein Contrast Enhancer System Set-up 11
2.4 Prototype VeinViewer 13
2.5 Clinical Evaluation 16
2.6 Motivation of the Research 16

vii
Chapter 3. Ultrasound Imaging 17
3.1 Working Principle 17
3.2 Ultrasound Acoustic Principles 17
3.2.1 Sound Waves 17
3.2.2 Characteristics of Sound Waves 18
3.2.3 Sound Attenuation 18
3.2.4 Acoustic Impedance 20
3.2.5 Acoustic Reflection 21
3.2.6 Acoustic Refraction 21
3.3 Ultrasound Transducers 22
3.4 Quality of Ultrasound Images 24
3.5 Ultrasound Imaging Modes and Features 26
Chapter 4. Materials and Methods 28
4.1 Introduction 28
4.2 Subject Selection and Experimental Setting 28
4.3 Preliminary Studies 29
4.3.1 Materials 29
4.3.1.1 Prototype VeinViewer Imaging System 29
4.3.1.2 Ultrasound 29
viii
4.3.2 Experimental Methods 31
4.3.2.1 Stage I – Line Technique 31
4.3.2.2 Stage II – Tick Mark Technique 34
4.3.2.3 Stage III – Dots and Ticks Technique 39
4.4 Final Experimental Design 42
4.4.1 Materials 42
4.4.1.1 VeinViewer Imaging System 42
4.4.1.2 Ultrasound 44
4.4.2 Experimental Methods 44
4.4.2.1 Type I – Veins with Varying Contrast 44
4.4.2.2 Type II – Veins with Constant Contrast 47
Chapter 5. Results and Discussion 51
5.1 Introduction 51
5.2 VeinViewer Image Analysis 51
5.2.1 Veins Varying in Contrast 57
5.2.2 Veins Constant in Contrast 60
5.2.3 Possible Irregularities in Measurement 62
5.3 Ultrasound Image Analysis 63
5.4 Statistical Analysis 63
5.4.1 Contrast-Depth Correlation 67
5.4.2 Contrast-Diameter Correlation 67

ix
5.4.3 Correlation at Specific Ranges of Variables 72
5.4.4 Contrast – Depth Correlation along Anticubital Vein 72
5.4.5 Interaction between Vein Depth and Diameter with Contrast 76
5.5 Discussion 76
5.6 Future Work 77
List of References 78
Appendix 81
Appendix A. UTHSC IRB Application 82
Appendix B. Consent Form 93
Appendix C. VeinViewer History Questionnaire 102
Vita 103

x
List of Figures
Figure Page
1. Section of human skin 5
2. Propagation of light in various tissues 7
3. Absorption of oxy and deoxy-hemoglobin of whole blood 7
4. Light propagation at different wavelengths in tissue 8
5. A photograph showing the proof-of-principle VV 10
6. A photograph of a vein stick in a subject using the VV 10 7. A diagram of the set-up of the proof-of-principle VV 12
8. A photograph of the prototype VV 15
9. Diagram depicting refraction phenomenon 21
10. Diagram showing arrangement of transducer elements 23
11. Diagram demonstrating (a) optimal detail resolution and (b) low detail resolution 26 12. VV and ultrasound images corresponding to the veins lying on the second line 33
13. Series of VV images taken of the forearm 33
14. A photograph of one segment of a vein with tick marks drawn on either side 35
15. Contrast-enhanced and raw VV images of a vein with equidistant ticks marked close to it 36
16. A contrast-enhanced VV image of a section of the arm with equidistant ticks marked towards the edges of the FOV 36
17. Picture demonstrating depth measurement of veins using Corel Draw 38
18. Picture demonstrating diameter measurement of a vein using Corel Draw 38

xi
19. A photograph of a section of vein with dots and ticks 40
20. Raw and contrast-enhanced VV images of a vein with ticks marked at unequal distances 40
21. Raw VV images of a vein under analysis 41
22. A photograph of the VV on a laptop stand 43
23. VV and ultrasound images of a vein demonstrating variation in contrast and depth over its length 46
24. A photograph of a section of arm with ticks drawn after the VV procedure 48
25. Diagram demonstrating the effect of infrared illumination of the VV on pixel brightness 53
26. Raw and processed VV images of a vein in the arm of a 25 year old female 53
27. Raw VV image with the box covering the two background regions and the vein 54
28. Intensity profile across a region covering the vein and both background regions at different pixel intensity levels 55
29. Raw and contrast-enhanced VV images of a vein in the arm of a 35 year old female 55
30. Intensity profile across a region covering the vein and both background regions at the same pixel intensity levels 56 31. Raw and processed VV images of the veins in a 23 year old female subject 57
32. Raw VV images showing the box positioned on the vein between the tapes 58
33. Plot of pixel intensity values at every point of the box drawn on a vein varying in depth in the VV image 59
34. VV images acquired on a 24 year old male’s arm with the chosen vein at the center of the image 60

xii
35. Plot of pixel intensity values at every point of the box drawn on the vein with constant contrast 61
36. Raw and processed VV images of a section in the arm of a 24 year old male 62
37. Plot of contrast and depth of all the veins of different diameters 65
38. Bivariate fit of contrast by depth 66
39. Plot of contrast vs. diameter of veins at different depths 68
40. Bivariate fit of contrast by diameter 69
41. Bivariate linear fit of diameter by depth 71
42. Plot of vein contrast and depth at diameters of 1 to 1.5 mm (red) and 2.5 to 3 mm (blue). 73 43. Plot of vein contrast and diameter at depths of 1 to 1.5 mm (blue) and 2 – 2.5 mm (red). 74 44. Plot of vein contrast and depth along two veins in two different subjects. 75

1
Chapter 1. Background and Introduction
1.1 Introduction
In most situations, diagnosis or treatment of medical conditions require blood draw, drug
and fluid administration which can be achieved through proper venous access in the patients.
Conditions not demanding prompt access provide more time for physicians and phlebotomists to
find a vein. In cases of medical emergencies such as hemorrhage, acute renal failure,
hypotension, shock and cardiac arrest, immediate access to the patient’s vein has to be achieved
[6]. However, very often, even skilled paramedics or physicians may be unsuccessful in
obtaining access in patients. Among them many are obese, geriatric and pediatric patients whose
veins are not palpable or visible for the needle stick [16].
1.2 Difficult Sticks
In obese patients, the existence of substantial deposits of subcutaneous fat makes it
difficult to locate veins either by touch or vision. Also, the adipose tissue often tends to take the
appearance of a vein leading to unsuccessful draws in the area. These misplaced sticks can be
avoided if the nurse or phlebotomist is trained to be able to differentiate between adipose tissue
and veins. Geriatric patients have veins which can collapse easily due to loss of their elasticity
while pediatric patients possess veins that are taut but fragile and very small in size [16, 6].
Locating veins in children is particularly challenging, because most of them do not cooperate and
are apprehensive about vein sticks. Anxiety causes the patient’s blood pressure to rise thereby
narrowing the veins. This vein narrowing is a greater issue for concern in children due to the
small sized veins they already have. The history of previous venipunctures performed on a

2
patient is critical since there is a high probability of patients with previous venipunctures having
damaged veins. Rolling veins are one of the major reasons for failed attempts as the vein moves
away from the needle insertion site and leads to unnecessary sticks.
It can be considered that major reasons for the failure in locating veins in a patient are
body mass, properties of the vein, anatomy of the site, and the patient’s anxiety. In addition to
patient-related factors, the competence of the phlebotomist or the nurse plays a vital part in the
success of locating a vein [6].
1.3 Venipuncture, IV Access and Phlebology
According to a recent study, it has been estimated that there are nearly 500 million
venipunctures done every year. Other studies have shown that 95.2 – 97.3 percent of them are
successful in the first attempt which indicates that it is difficult to find veins in around 14 million
cases on the first try. Also, 15,000 patients per day are subject to 4 or more attempts to draw
blood or other fluids from the vein causing them to experience a lot of discomfort and pain [6].
Finding veins for intravenous access through a peripheral, a central, or a PICC line in many
patients, especially obese patients and those who have had multiple intravenous drug injections,
is often found to be difficult by physicians. As many of these cases are not performed in an
emergency setting, establishing vein access in a short time is not crucial, but the patient’s
comfort takes priority and avoiding multiple needle sticks is essential. In Phlebology centers, the
surgeons rely on an ultrasound machine for guidance on locating and mapping the abnormal vein
to treat disorders. Factors like obesity and small sized veins pose a challenge to them since the
veins are not palpable or visible.

3
1.4 Devices to Locate Veins
Several devices have been developed recently to aid physicians, phlebotomists and
surgeons in finding veins to avoid unnecessary sticks. A few such devices work by trans-
illuminating the patient’s skin using bright LEDs to show peripheral veins for access. These
devices are very compact and cause no damage to the patient’s skin but require the lights to be
turned off for the physician to view the veins clearly. Markers have to be used on the patient’s
skin after identification of the vein for later access. High-resolution ultrasound scanners provide
good quality images of the superficial and deep veins in obese patients and small veins in
pediatric patients in real-time. A few ultrasound scanners provide the physicians with needle
guidance tools for sticks such that they can also view the depth at which the needle is being
inserted. However, the transducer has to be held in place during needle insertion, which makes it
uncomfortable for accurate sticks. Also, the person performing the stick has to view the vein on
the ultrasound display. Venography provides an image of the veins after the patient is injected
with a contrast dye. This x-ray image can be used for mapping veins in the body before surgery
or treatment. Venography offers a wide field of view and is used for identifying and treating
numerous disorders, but necessitates the injection of a dye and, hence vein access must already
be established. There is also a significant amount of radiation associated with the procedure [10].
1.5 VeinViewer - Background and Motivation
An infrared imaging device to enhance the contrast of subcutaneous veins was developed
at the University of Tennessee Health Science Center. The device was designed to be of clinical
utility to physicians and phlebotomists. The VeinViewer (VV) imaging system permits viewing
contrast-enhanced images of the venous system in real-time as we would normally view the

4
scene without the use of an external monitor. The veins appear dark against a light background in
the images. The images assist the physician in finding the location and orientation of the veins
and also in viewing bifurcations that have to be avoided during venous access. Clinical studies
have been carried out on pediatric subjects, and the device has been proven to have clinical
utility for phlebotomists and nurses [12]. Since the device is based on the interaction of light
with skin, a thorough understanding of tissue optics including the behavior of the different layers
of skin and of veins is imperative.
1.6 Optical Properties of Tissue
1.6.1 Skin Anatomy
The largest organ of the body is the skin, which is multilayered with its three main layers
being epidermis, dermis and the subcutaneous layer, also called the hypodermis. Fig 1 shows the
cross-section of skin. The epidermis is the outermost layer and does not contain any blood
vessels. It allows light to pass through it owing to its presence in the superficial section of skin.
The middle layer known as the dermis contains capillaries, glands and hair follicles. Diffusion
takes place between the dermis and epidermis to provide nutrient supply. The hypodermis lying
above the muscle and bone is the lowermost layer in the skin consisting of fat cells, veins,
arteries and nerves. The amount of subcutaneous fat in this layer determines the penetration of
light into tissue beneath it [5]. Children possess skin of lesser thickness as compared to adults.
The depth of epidermis ranges from 0.027 – 0.15mm and that of dermis ranges from 0.6 – 3mm.
The hypodermal thickness can be between 0 – 3mm with the maximum in the abdomen [2].

5
Fig 1. Section of human skin. Source: Tasha & Co.: http://www.tashaandco.com/FG-press-main-infoguide.htm Accessed July 2, 2006.

6
1.6.2 Skin Optics
Studying the phenomena of light transport in tissue will give a better understanding of the
working of the VeinViewer system. Fig 2 depicts the scattering of light in human tissue. The
light beam that is incident on the skin undergoes absorption, scattering and reflection by the
various layers of tissue at different depths. The characteristics of light propagation differ with
respect to each layer in the skin. The reflection of light from the skin surface is called specular
reflection. Light that is specularly reflected does not permit light to propagate through internal
tissue and can thus add glare to a vein image.
A three-compartment model of skin is considered which consists of epidermis, dermis
and subcutaneous layer. The epidermal layer absorbs some light and transmits light into the
tissue layers beneath it after scattering. A lot of scattering occurs in the dermis before it
propagates to the hypodermal layer while a part of the light is absorbed. Fat scatters a major
portion of light and absorbs very little. Some of the light reaching blood in the vessels is
absorbed by the hemoglobin present in it, while some is scattered mostly in the forward direction
due to the large size of the red blood cells. It has been reported that the blood in the veins is
dominated by deoxy-hemoglobin with the oxy-hemoglobin content concentration around 47%
while that in the arteries contains more oxy-hemoglobin (90% – 95%) [2, 24]. Both types of
hemoglobin possess different light absorption properties as shown in Fig 3 [1]. Both types
exhibit almost the same absorption characteristics till the wavelength of 600nm. It can be
understood that the absorption of light by veins is higher than that by arteries between the
wavelengths of 600nm – 800nm. The curve falls rapidly for the deoxy-hemoglobin while it rises
a little and then falls for the oxy-hemoglobin.

7
Fig 2. Propagation of light in various tissues. Source: Albrecht H, Muller G, Philipp C: State-of-the-art of safety technology in medical uses of lasers. http://info.tuwien.ac.at/iflt/safety/refs/albre91.htm Accessed July 3, 2006.
Fig 3. Absorption of oxy and deoxy-hemoglobin of whole blood. Source: Steven L. Jacques: Skin Optics. Oregon Medical Laser Center News, Oregon, Jan 1998.

8
Light at different wavelengths reaches different depths when it travels through tissue as
seen in Fig 4. The bars in Fig 4 indicate the extent of transmission of light in all layers of the skin
at various wavelengths. Visible light wavelengths range from 400nm – 700nm while infrared
wavelengths range from 700nm – 106 nm. Light at wavelengths between 300nm and 400nm
reach only the epidermal and dermal sections of the skin which do not contain any veins. Light at
near-infrared wavelengths (700 – 1000nm) is less absorbed by other tissue and reaches the blood
vessels in the subcutaneous tissue. The VV utilizes this phenomenon to view veins which cannot
be visualized in visible light.
The principle of working of the VeinViewer system is based on tissue-light interaction in
the body that has already been discussed in this chapter. Details of the device instrumentation
and performance are given in the next chapter. The clinical utility of the VeinViewer system
determined from prior studies on pediatric subjects is also discussed.
Fig 4. Light propagation at different wavelengths in tissue. Source: Light Therapy Products: LED Treatments through deep penetrating light. http://www.lighttherapyproducts.com/LEDtreatments.html Accessed July 2, 2006.

9
Chapter 2. VeinViewer Imaging
2.1 Introduction
The purpose of the initial research was to develop a technology to aid those suffering
from a defective vision to avoid difficulty in visualizing scenes of daily life. Previously available
clinical devices required the person to wear glasses to view objects and it was determined that
illuminating the object to enhance its contrast would eliminate the need to wear heavy equipment
for everyday use. The device that was designed for this purpose proved very effective for
visualizing veins in pediatric patients and patients with a significant amount of subcutaneous fat
over the veins which make it harder for the phlebotomist to locate veins by touch [23, 25].
2.2 Proof-of-Principle Device
The VeinViewer (VV) imaging system is an optical imaging technology useful for
enhancing the contrast of subcutaneous veins. Light with wavelength just longer than that of
visible light is near-infrared light and its wavelength typically ranges from 700 – 1000nm. The
device illuminates the patient’s skin with near-infrared light and an infrared sensitive CCD TV
camera captures these images while a video projector projects the images back on to the skin
after a computer processes the images. All this is done in real-time and the image can be viewed
on the skin of the patient as opposed to viewing it on an external monitor. Fig 5 shows the proof-
of-principle VeinViewer. Real-time visualization of vein images as seen in Fig 6 rids the
phlebotomist of the discomfort associated with having to look at the monitor while accessing a
vein, thus making it ideal for clinical utility [20].

10
Fig 5. A photograph showing the proof-of-principle VV. Source: Lovhoiden, G., H. Deshmukh, C. Vrancken, Y. Zhang, H. D. Zeman, and D. Weinberg: Commercialization of Vein Contrast Enhancement. Proc. SPIE 4958:189-200, Bellingham, WA, 2003.
Fig 6. A photograph of a vein stick in a subject using the VV.

11
2.3 Proof-of-Principle Vein Contrast Enhancer System Set-up
The proof-of-principle device was called the Vein Contrast Enhancer (VCE), and the
newer prototype and commercial system have been renamed the VeinViewer. Fig 7 shows the
schematic of the proof-of-principle Vein Contrast Enhancer. The camera used for the VCE was a
Sentech STC-1000 CCD camera and the commercial LCD projector was an Infocus LP290
model. The camera was mounted on two goniometers for rotation in two directions. The hot
mirror in front of the camera reflects infrared light hence, allows it to fall on the skin and also
reflects the light emitted from the subject’s skin back to the camera for it to capture the images.
The hot mirror is transparent to visible light and transmits the light from the projector to the
patient’s skin. The hot mirror was aligned so that it made a 45o angle with the optical axis of the
camera for it to reflect infrared light and allow visible light from the projector to be transmitted.
One hundred circularly arranged Light Emitting Diodes (LEDs) with a wavelength of 740nm
were used to illuminate the skin. These were the ELD-740-524 model and were equally spaced.
Infrared light emitted from these LEDs was diffused using two LSD20PC10-F10X10/PSA
diffusers from Physical Optics Corporation since experimental studies proved that a diffused
light source offers better enhancement of veins by providing even illumination. This light
shaping diffuser offers good transmission efficiency with uniform emission [11, 14]. Two
polarizers of the same kind were used; one in front of the LEDs for linear polarization while
another was used in front of the camera lens at right angle to the first to eliminate glare in the
image by cross-polarization. The color of light for projecting the images back onto the skin was
green in order to eliminate any interference with the infrared light used to illuminate and image
veins. The veins appear dark on a green backdrop. The entire set-up was mechanically aligned
for precision.

12
Fig 7. A diagram of the set-up of the proof-of-principle VV. Note: Modified from Zeman et al and used with permission. Zeman H D, Lovhoiden G, Vrancken C: Prototype Vein Contrast Enhancer, SPIE, Bellingham, WA, 2004.
Projector
TV
Camera S
ubje
ct’s
skin
Processing Unit
13
The processing unit contained a computer with a 12-bit video capture card that could
capture the progressive scan analog video data from the camera. The images were processed
using the computer’s Pentium IV processor to improve the contrast of the veins using the method
of adaptive unsharp-masking edge enhancement. Adaptive edge enhancement provided for an
increase in the level of contrast near to image saturation at all places on the image, greatly
improving the contrast offered by the original camera image [11].
2.4 Prototype VeinViewer
A newer design was built at the University of Tennessee Health Science Center,
Department of Biomedical Engineering, and at Optical Sciences and Alpha Beta Technology in
Huntsville, AL for better utility in a clinical environment which required the device to be more
compact and movable. Also, the monitor-based VCE which was used for clinical studies was
replaced with the new prototype projector-based VeinViewer. The prototype VeinViewer
consists of an optical head which houses all the units including the infrared LEDs, CCD camera,
projector and the optical system. The components in the head are arranged such that the need to
use a hot mirror for reflecting the IR illuminating light as in the proof-of-principle device is
eliminated, and the hot mirror is used only to reflect the IR light towards the CCD TV camera.
The IR LEDs are circularly arranged around the camera’s front opening through which light to
the camera from the patient’s skin and from the projector onto the skin travels. These near-
infrared LEDs illuminate the skin at a wavelength of 760nm.
The head weighs approximately 6-1/2 pounds. The head is fixed to a metal arm which
can move vertically with the help of a counter balancing spring called a constant force spring
[21]. It is a steel strip whose stress acts as the balancing force when extended [7]. A compact

14
Shuttle XPC computer with Pentium IV processor to process the images is fixed to the stand
column with an uninterruptible power supply mounted next to the computer [21]. The entire
stand is fixed to a base with wheels that enables mobility of the whole system. The images are
stored on a flash memory card. A keypad was used for capturing the images. Fig 8 shows the
prototype VV system.
The head can be moved up or down on the column to focus the VV image of the veins
using two red laser pointers. The image is set in focus when the two pointers coincide. A 512
MB Lexar flash card provides for storing images on the computer. Each image captured using a
keypad saves a raw image, and two processed images: contrast-enhanced image and an image
with the hair removal algorithm. A calibration procedure using a four-point test pattern for
alignment and the objects appears within 0.06mm of their original position. A phantom of size
1024x786 pixels with four points forming a rectangle, is projected onto a fluorescent screen
using green light but the reflected light reaching the infrared-sensitive TV camera is infrared. It
is created in XGA mode and the phantom image is in VGA mode. The X and Y positions of each
of the four points are fixed and already known for the phantom. The positions of the four points
that are projected on the screen and detected by the camera are calculated. Alignment parameters
such as translational, magnification and rotational are calculated during each calibration and the
phantom image is translated, stretched and rotated accordingly preventing image distortion. The
parameters calculated from the calibration procedure are used for the vein images and any
misalignment is corrected. These corrected images of veins in patients are projected back on to
the skin accurately [11, 26].

15
Fig 8. A photograph of the prototype VV.

16
2.5 Clinical Evaluation
Studies done in the phlebotomy clinic and metabolic laboratory with a monitor-based test
system on many pediatric subjects proved that the device works effectively on children including
newborn subjects, thereby, reducing the number of attempts to stick a vein. The study classified
the veins as easy, somewhat difficult to find and very difficult to find to assess the level of
performance of the VCE system. Three levels were chosen to describe the performance which
included cases where the device was necessary, useful to an extent and not useful. Another study
took into account other important factors that could influence the success in finding a vein;
venipuncture history, amount of subcutaneous fat, age of subject, darkness of skin and
palpability of the vein by phlebotomist. All these factors were recorded as scores ranging from
the least to the highest. It was concluded from the study that 93% of the veins could be
visualized in subjects using the device. Although, improvements in software and hardware after
these studies were conducted have lead to superior performance of the device with respect to
visualization of even the very difficult-to-find veins [11].
2.6 Motivation of the Research
Advancement in the image processing technology and the instrumentation of the device
improved the quality of images making it very easy for venous access. This study was proposed
to determine the relationship between 1) the contrast and vein depth; 2) the contrast and vein
diameter and 3) To determine if there is an interaction between the depth and diameter with the
contrast obtained with the VeinViewer; and 4) To establish depth and size limits of veins for
visibility with the VeinViewer. This study will allow more objective estimates of the usefulness
of the VeinViewer for various clinical situations to be specifically evaluated in future studies.

17
Chapter 3. Ultrasound Imaging
3.1 Working Principle
Ultrasonography allows for noninvasive imaging to provide information such as the size,
location, position and depth of structures inside the human body using a pulse-echo technique. It
works on the principle of transmission of ultrasonic waves into the body by the transducer and
the detection of the reflected echoes from internal structures and organ/tissue interfaces in the
body. The transducer detects these echoes which are in the form of ultrasound energy and
converts them into electrical energy. These echo signals are processed by the electronics in the
ultrasound mcahine and presented as dots on the display of the system, generating a gray-scale
image. The location of every dot as seen in the image corresponds to the location of the anatomic
structure that produces these echoes. Information of propagation speed of ultrasound waves and
the time taken for the reflected echo to reach the transducer determines the depth of the organ
generating echoes [8].
3.2 Ultrasound Acoustic Principles
3.2.1 Sound Waves
Sound waves are mechanical compressional waves that are caused by motion of particles
in the medium through which they travel. The back-and-forth movement of these particles causes
compression and rarefaction in the wave, alternately. Compressions are regions of high pressure
and rarefactions are regions of low pressure.

18
3.2.2 Characteristics of Sound Waves
A sound wave can be characterized by terms such as amplitude, frequency and
wavelength, propagation speed and period. The level of sound pressure in the wave is measured
in terms of amplitude. It is expressed in decibels (dB). The frequency of a sound wave is a
measure of the number of cycles of alternate compressions and rarefactions that occur in a given
period of time. Its unit is hertz (Hz). Sounds between the range of frequencies of about 20Hz to
20,000Hz are audible to humans. Ultrasound systems that are used for diagnostic purposes
predominantly work in the range of 2 to 15MHz [8]. The frequency of ultrasound waves plays a
predominant role in determining the spatial resolution of the image. Intravascular applications of
ultrasound require transducers with frequencies higher than the diagnostic range of frequencies
used.
The distance between two maximum compressions or two minimum rarefactions in space
gives the wavelength of the sound wave. It is commonly expressed in millimeters. The speed at
which a sound wave travels through a medium is defined as the propagation speed. Its units are
meters per second (m/s) or millimeters per microsecond (mm/µs). The relationship between the
three acoustic attributes, wavelength (λ ), propagation speed (υ ) and frequency )( f is given by
the equation 3.1 [3].
λ = fυ (3.1)
3.2.3 Sound Attenuation
A sound wave loses energy as it propagates through various tissues in the body. This
weakening of sound signal as it travels through a medium is called attenuation. Attenuation is
expressed in decibels (dB). Amount of attenuation determines image quality. Phenomena such as

19
scattering of the ultrasound as it travels, its reflection at different depths and loss of ultrasound
energy as heat dissipation are the factors contributing to attenuation [19].
High frequency ultrasound produces superior quality images with less attenuation in the
parts at greater depths as can be observed from Table 1. Conversely, increasing the frequency of
the ultrasound waves decreases the penetration depth and generates images with high spatial
resolution in the superficial regions and low resolution in the areas farther from the transducer.
The relationship between Attenuation ( A ), frequency ( f ) and depth ( d ) is given by the
equation 3.2.
dfA ×=21 (3.2)
Each tissue type has a characteristic attenuation coefficient which is the loss of ultrasound signal
intensity occurring with every centimeter covered by the beam. Its units are dB/cm [8].
Table 1. Attenuation coefficients and imaging depth for diagnostic applications.
Frequency (MHz) Average attenuation coefficient for soft tissue (dB/cm)
Ultrasound waves penetration depth (cm)
2
5
7.5
10
15
1
2.5 4 5
6.5
30
12 8 6 4
Source: Kremkau FW: Diagnostic ultrasound: principles, instruments and exercises. WB Saunders, Philadelphia, 2001.

20
3.2.4 Acoustic Impedance
All media oppose the propagation of sound waves further but the degree of resistance
differs among them. Factors influencing acoustic impedance are the speed of sound and acoustic
pressure. Acoustic impedance (Z) is the product of two quantities, the density of the medium (ρ)
and speed at which sound travels (v) given by equation 3.3. It is expressed in rayls (kgs-1m-2).
The equation is given by,
)()( 3 sm
mkgZ υρ ×= (3.3)
Acoustic impedance is proportional to the density of the medium. A list of acoustic impedances
is given for some media in Table 2. In the human body, as bone is denser, it has a higher value of
acoustic impedance and air has the least value of acoustic impedance due to its low density [4].
Ultrasound reflection and transmission depends on the impedance mismatch between two media.
The greater the difference in impedances between two materials, the lesser is transmitted. It is an
important factor that has to be considered for the design of ultrasound transducers.
Table 2. Average acoustic impedances of various media in a human body.
Medium Characteristic acoustic impedance (rayls)
Bone
Soft tissue
Blood
Air
3,800,000 – 7,400,000
1,630,000
1,670,000
400
Source: Matthew G. Mooney, Martha Grewe Wilson: Linear array transducers with improved image quality for vascular ultrasonic imaging, Hewlett-Packard Journal, Palo Alto, August 1994.

21
3.2.5 Acoustic Reflection
When ultrasound passes from one medium to another, the echoes are reflected from the
second medium. The acoustic reflection of sound waves is described as the fraction of the sound
intensity that is reflected after being sent into a medium. One fraction of the sound intensity is
reflected while the other fraction is transmitted to the next medium. The sum of these intensities
is 100%. The intensities are expressed in mW/cm2, but the intensity reflection coefficient that
represents this phenomenon, has no units since it is a ratio. The strength of the echo returning to
the transducer depends on the magnitude of the difference between impedances of the tissue. The
more the impedances differ, greater will be the intensity of the reflected pulse [8].
3.2.6 Acoustic Refraction
Sound waves traveling through various interfaces in the body undergo variations in speed
owing to the difference in the propagation speed in different tissues. This speed variation causes
the sound wave to change its direction of travel at the boundary when passing from one medium
to another. This phenomenon called refraction is demonstrated in Fig 9.
Fig 9. Diagram depicting refraction phenomenon.
θ1
θ2
Medium 1 Medium 2

22
The equation determining the relationship between the incidence angle and the transmission
angle is given by equation 3.4 which is known as Snell’s law [8].
2sin1sinN 21 θθ N= (3.4)
N1, 2 = refractive indices of both media
θ 1 = incidence angle, θ 2 = transmission angle
3.3 Ultrasound Transducers
Ultrasound transducers are devices that convert electric pulses into sound waves and vice
versa. They work as the emitter and the receiver. They are connected to a unit with
instrumentation for processing the signals and displaying them on the screen. Transducers are
made of piezoelectric crystals that produce ultrasound waves based on the amplitude of electric
pulses given to them and also electric signals based on the strength of pressure applied to them.
Different ceramics are used to make these probes. They work at a frequency called the operating
frequency of the transducer [8]. This frequency determines the spatial resolution of the image.
Transducers with high operating frequency offer better image resolution but lesser penetration
depth. The choice of the transducer should be based on the kind of application. In structures that
are deep below the surface and organs such as heart or liver, a transducer with a moderate
frequency will suffice since in such cases, imaging depth is of more importance than high
resolution. New ultrasound systems provide transducers that operate in a range of frequencies
and these are called extended frequency probes.
Ultrasound transducers are available in different shapes and aperture sizes depending on
the diagnostic purpose that they are used for. Transducer elements are arranged in different ways
to produce images that are application specific. Two types of arrangement of transducer elements
23
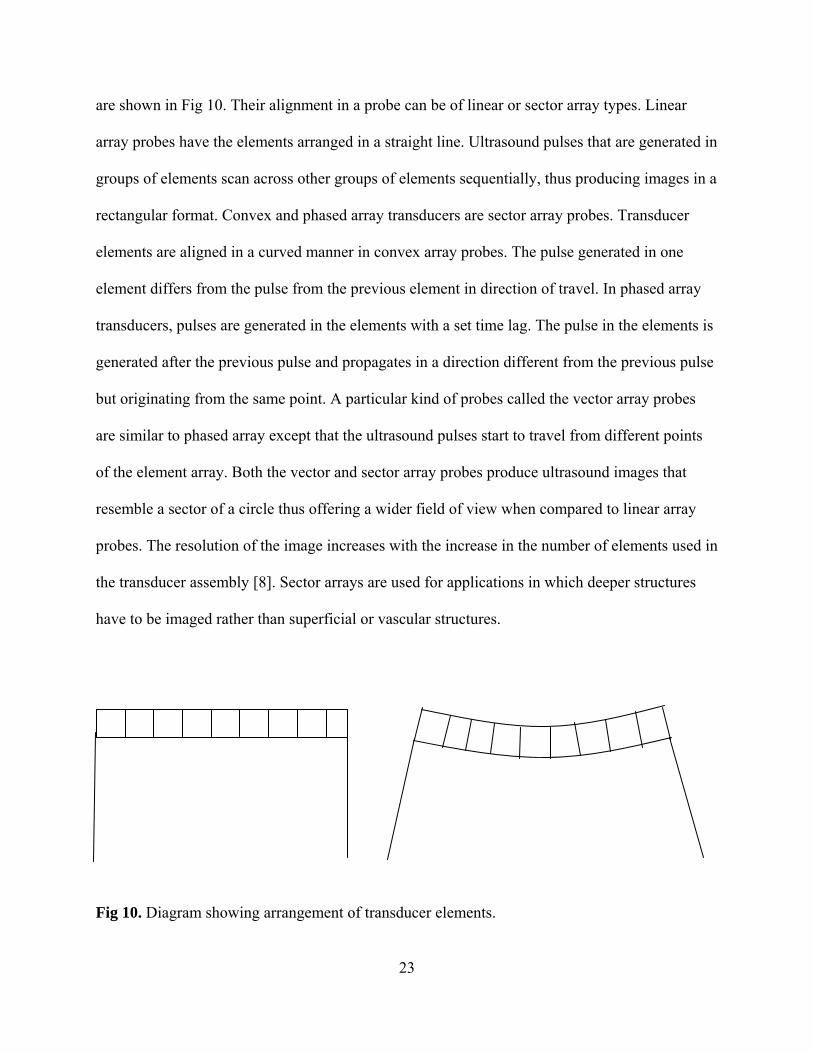
are shown in Fig 10. Their alignment in a probe can be of linear or sector array types. Linear
array probes have the elements arranged in a straight line. Ultrasound pulses that are generated in
groups of elements scan across other groups of elements sequentially, thus producing images in a
rectangular format. Convex and phased array transducers are sector array probes. Transducer
elements are aligned in a curved manner in convex array probes. The pulse generated in one
element differs from the pulse from the previous element in direction of travel. In phased array
transducers, pulses are generated in the elements with a set time lag. The pulse in the elements is
generated after the previous pulse and propagates in a direction different from the previous pulse
but originating from the same point. A particular kind of probes called the vector array probes
are similar to phased array except that the ultrasound pulses start to travel from different points
of the element array. Both the vector and sector array probes produce ultrasound images that
resemble a sector of a circle thus offering a wider field of view when compared to linear array
probes. The resolution of the image increases with the increase in the number of elements used in
the transducer assembly [8]. Sector arrays are used for applications in which deeper structures
have to be imaged rather than superficial or vascular structures.
Fig 10. Diagram showing arrangement of transducer elements.

24
As a convention, the transducers are named with their type and/or their operating
frequency. For example, a linear array 10 MHz transducer is named as L10 in an Acuson system
and L25 in the Sonosite system represents a linear array transducer with an aperture size of
25mm. Probes can either be used invasively or non-invasively. Examples of invasive
applications of ultrasound are transesophageal, endovaginal and catheter based imaging. Probes
that are used for these applications are sterilized after every use. A coupling medium is used
between the transducer surface and the tissue surface to eliminate reflection of ultrasound in air
and help in its transmission to the body. The medium used for diagnostic purposes is a water-
based gel [8].
3.4 Quality of Ultrasound Images
Factors such as resolution and artifacts determine the quality of ultrasound images.
Artifacts are distortions occurring in the image that pose difficulty for accurate diagnosis or
measurement. They can cause objects to be missed and positioned at other locations and depths,
and, falsely display an object that is originally not present in the field of view. A few of the
inherent artifacts that occur in ultrasound images are refraction, grating lobe and shadowing.
Refraction of ultrasound waves, results from a change in the propagation speed when they travel
from one medium to another which can in turn cause changes that can be visualized on the
display. An object can be made to appear at a different location than its original location. Grating
lobe artifacts are inherent artifacts caused due to presence of lobes around the ultrasound beam.
An object’s location is erroneously displayed because of interaction between these lobes and the
object. However, these lobes are of lower intensity when compared to the main beam and are not
sensitive to weak echoes. Shadowing causes areas beneath an object that produces strong echoes

25
to form a dark band and have a shadow-like appearance. These artifacts can be corrected by
implementing changes in the system instrumentation or the transducer assembly, besides having
other electrical equipment away from the ultrasound machine so as to avoid interference [8].
Resolution can be defined with respect to the image or time. Temporal resolution
represents the ability of the system to generate images with the speed in accordance with the
movement of structures in the body in real-time. Contrast and detail resolution are attributes of
image resolution. Contrast resolution indicates the capacity of the ultrasound system to
differentiate between areas having different contrasts in the image. The image is considered to
have good contrast resolution if minute changes in contrast of structures can be discernible.
Detail resolution describes the ability of the system to distinguish two separate close points in the
image without overlapping them. Difference in the quality of images due to detail resolution is
shown in Fig 11. Detail resolution can be split into axial and lateral resolution. Axial resolution
is the least distance between two objects in an image along a scan line for them to be clearly
distinguished as separate sources of signals. Lateral resolution is the least distance between two
objects in an image along the horizontal direction for them to be resolved as separate sources of
signals [8]. In diagnostic applications where the size of an organ or structure needs to be
measured or very small structures are imaged, detail resolution is of prime importance.
In the case of high frequency transducers, better detail resolution is achieved at shallow
regions but decreases at greater depths. With medium frequency transducers, sufficient
resolution is obtained at all depths. In the case of superficial imaging, high frequency transducers
are used to image structures that are close to the skin with exceptional resolution. Transducers
used for animal ultrasound imaging produce high frequency waves to display fine detail with
enough resolution.

26
(a) (b) Fig 11. Diagram demonstrating (a) optimal detail resolution and (b) low detail resolution. Source: Kremkau FW: Diagnostic ultrasound: principles, instruments and exercises. WB Saunders, Philadelphia, PA, 2001.
3.5 Ultrasound Imaging Modes and Features
Three modes offered by the ultrasound scanner are A-mode, B-mode and M-mode. A-
mode stands for Amplitude mode that displays the amplitude of the object echo signal as a
function of time. B-mode called the Brightness mode displays a gray-scale image assigning a
particular brightness to a point on the image based on the echo signal intensity. The Motion
mode(M-mode) ultrasound presents the depth of the structure as a function of time and is mainly
used to image the heart.
Color doppler ultrasound makes use of the doppler effect to evaluate blood flow in the
vascular system. The blood is represented in color while the organs and other structures are
displayed in gray-scale. The blue or red color of the blood on the image is dependent on the
direction of flow with respect to the transducer. Color doppler ultrasound can be used to detect
blockages in arteries and veins or reveal changes in the rate of blood flow in vessels.

27
Pulsed doppler ultrasound provides information about the velocity of blood flow in a
chosen volume of the vessel. This mode can help in diagnosing irregularities in the rate of blood
flow.
The Harmonic imaging feature uses the harmonic content of the returning frequency by
rejecting the fundamental frequency component to offer exceptional image resolution, better
ultrasound penetration in the tissue and reduce certain artifacts. This technique can be used for
contrast-enhanced ultrasound imaging using microbubbles that are destroyed when they come in
the field of view of the ultrasound beam [8].
3D ultrasound renders a three dimensional view of a sample. This feature can give
information regarding the size and extension of structures and their volume. 3D imaging can be
used to study vessels, organs and abnormalities, and blood flow.

28
Chapter 4. Materials and Methods
4.1 Introduction
Theories and experimental protocol designs for evaluating the correlation among the vein
parameters obtained using both the VV and Ultrasound systems (US) are discussed in this
chapter. Preliminary studies that were carried out in order to determine the optimal method of
implementing a standard experimental procedure are detailed. Finally, the step-by-step protocol
followed for imaging veins in subjects is presented.
4.2 Subject Selection and Experimental Setting
The research protocol and the procedures involved were approved by the University of
Tennessee Institutional Review Board. Subjects recruited for the experiments were healthy
normal adults over 18 years of age. The selection of subjects was randomized to arrive at more
generalizable findings from the study. Both male and female subjects were included and those
belonging to any race and origin were considered. Besides age, the exclusion criteria that were
applied for their participation in the study were skin and/or vein disorders of any type. Such
disorders could make the skin appear very dark in a VV image. The total number of subjects
recruited was 21 (Female - 11 Male - 10). Their demographic information and consent for
participation in the study was obtained. The time required to complete each experiment was 45 –
60 minutes.
Venous sites in legs were not included as part of the study because of a possible
difference in performance of the VV device between arms and legs. Therefore, the results from
experiments done on arms and those done on legs could not have been combined to analyze the

29
data as a whole. Analyzing leg images would necessitate a separate study comparing the
performance of the VV imaging system with respect to arms and legs, which would be beyond
the scope of this project.
The VV system was calibrated before every experiment. Similar room settings and
conditions were applied for all experiments. The experiments were carried out with the lights
turned off in the room allowing better visualization of the veins.
4.3 Preliminary Studies
4.3.1 Materials
4.3.1.1 Prototype VeinViewer Imaging System
The prototype VV imaging system consists of a rotatable head mounted on a stand. The
head can be rotated in all directions enabling vertical, horizontal and circular motion. All images
were focused before being captured. To focus, two laser pointers were made to coincide on the
image with the head being moved up or down to focus. Vertical movement of the head caused
the pointers to move either closer or farther from each other, depending on the direction of the
movement. The farther the pointers were from each other, the more out of focus the image was.
4.3.1.2 Ultrasound
The preliminary experiments were done using an Acuson 128 XP/10 ultrasound scanner
(Acuson Inc, Mountain View, CA). The system consists of 128 channels for imaging. It has
software improvements such as ART (Acoustic Response technology) and TCR (Tissue Contrast

30
Resolution) that produce good quality images with high spatial and detail resolution. Many
transducers are compatible with the scanner based on the kind of application. Some of the probe
models provided by Acuson are listed below.
a) Vascular Transducer – L538
b) Abdominal Transducer – C3
c) Vascular and small parts Transducers – L7/L10
d) Endocavity Transducer – EC7
e) Cardiac Transducer – C2
f) Endovaginal Transducer – EV519
The letter denotes the type of application and the number stands for the frequency and/or
aperture size. The transducer used in the preliminary experiments was an L10 EF probe which
allows for the operation within a range of ultrasound frequencies from 5 to 10 MHz. The
abbreviation EF stands for Extended Frequency. The probe aperture size is 29mm and the
arrangement of the piezoelectric elements is a linear array. Since the study involved imaging
only veins and not structures at greater depths, acquiring ultrasound images with a wide field of
view as obtained from curved array probes was not of importance. The scanner consists of
imaging features such as 2D, M-mode, Color Doppler and Pulsed wave Doppler modes.
Each experiment consisted of two stages, the VeinViewer imaging stage and the
ultrasound imaging stage. The parameter to be determined from the VeinViewer stage was vein
contrast and the parameters that resulted from the ultrasound scanning were the vein depth and
diameter. It was necessary to standardize an experimental procedure. Feasibility studies were
conducted to test the viability of experiments in producing meaningful data. Several changes
were made to the design with respect to the materials used and the method of data acquisition.

31
4.3.2 Experimental Methods
4.3.2.1 Stage I – Line Technique
The first set of experiments was done on the whole forearm starting from the anticubital
area down to the wrist. The subject was asked to be seated on a chair and extend his/her arm
forward and rest it on a box. The VeinViewer head was aimed at the anticubital region and four
fiducial points were marked on the image. An image of the veins in that area was captured. The
anticubital region was chosen as the first VV section in all the experiments invariably, since both
the anticubital veins showed a wide variation in contrast along their length. These veins appear
dark at one point, start to fade and almost disappear after a certain point on the VV image. Then,
the VV was aimed at the next section of the arm below the anticubital area in continuation with
the previous section retaining the last two fiducial points and marking the next two points and an
image of the veins for this section was captured. This process of fiducial marking and image
acquisition was repeated up to the wrist.
In order to analyze one location on a vein in a VV image, one had to ensure that the two
imaging modalities measured the parameters at the same point on the vein. This registration of
the two modalities could be made possible by drawing lines of the same length as that of the
width of the field of view with around three or four lines on each VeinViewer segment. These
lines were numbered and drawn approximately equidistant and parallel to each other and,
perpendicular to the length of the arm. Each of these lines indicated the transverse position and
alignment of the transducer during the ultrasound procedure producing a cross-sectional image of
the veins on every line. The numbers on the lines were visible on the VV images, thus making it
easier to correlate qualitatively what could be observed on the VV image and the ultrasound

32
image. This method resulted in a series of VV images with four sections on one arm in which
each section had one or more veins. The VV captures three images for every image captured.
The first one is the unprocessed raw image, the second is a contrast-enhanced image and the
third one is a processed image implemented with the hair removal algorithm.
Ultrasound scanning was performed in the same order in which the VeinViewer images
were acquired. The probe was placed transversely by centering each line along its width. This
resulted in a cross-sectional image of the veins lying under the line. An ultrasound image on
every line along the arm generated a set of images that was used to follow the changes in the
geometrical dimensions of a vein along the length of the arm. An S-video cable output from the
scanner was connected to a computer and the real-time scanned images could be displayed on the
monitor with the help of ATI TV which is an image and video capture program. S-video, which
is an abbreviation for Separate Video, is a four-pin cable that transfers a video signal by splitting
it into two separate components luminance and color instead of combining both components in
one video signal. The ultrasound images were frozen on the machine and were captured using
ATI TV software. The images obtained from both VV and ultrasound procedures are shown in
Fig 12.
However, there were problems associated with this experimental method that may not
have led to precise correlative results. The VeinViewer segments could not be arranged
sequentially using Adobe Photoshop owing to a shift in the position of the images that were
acquired by aiming the VeinViewer on the fiducial points. This image misalignment can be
observed in the Fig 13. Five VV images were arranged such that the vein could be followed in all
of them, but a slight change in the position of each image was observed.

33
Fig 12. VV and ultrasound images corresponding to the veins lying on the second line.
Fig 13. Series of VV images taken of the forearm. These images were aligned using Adobe Photoshop.

34
The error that could be introduced with this experimental technique was beyond
acceptable limits. This implied that the procedure of acquiring images was inaccurate and a more
precise method had to be developed. It was proposed that the same technique could prove useful
when the lines do not appear in the vein and the background areas.
4.3.2.2 Stage II – Tick Mark Technique
The criterion that was established for choosing veins in these experiments was a change
in contrast across a portion of the vein. Veins that were nearly straight over the length of one VV
section were of interest. Tick marks were used on the arm as opposed to lines as in the earlier
experiments. The motivation for using the tick marks was its visibility on the VeinViewer image
under analysis and its absence of effect on the pixel intensity value measurement on a point on
the vein or the background and its indication of the position of transducer placement. The
position of the ultrasound probe on the lines was a critical factor. Any change in the position
during the scanning would yield incorrect results since the exact points on the vein will not be
analyzed on both the VV and ultrasound images. Hence, a careful correlation of the parameter
variations in one vein along a certain length would provide measurements with higher accuracy
minimizing experimental errors.
Fiducial points were marked for each section and five equidistant points on the vein were
chosen with two tick marks drawn corresponding to one point on the vein on both sides. A ruler
was used to draw two corresponding ticks on one line. Two continuous VV sections were used
for each experiment to study changes in the vein parameters along these two sections. Fig 14 is a
photograph of an arm with the tick marks used for the VV procedure. As in the first stage of
experiments, the anticubital area of the arm was chosen as the first section.

35
Fig 14. A photograph of one segment of a vein with tick marks drawn on either side.
The VV head was pointed toward the first section with tick marks and images were
acquired. The same was done for the next section of arm. Images free of these marks were not
captured as in the Stage I experiments since the vein and background area were unaffected by the
ticks on the image and hence, the same images could be used for measurement of contrast. The
raw and processed VV images from the VV procedure are shown in Fig 15.
Ultrasound imaging was performed by positioning the probe on the line joining each set
of ticks and cross-sectional images were acquired. Corel Draw was used to make the
measurements of venous dimensions using the method as will be described later. An experiment
on one arm of a subject resulted in ten ultrasound images, each one representative of a point on
the line joining the ticks. The ticks could not be visible during ultrasound imaging since the
probe covered them and hence another way of marking ticks was adopted. The tick separation on
either side of the vein was increased such that the aperture size of the probe was lesser and this is
illustrated in Fig 16. This optimum distance allowed for the ticks to be visible while scanning.

36
Fig 15. Contrast-enhanced and raw VV images of a vein with equidistant ticks marked close to it.
Fig 16. A contrast-enhanced VV image of a section of the arm with equidistant ticks marked towards the edges of the FOV.

37
For image analysis, a PV Wave program gave the average pixel value in a box drawn on
the area of interest in the raw image. A box was drawn on that point of the vein lying on the line
joining the tick marks and the average value of pixel intensity was obtained in that box. The
average pixel value of an area in the background region next to the same point was calculated.
This was repeated for all the sets of ticks and pixel values for all the corresponding points on the
vein and the background were acquired. Contrast is the difference in the brightness between two
regions of an image. Absolute contrast was calculated using the equation,
Absolute Contrast = (Average Background Intensity – Average Vein Intensity)
The built-in calipers of the ultrasound machine was not used for measuring the
dimensions of veins since the study required precise measurements up to few millimeters and
also measurement during the ultrasound scan would not be feasible due to constraints with
respect to the subjects’ time for the entire experiment. In the event that the analysis produced
ambiguous results, it was possible to obtain measurements from the saved ultrasound images.
The images were imported into Corel Draw Graphics Suite 12 and the measurements were made
by fitting shapes whose dimensions were representative of the size of the area of interest. A
circle was fitted on the vein and horizontal and perpendicular lines were drawn representing the
diameter. The average value of the length of the lines gave the diameter of the vein. Vein depth
was defined as the distance from the surface of the skin to the top surface of the vein in the
image. For the depth measurement, an arc was fit on the surface of the skin in the image and
tangents to the arc and the circle were drawn parallel to each other and a line was drawn
perpendicular to both tangents. The length of the line gave the depth of the vein. Figs 17 and 18
show the method of depth and diameter measurement on ultrasound images, respectively.

38
Fig 17. Picture demonstrating depth measurement of veins using Corel Draw.
Fig 18. Picture demonstrating diameter measurement of a vein using Corel Draw.

39
Holding the transducer in position for a certain amount of time in order to obtain a good
ultrasound image was not possible most of the times. As a result, images were not captured on
the region of interest and this possibly giving rise to errors in the diameter and depth
measurements. Also, having equal distances between the ticks did not facilitate choosing
particular points of the vein between the ticks to be analyzed.
4.3.2.3 Stage III – Dots and Ticks Technique
Considering the reasons already mentioned, it was determined that obtaining ultrasound
images with the transducer positioned longitudinally on the vein would provide a better method
for analysis. During the VV imaging procedure, two dots were marked beside the chosen vein
with a distance that was the aperture size of the L10 probe i.e. 29mm between them. 4 or 5 ticks
were marked between these dots. Both dots and ticks were marked using ink that was visible in
infrared light. These ticks were marked next to points on the vein that demonstrated differences
in contrast between each other and therefore were not necessarily equidistant. Fig 19 is a
photograph of an arm with the tick marks and dots. Fig 20 shows the processed and raw VV
images of the section of the arm that were captured.
The subjects placed their arm in a tub filled with water. The transducer was set
longitudinally on the two dots first, and then moved onto the vein carefully such that the image
field of view covered the length of the vein corresponding to the distance between the two dots.
Two such images were captured. Cross-sectional images were also obtained by placing the probe
on the tick marks so that each tick was at the center along the width of the probe. The images
collected from both these methods were used for analysis for cross-confirming the results
obtained. The laser pointer appeared as a bright spot during image analysis as seen in Fig 21.

40
Fig 19. A photograph of a section of vein with dots and ticks.
Fig 20. Raw and contrast-enhanced VV images of a vein with ticks marked at unequal distances.

41
(a)
(b) Fig 21. Raw VV images of a vein under analysis. The boxes were drawn (a) on the vein next to the tick marks (b) in the background region next to the vein. Each of these boxes gives an average pixel intensity value over the area in them.

42
The absolute contrast was calculated as the difference between the brightness values of
background and vein regions as explained in the previous section. In images where the laser
pointer was visible on the vein in the raw image, the contrast was a negative value since the
pointer appeared brighter than the background region. Conversely, if the pointer fell on the
background region, the difference between the pixel intensities of vein and background was very
high resulting in a greater value of contrast than the actual. To avoid the visibility of the laser
pointers on the VV image, the pointers in the VV head were covered with magic tape before
capturing every image. The depth and diameter of the veins were measured on every cross-
sectional image acquired on each pair of ticks.
4.4 Final Experimental Design
4.4.1 Materials
4.4.1.1 VeinViewer Imaging System
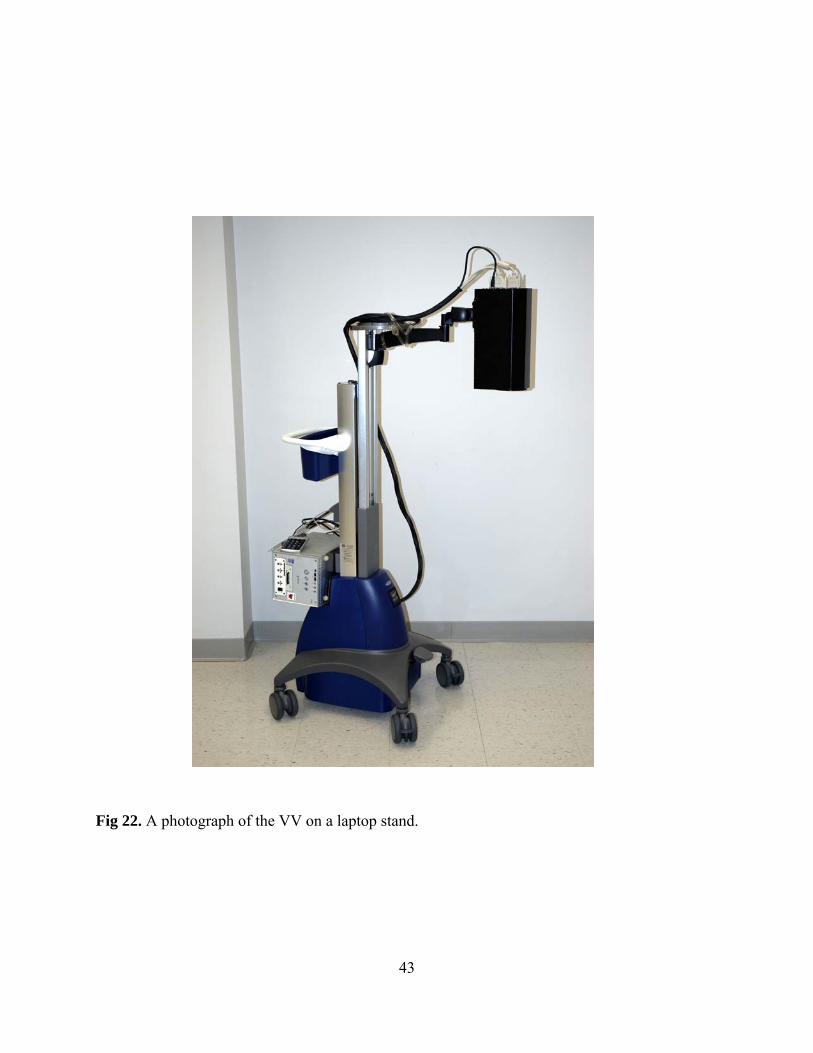
Besides the prototype VV system, the newer stand model was used for these experiments.
The battery supply was set at the foot of the stand as opposed to a separate UPS backup
connected to the device. This model was originally designed as a laptop computer stand with a
battery and a counter for the laptop. The design was modified from its original by fixing a
column for the spring to allow vertical movement of the VV head. The images were focused by
moving the head up and down to bring the laser pointers together as described earlier. The
mechanical design with the VV head mounted on a laptop stand is shown in Fig 22.
43
Fig 22. A photograph of the VV on a laptop stand.

44
4.4.1.2 Ultrasound
The ultrasound scanner used for the experiments with a revised protocol was an ATL
HDI 5000 system with a Linear 12-5 MHz transducer. In addition to B-mode and M-mode, the
system offers Doppler, Power, Color flow, 3D imaging and contrast-enhanced ultrasound. It is
used for a wide variety of applications such as Cardiology, Vascular, Obstetrical, Abdominal and
small parts imaging.
4.4.2 Experimental Methods
4.4.2.1 Type I – Veins with Varying Contrast
Due to the limit on the number of veins that could be detected by the Acuson system in
terms of size, an ultrasound scanner which provided better resolution was required. The next set
of experiments detailed in this section was performed on veins sufficiently big enough for the
ATL HDI 5000 ultrasound machine to detect. A major number of these veins included the
anticubital veins due to their large diameters and rapid changes in depth along a portion of the
veins. A few test experiments were carried out with the Acuson 128XP/10 ultrasound machine
using the L10 probe.
The protocol in this stage and the final experiments did not involve the use of tourniquet
because of distortion in the vein shape and size that can be caused by it. In order to link the
measurements obtained from both the VV and ultrasound images accurately, the same segment
of the vein needed to be analyzed. Magic tapes were used as image markers. The purpose of
using magic tape was its visibility and its clearly defined edges on the raw VV image and, the
appearance of a band of shadow beneath it when imaged using ultrasound. However, one strip of

45
tape though visible on the VV image was not distinguishable on the ultrasound image since the
shadow could not be clearly seen. Another equal sized piece of tape stuck on the top of the first
piece of tape proved to be adequate.
The steps in the VV procedure involved selecting a part of a vein where it appeared very
dark on the image and faded away. The two strips of tape were distanced at 32 mm
approximately since the separation of the chosen segment was required to be less than the 38 mm
aperture size of L12-5 transducer for both the magic tapes to be discernible on the ultrasound
image. Both pieces of tape were positioned perpendicular to the vein for the background region
to be of the same length as that of the vein in order for the corresponding lengths to be analyzed.
The VV was focused and the laser pointers were covered with magic tape before capturing the
images. The subjects were required to stretch their arms for the incident infrared light from the
VV head to be almost perpendicular to the skin surface. As a convention, images were captured
sequentially starting from the anticubital region of the right arm downwards and then anticubital
veins of the left arm downwards. After image acquisition, ticks were marked on the vein along
the strips of magic tape to provide for locating the exact probe position during ultrasound
imaging. These tick marks provided information on the position and orientation of the vein in the
segment.
Ultrasound imaging with the ATL HDI 5000 scanner was performed with ultrasound gel
as the medium due to less space available in the laboratory for using a water bath. The probe was
disinfected with Isopropyl alcohol before each use. The scan head was set to Peripheral
Vascular/Venous mode and the depth setting was adjusted based on the depth of the chosen vein.
The transmit zone setting was also set based on the area that needed to be imaged. The images
obtained from the VV procedure and ultrasound scan are shown in Fig 23.

46
Fig 23. VV and ultrasound images of a vein demonstrating variation in contrast and depth over its length. The shadow beneath the magic tapes can be observed on both sides in the ultrasound image.
For accuracy purposes, the subjects had to stretch their arms in order for the skin in the
chosen segment of the anticubital region to be as flat as possible without the fold at
the elbow causing a bend which could be seen in the ultrasound image. This was required as
bending the arm would cause the distance between the tapes to be lesser than when imaged
during the VV procedure. Images were obtained with the transducer placed longitudinally along
the veins. The probe was placed in such a way that both the tapes were visible in the image. They
appeared as hyperechoic layers on the surface of the skin. Two ultrasound images were captured
for each section. The aperture size of 29mm of L10 probe limited the length of the segment of
vein for analysis. The L12- 5 probe provided a wider field of view.
Anticubital veins are found in the mid arm which is the joint. Folds cause the veins in this
area to appear to be of higher contrast than they showed. Hence in these experiments, sections of
veins below the joint in both arms were preferred. However it was not possible to obtain data

47
from these veins in all the subjects since these veins would not be visible in subjects with
significant subcutaneous fat. Sufficient data could not be obtained solely from these experiments
to perform statistical analysis and draw valid conclusions.
4.4.2.2 Type II – Veins with Constant Contrast
Veins whose contrast remained approximately constant over a small length of the arm
were chosen, thus having nearly unvarying diameter over the same segment. Pieces of magic
tape were used on the skin to define the area of interest and serve as markers for image
registration during ultrasound imaging. To avoid bias in data due to chosen vein sizes, veins with
contrast values that ranged from very small to large were employed. The actual sizes and contrast
values of the veins that were chosen are detailed in the next chapter. This study included veins
above the elbow which are at greater depths when compared to those in the forearm. During VV
procedure, the pieces of tape were distanced at almost the same length as the width of the
ultrasound probe which was approximately 11mm, owing to a very negligible variation possible
in the vein diameter over the length of the small segment. These pieces of tape were placed
perpendicular to the vein and parallel to each other for analyzing the same portions of the
background and vein regions. After the vein was chosen, the VV was focused and the pointers
were covered with magic tape before acquiring data. In most of the cases, there was more than
one vein in the field of view of the ultrasound probe and hence tick marks on the vein after VV
image acquisition served to indicate the location of the vein during ultrasound scanning. This
method of identifying the correct vein will be explained later. Fig 24 shows the tick marks drawn
along the pieces of tape on the arm.

48
Fig 24. A photograph of a section of the arm with ticks drawn after the VV procedure.
For these experiments, ultrasound imaging was performed using Aquasonic gel instead of
water as the medium. Cross-sectional ultrasound images were captured for these veins. A
technique to prevent distortion of venous dimensions while scanning was followed. Sufficient
ultrasound gel visible on the skin surface eliminated the possibility of compressing veins with the
probe. Veins appear circular when seen in cross-section but improper positioning of the probe
can cause the veins to seem elongated in the horizontal direction. The probe was aligned such
that it was perpendicular to both the longitudinal and lateral axes of the veins which produced
ultrasound images of a circular cross-section. Not placing the transducer perpendicular to the
vein but at another angle would result in an elliptical cross-section on the image.
The results initially obtained from the experiments done below the arm contained many
data points at shallow depths and very few at great depths. The types of veins chosen during the
VV procedure were limited by their clear visibility on the VV image and hence only those veins
were chosen that could be discernible on the image. These veins were not present at great depths
in the forearm. Experiments performed above the elbow yielded results at great depths. For these

49
experiments, the vein had to be selected using the ultrasound scanner by imaging the area above
the anticubital region in both arms. Veins could be found at higher depths than those obtained
previously. First, the transducer was placed such that the vein appeared circular in the cross-
sectional image and the probe was perpendicular to the length of the vein. Images were acquired
on the computer after freezing the ultrasound image on the scanner. Ticks were marked along the
edges of the probe on both sides which indicated the position of magic tapes for VV imaging.
Also, the location of the vein was could be determined by centering the vein on the ultrasound
image and marking ticks at the center of the probe. The ticks were drawn such that they would
not appear in the field of view when imaged with the VV device.
The area was washed with water to remove traces of ultrasound gel. During the VV
procedure, magic tapes were put along the tick marks such that the inner edges of the tapes lied
on them. The segment between the inner edges of tapes was imaged with the VV. Since the vein
could not be clearly detected due to its very low contrast with respect to the background, the part
with the ticks representing the vein location was kept at the center of the image to serve the dual
purpose of even illumination in the background areas and accuracy of positioning the box on the
vein during image analysis.
All the ultrasound images were saved on a computer and used for analysis later.
Therefore in several cases where two or three veins were present in the field of view it was
necessary to have the vein of interest at the center of the image to avoid analyzing the other
veins. In such situations, the ticks were used as indicators such that it could be made certain that
the transducer was placed in between the magic tapes with the tick at the center. This produced
images with the selected vein at the center of the image. In cases where two veins were very
close to each other, pressing the skin on the tick mark caused a dip on the skin surface as seen on

50
the ultrasound image and also compressed the vein, thus offering another method to recognize
the chosen vein and center it on the image.
The results from the procedures described in this section were used for image analysis to
measure the Contrast, Depth and Diameter of the veins. The approaches used for image analysis,
challenges that were encountered, and steps taken to overcome them are detailed in the next
chapter. Statistical analysis performed to determine the effect of the geometric dimensions of
veins on Contrast, and finally, the conclusions that were made based on the statistical results are
explained.

51
Chapter 5. Results and Discussion
5.1 Introduction
In this chapter, methods of analyzing VeinViewer and ultrasound images to determine the
parameters of concern are presented. The data was analyzed statistically to arrive at a conclusion
based on the relationship between the parameters and the strength of correlation between them.
5.2 VeinViewer Image Analysis
VV images resulting from the experiments were used for the measurement of contrast at
chosen areas of the vein. Only raw images were analyzed for contrast measurement. A program
written in PV Wave was used for measuring the pixel intensity value over a region of interest. A
rectangular box of variable size was positioned on the portion of the vein to be studied. It was
carefully drawn on the part of the vein between the pieces of magic tape. The width of the box
was changed according to the width of the vein. The program calculates pixel intensity values
along the vertical line at every point in the box. It outputs an array of those intensity values at
each point along the length of the box in arbitrary units. The array was averaged over every 4
points to obtain smooth data. Contrast is defined as the difference in the signal intensities of dark
and light parts in an image. In the VV image, the vein appears dark and the background appears
light. To measure the contrast of the vein with respect to the background area, the definition of
relative contrast used was given by,
Relative Contrast = (Background Intensity – Vein Signal Intensity)
Background Intensity
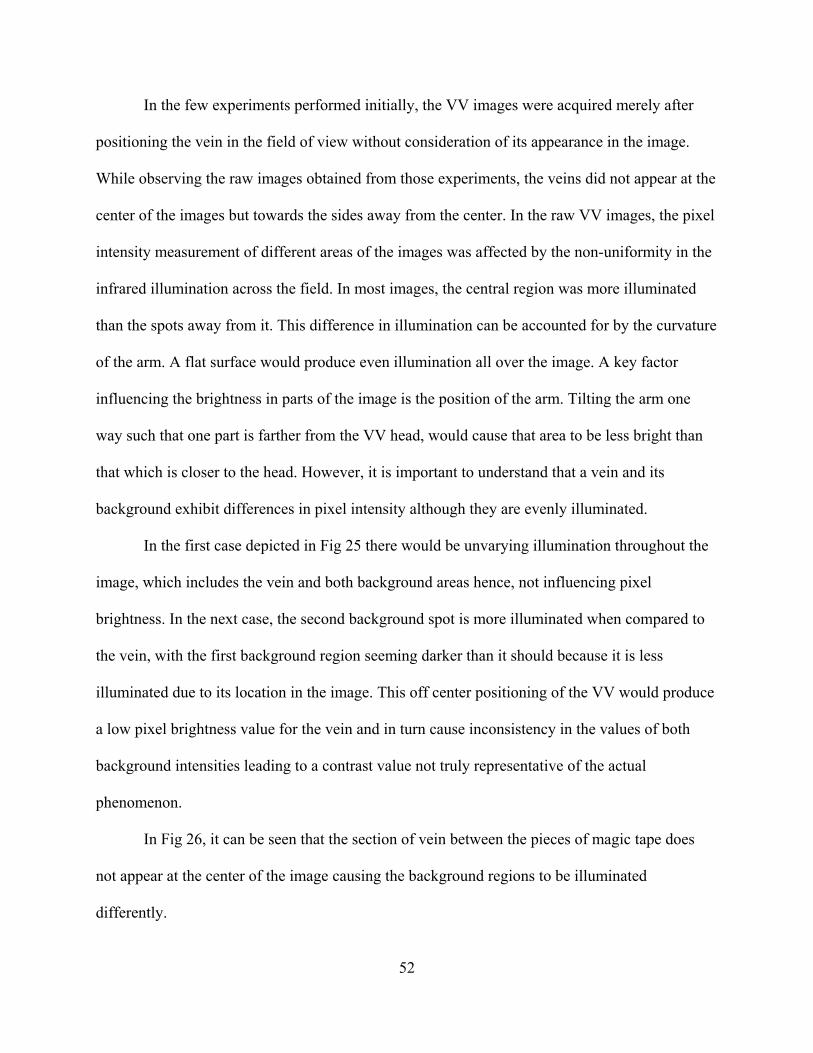
52
In the few experiments performed initially, the VV images were acquired merely after
positioning the vein in the field of view without consideration of its appearance in the image.
While observing the raw images obtained from those experiments, the veins did not appear at the
center of the images but towards the sides away from the center. In the raw VV images, the pixel
intensity measurement of different areas of the images was affected by the non-uniformity in the
infrared illumination across the field. In most images, the central region was more illuminated
than the spots away from it. This difference in illumination can be accounted for by the curvature
of the arm. A flat surface would produce even illumination all over the image. A key factor
influencing the brightness in parts of the image is the position of the arm. Tilting the arm one
way such that one part is farther from the VV head, would cause that area to be less bright than
that which is closer to the head. However, it is important to understand that a vein and its
background exhibit differences in pixel intensity although they are evenly illuminated.
In the first case depicted in Fig 25 there would be unvarying illumination throughout the
image, which includes the vein and both background areas hence, not influencing pixel
brightness. In the next case, the second background spot is more illuminated when compared to
the vein, with the first background region seeming darker than it should because it is less
illuminated due to its location in the image. This off center positioning of the VV would produce
a low pixel brightness value for the vein and in turn cause inconsistency in the values of both
background intensities leading to a contrast value not truly representative of the actual
phenomenon.
In Fig 26, it can be seen that the section of vein between the pieces of magic tape does
not appear at the center of the image causing the background regions to be illuminated
differently.

53
(a) (b)
Fig 25. Diagram demonstrating the effect of infrared illumination of the VV on pixel brightness. Cross-sectional view of the arm showing the skin surface (a) with the vein at the center of the VV image and uniform illumination in the vein and background regions (b) with the vein off the center in the VV image field and uneven illumination in the vein and background areas.
Fig 26. Raw and processed VV images of a vein in the arm of a 25 year old female.

54
A box drawn across the vein and the background regions as in Fig 27 gives the intensity
profile. The first segment of the plot in Fig 28 depicts the intensities in one background area, the
range of low intensity values represent the vein and the second stretch of intensities higher than
that of the vein belongs to the other background region. The average intensity value over the first
background region is higher than that of the other which is the result of uneven illumination.
Steps were taken during experiments to avoid bias in measurements attributed to differences in
the levels of illumination. The arm was positioned so the direction of light from the VV head
would be perpendicular to the skin surface making the vein appearing at the center of the VV
image as seen in Fig 29.
It can be inferred from the plot in Fig 30 that both the background areas were uniformly
illuminated since the ranges of intensities are at the same level. It also should be noted that there
is a small amount of spread near the low intensity vein in the image accounting for the absence
of an immediate drop in the intensity level from the high to a low value.
Fig 27. Raw VV image with the box covering the two background regions and the vein.

55
Fig 28. Intensity profile across a region covering the vein and both background regions at different pixel intensity levels.
Fig 29. Raw and contrast-enhanced VV images of a vein in the arm of a 35 year old female. The vein appears at the center of the image. Even illumination in both background areas can be noticed.

56
Fig 30. Intensity profile across a region covering the vein and both background regions at the same pixel intensity levels.
In images in which the veins were at or very close to the center, there was equal
illumination on both sides of the vein making the contrast measurement unbiased. The
background intensities measured on both sides of the veins were nearly equal. However,
although it was made certain that the vein appeared at the center of the image every time during
VV image acquisition, few images resulted with the vein not located exactly at the center but
near it owing to difficulty of the subject in holding the arm still for few seconds in that position.
Hence, very small differences in the measured background intensities in those images were
observed. Choosing only one background region among the two for the analysis would produce
inaccurate results due to the influence of its location in the image. To avoid ambiguity in the
measurements, the intensities of both the background regions on either sides of the vein were
averaged.
The relative contrast was given by,
Relative Contrast = (Average Background Intensity – Vein Signal Intensity) Average Background Intensity

57
5.2.1 Veins Varying in Contrast
As mentioned earlier, longitudinal ultrasound images were acquired to study veins that
varied in contrast and depth. VV images in Fig 31 show such a vein. The output array was scaled
with the length of the vein between the pieces of magic tape on the ultrasound image in order to
observe the same point of the vein on both the images. The points were chosen on the ultrasound
image and the dimensions of the vein at those points were measured in millimeters. For every
vein, about 8 points were selected for analysis. Then, the corresponding location on the VV
image was selected in the output array and the pixel brightness was noted. The two background
arrays were scaled and the intensities corresponding to one point were averaged. The pixel
values at points next to those selected on the vein, in both background areas were measured and
averaged. Fig 32 shows VV images with the boxes on the vein and background areas. It can be
observed from Fig 33 that the pixel intensity decreases across the portion of the vein suggesting
that the vein appeared bright on one end, gradually turned lighter and became visibly darker
towards the other end.
Fig 31. Raw and processed VV images of the veins in a 23 year old female subject. The vein demonstrates a variation in contrast between the magic tapes.
58
(a)
(b) (c)
Fig 32. Raw VV images showing the box positioned on the vein between the tapes. The box appears (a), at the background region (b) and at the background region on another side of the vein (c).

59
INTENSITY PLOT
0.7
0.75
0.8
0.85
0.9
0 10 20 30 40 50 60
Pix
el In
tens
ity
Fig 33. Plot of pixel intensity values at every point of the box drawn on a vein varying in depth in the VV image. The vein studied is the same as in Fig 32.

60
5.2.2 Veins Constant in Contrast
VV images of veins that did not vary in contrast were analyzed by averaging the
intensities. The vein in Fig 34 appears to have constant contrast over a small portion. A
rectangular box was drawn over the region of the vein, which was about 1cm in length between
the pieces of magic tape. The width of the box was varied according to that of the vein chosen.
The average pixel intensity of the vein area was calculated by averaging the values in the output
array. Then, boxes were drawn on the both background regions next to the vein and the average
background intensity of both regions in the boxes was obtained. The relative contrast of the vein
was again calculated using the same formula as given earlier. Fig 35 shows a plot of the pixel
intensities along the part of the vein between the strips of tape and the values remain fairly
constant over the length. The veins above the anticubital region produced very low contrast with
respect to the background on the VV image since they are at greater depths.
Fig 34. VV images acquired on a 24 year old male’s arm with the chosen vein at the center of the image. The vein demonstrates no variation in contrast over the segment between the pieces of magic tape.

61
INTENSITY PLOT
0.7
0.75
0.8
0.85
0.9
0 5 10 15 20 25
Pixe
l Int
ensi
ty
Fig 35. Plot of pixel intensity values at every point of the box drawn on the vein with constant contrast.

62
5.2.3 Possible Irregularities in Measurement
In order to maintain consistency in the manner the data was acquired, all the experiments
were performed with similar settings in terms of room illumination and the techniques used. The
part of arm used for the study was cleaned with soap and swabbed with alcohol prior to the VV
imaging procedure of every experiment to remove skin oils. It was suspected that the presence of
oils in the skin could cause specular reflection thus having an effect on the VV image quality.
Hair appearing on the VV image disrupts the pixel intensity measurement. Areas even
with little hair produce a lower intensity value when measured. The arm was shaved to avoid the
visibility of hair on the VV image. It was particularly made certain that hair did not appear on the
vein and background locations, although in subjects with lot of hair on their arms, hair follicles
showed up on the image despite shaving. VV images in Fig 36 show hair appearing in the image
after shaving. However, they caused negligible effect on the measured pixel intensity value since
the intensities were averaged over every four points in the output array to smooth the data.
Fig 36. Raw and processed VV images of a section in the arm of a 24 year old male.
63
In the above images, the vein is at the center of the image and appears faint. The subject’s
arm was shaved despite which the hair follicles were visible in the image. They can be observed
as black spots in both VV images. Marks on the skin such as moles and bruises, both of which
can be seen as dark spots in the VV image generate low pixel intensity values.
5.3 Ultrasound Image Analysis
Ultrasound images were used for the measurement of depth and diameter of the veins
which were already imaged with the VV device. As detailed earlier, the ultrasound images
obtained from the experiments performed using techniques such as dot and tick-mark methods
were analyzed with the software Corel Draw Graphics Suite 12. The images which resulted from
the experiments using the magic tape technique were printed on a piece of paper and the
dimensions of veins were measured with a ruler. The aspect ratio of the printed image was
maintained as in the original image. A perpendicular line from the top of the vein wall to a
tangent to the top of the skin surface at that point, gave the depth of vein. Despite care being
taken to place the probe perpendicular to the vein both laterally and longitudinally, a few images
resulted with slightly elongated veins. The diameter of the veins was an average value of the
diameter measured in the horizontal and vertical directions. All the measurements were done in
millimeters.
5.4 Statistical Analysis
The parameters resulting from the image analysis were Contrast, Depth and Diameter of
different veins in various subjects. Data was collected from 133 veins of different dimensions
and contrast in 21 different subjects. The number of male (n=10) and female (n=11) subjects

64
recruited for the study was nearly the same to avoid gender-based bias in the results. In this
study, it was hypothesized that the depth and diameter of a vein influence its visibility on the VV
image. In statistical terms, there is a correlation between contrast and depth and, contrast and
diameter. However, it was to be determined if the contrast could be expressed as a function of
both depth and diameter. If the variation in contrast of the vein has to be explained by the
variation in its depth or diameter, then contrast is the response or the dependent variable and the
depth and diameter are the independent variables.
The bivariate scatter plot of contrast and depth in Fig 37 demonstrates curvilinearity
between the two variables of veins with different diameters. It can be observed from the plot that
as the depth of the vein increases, its contrast as seen on the VV image decreases. The veins
appear fainter on the VV image when they are located at greater depths while shallow veins seem
darker. The thickness of the skin surface was around 1mm due to which there were no veins
found between the depths of 0mm and 1mm. The most superficial vein in the study was located
at a depth of 1.09mm. The cluster of points between the depths of 1mm and 2.5mm is due to
greater amount of data acquired on shallow veins than those at great depths. The observations
between 5mm and 7mm were mostly obtained from the results of the second set of experiments
done above the anticubital area. The deepest vein that was detected was at 6.71mm in the arm.
Veins at greater depths predominantly had bigger diameters and depicted a reasonably high value
of contrast; however beyond a certain threshold of depth, there was no significant change in
contrast with bigger diameter. Fig 38 shows the regression fit plot for the same.
All fits were performed at a 95% confidence interval meaning that in order for the
relationship between the parameters to be significant, the p-value of the test was required to be
less than 0.05 [15].

65
Fig 37. Plot of contrast and depth of all the veins of different diameters.
1 3 5 7Depth (mm)
0
0.025
0.05
0.075
0.1
0.125
0.15
Con
trast

66
Fig 38. Bivariate fit of contrast by depth.
1 3 5 7Depth (mm)
0
0.025
0.05
0.075
0.1
0.125
0.15
Con
trast

67
5.4.1 Contrast-Depth Correlation
The curvilinear relationship between the contrast and depth can be explained by an
exponential fit of the data. The curve denoting the regression fit emphasizes the negative
correlation between the contrast and depth of veins. The regression was performed at a
confidence interval of 95%. An R-squared value of 0.465 was obtained from the exponential
curve fit which establishes that 46.5% of the variability in the response variable, contrast can be
explained by the variable, depth. The R-squared value is a statistical measure that describes the
strength of a regression fit. A value of p<0.0001 was obtained which ascertains that the
correlation between the two parameters, is statistically very significant.
5.4.2 Contrast-Diameter Correlation
The points on the plot were obtained from veins at different depths in the arm. The
smallest vein detected in this study had a diameter of 0.22mm and the largest vein was 5.08mm.
An irregular scatter can be observed below the diameter of 3.5mm at all values of contrast as the
points are spread throughout. But, there are few data points between the diameters of 3.5mm and
5.1mm that possess low contrast values. It is expected that the contrast would be the greatest for
veins at bigger diameters. A visual evaluation of the data, excluding that acquired at bigger
diameters, suggests that there is a positive correlation between the two parameters.
The plot in Fig 39 demonstrates a threshold effect. Due to few points beyond diameter
3.5mm, a simple linear regression seen in Fig 40 generated a line with a decreasing trend with an
R-squared value of 0.0329. This implies that only 3.29% of the variation in the contrast of the
veins can be explained by their diameter, which is not significant. A p-value which determines if
the slope of the regression line is 0 was found to be 0.036 indicating that the fit is significant.

68
Fig 39. Plot of contrast vs. diameter of veins at different depths.
0 2 4 6Diameter (mm)
0
0.025
0.05
0.075
0.1
0.125
0.15
Con
trast

69
Fig 40. Bivariate fit of contrast by diameter.
0 2 4 6Diameter (mm)
0
0.025
0.05
0.075
0.1
0.125
0.15
Con
trast

70
It is important to understand that the trend of the plot was affected by the absence of data
points with veins of size 3.5mm and higher. Not considering the data that was collected in that
range, produced a linear fit with a slightly increasing trend. The reason for the negative
correlation between contrast and diameter can be explained by the fact that the number of points
beyond the diameter of 3.5mm is very little for the fit to be an accurate representation of the
actual phenomenon. Regression analysis would provide a better prediction model if there were
more data on veins at small depths but with diameter of 3.5mm and above, which is expected to
produce high vein contrast. Although, when diameter values were plotted against depth, a linear
relationship between the variables could be observed.
From the plot shown in Fig 41, it can be interpreted that the diameter tends to increase
with an increase in the depth of the vein. Both depth an diameter values are in millimeters. From
the statistical regression analysis summary, the p-value was found to be less than 0.0001 which
signifies that the test was strongly valid. The report gave an r-squared value of the fit of 0.34
which suggests that the variable ‘depth’ can account for 34% of the variability in the variable
‘diameter’. The cluster of points between 1 and 2mm of depth are primarily because more data
was collected on veins at shallow depths and smaller diameters. A linear fit of the plot explained
that veins with bigger diameters could be mainly found only at bigger depths and not
superficially which accounts for the missing points on the plot of contrast and diameter. In this
study, the forearm region contained the veins which ranged from small to medium sized at
superficial depths, and the veins in the anticubital area and above mostly were deep and not
bigger than 3.5mm in size. However, more data needs to be acquired in order to validate this
statement. Locating big-sized veins at shallow depths would further illustrate the increasing trend
of diameter with increasing contrast.

71
Fig 41. Bivariate linear fit of diameter by depth.
1 3 5 7Depth (mm)
0
1
2
3
4
5
6
Dia
met
er (m
m)
72
5.4.3 Correlation at Specific Ranges of Variables
The behavior of contrast with a change in either variables depth or diameter independent
of a change in the second variable can be clearly understood by plotting contrast and one of the
two independent variables while holding the other constant. A plot of contrast and depth at
different ranges of diameters is shown in the Fig 42. Data were chosen with the consideration
that the contrast would not significantly change over a range of 0.5mm diameter. Contrast is
plotted as a function of depth at two ranges of values for diameter. Data were obtained from
different subjects between the diameter ranges of 1 – 1.5mm and 2.5 – 3mm. Exponential curves
fit to the data points show a decreasing trend signifying the negative correlation between the two
variables. R-squared values of 0.57 and 0.74 were obtained for the plots at the diameter ranges of
1 – 1.5mm and 2 – 2.5mm respectively. Fig 43 shows the data scatter and linear curve fit for the
plot of contrast and diameter at two ranges of depths with the assumption that contrast over a
range of 0.5mm depth would remain roughly constant. The resulted R-squared values were 0.12
at depths between 1 – 1.5mm and 0.48 at depths between 2 – 2.5mm. It is expected that more
data at all depths and diameters would exhibit similar relationship between the variables.
5.4.4 Contrast – Depth Correlation along Anticubital Vein
Data obtained along anticubital veins were plotted to study the manner in which contrast
changes at different depths over a portion of a vein with more or less the same diameter. Fig 44
shows contrast plotted against depth for two such veins in different subjects. The exponential
curve in blue is a fit for data acquired at diameters between 3 – 3.5 mm and that in red
corresponds to the data acquired at diameters between 2.5 – 3 mm and produced R-squared
values of 0.95 and 0.97 respectively.

73
Fig 42. Plot of vein contrast and depth at diameters of 1 to 1.5 mm (red) and 2.5 to 3 mm (blue).
Depth (mm)
0 1 2 3 4 5 6
Con
trast
0.00
0.02
0.04
0.06
0.08
0.10
0.12
0.14
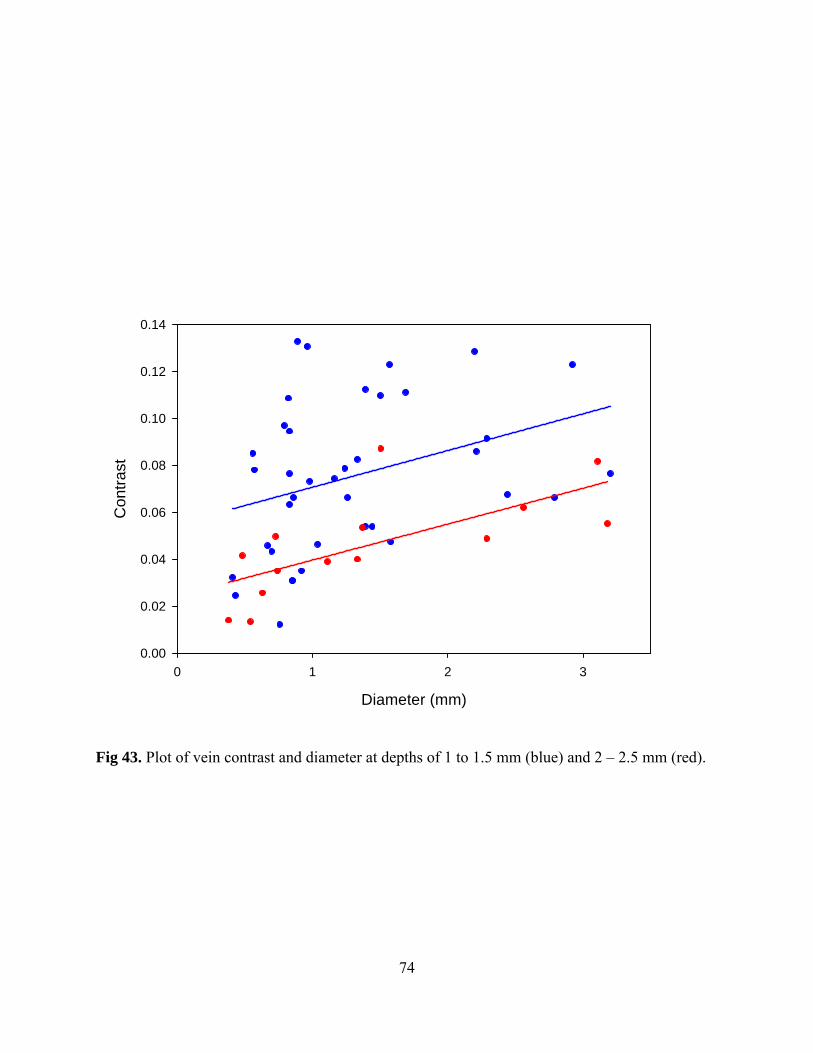
74
Fig 43. Plot of vein contrast and diameter at depths of 1 to 1.5 mm (blue) and 2 – 2.5 mm (red).
Diameter (mm)
0 1 2 3
Con
trast
0.00
0.02
0.04
0.06
0.08
0.10
0.12
0.14

75
Fig 44. Plot of vein contrast and depth along two veins in two different subjects.
Depth (mm)
1 2 3 4 5 6 7
Con
trast
0.00
0.02
0.04
0.06
0.08
0.10

76
5.4.5 Interaction between Vein Depth and Diameter with Contrast
It was expected that vein contrast seen in the VV image would be a function of both
depth and diameter. But, a multiple regression analysis to investigate the influence of the
interaction between both depth and diameter on the contrast of the vein revealed that there was
no relationship between them yielding a p-value of 0.37 with the test performed at a confidence
interval of 95%. This result can be confirmed by obtaining more data in wider ranges of depth
and diameter.
5.5 Discussion
Previous studies have been done for the assessment of the performance of the
VeinViewer with respect to its instrumentation for making improvements. Quantitative
evaluation to determine the best components and optimal specifications have been performed
experimentally. Studies to assess the usefulness of the device qualitatively were carried out in a
clinical setting on pediatric subjects. However, a quantitative study was necessary to evaluate the
performance of the VeinViewer system in terms of the physiological aspects of veins. It can be
concluded from the study that there is a significant correlation between the depth of the vein and
its contrast seen on the VV image. The more superficial the vein is, the better it can be seen on
the image. On the other hand, data acquired on veins close to the surface of the skin but having
large diameters would have provided us with more meaningful results to help better understand
the effect of diameter on the contrast of veins. Conversely, there is a linear correlation between
depth and diameter of veins which shows that very few such veins can be found in the arm. With
the sample size of this study, a relationship between contrast and a function of both depth and
diameter of veins could not be established.

77
5.6 Future Work
Children possess very small veins that are hard to find even by skilled physicians and
phlebotomists. Clinical data has proven that the VeinViewer system is effective in showing veins
in children. Data similar to that collected in this research, on pediatric subjects to investigate the
performance of the device quantitatively would provide better knowledge of its working leading
to improvements in hardware and software. Experiments performed on legs in subjects could be
used to compare its results with those obtained on the arm to estimate the effect of tissue
composition on the contrast of the vein in the VV image. The scope of this study included
studying the relationship between three parameters of the vein: contrast, depth and diameter.
Width of the veins could be considered as an additional response variable to determine the extent
of influence that venous dimensions have on the vein’s spread seen on the VV image.

78
List of References

79
1. Albrecht H, Muller G, Philipp C: State-of-the-art of safety technology in medical uses of lasers. http://info.tuwien.ac.at/iflt/safety/refs/albre91.htm Accessed July 3, 2006.
2. Charles Sturt University: Medical Physics, Ultrasound. http://hsc.csu.edu.au/physics/
options/medical/3016/PHY961netdraft.html#3 Accessed May 26, 2006. 3. De Ritis S: Collecting the best specimen. http://laboratorian.advanceweb.com/common/
editorial/editorial.aspx?CC=34103 Accessed July 1, 2006.
4. Ernst D J: Difficult draws. Center for Phlebotomy Education, Inc., Ramsey, IN, 2004.
5. Glantz S A: Primer of biostatistics. McGraw-Hill, New York, NY, 1997.
6. Global Spec. http://industrialsprings.globalspec.com/LearnMore/ Mechanical_Components/Springs/Constant_Force_Springs Accessed July 7, 2006.
7. Jacques S L: Skin optics. Oregon Medical Laser Center News, Oregon, Jan 1998.
8. Kremkau FW: Diagnostic ultrasound: principles, instruments and exercises. WB Saunders, Philadelphia, PA, 2001.
9. Krishnaswamy A and Baranoski G V G: A study on skin optics. Technical Report,
Canada, January 2004. 10. Light Therapy Products: LED treatments through deep penetrating light.
http://www.lighttherapyproducts.com/LEDtreatments.html Accessed July 2, 2006. 11. Lovhoiden G: Design of a prototype vein enhancing illuminator. PhD Dissertation,
University of Tennessee Health Science Center, Memphis, TN, 2004. 12. Lovhoiden G, Deshmukh H, Vrancken C, Zhang Y, Zeman H. D, and D. Weinberg:
Commercialization of vein contrast enhancement. Proc. SPIE 4958:189-200, Bellingham, WA, 2003.
13. Lovhoiden G, Deshmukh H, Zeman H D: Clinical evaluation of vein contrast
enhancement. SPIE 4615:61-70, Bellingham, WA, 2002. 14. Mooney M G, Wilson M G: Linear array transducers with improved image quality for
vascular ultrasonic imaging, Hewlett-Packard Journal, Palo Alto, CA, August 1994. 15. Physical Optics Corporation: Light shaping diffuser. http://www.poc.com/lsd/default.asp
Accessed July 6, 2006. 16. Revis D R: Skin, Anatomy. http://www.emedicine.com/Plastic/topic389.htm Accessed July 2, 2006

80
17. Stoylen A: Basic ultrasound for clinicians. http://folk.ntnu.no/stoylen/strainrate/ Ultrasound/ Accessed May 28, 2006.
18. Tasha & Co.: http://www.tashaandco.com/FG-press-main-infoguide.htm Accessed
July 2, 2006. 19. Vanderbilt University: Ultrasound tutorial. http://www.bme.vanderbilt.edu/bme258/
Ultrasound/tutorial/Obj2Level1.html Accessed May 28, 2006. 20. Zeman H D, Lovhoiden G, Vrancken C and Danish R K: Prototype vein contrast
enhancer, Optical Engineering 44 (8), 086401, Bellingham, WA, August 2005. 21. Zeman H D, Lovhoiden G and Vrancken C: The clinical evaluation of vein contrast
enhancement, Proceedings of the 26th Annual International Conference of the IEEE EMBS, Piscataway, NJ, 2004.
22. Zeman H D, Lovhoiden G, Vrancken C: Prototype vein contrast enhancer, SPIE,
Bellingham, WA, 2004. 23. Zeman H D, and Lovhoiden G: Enhancing the contrast of subcutaneous veins. SPIE
3595:219-230, Bellingham, WA, 1999. 24. Zeman H D, Lovhoiden G, Deshmukh H: Design of a clinical vein contrast enhancing
projector. SPIE 4254:204-215, Bellingham, WA, 2001. 25. Zeman H D, Lovhoiden G, Deshmukh H: Optimization of subcutaneous vein contrast
enhancement. SPIE 3911:50-57, Bellingham,WA, 2000. 26. Zhang Y: Automatic image alignment for the vein contrast enhancement system.
Master’s project report, University of Tennessee Health Science Center, Memphis, TN, 2002.

81
Appendix

82
Appendix A. UTHSC IRB Application
Project Title: Depth and size limits for the visibility of veins using the VeinViewer
Principal Investigator: Jack Buchanan, MSEE, MD, Department of Biomedical Engineering,
UTHSC
920 Madison Avenue, Suite 1005, Memphis, TN 38163
Co-Investigators: Soujanya Ganesh, Frances A. Tylavsky, DrPH
1. PURPOSE OF THE STUDY
The VeinViewer is a device that enhances the visibility of superficial veins. An infrared image of
the veins projects a contrast enhanced image back onto the skin using a projector. The veins in
the image appear dark and the tissue and skin appear light. The contrast between the veins and
surrounding tissue is quantified using a computer software program after the image is captured
with the VeinViewer. The purpose of this study is to quantify the previously observed
relationship between the visibility (contrast and width) of veins as captured by the VeinViewer
and the depth and diameter of the veins as determined by ultrasound. Specifically, we propose
to: determine the relationship between 1) the contrast and vein depth; 2) the contrast and vein
diameter and 3) To determine if there is an interaction between the depth and diameter with the
contrast obtained with the VeinViewer; and 4) To establish depth and size limits of veins for
visibility with the VeinViewer. This will allow more objective estimates of the usefulness of the
VeinViewer for various clinical situations to be specifically evaluated in future studies.

83
2. BACKGROUND AND CURRENT STATUS OF WORK IN FIELD
The VeinViewer is an FDA approved device which can potentially be used to find veins more
accurately for IV insertions, drawing blood, vascular surgery and many other applications. The
VeinViewer’s current design includes a CCD (Charge-coupled device) camera and a projector,
both in one head. The head can be pulled up or down and also rotated to be aimed at the target
area. The design also includes a computer for the image processing and contrast enhancement
and a battery for backup. These are placed on a stand with wheels. The device can be moved in a
clinic or a hospital and can be used on patients lying on a bed or seated in a chair.
Clinical studies done in a hospital using the VeinViewer have proved that it is very useful
in reducing the number of attempts to stick a vein [1]. In most cases, eg. Anticubital veins, the
veins in the image may appear to have different contrast at different points. This research study
aims at finding if the dimensions of veins such as the depth and diameter are a cause for these
changes in the visibility of the veins in the VeinViewer image.
Past and current works include some test experiments done in the laboratory with an
Ultrasound machine. Results from these preliminary studies demonstrated that depth variation
clearly is a factor for the changes in contrast of the vein in the image, and that there are depths
beyond which the VeinViewer has little likelihood of seeing a vein.
84
Plot of Vein Contrast vs. Depth in a subject
Depth (mm)
1.0 1.5 2.0 2.5 3.0 3.5 4.0
Con
trast
-0.02
0.00
0.02
0.04
0.06
0.08
0.10
0.12
This graph implies the greater the depth of the veins from the skin surface, lesser the contrast of
the vein in the observed image. We estimate that 30 subjects are needed to determine the
quantitative relationship between contrast and vein diameter and/or vein depth. The images
obtained from the same subjects will be used to determine the role of the change in diameter of
the vein in the image. The contrast measurements will be done using a software program and the
depth and diameter measurements will be done on the ultrasound image. The resulting data will
be used to quantify the relationship between the depth, diameter and contrast. Once the depth and
size related limits of visibility are established, it will be possible to further characterize the class
of clinical situations which are candidates for further investigation with the VeinViewer.

85
3. CHARACTERISTICS OF SUBJECT POPULATION AND DEVICE
Subject population
Healthy, normal adult subjects between the ages of 18 – 70 will be recruited for the study. They
can belong to any ethnic group and will include both males and females. It is estimated that 30
subjects will be needed for the study. Normal healthy adults will be included in the study and no
subjects with a skin or vein disorder will be included as both, VeinViewer and Ultrasound may
perform differently on such tissue. Subjects who are not able hold their arms still will have to be
excluded from the study. The subjects will be explained as to why they will not be able to
participate in the study. The entire preliminary study will take approximately 1 year. It will take
approximately 45-60 minutes for an individual to complete the study.
4. METHOD OF SUBJECT SELECTION
Flyers approved by the IRB will be placed in the University of Tennessee for recruitment of
subjects in the study. The subjects from the UT campus will be asked to call or email us for
participation in the study. The participants will be asked to give their time schedule for a few
days and the experiments will be scheduled only during the time that they are available. Also, the
time taken to finish an experiment on one subject is approximately only 45 – 60 minutes. There
is also no follow-up required. Therefore, participation in the study will not affect the grades,
class ranking or employment status for students and employees.
5. STUDY SITE
Coleman College of Medicine Building, 956 Court Ave, Room B305, Memphis, TN 38163 and
Luminetx Corporation, 1256 Union Avenue, Memphis TN 38104

86
6. METHODS AND PROCEDURES APPLIED TO HUMAN SUBJECTS
This is a study to relate the contrast of the vein on the VeinViewer image and the dimensions
and depth of the vein measured on an Ultrasound image. The study is a cross-sectional study and
the subjects will not be required to do a follow up. This study does not require the usage of any
drug or injection to visualize the veins. The participant will have two procedures done as part of
this protocol. Regions of interest on the forearm and upper leg will be identified and images of
veins will be obtained using the VeinViewer. The same regions of interest will have ultrasound
scans performed. Information such as sex, race, age and prevalence of chronic diseases will be
collected via questionnaire.
Experimental procedures:
Demographic Questionnaire: Participants will be asked to complete a questionnaire regarding
their age, race, gender and chronic disease status.
VeinViewer:
The subjects will be seated or asked to lie on a bed. They will be asked to stretch out their arms
or legs and the VeinViewer will be turned on. . The experiment will be performed on both the
arm and leg of the subject and the data will be collected. The choice of the vein used for the
study will depend on how much variation of contrast is observed on the vein image. Veins which
will show a significant change in contrast along them will be chosen. After locating veins
suitable for the study, a magic tape will be used to mark the endpoints of measurement area on
the vein. The magic tape is visualized by the VeinViewer and will visually mark the region to be
measured by ultrasound. Some of the subjects may have to get a very small part of their arm or
leg shaved to obtain an image free of hair. Then, two or three images will be taken using the

87
VeinViewer. These images will be transferred to a computer using ATI TV software for
determining the contrast of selected veins.
Ultrasound procedure:
The ultrasound machine that will be used for the measurement is an ATL HDI 5000 system with
a linear 12-5 MHz probe. For the ultrasound procedure, the subjects will have to place their arm
in a tub filled with fresh tepid water. The ultrasound on legs will be done using an ultrasound
water based gel instead of water. Ultrasound will be performed on the same section of the vein
and images will be captured on a computer.
Time:
The anticipated time for the entire experiment is 45 – 60 minutes. The VeinViewer procedure
may take approximately 20 minutes and the Ultrasound study may take about 15 – 20 minutes.
The demographic questionnaire will take 5 minutes.
7. POTENTIAL RISKS TO THE SUBJECT
There are minimal risks associated with this study. There are no psychological, social or legal
risks associated with the procedure. There might only be slight discomfort associated with some
procedures. The use of the VeinViewer does not cause any risk of injury or discomfort. The
Infrared (IR) light focused on a region of interest or of high intensity may cause slight damage to
the retina. Shaving a very small portion of the arm might cause discomfort. The 2 magic tape
strips applied on the arm and/or leg might cause discomfort when pulled off. Ultrasound may
cause local heating in the area. There are no side effects associated with this study.

88
8. PROTECTION AGAINST RISKS
This is a minimal risk study. The IR light in the VeinViewer is of low intensity and highly
diffuse. Even when viewed directly, this IR light will not cause any retinal damage. The
procedures for this study direct the IR light source only to the skin of the peripheral veins located
in the arm and leg. The participant will be instructed to not look directly into the VeinViewer to
avoid exposure to the subject’s eyes. All care will be taken to minimize the discomfort of
removing arm and leg hair. The use of a shaving gel will eliminate any discomfort. The magic
tapes will be taken off after the Ultrasound imaging which involves using water. The water
makes it easy to pull off the tapes without causing any pain.
Several Ultrasound studies have been done which that show there is minimal risk and is not a
matter of concern unless it is done directly on fetuses for an extended period of time. The
ultrasound procedure done in our study does not require imaging the subject for 15-20 minutes,
thus this risk is eliminated. In the case of pregnant subjects, the ultrasound will be performed
only on the arm or leg and not on the fetus. The Ultrasound equipment used in the research study
conforms to all FDA standards. The discomfort associated with being still for a long time is
eliminated by the short duration of the measurements.
Water used for the ultrasound procedure will be tepid or warm so as to cause no discomfort to
the subjects. It will be made sure that the water will be emptied after every experiment and
refilled for a new experiment.

89
There are no side effects associated with this study as it does not contain any procedure which
might produce side effects.
9. POTENTIAL BENEFITS TO THE SUBJECT
There are no direct benefits to the subject. However, the subject will have an opportunity to look
at the structure of vasculature in their arms real-time with the use of the VeinViewer.
10. POTENTIAL BENEFITS TO THE SOCIETY
The study will help in evaluating the performance of the VeinViewer as applied to clinical use.
Understanding how well the current device works may lead to improvements in software and
other technical designs thus becoming more accurate at finding very small and deep veins. The
advantages of this will be lesser pain caused to the patients from sticking a vein only once as
opposed to multiple sticks and also less time needed to find a vein for a stick which is beneficial
in emergency cases.
11. RISK/BENEFIT ASSESSMENT
The risks associated with this study are very minimal. This research study will help us
understand the ability of the VeinViewer to locate difficult-to-find veins better. This eventually
might lead to complete elimination of multiple sticks of a vein in a hospital or a clinic and also
the problems associated with finding a vein quicker in the cases of emergency. Thus, the benefits
obtained from doing the study are much higher when compared to the risks.

90
12. ALTERNATIVES OT PARTICIPATION
There are no alternatives to participation in this research study. The subjects will receive
standard care whether or not they participate in the study. The subjects will not have to undergo
the procedures using the VeinViewer and the Ultrasound, and will not have to complete the
questionnaire if they choose not to participate in the study for any reason.
13. CONFIDENTIALITY
Strict confidentiality of the identity of the subject and the information obtained as a part of the
study, will be maintained. Subjects will not be identified in any reports, presentations or
publications produced by the study. Only the investigators and the University of Tennessee
Health Science Center Institutional Review Board (IRB) will have access to the data that
identifies the subject’s name and other information.
The personal information records will be labeled with the subject’s full name. In case of
any necessity to identify the subject, a back tracking method will be used. The images saved will
be named with the first two letters of their first name and the first two letters of the last name.
Thus, the images can be associated to the corresponding subject’s name in the personal
information records. The information about the subject’s participation in the study or the results
of procedures used in the study will not be placed in the subject’s medical record. The HIPAA
authorization is included in the confidentiality section of the consent form.
14. PAYMENT FOR PARTICIPATION
Subjects participating in the study will be paid $5.00 for their visit.

91
15. FINANCIAL OBLIGATIONS
There will not be any financial obligations to the subject in this study. There will be no cost to
the participant for the study procedures or materials.
16. RESEARCH INJURIES
No research related injuries are anticipated. In the event of physical injuries resulting from study
procedures, the University of Tennessee does not have funds budgeted for compensation, either
for loss of wages or for medical treatment. Therefore, the University of Tennessee does not
provide for treatment or reimbursement for such injuries. In the case an injury occurs during the
research visit, the participant’s insurance carrier will be billed for the costs associated with the
medical treatment.
17. FINANCIAL CONFLICT OF INTERESTS
None of the key personnel involved with the study have any reportable economic interest as
defined by University Policy.
18. INFORMED CONSENT:
The study will be verbally described to the potential subject by the investigator. Then, the
subjects will be given the consent form to read and any questions will be addressed. If the subject
agrees to participate in the study, a written consent will then be obtained.
The following individuals will be participating in the research project:
Jack Buchanan (01/17/02), Soujanya Ganesh (08/22/05), Frances A. Tylavsky (09/21/00)
92
The individuals who will participate in the informed consent process:
Soujanya Ganesh – Co-Investigator
19. MEDICAL DEVICE RESEARCH:
The VeinViewer is an FDA approved device. It is a Class I exempt device. Hence, it is exempt
from the premarket [510(k)] notification requirement. It is registered by Luminetx Corporation
under the Owner/Operator number – 9065817. It utilizes the product code KZA 880.6970.
The sponsor of this investigation considers the device to be a ‘non significant risk’. Please
find attached letter from the investigator.
20. ADDITIONAL REQUIREMENTS:
RECOMBINANT DNA TECHNOLOGY - Not Applicable
RADIATION EXPOSURE - None
21. REFERENCES:
1. Prototype Vein Contrast Enhancer, Herbert D. Zeman, Gunnar Lovhoiden, Carlos
Vrancken, Robert K. Danish; Optical Engineering 44(8), 1, August 2005 (In press)
2. www.fda.gov

93
Appendix B. Consent Form
TITLE OF RESEARCH STUDY: Depth and size limits for the visibility of veins using the
VeinViewer
PRINCIPAL INVESTIGATOR:
Jack Buchanan, MSEE, MD, Department of Biomedical Engineering, UTHSC
920 Madison Avenue, Suite 1005, Memphis, TN 38163
CO-INVESTIGATORS:
Soujanya Ganesh, Department of BioImaging, UTHSC, Frances A. Tylavsky, Dr.P.H.,
Department of Preventive Medicine, UTHSC
1. INTRODUCTION:
You are being given the opportunity to participate in a research study that evaluates the
performance of a device called the VeinViewer which will make it easy to locate difficult-to-find
veins for a variety of medical purposes, including the drawing of blood and for vascular surgery.
The device uses infrared light to locate veins. The contrast of the veins is enhanced in the image,
making them appear dark on a light background of the skin and tissue.
The aim of the study is to determine how we can relate the diameter and depth of the veins, as
determined by ultrasound with the visibility of the veins that we observe on a VeinViewer image.

94
The total number of subjects to be enrolled in the study is 30.
The study will take place at Coleman College of Medicine Building, 956 Court Ave, Room
B305, Memphis, TN 38163 and Luminetx Corporation, 1256 Union Avenue, Memphis TN
38104
The entire study will approximately take 1 year. The experiment will approximately take 45 – 60
minutes. There is no follow-up required. This is not an interventional study and does not require
the use of drugs or any other intake.
2. PROCEDURES TO BE FOLLOWED:
You will be asked to take a seat and the VeinViewer device will be turned on. We will locate the
veins that we would want to study. It might also require shaving a very small portion of your arm
and/or leg. A new razor will be used for every experiment and care will be taken to reduce
discomfort as a good shaving gel will be used. Then, 2 or 3 magic tapes will be used to mark the
endpoints of the point of interest. A VeinViewer image will be captured using the device. The
VeinViewer procedure will approximately take 20 minutes.
You will be required to place your arm in a tub of water for capturing ultrasound images
to be obtained. This procedure will take about 15 - 20 minutes. If we choose to do the study on
your leg, a water based ultrasound gel will be used.
The demographic questionnaire will take 5 minutes. The demographic questionnaire will be used

95
to describe the population being studied with regard to race, sex, age, height, weight and chronic
disease status. All the measures are purely descriptive. The address and phone number are
collected to be able to contact you if for some reason there is a need to recall you for repeat
measurements after analysis of your initial measurements.
3. RISKS ASSOCIATED WITH PARTICIPATION:
Risks from this study are minimal. We are not sticking anything into your arm or leg.
Infrared (IR) light of high intensity or focused could cause slight damage to the retina. The IR
light in the VeinViewer is of low intensity and highly diffuse. Even when viewed directly, this
IR light will not cause any retinal damage. Additionally, the IR light source is directed only to
the skin of the peripheral vein site and not to your eyes.
Shaving a very small portion of the arm might cause discomfort but, care will be taken to use a
shaving gel and make it easy.
The use of 2 magic tapes on the arm might cause discomfort when pulled off. The tapes will be
taken off after the Ultrasound imaging which involves using water. The water makes it easy to
pull off the tapes without causing any pain.
Ultrasound may cause local heating in the area. Several ultrasound studies have been done show
that this risk is very minimal and is not a matter of concern unless it is done directly on fetuses,
especially if done for an extended period of time. The ultrasound procedure done in our study

96
does not require imaging for a long period of time, thus this risk is eliminated. Additionally, even
in the case of pregnant subjects, the ultrasound will be performed only on the arm or leg and not
on the fetus. The Ultrasound equipment used in the research study conforms to all FDA
standards. Also, since the ultrasound procedure in the present study is only for 15 or 20 minutes,
the discomfort associated with being still for a long time is eliminated.
Water used for the ultrasound procedure will be tepid or warm so as to cause no discomfort. It
will be made sure that the water will be emptied after every experiment and refilled for a new
experiment.
There are no side effects associated with this study.
4. BENEFITS ASSOCIATED WITH PARTICIPATION:
You will have an opportunity to look at the structure of vasculature in your arm real-time with
the VeinViewer. The vasculature in your legs can be observed on the images obtained during the
study.
The study will help in evaluating the performance of the VeinViewer as applied to clinical use.
The VeinViewer has proved to be useful to find deep and small veins. Your participation might
help us in analyzing the current configuration and help make it perform better, which in turn will
reduce the number of sticks to find a vein, at a hospital. It may also be useful for other medical
purposes, such as accurate localization of veins for vascular surgery.

97
5. ALTERNATIVES TO PARTICIPATION:
There are no alternatives to participation in the research study. You will be able to receive
standard care whether or not you participate in the study. You will not have to undergo the
procedure using the
VeinViewer or Ultrasound, and will not have to complete the questionnaire if you choose not to
participate.
6. CONFIDENTIALITY:
Your information that is obtained from the study will be kept very confidential. You will not be
identified in any presentations or publications resulting from the study. The investigators and the
University of Tennessee Health Science Center Institutional Review Board (IRB) will have
access to your personal information record. The personal information records will be labeled
with your full name. In case of any necessity to identify you, a back tracking method will be
used. The images saved will be named with the first two letters of your first name and the first
two letters of the last name. Thus, the images can be associated to the corresponding your name
in the personal information records. The information about your participation in the study or the
results of procedures used in the study will not be placed in your medical record.
Under federal privacy regulations, you have the right to determine who has access to your
personal health information (called “protected health information” or PHI). PHI collected in this
study may include your medical history, the results of physical exams as well as basic
demographic information. By signing this consent form, you are authorizing the researchers at
98
the University of Tennessee to have access to your PHI collected in this study. In addition, your
PHI may be shared with other persons involved in the conduct or oversight of this research,
including the Food and Drug Administration (FDA); Your PHI may also be shared with
(Luminetx Corporation), which sponsors and provides funds for this research. However, these
latter organizations may not have the same obligations to protect your PHI. The Institutional
Review Board (IRB) at the University of Tennessee Health Science Center may review your PHI
as part of its responsibility to protect the rights and welfare of research subjects. Your PHI will
not be used or disclosed to any other person or entity, except as required by law, or for
authorized oversight of this research study by other regulatory agencies, or for other research for
which the use and disclosure of your PHI has been approved by the IRB. Your PHI will be used
only for the research purposes described in the Introduction of this consent form. Your PHI will
be used until the study is completed.
You may cancel this authorization in writing at any time by contacting the principal investigator
listed on the first page of the consent form. If you cancel the authorization, continued use of your
PHI is permitted if it was obtained before the cancellation and its use is necessary in completing
the research. However, PHI collected after your cancellation may not be used in the study. If
you refuse to provide this authorization, you will not be able to participate in the research study.
If you cancel the authorization, then you will be withdrawn from the study. Finally, the federal
regulations allow you to obtain access to your PHI collected or used in this study.
7. COMPENSATION AND TREATMENT FOR INJURY:
I understand that I am not waiving any legal rights or releasing the University of Tennessee or its

99
agents from liability for negligence. I understand that, in the event of physical injury resulting
from research procedures, the University of Tennessee does not have funds budgeted for
compensation either for lost wages or for medical treatment. Therefore, the University of
Tennessee does not provide for treatment or reimbursement for such injuries.
No research related injuries are anticipated. I or my insurance carrier will be billed for the costs
associated with the medical treatment in the event of a research related injury.
8. QUESTIONS:
You may contact:
Soujanya Ganesh at 901-338-3091 or Dr. Jack Buchanan at 901-448-7200 for questions
regarding the research study;
Dr. Jack Buchanan at 901-270-8361 (c) or 901-448-7200 (o) in the event of a research related
injury
Dr. Herbert D. Zeman, PhD at 901-229-0508 for questions regarding the VeinViewer device
Dr. Clair E. Cox, UTHSC IRB Chairman at 901-448-4824 if you have any questions about your
rights as a participant in this study or your rights as a research subject.
9. PAYMENT FOR PARTICIPATION:
You will receive $5.00 for participating in this study.
10. COST OF PARTICIPATION:
There are no costs to you for participation in the study.

100
11. PREMATURE TERMINATION:
There are no medical consequences to stopping the study. After it is determined if you are
suitable for the study, your participation will be terminated only if you choose not to participate.
12. VOLUNTARY PARTICIPATION:
Your participation in this research study is voluntary and refusal to participate will not involve
penalty or loss of benefits to which you are otherwise entitled. You may choose to discontinue
participation at any time without penalty or loss of benefits to which you are otherwise entitled.
If you are a student, you understand participating or not participating in this study will in no way
influence your grade in any course. If you are an employee of the university, you should realize
that participating or not participating will not affect your employability.
13. CONSENT OF SUBJECT:
I have read or have had read to me the description of the research study as outlined above. The
investigator or his/her representative has explained the study to me and has answered all of the
questions I have at this time. I have been told of the potential risks, discomforts, side effects and
adverse reactions as well as the possible benefits of the study.
I freely volunteer to participate in the study. I understand that I do not have to take part in this
study and that my refusal to participate will involve no penalty or loss of rights to which I am
entitled. I further understand that I am free to later withdraw my consent and discontinue
participation in this study at any time. I understand that refusing to participate or later
withdrawing form the study will not adversely affect my subsequent medical care.

101
I will receive a signed and a dated copy of the consent form.
_______________________________________________ _____________________
Signature of research subject Date
_______________________________________________ _____________________
Signature of Witness Date
_______________________________________________ _____________________
Signature of Person Obtaining Consent Date
_______________________________________________ _____________________
Signature of Principal Investigator Date

102
Appendix C. VeinViewer History Questionnaire
Please answer the following questions as accurately as possible. Fill in your response or circle the correct number indicating your answer. Date: ___/___/___ Birth date ___/___/___ month day year month day year 1. Name: First Middle Last 2. Address: City State Zip Code 3. Phone Number: Home: ( ) Area Code Number Work: ( ) Area Code Number 4. What is your Social Security number? __ __ __ - __ __ - __ __ __ __ 5. Choose the group that best describes your ethnicity (race).
White African-American Hispanic
Asian, Please specify __________ Other, Please specify ______________ 5a. Male Female 6. Height ___________ Weight _____________ lbs 7. Do you have any chronic disease? Please list:
103
Vita
Soujanya Ganesh was born in Bangalore, India on August 9, 1982. She received her
Bachelor’s degree specializing in Electrical and Electronics Engineering from the Jawaharlal
Nehru Technological University in June 2003. She joined the program in Biomedical
Engineering majoring in Medical Imaging at the University of Tennessee Health Science Center,
Memphis in August 2003 and received her Master’s degree in Biomedical Engineering in May
2007.