deprivation, violence, and conflict: an analysis of...
TRANSCRIPT

Deprivation, Violence, and Conflict:
An Analysis of “Naxalite” Activity in the Districts of India
Vani K Borooah*
University of Ulster
October 2007
Abstract
This paper poses two questions: is it a fact that there is more violence in Naxalite (i.e.
Maoist) affected districts compared to districts which are free of Naxalite activity? can
the fact that Naxalite activity exists in some districts of India, but not in others, be
explained by differences between districts in their economic and social conditions?
Using a number of sources, this study identifies districts in India in which there was
significant Naxalite activity. Correlating these findings with district level economic,
social, and crime indicators, the econometric results show that, after controlling for
other variables, Naxalite activity in a district had, if anything, a dampening effect on
its level of violent crime and crimes against women. Furthermore, even after
controlling for other variables, the probability of a district being Naxalite affected
rose with an increase in its poverty rate and fell with a rise in its literacy rate. So, one
prong in an anti-Naxalite strategy would be to address the twin issues of poverty and
illiteracy in India. As the simulations reported in the paper show, this might go a
considerable way in ridding districts of Naxalite presence.
Keywords: India, districts, deprivation, violent crime, Naxalite movement
* School of Economics and Politics, University of Ulster, Newtownabbey, Northern Ireland BT37 0QB.
(Email: [email protected] ). I am grateful to Amaresh Dubey for providing me with the data
and to him, Nitin Gokhale, and Ravi Palsokar and for help and advice with this project. This paper was
written while I was a Fellow at the International Centre for Economic Research (ICER), Turin, Italy
and I am grateful to the Centre for research support. Needless to say, I alone am responsible for the
results reported in the paper and, indeed, for any of its shortcomings.

1. Introduction
The largely successful military campaign that Nepal‟s Maoists have waged against
the Nepalese monarchy and its political establishment has drawn attention to the
activities of Maoist groups in India (known, collectively, as “Naxalites”, after
Naxalbari, the district in west Bengal where the first Maoist-inspired insurgency
began in 1967). The Indian Home Ministry estimates that 91 percent of violence in
India, and 89 percent of deaths arising from violence, are the result of Naxalite action
(Government of India, 2005). Moreover, the growth of Naxalite activity in India has
been phenomenonal: from 55 districts afflicted by various degrees of Naxalite activity
in eight States in November 2003 to 157 districts across 13 States (Gill, 2005). In
response to the threat posed by Naxalites, the Indian Government has decided to set
up a high-powered committee - headed by the Union Home Minister and having as its
members the Chief Ministers of the worst-affected states - Andhra Pradesh,
Maharashtra, Madhya Pradesh, Chattisgarh, Jharkhand, Bihar, Uttaranchal, Orissa and
Uttar Pradesh – to address the problem.
Referring to the workings of this Committee, the Indian Prime Minisiter,
Manmohan Singh, pointed out that Naxalite insurgency should not be viewed as a
purely law and order problem: underlying this insurgency, and lending it support, was
the social and economic deprivation experienced by a significant part of India‟s
population. For example, as Bhatia (2005) observes, a large part of Naxalite activities
are, in fact, are “non violent” and that this feature of the Naxalite movement has
received little attention. Moreover, many of these open and non violent activities –
inter alia meetings, boycotts, marches, road blocks – are in pursuit of basic economic
and social rights: for example, land rights; minimum wages; right to use common
property resources; the right of the “lower castes” to respect and dignity. In

2
consequence, combating Naxalite violence, arguably, requires not just strong police
and military action but also effective measures to alleviate political, social and
economic deprivation and injustice.1
Against this background, this paper identifies districts in India in which there is
significant Naxalite activity (hereafter, simply “Naxalite activity”) and asks two
questions:
(i) Is it a fact that there is more violence in Naxalite affected districts compared to
districts which are free of Naxalite activity? 2
(ii) Can the fact that Naxalite activity exists in some districts of India, but not in
others, be explained by differences between districts in their economic and social
conditions?
2. Naxalite Activity in Indian Districts
We identified, on the basis of Government of India (2005) and various websites -
prominent among which was the South Asian Intelligence Review
(http://www.satp.org/satporgtp/sair/) - 88 districts in 10 states in which there was
Naxalite activity.3 This estimate lies between a low of 76 districts in 9 states
(Government of India, 2005) and a high of 157 districts in 13 states (Gill, 2005).
These Naxalite affected districts identified by us are listed in Table 1.
1 The best predictors of civil wars were low average incomes, low growth, and a high dependence of
primary good exports (“The Global Menace of Local Strife”, The Economist, 22 May 2003). 2 The district is the smallest geographical unit for which a consisent set of data is available. There are
593 districts in India with a District Commisioner (or District Collector) acting as the administative
head of each district. The median and mean populations of these districts were, respectively, 1.47 and
1.73 million persons: the most and the least populous districts were Medinipur in West Bengal
(population: 9,638,473) and Yanam in Pondicherry (population: 31,362). By focusing on districts, the
study is able to concentrate atention on pockets of deprivation instead of viewing deprivation as a
phenomenom affecting a state or a region in its entirety (Misra, 2001; Kurian, 2001). 3 Information on Karnatka was obtained from Ramana (2005) and for Tamil Nadu from Viswanathan
(2002).

3
District-level data on population was available from the 2001 Census of India and
Debroy and Bhandari (2004) provided us with further data on a number of welfare
indicators in the districts:
1. The poverty rate: the proportion of households in a district who are below the
poverty line.4
2. The literacy rate: the percentage of persons (who were seven years of age or
above) in a district who were literate.5
3. The imminisation rate: the proportion of 0-6 year olds in a district who were
immunised against disease.6
4. The infant mortality rate: the number of deaths within a year per 1,000 live
births.7
5. The pupil-teacher ratio: the number of pupils per teacher in primary schools.
6. The pregnancy attention rate: the proportion of women receiving skilled
attention during pregnancy.
7. The sex ratio: among 0-6 year olds, the number of females per 1,000 males.8
8. The safe drinking wate rate: the proportion of habitations in a district with
safe drinking water.
9. The pucca road rate: The proportion of villages in a district connected by
pucca (motorable) road.
Table 2 shows, for each of these indicators, the distribution of the 100 worst
performing districts by the state to which they belonged. When “backwardness” was
measured by a district‟s poverty rate, 85 districts were contained in just seven states
4 The district level poverty rates are based on Bhandari and Dubey (2003).
5 Obtained from the 2001 Census. The literacy rate was made “gender sensitive” by adjusting for
differences in male and female literacy rates. 6 Complete immunisation involves vaccination of children, within the first year of life, against six
diseases: diphtheria; pertussis; tetanus; tuberculosis; poliomyelitis; and measles. 7 The infant mortality rates are from the Registrar General of India.

4
(Assam; Bihar; Chattisgarh; Jharkhand; Madhya Pradesh; Orissa; and West Benga)
and 45 districts were in just three states (Bihar; Jharkhand; and Orissa). In terms of
(il)literacy, five states (Bihar, Jharkhand; Rajasthan; Orissa and Uttar Pradesh)
contributed 75 districts. In terms of immunisation rates, seven states (Arunachal
Pradesh; Assam; Bihar; Jharkhand; Madhya Pradesh; Rajasthan; and Uttar Pradesh)
contributed 85 districts. In terms of infant mortality rates, four states (Madhya
Pradesh; Orissa; Rajasthan; and Uttar Pradesh) contributed 96 districts. In terms of
the sex ratio of 0-6 year olds, five states (Gujarat; Haryana; Punjab; Rajasthan; and
Uttar Pradesh) contributed 74 districts. Of the 100 districts with the lowest
percentage of women receiving skilled assistance during pregnancy, 27 were in Uttar
Pradesh and 25 were in Bihar. Lastly, of the 100 districts with the highest percentage
of villages not connected to pucca roads, 30 were in Orissa and 22 were in Madhya
Pradesh.
Crime Statistics
The National Crime Record Bureau has, since 1953, provided crime statistics in
India (relating to the number of reported crimes which fell under the purview of the
Indian Penal Code) by state and district. We had available to us district level crime
statistics for 1998. From these data, we defined three broad categories of crime:
1. Violent crime, comprising: murders, attempted murders, rapes,
kidnappings, dacoities, robberies, burglaries, thefts, riots, sexual
harassments, dowry deaths, and cruelty by husband and relatives.
2. Anti-women crime, comprising: rapes, kidnapping and abduction of women
and girls, sexual harassments, dowry deaths, and cruelty by husband and
relatives.
8 2001 Census for India.

5
3. Public Order crime, comprising riots and arson.
From the numbers of offences under each of the above categories we constructed
the violent crime rate as the number of violent crimes in a district, per 10,000 of its
adult population, and the anti-women crime rate as the number of crimes against
women in a district, per 10,000 of its adult female population. Tables 3 and 4 show
the 100 districts in India with the highest rates of, respectively, violent crime and
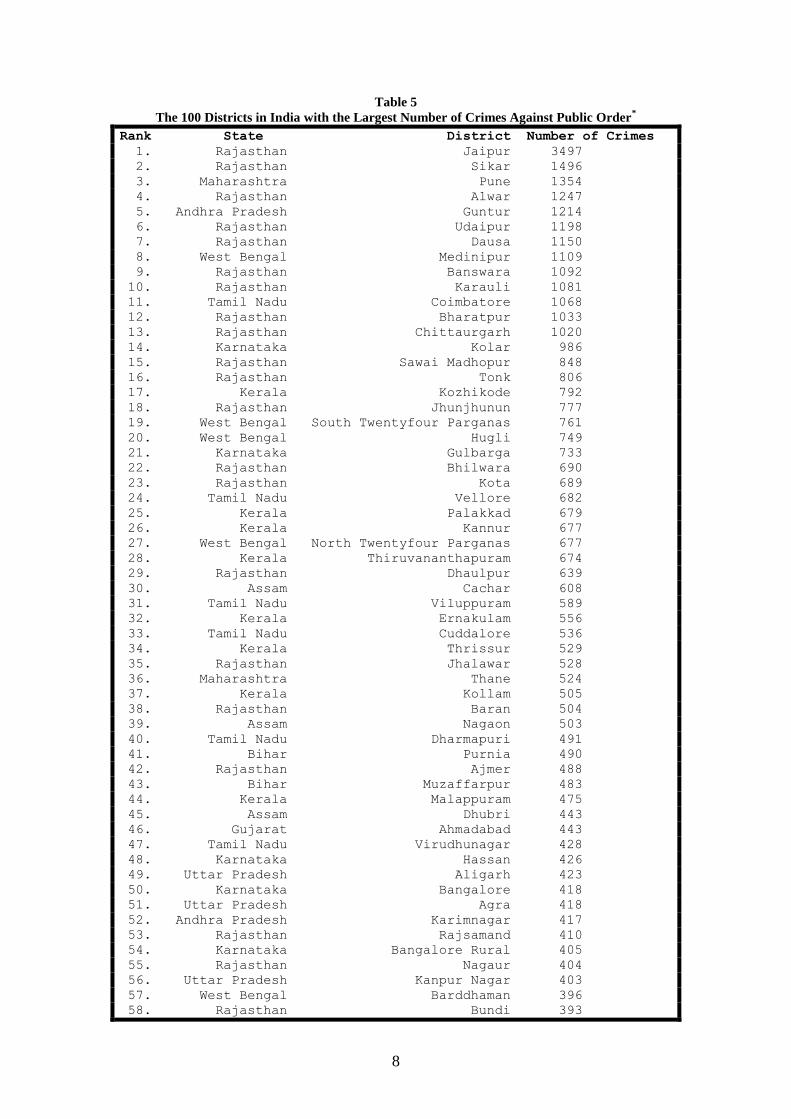
crimes against women. Table 5 shows the 100 districts in India with the largest
number of crimes against public order. Table 6 groups, by state, the 100 districts with
the largest numbers of violent crime, anti-women crime, and public order crime, and
the 100 districts with the highest rates of violent crime and of anti-women crime.
Table 6 shows that, on the basis of crime rates, 23 and 22 districts of the 100
worst districts in terms of violent crime were, respectively, in Madhya Pradesh and
Rajasthan while, of the 100 worst districts in terms of crimes aganst women, 34 and
25 districts were, respectively, in Madhya Pradesh and Rajasthan. In terms of the
number of crimes, 17 of the worst districts in terms of violent crime and crimes
against women were in Maharashtra with Andhra Pradesh and Rajasthan providing
the next highest concentrations of violent crime districts. In terms of crimes against
public order, 26 of the 100 districts with the larget number of such crimes were in
Rajasthan, with Bihar, Kerala, and Tamil Nadu contributing, respectively, 13, 12, and
11 districts.
A comparison of Naxalite affected and Naxalite free districts
Table 7 compares, with respect each of the deprivation indicators and crime
indicators listed above, districts in which there was, and was not, Naxalite activity.
This Table shows that the average poverty rate in Naxalite affected districts was
considerably higher than that in districts which did not have Naxalite activity (32

6
versus 24 percent) and the literacy rate in Naxalite affected districts was considerably
lower than that in districts which did not have Naxalite activity (60 versus 67
percent). Furthermore, the average numbers of violent crimes, crimes against women,
and public order crimes were all higher in Naxalite affected districts than in Naxalite
free districts.
3. Estimation Results for the Crime Equations
The preceding section raises the question of whether the level of violent crime in a
district can be explained by its charactersistics where these include whether there is
Naxalite activity in the district.9 In order to examine this hypothesis we estimated,
using district-level data, three econometric equations whose dependent variables
were, respectively, the number in every district of: (i) violent crimes; (ii) crimes
against women; (iii) crimes against public order. The equations were estimated as a
system of Seemingly Unrelated Regression Equaions (SURE) in order to allow for
correlation between the error terms of the three equations.
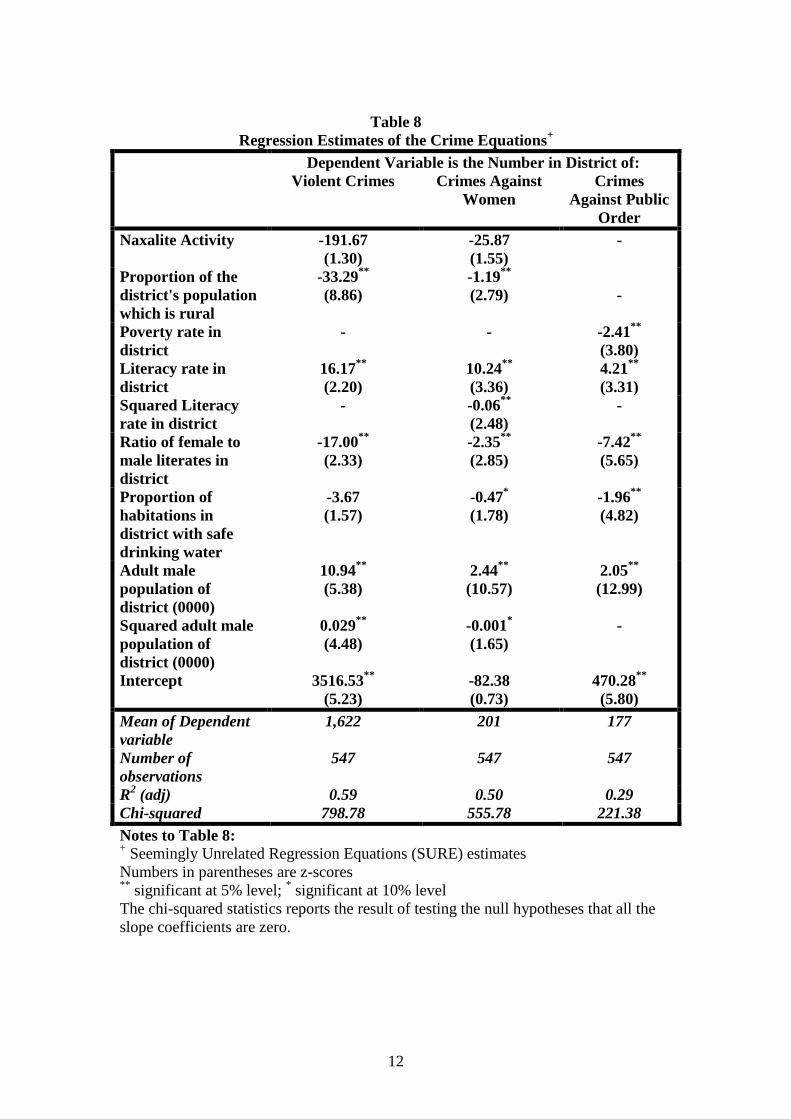
The estimation results from the three "crime equations" are shown in Table 8.
Omitted from the equations specification were variables whose associated coefficients
had z scores which were less than 1: as is well known, the omission of such variables
enhances the explanatory power of the equation. The equations for violent crime,
crimes against women, and crimes against public order explain, respectively, 58, 50,
and 29 percent of the inter-district variation in the numbers of such crimes.
The first point to make about the estimation results is that, after controlling for
other factors, districts with Naxalite presence (see Table 1) had ceteris paribus lower
numbers of violent crime and crimes against women compared to districts in whch
9 Of course, there is the possibility that, rather than violent crime being engendered by Naxalite
activity, Naxalities operate in districts where is already a high level of violence.

7
there was no Naxalite activiy. However, it should be stressed, that the coefficients
associated with the Naxalite variable were not significantly different from zero.
The second point is that districts with a larger proportion of their population living
in rural areas had lower levels of violent crime and of crimes against women
compared to more urbanised districts: a percentage increase in the proportion of a
districts's rural population would lead the number of violent crimes to fall by 33 and
crimes against wmen to fall by 1.
The third point is that the level of poverty in a district (i.e. the proportion of
households in the district who were poor) had no bearing on the number of violent
crimes, or on the number of crimes aganst women, in the district. However, the level
of poverty did have a significant effect on the number of crimes against public order
(riots and arson): the smaller the the proportion of households in the district who were
poor, the larger the numer of crimes against public order.10
The fourth point is that higher levels of literacy were associated with higher
numbers of all three types of crime: a percentage point increase in the literacy rate
was associated with an additional: 16 violent crimes; 10 crimes against women; and 4
crimes against public order. However, a rise in the ratio of female to male literacy
rates served to reduce the number of all three types of crime, with the largest impact
being on violent crime and the smallest on crimes against women.
The fifth point is that an absence of safe drinking water was associated with
higher numbers of all three types of crime though here the effect was significantly
different from zero only for crimes against public order: a percentage increase in the
habitations receiving safe drinking water would lead to the number of crimes against
public order falling by two.

8
Lastly, the number of crimes in a district was positively related to the number of
adult males in a district. If adult males are viewed as the main perpetrators of crime,
then an increase of 10,000 in their number was associated with an additional: 11
violent crimes; 2 crimes against women; and 2 crimes against public order.11
4. Estimation Results for the Naxalite Activity Equation
Using the district level data, described above, we estimated a logit model in which
the dependent variable (naxal) took the value 1 in a district if it had Naxalite activity
(see Table 1) and the value 0 if it did not. Table 9 shows the results of estimating
such a model, firstly on data for all the districts in India and, then, on data restricted to
the 10 Indian states - Andhra Pradesh, Bihar, Chhattisgarh, Jharkhand, Karnataka,
Madhya Pradesh, Maharashtra, Orissa, Tamil Nadu, West Bengal - which contained
districts affected by Naxalite activity. The columns of Tables 9 show the the
estimated "odds ratios": a coefficient estimate greater than 1 implies that the
probability of a district having Naxalite activity (Pr(naxal=1)) rises with an increase
in the value of that variable while an estimate less than 1 implies that the probability
falls.12
Table 9 shows that whether the equation was estimated over all the Indian states,
or whether the estimation was confined to the Naxalite affected states, the probability
of there being Naxalite activity in a district increased with a rise in its poverty rate and
10
A percentage fall in the poverty rate would lead to the number of crimes against public order to
increase by 2. 11
The square of the adult male population was included to make the population effect non-linear.
12 The logit equation is
1
Pr( 1)exp{ } exp{ }
1 Pr( 1)
Kj
jk j j
kj
naxalX z
naxal
for for M coefficients, βj and for
observations on K variables. The columns of Table 9 report report Pr( 1)
1 Pr( 1)
j
jk j
naxal
X naxal
=
exp( )k jk kX , which is the the change in the odds ratio, given a change in the value of the kth
variable, where Pr( 1) /(1 )z z
jnaxal e e

9
decreased with a rise in its literacy rate. Table 9 shows that, in addition to poverty
and literacy rates, three further factors affected the likelihood of Naxalite activity in
districts:
(i) More populous districts, as measured by the number of adult males in a
district, were more likely to have Naxalite activity than less sparsely
populated states.
(ii) The greater the female participation in the workforce of a district, the more
likely it was to have Naxalite activity
(iii) Districts with a smaller coverage of safe drinking water were more likely
to have Naxalite activity compared to districts where it was more usual for
habitations to have safe drinking water.
In this connection it is important to note that both Maoist parties in India13
are
explicitly concerned with issues relating to women at work (just wages and freedom
from harassment) and women in the home (domestic violence and the role of marriage
in women‟s oppression). In consequence, there has been a significant increase in the
number of women coming into the movement in Andhra Pradesh (Kannabiran et. al.,
2004). Bhatia (2005) observes that an important aspect of the Naxalite movement in
central India has been to fight for the dignity of India‟s lower cates: directly as a result
of Naxalite action, the incidence of rape of lower caste women has fallen, lower caste
children are able to attend school, and arbitary beatings of lower caste persons are no
longer tolerated.
The explanatory power of the logit equations are shown in terms of the „Pseudo-
R2‟. The „Pseudo-R
2‟ is a popular measure of the model‟s performance in binary
13
Naxalite activity in India is spearheaded by two groups: the Communist Party Marxist Lennist-
People‟s War Group and the Maoist Communist Centre of India (Government of India, 2005). For
details of other groups and their histories see the South Asian Terrorist Portal (SATP) website
http://www.satp.org.

10
models and compares the maximised log-likelihood value of the full model (log L) to
that obtained when all the coefficients, expect the intercept term, are set to zero (log
L0) and is defined as: 1-(log L/log L0). The measure has an intuitive appeal in that it
is bounded by 0 (all the slope coefficients are zero) and 1 (perfect fit). By the
standards of discrete choice models, the R2 values reported in Table 9 - respectively,
0.24 and 0.17 - are high.
3. Assessing the Model’s Predictive Power
One way of assessing the predictive ability of a model with a binary dependent
variable is by constructing a 2x2 table of the „hits‟ and „misses‟ emanating from a
prediction rule such that a district is regarded as being Naxalite affected (naxal=1) or
Naxalite free (naxal=0) if, for a cut-off probability p*, the estimated probability,
Pr(naxal=1) > p*. Given a cut-off point, p
*, the „sensitivity‟ and the „specificity‟ of an
equation are, respectively, the proportions of positive and negative cases that are
correctly classified.
Table 10 shows that, with p*=0.5, 86 percent of the districts were correctly
classified when the equation was estimated over all the districts and Table 11 shows
that 79 percent of the districts were correctly classified when the equation was
estimated over all the districts in the Naxalite affected states. The model correctly
identified districts with Naxalite activity in 24% of the cases (21 out of 88 districts,
Table 10: Pr(+|D)) when it was estimated over all the districts in India and in 35
percent of the cases (30 out of 88 districts, Table 11: Pr(+|D)) when it was estimated
over all the districts in the 10 Naxalite affected states.
From a different perspective, the likelihood of a district, which was identified
by the model as being Naxalite affected, actually being Naxalite affected was 64

11
percent when the model was estimated over all the districts in India (21 out of 33
districts, Table 10: Pr(D|+)) and 65 percent when it was estimated over all the districts
in the 10 affected states (30 out of 46 districts, Table 11: Pr(D|+)). However, the
likelihood of a district, identified by the model as not being Naxalite affected,
actually not being Naxalite affected was greater than 86 percent when the model was
estimated over all the districts in India (459 out of 526 districts, Table 10: Pr(~D|-))
and 79 percent when it was estimated over all the districts in the 10 affected states
(244 out of 302 districts, Table 11: Pr(~D|-)).
One can, further, plot the graph of sensitivity versus (1-specificity) as the cut-
off point p* is varied. The curve starts at (0,0) corresponding to p
*=1: no positive case
is correctly classified (sensitivity=0) and every case is classified negative (specificity
=1 or 1-specificity=0); it ends at (1,1) corresponding to p*=0: every positive case is
correctly classified (sensitivity=1) and no case is classified as negative (specificity =0
or 1-specificity=1). A model with no predictive power would be the 450 line
connecting the two extreme points (0,0) and (1,1). The more bowed the curve, the
greater the predictive power. Hence the area under the curve – known as the „receiver
operating characteristic‟ (ROC) curve - is a measure of the model‟s predictive power:
a model with no predictive power has an area of 0.5, while perfect predictive power
implies an area of 1 (StataCorp, 2001). Figures 1 and 2 show the ROC curves for,
respectively, all districts in India and all districts in Naxalite affected states: both
curves are considerably bowed, with 86 percent of the area under Figure 1 and 78
percent under Figure 2, suggesting that the model has considerable predictive power.
12
4. Simulations from the Model
In order to assess the influence of poverty and illiteracy on Naxalite activity we
used the results, shown in Table 9, from the model estimated over the districts in the
Naxalite affected states (Andhra Pradesh, Bihar, Chhattisgarh, Jharkhand, Karnataka,
Madhya Pradesh, Maharashtra, Orissa, Tamil Nadu, West Bengal) to carry out the
following simulations:
Simulation 1: If the poverty rate in a district was greater than the all-India
average (26 percent), it was reduced to the national figure.
Simulation 2: In addition to the changes brought about in Simulation 1, the
literacy rate in a district was raised to the all India average (65 percent) if it was lower
than the national value.
Table 1 shows that 25 percent of the districts in the Naxalite affected states had
Naxalite activity (88 out of 348). Under Simulation 1, the model predicted that the
proportion of Naxalite affected districts would fall to 21 percent, i.e. 73 districts out
of 348. The 15 districts which would not have had Naxalite activity under this
simulation are shown in Table 12. Under Simulation 2, when the poverty rate was
reduced and the literacy rate was raised, the proportion of districts affected by
Naxalite activity was predicted to fall to 17 percent, i.e. only 59 out of 348 districts
would have Naxalite activity. The additional 14 districts which would not have had
Naxalite activity under simulation 2 are shown in Table 13.
5. Conclusions
This paper posed two questions: (i) is it a fact that there is more violence in
Naxalite affected districts compared to districts which are free of Naxalite activity?
(ii) can the fact that Naxalite activity exists in some districts of India, but not in

13
others, be explained by differences between districts in their economic and social
conditions?
The rapid spread of Naxalite activity in India, and the Maoist movement in Nepal,
has made it urgent to provide answers to these questions. The raw data showed that
there was more violent crime, crimes against women, and crimes against public order
in Naxalite affected, compared to Naxalite free, districts. However, our econometric
resuts showed that, after controlling for other variables, Naxalite activity in a district
had, if anything, a dampening effect on its level of violent crime and crimes against
women.
The raw data also showed that Naxalite affected districts had higher poverty rates
and low literacy rates than districts which were Naxalite free. This time however,
our econometric resuts showed that, even after controlling for other variables, the
probability of a district being Naxalite affected rose with an increase in its poverty
rate and fell with a rise in its literacy rate. So, one prong in an anti-Naxalite strategy
would be to address the twin issues of poverty and illiteracy in India. As our
simulations have shown this might go a considerable way in ridding districts of
Naxalite presence.

14
References
Bao, Shu Ming, Chang, Gene Hsin, Sachs, Jeffrey D. and Woo, Wing Thye, (2002)
"Geographic Factors and China's Regional Development Under Market Reforms,
1978-98" (October 17, 2002). China Economic Review, Vol. 13, pp. 89-111.
Cai, Fang, Wang, Dewen, Du, Yang (2002), “Regional disparity and economic
growth in China: The impact of labor market distortions”, China Economic Review,
vol. 13, pp. 197-212.
Cowell, Frank. A. and Jenkins, Stephen. P. (1995), „How Much Inequality Can We
Explain? A Methodology and an Application to the United States‟, Economic Journal,
vol. 105, pp. 421-30.
Debroy, Bibek and Bhandari, Laveesh (2004), District Level Deprivation in the New
Millenium, Rajiv Gandhi Institute for Contemporary Studies, New Delhi.
Demurger , Sylvie, Sachs, Jeffrey D., Woo, Wing Thye, Bao, Shu Ming, Chang, Gene
Hsin and Mellinger, Andrew D. (2001), "Geography, Economic Policy, and Regional
Development in China" (April 2002). NBER Working Paper No. W8897.
Bhandari, Laveesh and Dubey, Amaresh (2003), Incidence of Poverty and Hunger in
the Districts of India, RGCIS Working Paper, Rajiv Gandhi Institute for
Contemporary Studies, New Delhi.
Fujita, M. and Hu, D. (2001), “Regional disparity in China 1985-1994: The effects of
globalization and economic liberalization”, The Annals of Regional Science, vol. 35,
pp. 3-37.
Gill, K.S. (2005), “Enormous Threat of Extremism”, (The Pioneer, 30 October 2004),
http://www.satp.org/satporgtp/kpsgill/security/04Oct30Pio.htm
Misra, Bijayanand (2001), “New Millennium Strategies for Reduction of Poverty and
Regional Disparity in India.” In New Regional Development Paradigms; vol. 4, edited
by James E. Nickum and Kenji Oya, 73-91. Westport, CT: Greenwood Press.
Kannabiran, V. and Kannabiran, K. (2004), “Women‟s Rights and Naxalite Groups”,
Economic and Political Weekly, vol. 39, pp. 4874-4877.
Kurian, N.J. (2001), Regional Disparities in India, Planning Commission of India,
New Delhi.
http://planningcommission.nic.in/reports/sereport/ser/vision2025/regdsprty.pdf
Ramana, P.V. (2005), “Naxalism in Karnataka: swift remedy needed”, Deccan
Herald, 27 February 2005 http://www.observerindia.com/analysis/A386.htm
Viswanathan, S. (2002), “A Crackdown in Tamil Nadu”, Frontline, vol. 19, issue 25,
http://www.frontlineonnet.com/fl1925/stories/20021220005003800.htm

Table 1
Districts in India with Naxalite Presence
State District
Andhra Pradesh Adilabad
Andhra Pradesh Anantapur
Andhra Pradesh East Godavari
Andhra Pradesh Guntur
Andhra Pradesh Karimnagar
Andhra Pradesh Khammam
Andhra Pradesh Kurnool
Andhra Pradesh Mahbubnagar
Andhra Pradesh Medak
Andhra Pradesh Nalgonda
Andhra Pradesh Nizamabad
Andhra Pradesh Srikakulam
Andhra Pradesh Visakhapatnam
Andhra Pradesh Vizianagaram
Andhra Pradesh Warangal
Bihar Aurangabad
Bihar Banka
Bihar Darbhanga
Bihar Gaya
Bihar Jamui
Bihar Jehanabad
Bihar Kaimur (Bhabua)
Bihar Khagaria
Bihar Muzaffarpur
Bihar Patna
Bihar Rohtas
Bihar Sitamarhi
Chhattisgarh Bastar
Chhattisgarh Dantewada
Chhattisgarh Jashpur
Chhattisgarh Kanker
Chhattisgarh Kawardha
Chhattisgarh Rajnandgaon
Chhattisgarh Surguja
Jharkhand Bokaro
Jharkhand Chatra
Jharkhand Dhanbad
Jharkhand Garhwa
Jharkhand Giridih
Jharkhand Gumla
Jharkhand Hazaribag
Jharkhand Kodarma
Jharkhand Lohardaga
Jharkhand Palamu
Jharkhand Pashchimi Singhbhum
Jharkhand Purbi Singhbhum
Jharkhand Ranchi
Karnataka Bellary
Karnataka Bidar
Karnataka Chikmagalur
Karnataka Gulbarga
Karnataka Kolar
Karnataka Raichur
Karnataka Shimoga
Karnataka Tumkur
Karnataka Udupi
Madhya Pradesh Balaghat

2
Madhya Pradesh Dindori
Madhya Pradesh Mandla
Maharashtra Aurangabad
Maharashtra Bhandara
Maharashtra Chandrapur
Maharashtra Gadchiroli
Maharashtra Gondiya
Maharashtra Nanded
Maharashtra Yavatmal
Orissa Gajapati
Orissa Ganjam
Orissa Kandhamal
Orissa Kendujhar
Orissa Koraput
Orissa Malkangiri
Orissa Mayurbhanj
Orissa Nabarangapur
Orissa Rayagada
Orissa Sundargarh
Tamil Nadu Dharmapuri
Tamil Nadu Viluppuram
Uttar Pradesh Chandauli
Uttar Pradesh Mirzapur
Uttar Pradesh Sonbhadra
West Bengal Bankura
West Bengal Barddhaman
West Bengal Hugli
West Bengal Medinipur
West Bengal Puruliya
West Bengal South Twentyfour Parganas

3
Table 2
100 Most Backward Districts by State
Poverty Rate Literacy
Rate
(adjusted)
Immunisati
on Rate
Infant
Mortality
Rate
Sex Ratio
(0-6 yeas)
Skilled
Assistance
Pregnancy
Safe
Drinking
Water
Pucca
Roads
A & N Isl
(2)
- - - - - - 1 1
An Prad
(23)
- 1 - - - - 4 -
Ar Prad
(13)
- 5 7 - - 5 2 5
Assam
(23)
6 - 5 - - 4 7 -
Bihar
(37)
16 28 34 - 1 25 4 -
Chandigarh
(1)
- - - - 1 - - -
Chattisgarh
(16)
8 2 - 4 - - 2 8
D & NH
(1)
- - - - - - 1 -
Dam & Diu
(2)
- - - - - - - -
Delhi
(9)
- - - - 8 - - -
Goa
(2)
- - - - - - - -
Gujarat
(24)
- 2 2 - 12 1 1 -
Haryana
(19)
- - - - 19 - - -
H Prad
(11)
1 - - - 4 - - 4
J &K
(14)
- 7 - - 2 - - -
J'kand
(18)
11 11 11 - - 11 10 6
Karnataka
(27)
3 2 1 - - - 5 -
Kerala
(14)
- - - - - - 14 -
L'deep
(1)
- - - - - - 1 -
M Prad
(45)
12 4 10 39 4 8 6 22
Maharashtra
(35)
9 - 1 - 5 1 11 5
Manipur
(9)
- - 1 - - 3 2
Meghalaya
(7)
- - 4 - - 2 1 -
Mizoram
(8)
- - - - - - 8 -
Nagaland
(8)
- 1 4 - - 3 - 2
Orissa
(30)
18 8 1 9 - 8 - 30
P'cherry
(1)
- - - - - - - -
Punjab
(17)
- - - - 17 - - -
Raj'stan
(32)
- 7 10 12 8 2 7 4
Sikkim
(1)
- - - - - - - -
T Nadu
(30)
2 - - - 2 - 2 -
Tripura
(4)
- - - - - 2 -
U Prad
(70)
8 21 8 36 16 27 - 2
Uttaranchal
(13)
- - - - 1 - 8 6
W Beng
(18)
6 1 1 - - - 4 2

4
Table 3
The 100 Districts in India with the Highest Rates of Violent Crime*
Rank State District Crime Rate
1. Delhi New Delhi 182
2. Himachal Pradesh Bilaspur 59
3. Rajasthan Chittaurgarh 43
4. Delhi Central 40
5. Mizoram Aizawl 40
6. Maharashtra Mumbai (Suburban) 35
7. Maharashtra Bhandara 34
8. Rajasthan Kota 33
9. Madhya Pradesh Gwalior 30
10. Karnataka Bangalore 30
11. Madhya Pradesh Bhopal 29
12. Mizoram Lawngtlai 28
13. Karnataka Kodagu 28
14. Andhra Pradesh Hyderabad 27
15. Rajasthan Baran 26
16. Madhya Pradesh Guna 26
17. Tamil Nadu Perambalur 26
18. Madhya Pradesh Indore 25
19. Kerala Idukki 25
20. Madhya Pradesh Sagar 24
21. Maharashtra Amravati 24
22. Delhi North West 24
23. Delhi North East 24
24. Maharashtra Wardha 24
25. Rajasthan Jhalawar 24
26. Mizoram Kolasib 23
27. Maharashtra Parbhani 23
28. Maharashtra Nagpur 23
29. Rajasthan Bundi 23
30. Rajasthan Jaipur 23
31. Madhya Pradesh Hoshangabad 22
32. Delhi South West 22
33. Rajasthan Rajsamand 22
34. Rajasthan Jhunjhunun 22
35. Rajasthan Jodhpur 21
36. Arunachal Pradesh Papum Pare 21
37. Karnataka Bangalore Rural 21
38. Rajasthan Ganganagar 20
39. Maharashtra Akola 20
40. Orissa Khordha 20
41. Rajasthan Karauli 20
42. Rajasthan Ajmer 19
43. Madhya Pradesh Mandla 19
44. Madhya Pradesh Dewas 19
45. Rajasthan Dausa 19
46. Karnataka Hassan 19
47. Gujarat Ahmadabad 19
48. Andhra Pradesh Krishna 19
49. Tamil Nadu Madurai 19
50. Rajasthan Banswara 18
51. Rajasthan Dhaulpur 18
52. Madhya Pradesh Neemuch 18
53. Haryana Faridabad 18
54. Mizoram Lunglei 18
55. Madhya Pradesh Mandsaur 18
56. Rajasthan Tonk 18

5
57. Gujarat Mahesana 18
58. Kerala Kollam 18
59. Haryana Karnal 18
60. Madhya Pradesh Shahdol 18
61. Goa North Goa 18
62. Kerala Pathanamthitta 18
63. Gujarat Banas Kantha 18
64. Dadra & Nagar Haveli Dadra & Nagar Haveli 17
65. Madhya Pradesh Dhar 17
66. Madhya Pradesh Ujjain 17
67. Madhya Pradesh Sheopur 17
68. Madhya Pradesh Bhind 17
69. Rajasthan Sawai Madhopur 17
70. Gujarat Rajkot 17
71. West Bengal Kolkata 17
72. Rajasthan Sikar 17
73. Kerala Palakkad 17
74. Arunachal Pradesh Dibang Valley 17
75. Madhya Pradesh Vidisha 17
76. Tamil Nadu Vellore 17
77. Rajasthan Bharatpur 17
78. Madhya Pradesh Morena 17
79. Orissa Cuttack 17
80. Tamil Nadu Sivaganga 17
81. Goa South Goa 17
82. Madhya Pradesh Shivpuri 17
83. Rajasthan Bhilwara 16
84. Assam Cachar 16
85. Madhya Pradesh Shajapur 16
86. Rajasthan Udaipur 16
87. Pondicherry Pondicherry 16
88. Tamil Nadu Nagapattinam 16
89. Rajasthan Jaisalmer 16
90. Madhya Pradesh Rajgarh 16
91. Chandigarh Chandigarh 16
92. Rajasthan Hanumangarh 16
93. Assam Hailakandi 16
94. Madhya Pradesh Satna 16
95. Kerala Thiruvananthapuram 16
96. Karnataka Chikmagalur 16
97. Tamil Nadu Tiruchirappalli 16
98. Madhya Pradesh Jabalpur 16
99. Tamil Nadu Theni 16
100. Madhya Pradesh Ratlam 16
*Number of murders, attempted murders, rapes, kidnappings, dacoities,
robberies, burglaries, thefts, riots, sexual harassments, dowry
deaths, and cruelty by husband and relatives, in the district in
1998, per 10,000 of the distict's adult population.

6
Table 4
The 100 Districts in India with the Highest Rate of Crimes Against Women*
Rank State District Crime Rate
1. Himachal Pradesh Bilaspur 17
2. Rajasthan Kota 14
3. Madhya Pradesh Mandla 12
4. Rajasthan Baran 12
5. Delhi New Delhi 12
6. Rajasthan Jhalawar 12
7. Rajasthan Bundi 11
8. Maharashtra Bhandara 11
9. Rajasthan Ganganagar 11
10. Rajasthan Chittaurgarh 10
11. Rajasthan Banswara 10
12. Maharashtra Parbhani 10
13. Madhya Pradesh Sagar 9
14. Madhya Pradesh Raisen 8
15. Madhya Pradesh Vidisha 8
16. Madhya Pradesh Guna 8
17. Jammu & Kashmir Srinagar 8
18. Maharashtra Wardha 8
19. Madhya Pradesh Sehore 8
20. Madhya Pradesh Shahdol 8
21. Rajasthan Bhilwara 8
22. Rajasthan Rajsamand 7
23. Madhya Pradesh Shivpuri 7
24. Madhya Pradesh Narsimhapur 7
25. Rajasthan Hanumangarh 7
26. Mizoram Kolasib 7
27. Maharashtra Buldana 6
28. Haryana Faridabad 6
29. Madhya Pradesh Rajgarh 6
30. Maharashtra Washim 6
31. Maharashtra Amravati 6
32. Arunachal Pradesh East Siang 6
33. Madhya Pradesh Jabalpur 6
34. Madhya Pradesh Gwalior 6
35. Jharkhand Deoghar 6
36. Gujarat Mahesana 6
37. Madhya Pradesh Bhopal 6
38. Chhattisgarh Surguja 6
39. Uttar Pradesh Kanpur Nagar 6
40. Maharashtra Akola 6
41. Andhra Pradesh Hyderabad 6
42. Rajasthan Ajmer 6
43. Maharashtra Aurangabad 6
44. Uttar Pradesh Bareilly 6
45. Maharashtra Chandrapur 6
46. Assam Cachar 6
47. Rajasthan Tonk 6
48. Madhya Pradesh Dhar 6
49. Rajasthan Bikaner 6
50. Chhattisgarh Janjgir-Champa 6
51. Uttar Pradesh Lucknow 5
52. Himachal Pradesh Sirmaur 5
53. Madhya Pradesh Chhindwara 5
54. Uttar Pradesh Aligarh 5
55. Madhya Pradesh Damoh 5
56. Madhya Pradesh Hoshangabad 5
57. Andhra Pradesh Krishna 5

7
58. Mizoram Aizawl 5
59. Haryana Kurukshetra 5
60. Tamil Nadu Perambalur 5
61. Rajasthan Dhaulpur 5
62. Jammu & Kashmir Baramula 5
63. Madhya Pradesh Chhatarpur 5
64. Delhi North East 5
65. Madhya Pradesh Datia 5
66. Delhi Central 5
67. Orissa Kandhamal 5
68. Orissa Puri 5
69. Madhya Pradesh East Nimar 5
70. Uttar Pradesh Meerut 5
71. Rajasthan Bharatpur 5
72. Madhya Pradesh Katni 5
73. Kerala Wayanad 5
74. Madhya Pradesh Dewas 5
75. Rajasthan Pali 5
76. Chhattisgarh Raipur 5
77. Madhya Pradesh Satna 5
78. Madhya Pradesh Shajapur 5
79. Andhra Pradesh Karimnagar 5
80. Madhya Pradesh Balaghat 5
81. Madhya Pradesh Ratlam 5
82. Kerala Kollam 5
83. Himachal Pradesh Solan 5
84. Gujarat Narmada 5
85. Andhra Pradesh West Godavari 5
86. Rajasthan Udaipur 5
87. Haryana Karnal 5
88. Uttar Pradesh Agra 5
89. Maharashtra Jalna 5
90. Rajasthan Jodhpur 4
91. Madhya Pradesh Mandsaur 4
92. Assam Dhemaji 4
93. Chhattisgarh Durg 4
94. Maharashtra Gadchiroli 4
95. Rajasthan Jaipur 4
96. Rajasthan Sirohi 4
97. Kerala Idukki 4
98. Madhya Pradesh Betul 4
99. Tamil Nadu Thanjavur 4
100. Gujarat Rajkot 4
*Number of rapes, kidnappings and abductions of women and young girls, molestations, sexual harassments, dowry deaths, and cruelty by
husband and relatives, in the district in 1998, per 10,000 of the
distict's female adult population
8
Table 5
The 100 Districts in India with the Largest Number of Crimes Against Public Order*
Rank State District Number of Crimes
1. Rajasthan Jaipur 3497
2. Rajasthan Sikar 1496
3. Maharashtra Pune 1354
4. Rajasthan Alwar 1247
5. Andhra Pradesh Guntur 1214
6. Rajasthan Udaipur 1198
7. Rajasthan Dausa 1150
8. West Bengal Medinipur 1109
9. Rajasthan Banswara 1092
10. Rajasthan Karauli 1081
11. Tamil Nadu Coimbatore 1068
12. Rajasthan Bharatpur 1033
13. Rajasthan Chittaurgarh 1020
14. Karnataka Kolar 986
15. Rajasthan Sawai Madhopur 848
16. Rajasthan Tonk 806
17. Kerala Kozhikode 792
18. Rajasthan Jhunjhunun 777
19. West Bengal South Twentyfour Parganas 761
20. West Bengal Hugli 749
21. Karnataka Gulbarga 733
22. Rajasthan Bhilwara 690
23. Rajasthan Kota 689
24. Tamil Nadu Vellore 682
25. Kerala Palakkad 679
26. Kerala Kannur 677
27. West Bengal North Twentyfour Parganas 677
28. Kerala Thiruvananthapuram 674
29. Rajasthan Dhaulpur 639
30. Assam Cachar 608
31. Tamil Nadu Viluppuram 589
32. Kerala Ernakulam 556
33. Tamil Nadu Cuddalore 536
34. Kerala Thrissur 529
35. Rajasthan Jhalawar 528
36. Maharashtra Thane 524
37. Kerala Kollam 505
38. Rajasthan Baran 504
39. Assam Nagaon 503
40. Tamil Nadu Dharmapuri 491
41. Bihar Purnia 490
42. Rajasthan Ajmer 488
43. Bihar Muzaffarpur 483
44. Kerala Malappuram 475
45. Assam Dhubri 443
46. Gujarat Ahmadabad 443
47. Tamil Nadu Virudhunagar 428
48. Karnataka Hassan 426
49. Uttar Pradesh Aligarh 423
50. Karnataka Bangalore 418
51. Uttar Pradesh Agra 418
52. Andhra Pradesh Karimnagar 417
53. Rajasthan Rajsamand 410
54. Karnataka Bangalore Rural 405
55. Rajasthan Nagaur 404
56. Uttar Pradesh Kanpur Nagar 403
57. West Bengal Barddhaman 396
58. Rajasthan Bundi 393

9
59. Andhra Pradesh Warangal 389
60. Karnataka Belgaum 385
61. Karnataka Bijapur 385
62. Uttar Pradesh Allahabad 383
63. Bihar Samastipur 381
64. Assam Karimganj 378
65. Tamil Nadu Tirunelveli 377
66. Bihar Rohtas 373
67. Karnataka Tumkur 372
68. Bihar Katihar 371
69. Karnataka Chitradurga 370
70. Bihar Madhubani 366
71. Bihar Gaya 364
72. Rajasthan Dungarpur 358
73. Bihar Banka 352
74. Tamil Nadu Toothukudi 339
75. Rajasthan Pali 334
76. Assam Barpeta 333
77. Bihar Sitamarhi 332
78. Kerala Kasaragod 329
79. Rajasthan Ganganagar 329
80. Rajasthan Churu 326
81. Bihar Aurangabad 325
82. West Bengal Birbhum 322
83. Tamil Nadu Tiruvanamalai 320
84. Bihar Munger 320
85. West Bengal Kolkata 320
86. Kerala Kottayam 318
87. West Bengal Nadia 311
88. Kerala Alappuzha 310
89. Tamil Nadu Thiruvallur 309
90. Maharashtra Nashik 305
91. Uttar Pradesh Lucknow 300
92. Maharashtra Nagpur 299
93. Tamil Nadu Madurai 299
94. Kerala Idukki 291
95. Andhra Pradesh Prakasam 288
96. Bihar Saran 285
97. Andhra Pradesh Hyderabad 281
98. Rajasthan Hanumangarh 279
99. Andhra Pradesh Medak 275
100. Bihar Vaishali 275
* Number of riots and cases of arson in the district in 1998

10
Table 6: 100 Districts in India wth the Highest Crimee Levels and Rates, by State Number of Crimes Crimes per 10,000 pop
Violent
Crimes
Crimes
Against
Women
Public
Order
Crimes
Violent
Crimes
Crimes
Against
Women
A & N Isl
(2)
- - - - -
An Prad
(23)
14 12 6 2 5
Ar Prad
(13)
- - - 2 2
Assam
(23)
- - 5 2 5
Bihar
(37)
3 - 13 - -
Chandigarh
(1)
- - - 1 -
Chattisgarh
(16)
2 3 - - 7
D & NH
(1)
- - - 1 -
Dam & Diu
(2)
- - - - -
Delhi
(9)
4 2 - 5 3
Goa
(2)
- - - 2 -
Gujarat
(24)
7 6 1 4 6
Haryana
(19)
1 1 - 2 4
H Prad
(11)
- - - 1 3
J &K
(14)
- 1 - - 3
J'kand
(18)
1 - - - 1
Karnataka
(27)
8 2 9 5 -
Kerala
(14)
8 6 12 5 4
L'deep
(1)
- - - - -
M Prad
(45)
7 14 - 23 34
Maharashtra
(35)
17 17 4 7 14
Manipur
(9)
- - - - -
Meghalaya
(7)
- - - - -
Mizoram
(8)
1 - - 4 2
Nagaland
(8)
- - - 1 -
Orissa
(30)
2 1 - 2 3
P'cherry
(1)
- - - 1 -
Punjab
(17)
- - - - -
Raj'stan
(32)
12 17 26 22 25
Sikkim
(1)
- - - - -
T Nadu
(30)
8 1 11 7 3
Tripura
(4)
- - - - -
U Prad
(70)
9 11 5 - 6
Uttaranchal
(13)
- - - - -
W Beng
(18)
6 7 8 1 -

11
Table 7
Naxalite Affected versus Naxalite Free Districts in Indis:
Indicators of Deprivation and Rates of Crime
Naxalite Affected
Districts
Naxalite Free Districts
Poverty Rate (%) 32 24
Literacy Rate 60.1 66.6
Infant Mortality Rate 72.3 73.4
Immunisation Rate 51.8 52.8
Pregnancy Assitance 43.0 50.5
Safe Drinking Water 68.1 73.5
Pucca Roads 44.4 35.4
Number of Violent
Crimes
1,655 1,592
Number of Crimes
Against Women
217 198
Number of Crimes
Against Public Order
222 169
Poverty Rate: % of population below the poverty line
Literacy Rate: Percentage of Adult Population which is literate
Infant Mortality Rate: Number of live births, per 1,000 births, that die before the age of one.
Immunisation Rate: Percentage of children, 0-6 years of age, fully immunised.
Pregnancy Assistance: Percentage of women reciving skilled assistance during pregnancy
Safe Drnking Water: Percentage of habitations covered by safe drinking water
Pucca Roads: Percentage of villages not connected by pucca road Number of Violent Crimes: Number of murders, attempted murders, rapes, kidnappings, dacoities,
robberies, burglaries, thefts, riots, sexual harassments, dowry deaths, and cruelty by husband and
relatives, in the district in 1998.
Number of Crimes Against Women: Number of rapes, kidnappings and abductions of women and
young girls, molestations, sexual harassments, dowry deaths, and cruelty by husband and relatives, in
the district in 1998.
Number of “Crimes against Public Order”: Number of Riots and Cases of Arson.
12
Table 8
Regression Estimates of the Crime Equations+
Dependent Variable is the Number in District of:
Violent Crimes Crimes Against
Women
Crimes
Against Public
Order
Naxalite Activity -191.67
(1.30)
-25.87
(1.55)
-
Proportion of the
district's population
which is rural
-33.29**
(8.86)
-1.19**
(2.79)
-
Poverty rate in
district
- -
-2.41**
(3.80)
Literacy rate in
district
16.17**
(2.20)
10.24**
(3.36)
4.21**
(3.31)
Squared Literacy
rate in district
- -0.06**
(2.48)
-
Ratio of female to
male literates in
district
-17.00**
(2.33)
-2.35**
(2.85)
-7.42**
(5.65)
Proportion of
habitations in
district with safe
drinking water
-3.67
(1.57)
-0.47*
(1.78)
-1.96**
(4.82)
Adult male
population of
district (0000)
10.94**
(5.38)
2.44**
(10.57)
2.05**
(12.99)
Squared adult male
population of
district (0000)
0.029**
(4.48)
-0.001*
(1.65)
-
Intercept 3516.53**
(5.23)
-82.38
(0.73)
470.28**
(5.80)
Mean of Dependent
variable
1,622 201 177
Number of
observations
547 547 547
R2 (adj) 0.59 0.50 0.29
Chi-squared 798.78 555.78 221.38
Notes to Table 8: + Seemingly Unrelated Regression Equations (SURE) estimates
Numbers in parentheses are z-scores **
significant at 5% level; * significant at 10% level
The chi-squared statistics reports the result of testing the null hypotheses that all the
slope coefficients are zero.

13
Table 9
Logit Estimates of Naxalite Activity
All States States Affected by
Naxalite Activity+
Odds-Ratios
(z-scores)
Odds-Ratios
(z-scores)
Proportion of the
district's population
which is rural
1.01
(1.12)
1.02
(1.53)
Poverty rate in district 1.05**
(5.18)
1.02**
(2.40)
Literacy rate in district 0.96**
(3.36)
0.96**
(2.90)
Female work
participation in district
1.09**
(5.39)
1.08**
(4.83)
Safe Drinking Water
Coverage in district
0.98**
(3.02)
0.98**
(2.91)
Number of male adults in
district (0000)
1.02**
(4.04)
1.01**
(3.77)
Squared adult male
population of district
(0000)
1.00
(1.44)
-
Number of observations 559 348
pseudo-R2 0.24 0.17
Likelihood Ratio Test of
slope coefficients = 0 χ
2(7)=116 χ
2(7)=65
Notes to Table 9:
Numbers in parentheses are z-scores **
significant at 5% level; * significant at 10% level
+Andhra Pradesh, Bihar, Chhattisgarh, Jharkhand, Karnataka, Madhya Pradesh,
Maharashtra, Orissa, Tamil Nadu, and West Bengal.

14
Table 10
Predictions from the logit model of Table 9:
(estimated over all districts in India)
True (D) False (~D) Total
Classified
+ 21 12 33
- 67 459 526
Total 88 471 559
Sensitivity
Pr(+|D)
23.86%
Specificity
Pr(-|~D)
97.45%
Positive
predictive value
Pr(D|+)
63.64%
Negative
predictive value
Pr(~D|-)
87.26%
Classified + if predicted Pr(D) >= .5
True: naxal=1; False: naxal=0
Correctly classified: 85.87%
Table 11
Predictions from the logit model of Table 9:
(estimated over all districts in Naxalite Affected
States in India)
True(D) False (~D) Total
Classified
+ 30 16 46
- 58 244 302
Total 88 260 348
Sensitivity
Pr(+|D)
34.09%
Specificity
Pr(-|~D)
93.85%
Positive
predictive value
Pr(D|+)
65.22%
Negative
predictive value
Pr(~D|-)
80.79%
Classified + if predicted Pr(D) >= .5
True: naxal=1; False: naxal=0
Correctly classified: 78.75%

15
Figure 1
Sensitivity versus 1-Specificity when the cutoff point is varied:
all disticts in India
0.0
00.2
50.5
00.7
51.0
0
Sensitiv
ity
0.00 0.25 0.50 0.75 1.001 - Specificity
Area under ROC curve = 0.8630

16
Figure 2
Sensitivity versus 1-Specificity when the cutoff point is varied:
All disticts in Naxalite Affected States of India 0.0
00.2
50.5
00.7
51.0
0
Sensitiv
ity
0.00 0.25 0.50 0.75 1.001 - Specificity
Area under ROC curve = 0.7846

17
Table 12
Districts Which Would Not Have Had Naxalite Activity Under Simulation 1*
State District
Bihar Rohtas
Bihar Sitamarhi
Bihar Khagaria
Bihar Kaimur (Bhabua)
Bihar Aurangabad
Jharkhand Bokaro
Jharkhand Purbi Singhbhum
Orissa Sundargarh
Orissa Malkangiri
Orissa Koraput
Orissa Nabarangapur
Orissa Kendujhar
Karnataka Shimoga
Uttar Pradesh Chandauli
Simulation 1: If the poverty rate in a district was greater than the all-India average (26
percent), it was reduced to the national figure.
Table 13
Additional Districts+ Which Would Not Have Had
Naxalite Activity Under Simulation 2*
State District
Bihar Banka
Bihar Darbhanga
Bihar Jehanabad
Bihar Patna
Bihar Rohtas
Chhattisgarh Bastar
Jharkhand Giridih
Jharkhand Kodarma
Karnataka Chikmagalur
Orissa Kandhamal
Orissa Rayagada
Uttar Pradesh Mirzapur
Uttar Pradesh Sonbhadra
West Bengal Hugli +
Additional to those shown in Table 12
*Simulation 2: If the poverty rate in a district was greater than the all-India average
(26 percent), and the literacy rate was lower than the all-India average (65 percent),
the poverty rate was reduced, and the literacy rate was raised, to their respective
national values.