deposit insurance and deposit products
TRANSCRIPT
1
Deposit Insurance and Deposit Products
Lucy Chernykh
Clemson University
Clemson, SC 29634 USA
Vladimir Sokolov
Higher School of Economics
Moscow, Russia
This draft: November 2012
(Preliminary: Not for citation)
Abstract:
This study examines the design of insured and uninsured deposit products in a high-growth banking
market with aggressive competition for limited deposit funds. Using detailed data from almost
80,000 household deposit products offered in a large sample of Russian banks, we document that
banks use a broad variety of price and non-price contract terms to compete in tight deposit markets.
Consistent with the market discipline hypothesis, we also find that interest rates on uninsured
deposit products are sensitive to bank risk profiles while the interest rates on insured deposits are
driven mostly by the product-level characteristics. Since insured depositors can easily switch to
banks that offer best deposit terms, high-risk and low-risk banks have to compete on equal terms in
the insured market segment, by offering high interest rates and/or valuable non-price contract terms.
From a regulatory perspective, our findings suggest that the deposit rates monitoring and the deposit
rate ceiling for preventing insured deposit accumulation by risky bank could be ineffective as banks
can substitute price for non-price deposit contract terms.
Keywords: Emerging markets banking, deposit insurance, aggressive deposit pricing, household
deposits, deposit products, regulatory discipline, market discipline, Russia

2
1. Introduction
The costs and benefits of the deposit insurance systems provide a food for thought and long-
standing debates for a large body of theoretical and empirical banking literature1. The moral hazard
issues triggered by the deposit insurance provisions are even more controversial in the context of the
rapidly growing emerging banking markets2. In these fast-growth and high-risk environments, the
competition for deposit funds can be severe as it is driven by both, the unsatisfied demand for bank
loans from the private sector and by the limited sources of nondeposit funds available for banks in
emerging economies.
In this environment, the banking and deposit insurance regulators face a number of
challenges that are not yet addressed by the prior empirical literature. To compete for insured
depositors that are indifferent to bank-level characteristics but are highly sensitive to deposit
product characteristics, high-risk and aggressively growing banks have incentives to offer above-
the-market interest rates to attract limited deposit funds. Sound banks that need access to the same
pool of funds may have to follow the competition by increasing the rates too. The adverse combined
effect of these risk-taking behaviors in a funds-constrained but fast-growing banking market is the
overall increase of cost of funds for all banks, followed by the allocation of high-cost funds into the
high-rate (and high-risk) loans and/or shrinking interest margins.
In this paper, we explore the fundamental differences in the insured and uninsured contracts’
terms in order to shed light on how deposit contracts are structured in the emerging market with
partial deposit insurance provisions. We expect that insured depositors, with deposit size below the
1 See, for example, Demirguc-Kunt and Detragiache (2002)
2 The applicability of the market discipline monitoring and influence in the emerging banking market context is
discussed in a number of theoretical and regulatory papers, including Calomiris and Powell (2001); Caprio and Honohan
(2004); Levy-Yeyati, Martinez-Peria, and Schmukler (2004). The relevant empirical studies that focus on depositor
discipline in these markets include Martinez-Peria and Schmukler (2001); Mondschean and Opiela (1999); Chernykh
and Cole (2011); Karas, Pyle, and Schoors (2010); Ungan, Caner, and Özyildirim (2008). Collectively, they support the
argument that the depositor discipline seems to be the most promising and reliable channel of the market discipline in
the emerging banking sector.

3
coverage limit, will be sensitive almost exclusively to the deposit contract pricing and service
features and that they will be overall indifferent to the bank risk and performance profiles. We also
expect that uninsured depositors, on the contrary, will be highly sensitive to bank risk-taking and
that it will be costly to risky banks to issue such contracts. In addition, in the environment with
regulated deposit rates (recommended interest rate ceilings), we expect that banks will use a wide
variety of non-price contract terms to mask their aggressive deposit contracts and to substitute price
for nonprice contract terms.
To address these relevant research questions, this study examines the banks’ incentives
structure of pricinginsured and uninsured deposits using large and unique dataset of 80,034
household deposit products issued in the post-deposit insurance introduction and post-crisis Russian
banking sector. Our detailed, three-dimensional (bank-month-deposit product) dataset allows us
not only to identify a broad set of price and non-price terms for each deposit product but also to
match the contract terms characteristics with monthly bank-level data for a sample of 371 Russian
banks that are the major players on the country’s deposit market. Our data also allow us, as a next
step, to trace the deposit growth in sample banks in response to all changes in the publicly offered
deposit contracts on monthly bases.
Using this new dataset, we are able to identify banks’ strategies in price and non-price
competition in a deposit market and, more importantly, to test how the approaches to structure
insured and uninsured contracts differ across high- and low-risk banks.
Our empirical results to date are as follows3. First, we document that banks in competitive
deposit markets issue a large variety of deposit products and utilize a very broad range of non-price
deposit contract terms. Overall, in addition to the size and maturity dimensions, we identify and
describe twelve distinct deposit contract features, such as targeting specific social groups, offering
3 The data analysis is still in process. We outline remaining empirical steps in more details at the end of this draft.
4
multicurrency conversion, automatic renewal, early termination privileges, cross-selling with
investment and insurance products, and/or other options4. Second, we find that uninsured deposit
pricing is driven by a different set of determinants compared to the insured deposits. More
specifically, deposit rates on the uninsured deposits are negatively and significantly associated with
the bank capitalization and the assets size risks. Third, we find that banks in less competitive
markets offer lower deposit rates, suggesting that the market-wide deposit rates increases may be
largely driven by the degree of the local competition. Finally, we find that state banks and foreign
banks offer lower rates on all deposit contracts, even after controlling for all other bank and deposit-
level characteristics.
We expect that this empirical study and our unique product-level data will contribute to the
emerging market banking literature in at least the following three ways. First, we provide early but
comprehensive evidence on how banks in these markets structure the insured and uninsured
products. Second, this study shows at the detailed, product-level, data how the moral hazard
incentives associated with insured deposits and the market discipline incentives associated with
uninsured deposits affect the banks’ deposit pricing decisions. Third, we provide empirical evidence
on the coexistence of implicit and explicit deposit pricing in an emerging market context. The last
but not the least, the study informs the non-trivial regulatory decisions on how to monitor and to
regulate the insured deposit pricing in the environment with pronounced moral hazard effects where
the high-risk and high-growth banking institutions aggressively and creatively compete for the
limited retail deposit funds.
4 The rich variety of deposit product features and options illustrates an interesting phenomenon of completing an
incomplete financial market by banking institution in a country with a narrow set of investment opportunities available
for individual investors.
5
2. Household deposits in Russia: Deposit market, deposit products, and regulatory issues.
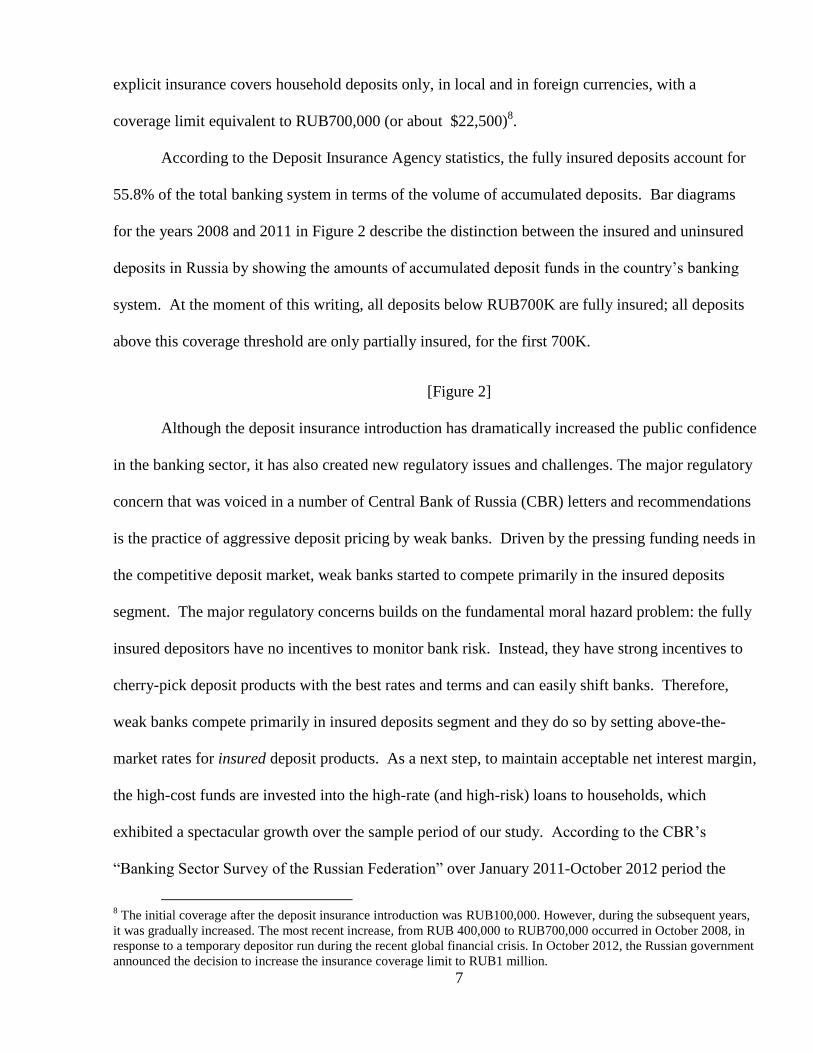
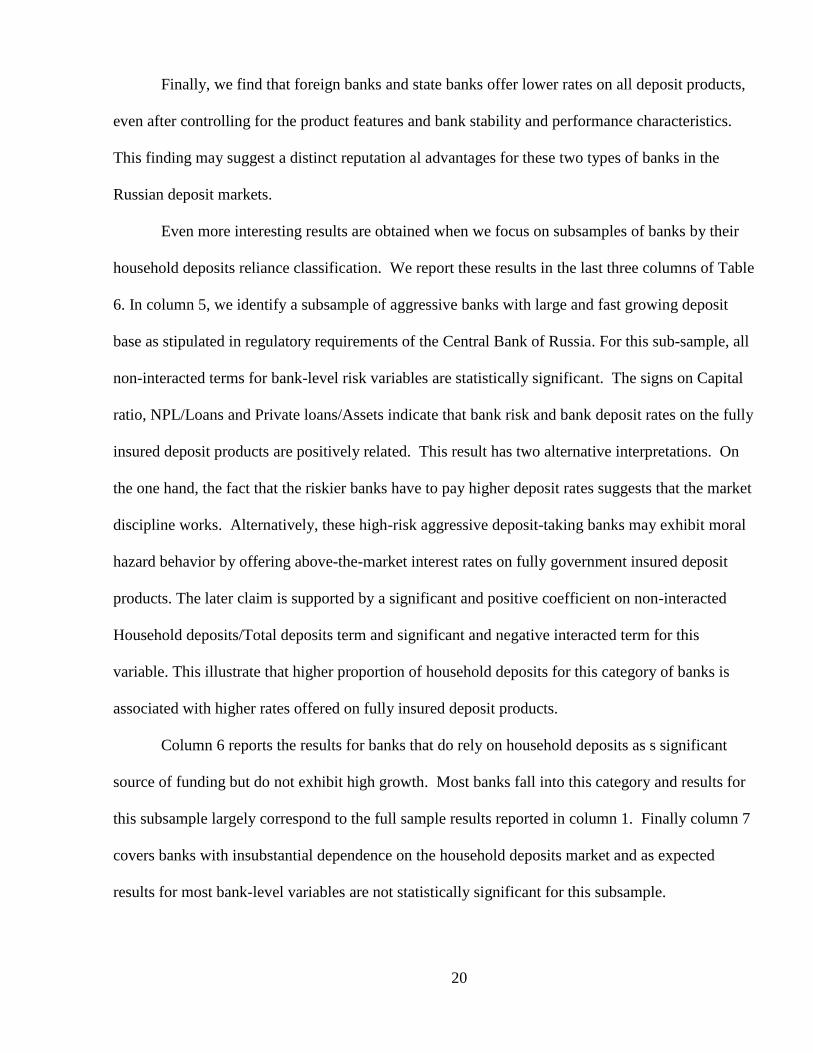
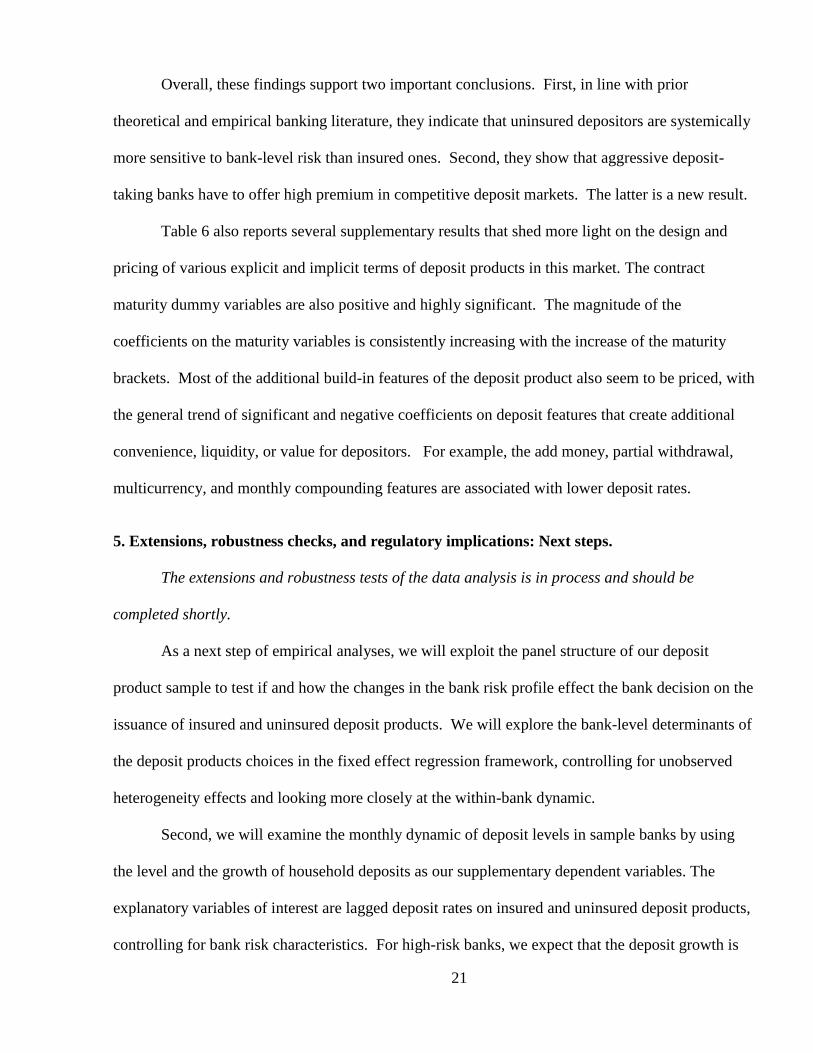
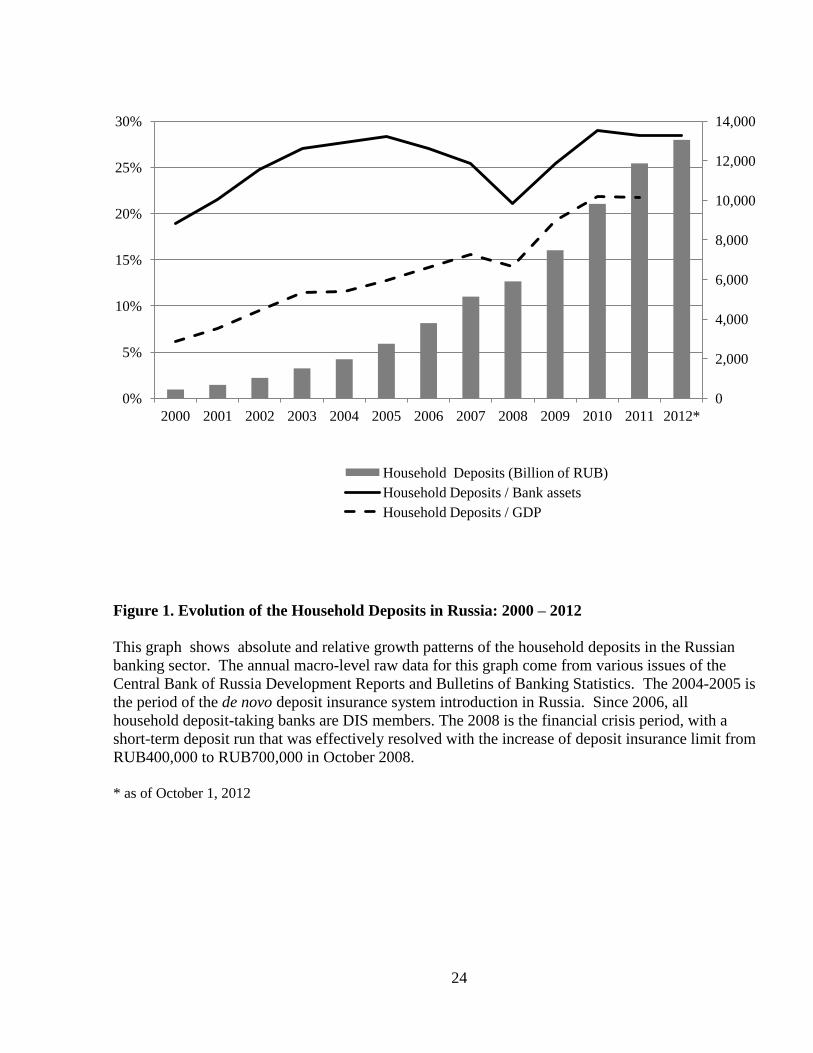
The household deposits are an essential source of funds for the rapidly growing Russian
banking sector. By October 2012, the total volume reached RUB13,060 billion versus only about
RUB297 billion as of the end of 2000. On the annual basis, this spectacular growth is equivalent to
a 37% average annualized growth rate. In the relative terms, the banks’ reliance on this source of
financing has also increased as the household deposit to asset ratio shifted from 18.9% to 28.5%
during the same twelve-year period (Figure 1).
[Figure 1]
In the recent period, when the availability of the foreign external borrowing sources for
Russian banks reduced, the household deposits became the primary source of the relatively long-
term funds. For example, for maturities above one year (which is considered to be a long-term
maturity in this emerging market context), the aggregate ratio of households deposits to firms
deposits is 2.5 times. This is because about 38% of corporate clients funds are transaction accounts
(or demand) accounts balances5. When it comes to alternative long-term nondeposit funds, banks
options are both, limited and expensive. For example, the corporate bonds issued by Russian banks
finance less than 1.6% of their total assets and the yields on these funds remain high, averaging
13.8% in 2009, 9.2% in 2010, and 8.6% in 2011. Moreover, the access to long-term domestic and
Eurobond capital markets is available to selected large banks only and the total number of new bank
bonds issues in the last three years was only 25 in 2009, 58 in 2010, and 69 in 20116.
5 Another factor that increases the competition for household deposits is high concentration of deposit market in Russia.
The country’s largest commercial bank, state-controlled Sberbank, controls 46.6% of deposit market share. The top 30
banks by the volume of accumulated deposits, including Sberbank, control 77.7% of deposits. According to the Russian
Deposit Insurance Agency statistics, the share of the remaining, medium and small size banks, is slowly increasing, from
about 20.9% in 2008 to 22.3% in 2011, suggesting a fierce competition for deposit funding among the small market
players.
6 Source: Central Bank of Russia, “Financial Markets Review” (2011).
6
Given the high demand for funding in these emerging banking markets, there is currently a
severe competition for the household funds in this market. According to the Russian Statistical
Agency, the share of the population income allocation in the official financial system savings has
dropped from 14.6% to 10.3%. This drop was driven by the relatively large increase in the current
consumption expenses, from 69.9% to 74.1%, and by the relatively small increase in the “under-the-
mattress” foreign currency savings, from 3.7% to 4.3%.
The typical household deposit in Russia is a fixed term and fixed rate saving contract, with
maturities ranging from one month to three years or above. A typical commercial bank offers a
broad variety of deposit products, with diverse non-price terms and services designed to attract a
wide retail customers’ base. Some banks offer hybrid deposit products that are linked to investment
or insurance contracts issued by the same bank. To remain competitive, banks frequently change
and redesign their deposit products, label them with catchy brand names, and advertise them widely
at the local and/or national market. In Appendix 1, we present two examples that illustrate a broad
range of deposit products in the country’s commercial banks in any given month. (We provide
additional details on the design of deposit products in the Data section.)
The de novo deposit insurance system in Russia was introduced in summer 2004, for
household deposits only. As of the end of 2005, after the final stage of the deposit insurance
introduction in Russia, the deposit insurance membership became mandatory for all household
deposit-taking banks. Banks that failed to pass the regulatory on-site examinations have lost their
deposit-taking privileges7. As of the end of 2011, the country’s Deposit Insurance Agency registry
included 796 banks with an active deposit-taking license or 86.3% out of 922 Russian banks. The
7 For the details of the multi-stage deposit insurance introduction in Russia see Chernykh and Cole (2011). Karas, Pyle,
and Schoors (2010) explore depositor discipline in the pre-deposit insurance period in the Russian deposit markets.
Ungan, Caner, and Özyildirim (2008) document the depositors’ behavior during the early stages of the deposit insurance
introduction in this country.
7
explicit insurance covers household deposits only, in local and in foreign currencies, with a
coverage limit equivalent to RUB700,000 (or about $22,500)8.
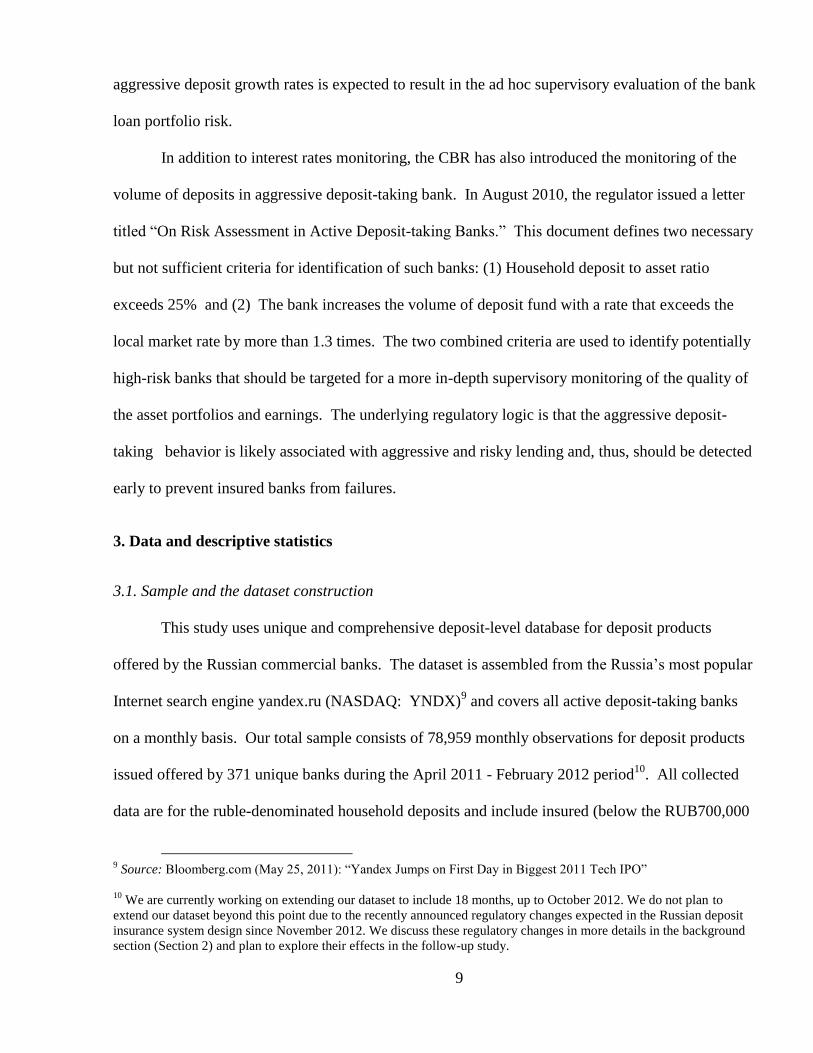
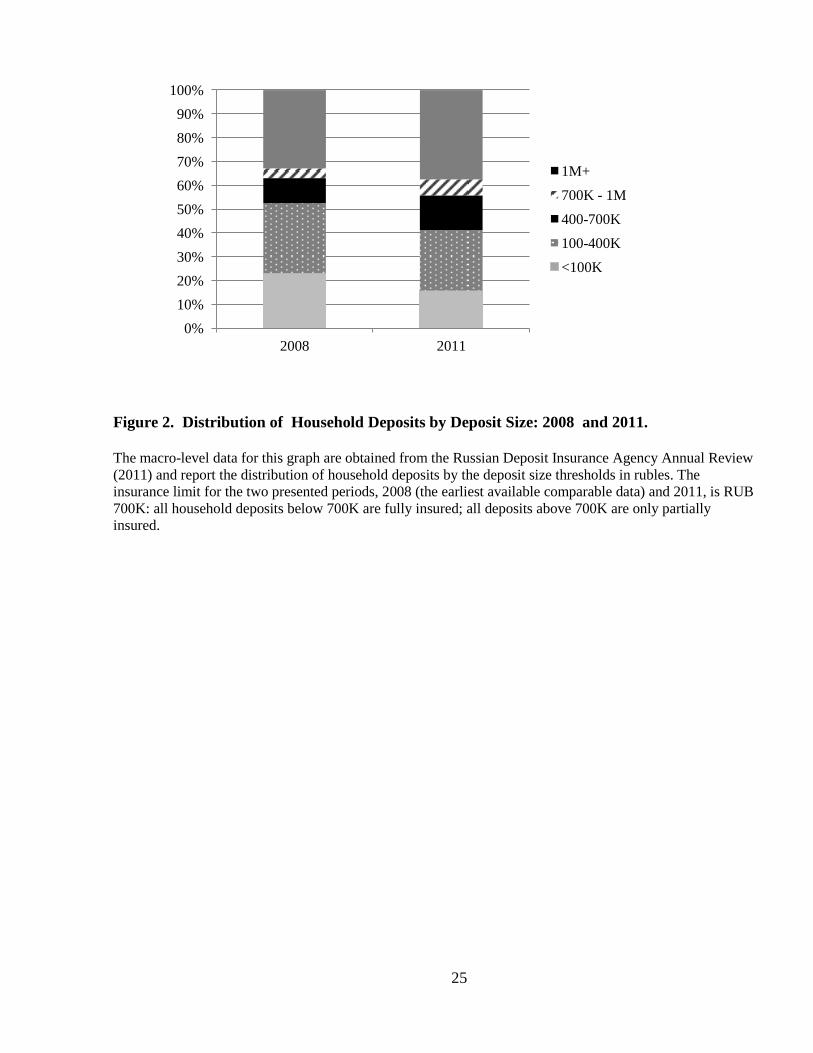
According to the Deposit Insurance Agency statistics, the fully insured deposits account for
55.8% of the total banking system in terms of the volume of accumulated deposits. Bar diagrams
for the years 2008 and 2011 in Figure 2 describe the distinction between the insured and uninsured
deposits in Russia by showing the amounts of accumulated deposit funds in the country’s banking
system. At the moment of this writing, all deposits below RUB700K are fully insured; all deposits
above this coverage threshold are only partially insured, for the first 700K.
[Figure 2]
Although the deposit insurance introduction has dramatically increased the public confidence
in the banking sector, it has also created new regulatory issues and challenges. The major regulatory
concern that was voiced in a number of Central Bank of Russia (CBR) letters and recommendations
is the practice of aggressive deposit pricing by weak banks. Driven by the pressing funding needs in
the competitive deposit market, weak banks started to compete primarily in the insured deposits
segment. The major regulatory concerns builds on the fundamental moral hazard problem: the fully
insured depositors have no incentives to monitor bank risk. Instead, they have strong incentives to
cherry-pick deposit products with the best rates and terms and can easily shift banks. Therefore,
weak banks compete primarily in insured deposits segment and they do so by setting above-the-
market rates for insured deposit products. As a next step, to maintain acceptable net interest margin,
the high-cost funds are invested into the high-rate (and high-risk) loans to households, which
exhibited a spectacular growth over the sample period of our study. According to the CBR’s
“Banking Sector Survey of the Russian Federation” over January 2011-October 2012 period the
8 The initial coverage after the deposit insurance introduction was RUB100,000. However, during the subsequent years,
it was gradually increased. The most recent increase, from RUB 400,000 to RUB700,000 occurred in October 2008, in
response to a temporary depositor run during the recent global financial crisis. In October 2012, the Russian government
announced the decision to increase the insurance coverage limit to RUB1 million.

8
total volume of loans to households grew by 75.6% from 4.08 to 7.18 trillion rubles while the
volume of household deposits grew by 33% from 9.82 to 13.05 trillion rubles.
The combined effects of these factors, as anticipated by the regulators, is the flight of insured
household deposits from relatively stable to relatively risky banks, the increase of costs of funding
for all banks in the system (as sound banks, to retain their deposit market share, are forced to
respond with proportional rates’ increases), and the increase of high-risk assets in banks’ portfolios.
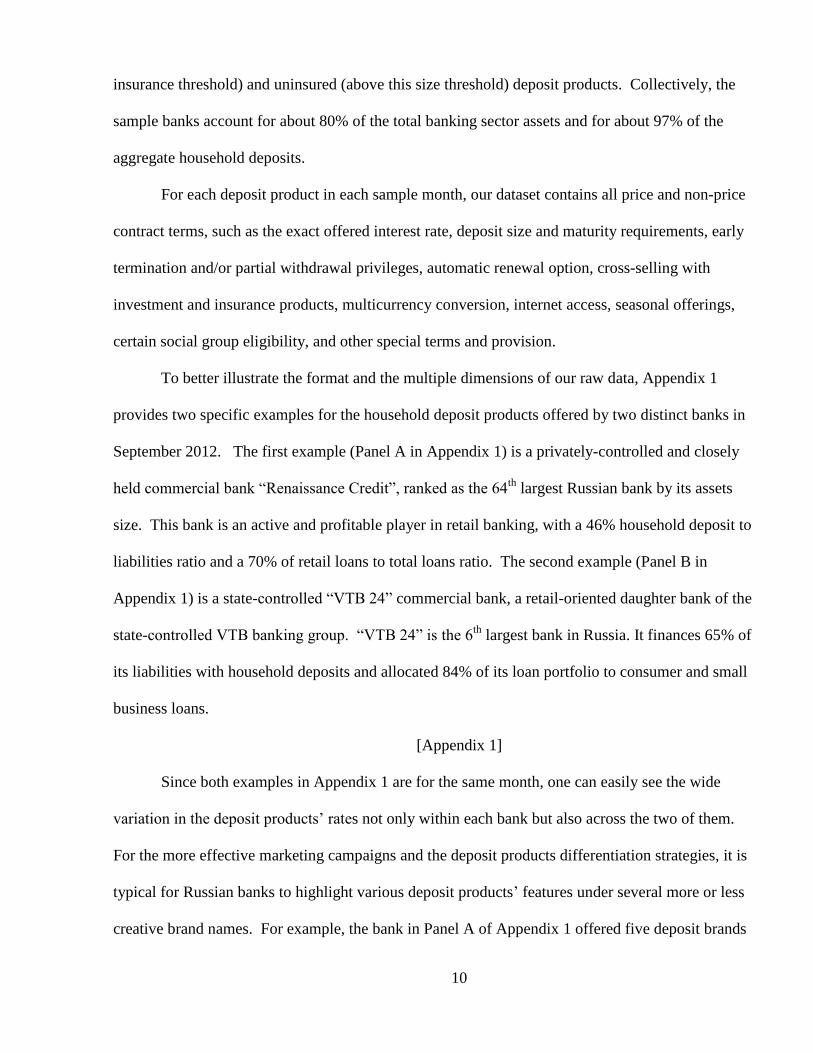
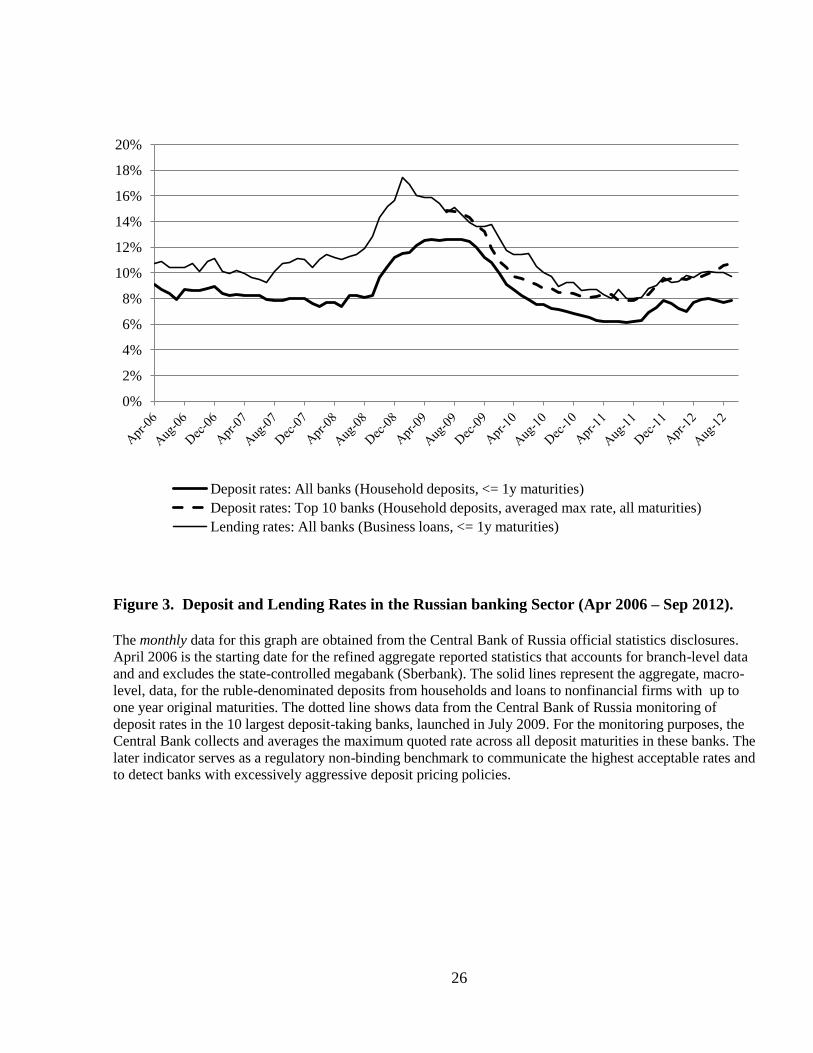
To illustrate these concerns, solid lines in Figure 3 show the evolution of the nominal deposit
and lending interest rates in Russia. The relatively stable spread between these two rates in post-
crisis period suggests that higher rates on deposits are transmitted to higher rates in loans, and vise
verse. The dotted line in Figure 3 illustrates the regulatory attempt to limit bank risk-taking by
introducing the market monitoring of the highest acceptable deposit interest rates. The deposit rates
monitoring was launched by the Central Bank of Russia in July 2009. It traces the maximum
interest rates in the Russian household market by aggregating and averaging the highest interest rate
offered on a deposit product in each of the ten largest deposit-taking Russian banks, every ten days.
As suggested by the graph patterns, the introduction of the CBR interest rates monitoring coincides
with the gradual reduction in rates (and we do not imply the causality of this link yet).
[Figure 3]
The maximum deposit rate in the top 10 banks is now used as an indicative benchmark for
deposit pricing. The regulator strongly recommends that banks avoid setting interest rate on any of
their deposit products in access of monitoring rate plus 1.5%. Most recently, in October 2012, the
1.5% margin was increased to 2%. However, the regulator simultaneously changed the
computational approach and started to account for the effects of the hybrid and complex deposit
products that can be priced implicitly. The violation of the recommended threshold coupled with
9
aggressive deposit growth rates is expected to result in the ad hoc supervisory evaluation of the bank
loan portfolio risk.
In addition to interest rates monitoring, the CBR has also introduced the monitoring of the
volume of deposits in aggressive deposit-taking bank. In August 2010, the regulator issued a letter
titled “On Risk Assessment in Active Deposit-taking Banks.” This document defines two necessary
but not sufficient criteria for identification of such banks: (1) Household deposit to asset ratio
exceeds 25% and (2) The bank increases the volume of deposit fund with a rate that exceeds the
local market rate by more than 1.3 times. The two combined criteria are used to identify potentially
high-risk banks that should be targeted for a more in-depth supervisory monitoring of the quality of
the asset portfolios and earnings. The underlying regulatory logic is that the aggressive deposit-
taking behavior is likely associated with aggressive and risky lending and, thus, should be detected
early to prevent insured banks from failures.
3. Data and descriptive statistics
3.1. Sample and the dataset construction
This study uses unique and comprehensive deposit-level database for deposit products
offered by the Russian commercial banks. The dataset is assembled from the Russia’s most popular
Internet search engine yandex.ru (NASDAQ: YNDX)9 and covers all active deposit-taking banks
on a monthly basis. Our total sample consists of 78,959 monthly observations for deposit products
issued offered by 371 unique banks during the April 2011 - February 2012 period10
. All collected
data are for the ruble-denominated household deposits and include insured (below the RUB700,000
9 Source: Bloomberg.com (May 25, 2011): “Yandex Jumps on First Day in Biggest 2011 Tech IPO”
10
We are currently working on extending our dataset to include 18 months, up to October 2012. We do not plan to
extend our dataset beyond this point due to the recently announced regulatory changes expected in the Russian deposit
insurance system design since November 2012. We discuss these regulatory changes in more details in the background
section (Section 2) and plan to explore their effects in the follow-up study.
10
insurance threshold) and uninsured (above this size threshold) deposit products. Collectively, the
sample banks account for about 80% of the total banking sector assets and for about 97% of the
aggregate household deposits.
For each deposit product in each sample month, our dataset contains all price and non-price
contract terms, such as the exact offered interest rate, deposit size and maturity requirements, early
termination and/or partial withdrawal privileges, automatic renewal option, cross-selling with
investment and insurance products, multicurrency conversion, internet access, seasonal offerings,
certain social group eligibility, and other special terms and provision.
To better illustrate the format and the multiple dimensions of our raw data, Appendix 1
provides two specific examples for the household deposit products offered by two distinct banks in
September 2012. The first example (Panel A in Appendix 1) is a privately-controlled and closely
held commercial bank “Renaissance Credit”, ranked as the 64th
largest Russian bank by its assets
size. This bank is an active and profitable player in retail banking, with a 46% household deposit to
liabilities ratio and a 70% of retail loans to total loans ratio. The second example (Panel B in
Appendix 1) is a state-controlled “VTB 24” commercial bank, a retail-oriented daughter bank of the
state-controlled VTB banking group. “VTB 24” is the 6th
largest bank in Russia. It finances 65% of
its liabilities with household deposits and allocated 84% of its loan portfolio to consumer and small
business loans.
[Appendix 1]
Since both examples in Appendix 1 are for the same month, one can easily see the wide
variation in the deposit products’ rates not only within each bank but also across the two of them.
For the more effective marketing campaigns and the deposit products differentiation strategies, it is
typical for Russian banks to highlight various deposit products’ features under several more or less
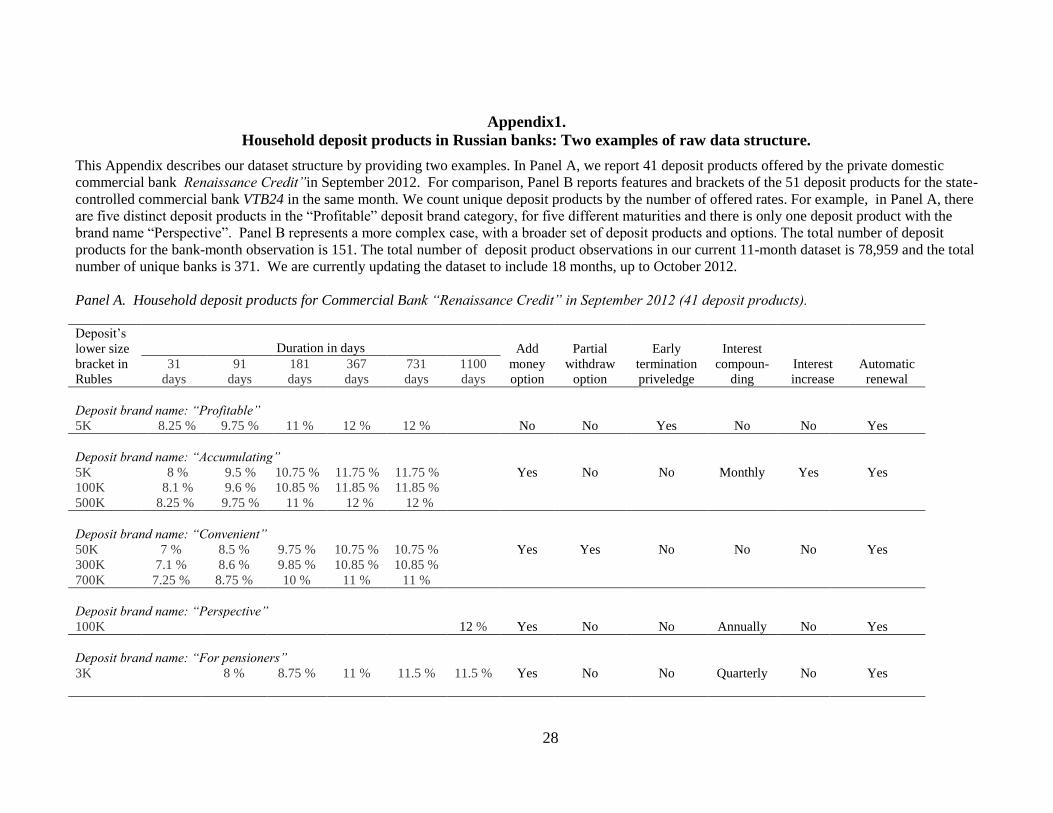
creative brand names. For example, the bank in Panel A of Appendix 1 offered five deposit brands

11
in September 2012: “Profitable”, “Accumulating”, “Convenient”, “Perspective”, and “For
Pensioners.”
For the purpose of this study, we identify unique deposit products by the number of distinct
interest rates offered by the bank in each month. The bank in Panel A offers 41 deposit products,
with an interest rates ranging from 7% for the small-size 31 day deposit with three non-price terms
to the 12% on four different deposits with above one year maturity. The deposit size brackets for
this bank product also reveal that it focuses on insured deposits. We imply that its deposit rate
policy is aggressive because the highest offered deposit rate (12%) exceeds the market monitoring-
based and regulatory recommended level for the maximum rate by 1.32% (as shown by the dotted
line in Figure 3 for September 2012 data point, the highest household deposit rate averaged across
deposit products in the major banks is 10.68% ).
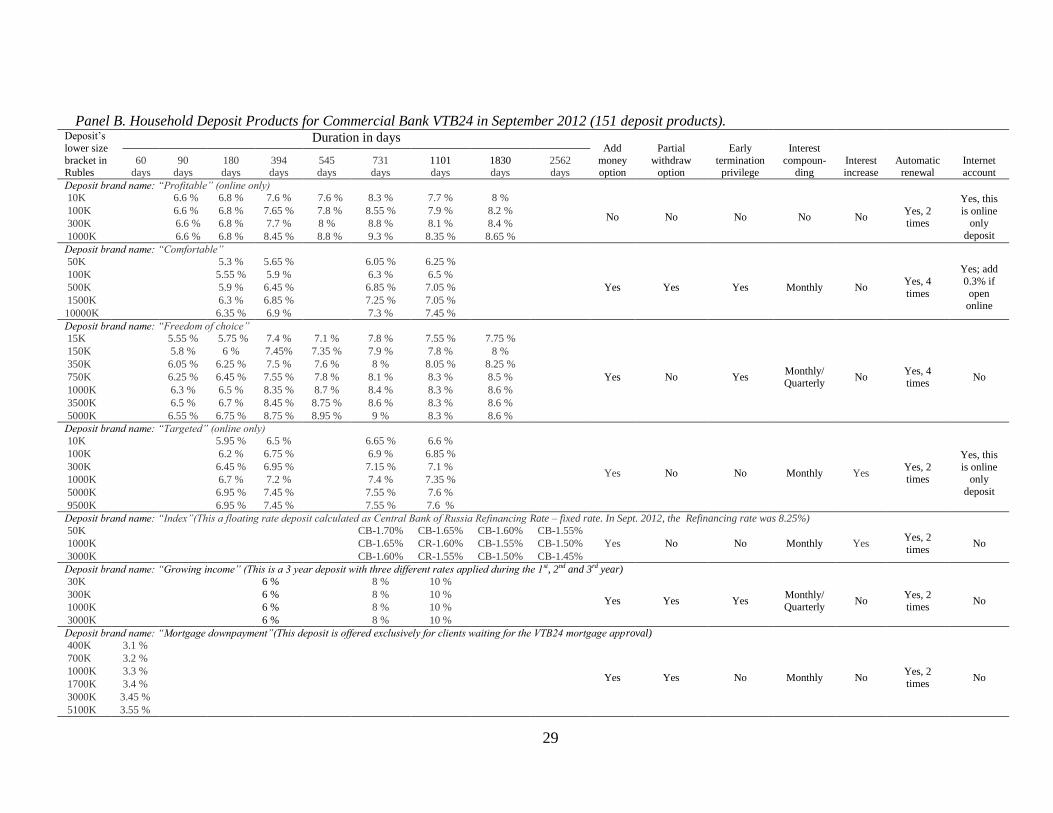
The second illustrative bank, described in Panel B, offers as many as 151 deposit products
and focuses on both, insured and uninsured ones. Its deposit rates are visibly lower than in the first
bank and range from a minimum of 3.1% to a maximum of 10%. Thus, the highest offered rate in
this bank is below the regulatory monitoring threshold in September 2012 by 0.68% (i.e. 10% -
10.68% = -0.68%).
3.1. Deposit products’ characteristics
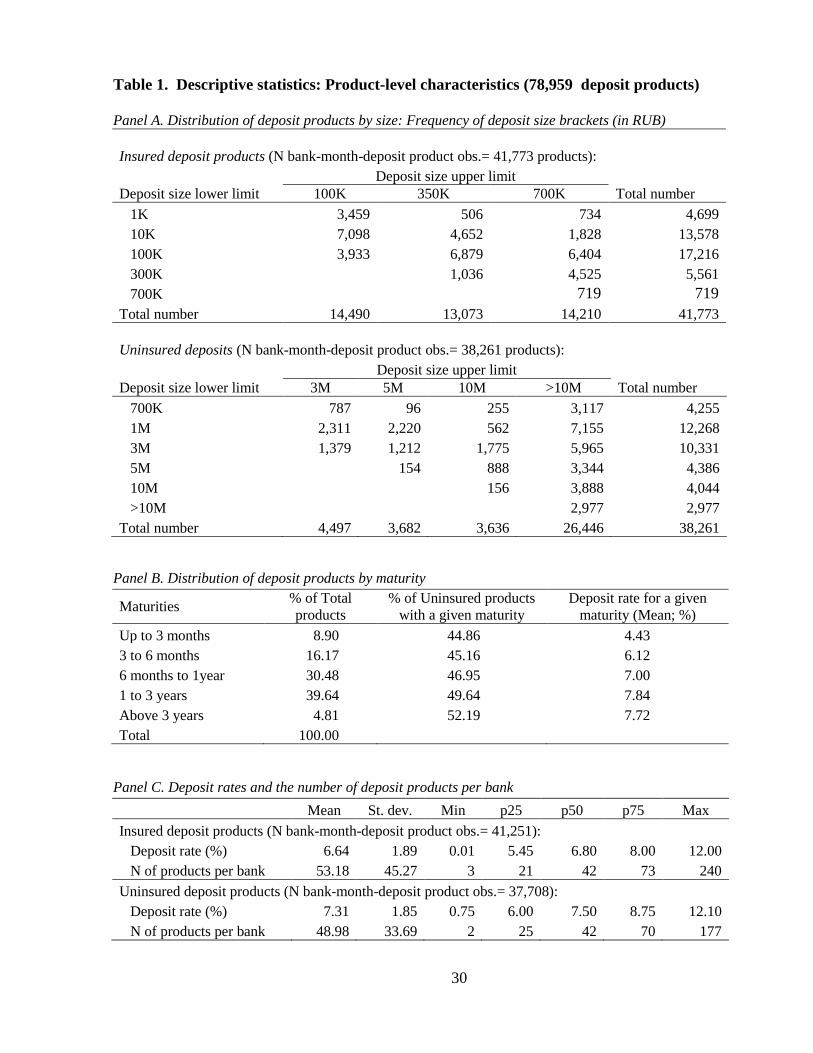
Table 1 reports a number of fundamental product-level characteristics in our dataset for
80,034 bank-month-deposit product observations, including 41,773 (or 52.1% of total) insured
products and 38,261 uninsured ones (47.9%). As explained in the Background section, all
household deposits below RUB700K are fully insured; all deposits above this coverage threshold are
uninsured for all amounts in excess of 700,000 coverage threshold. Panel A of Table 1 provides
more details on the distribution of deposit size in our database. Overall, uninsured deposits range
from 1K to 700K of rubles. Uninsured deposits range from 700K to above 10M of rubles. As one
12
can see from the table 89% of deposits in this category exceed minimum size of 1M rubles which
mitigates possible concerns of bias induced by the fact that these deposits are partially insured up to
700K rubles.
[Table 1]
Panel B of Table 1 describes maturities structure of the offered deposit products and
corresponding interest rates. From a depositor perspective, longer maturity products are associated
with higher exposure to interest rate risk. From a bank perspective, longer maturity products
provide higher stability in core deposits. Taken together, the two effects results in the pronounced
premium and higher deposit rates for longer maturities, ranging from 4.43% annual rate for short-
term deposits up to 3 months to 7.72% annual rates for deposits with above 3 years maturity. By
the frequency distributions, the most popular maturities are in the medium-term intervals: 1 to 3
years (39.6% of total products) and from 6 months to 1 year (30.5%). The ratio of insured and
uninsured products across all maturities brackets is approximately stable.
Panel C of Table 1 summarizes deposit rates distribution across insured and uninsured
products in the total sample. The mean (median) interest rate for insured deposits is 6.64% (6.80%)
versus the 7.31% (7.50%) interest rate for the uninsured ones, equivalent to about 0.7% risk
premium for uninsured products. In the same Panel, we also report a strikingly large number of
unique deposit products per bank, with an average of 53 insured and 49 standardized products issued
in only 11-month period. At the same time, the number of deposit products per bank varies
dramatically, in a range from 2 to 240. Overall, the descriptive evidence in Table 1 reveals wide
variability in deposit products in our dataset in terms of their size, rates, and maturity characteristics.
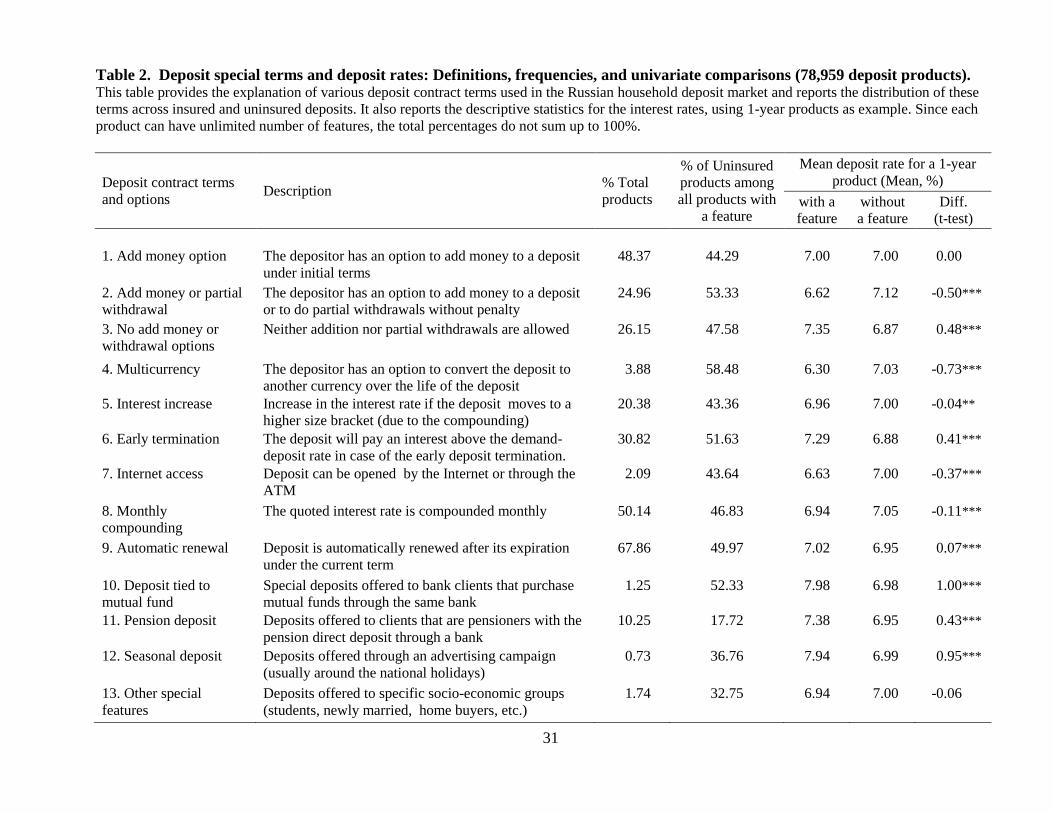
Table 2 describes and explains non-price contract terms features in our dataset. We identify
and document thirteen different characteristics commonly used in the Russian household deposit
markets. All reported characteristics are not mutually exclusive and, thus, the sum of their
13
frequency distribution far exceeds the 100%. The most commonly used nonprice contract terms are
automatic renewal (67.9% of products), monthly compounding (50.1%), and the option to add
money during the deposit product life (48.4%). We also document more exotic and rarely used
options in this deposit market, such as deposits tied to mutual funds (1.3%), deposits products that
can be opened through the Internet (2.1%) and the so-called multicurrency deposits that allow
flexible adjustments to combine different currencies on one product (3.9%). The presence of these
features in insured and uninsured products is approximately equal, with two exceptions: the
prevalence of insured products among pension deposits (as only 17.7% of these products are
uninsured) and the prevalence of uninsured products among multicurrency deposits (58.5%).
[Table 2]
In the last three columns of Table 2 we document the average interest rates for products with
and without each described feature, controlling for deposit maturity terms. Overall, almost all
differences in deposit rates are highly statistically significant and in expected directions based on
whether each non-price contract term increases or decreases the risk-return or other utility outcomes
for an average retail depositor.
3.2. Bank-level characteristics
We complete our dataset construction by matching deposit-level data with bank-level data
for each sample month. Our primary source for bank characteristics is the Central Bank of Russia
monthly disclosures of detailed accounting information for all Russian banks at a monthly
frequency. We supplement accounting information with the data on banks’ geographic location and
ownership patterns.
Table 3 presents descriptive statistics for the key bank-level variables in our study sample.
The total number of unique banks in our unbalanced sample is 371. The quartile range for the
capital risk variable, measured as the regulatory capital ratio, is from 10.4% to 24.14%, suggesting a

14
wide variability in sample banks’ capital adequacy. The quartile range for the credit risk variable,
measured as the ratio of loans to the private sector to assets is from 34.6% to 57.7%. As expected,
banks in our sample rely heavily on the household deposits in their liabilities mix, with a mean ratio
of household deposits to total deposits of 75.3% and an even higher median of 82.9%.
[Table 3]
In Panel B of Table 3, we report summary statistics for a sub-sample of banks which are
defined as aggressive in the household deposit market by the regulator. As described in the
Background section, the Central Bank of Russia imposes two overlapping criteria to scrutinize
banks for aggressive behavior in the household deposit market: the ratio of the household deposits
to liabilities ratio is above 25% and the bank continues to attract household deposits at a rate that
exceeds the local deposit market growth rate by more than 1.3 times.
The descriptive evidence in lower panels of Table 3 suggests that aggressive deposit-taking
banks, by a regulatory definition, do indeed have to offer above-the-market interest rates to grow
their household deposit volumes at the aggressive rates. In uninsured deposit segment, the deposit
products issued by aggressive banks offer, on average, a 8.67% interest rate, equivalent to a 1.14%
premium compared to banks with similar deposit ratio but relatively low deposit growth rates. In
insured deposit segment, these banks seem to be equally aggressive in their deposit pricing policy
offering a 7.85% rate on an average deposit product versus the 6.84% in slow growing comparable
banks (a 1.01% premium).
4. Empirical Results (preliminary)
4.1. Univariate comparisons: Bank risk and bank deposit products
We start our examination of the relationship between bank risk and bank deposit products
characteristics with a series of simple non-parametric comparisons.

15
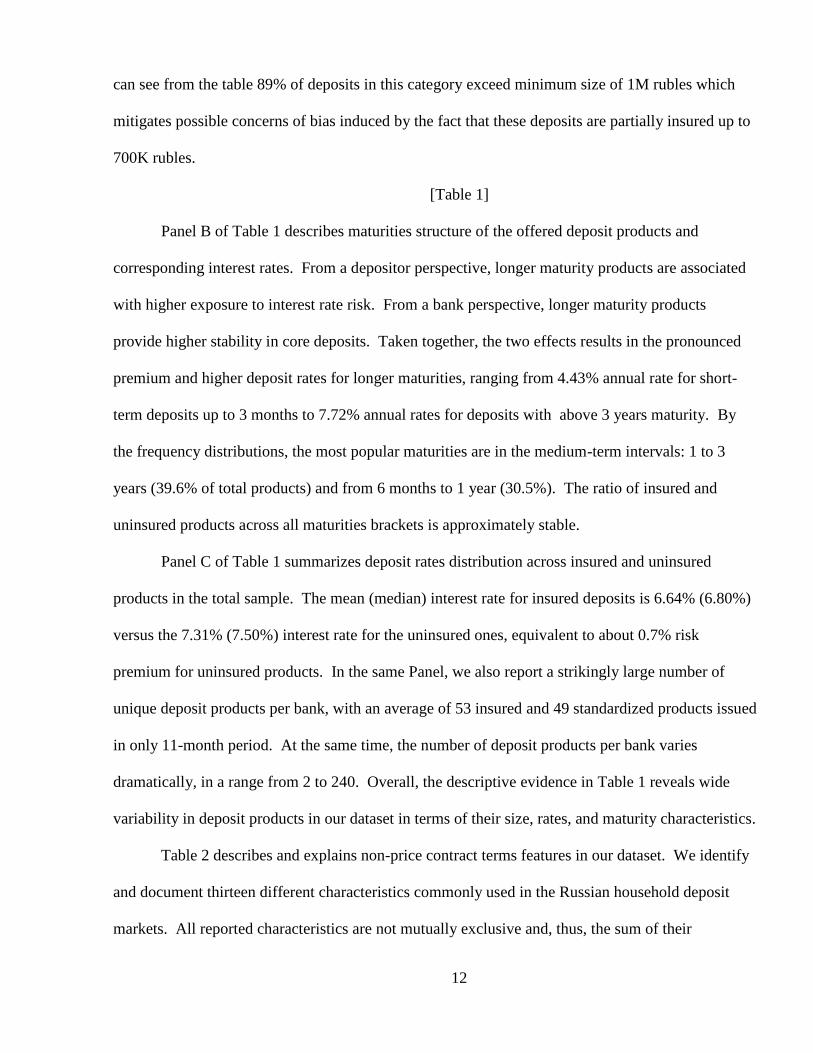
Figure 4 aggregates product-level data by showing the patterns of interest rates on insured
and uninsured products during the sample period. Overall, the risk premium paid by bank on
uninsured deposits remains constant over the period, at about 0.7% level.
[Figure 4]
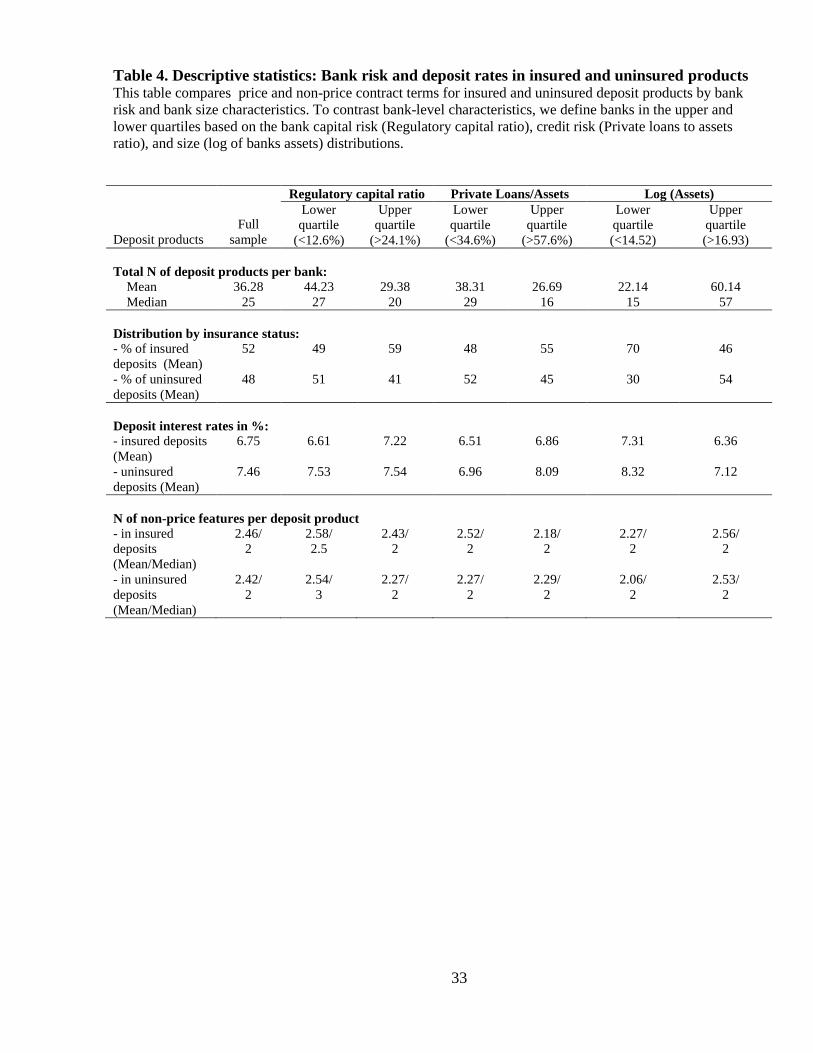
In Table 4, we report major deposit product characteristics for subsamples of high- and low-
risk banks as captured by the bank-level credit risk, capitalization, and asset size characteristics
(upper and lower quartile groups). The most notable observation in Table 4 is relatively high
interest rates on uninsured deposits in small banks (8.32%) and in banks with high lending activity
(8.09%). The lowest interest rates, on average, are observed for insured deposit in large banks
(6.36%).
[Table 4]
4.2. Regression analysis: Bank risk, deposit insurance and deposit pricing.
The regression analysis is in process. Section 5 outlines the remaining steps, including a
number of extensions for bank-level fixed effect analysis and a series of robustness tests that will
complete this empirical study.
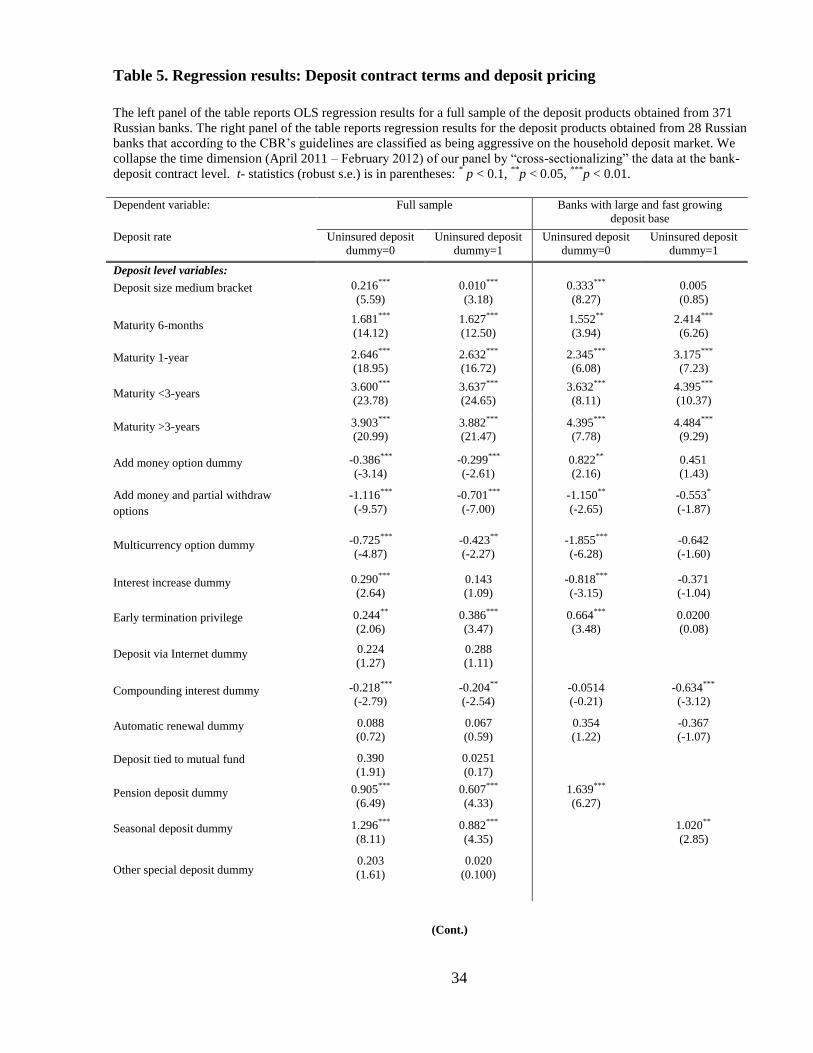
Our first set of regression results to date is reported in Table 5. In all model specifications,
the dependent variable is the deposit product interest rate. We split all explanatory variables into
two groups, deposit-level and bank-level characteristics. The deposit-level characteristics include
the deposit contract insurance status, deposit size, a set of maturities’ dummies (3-month maturity
being a reference category), and a set of thirteen indicator variables to capture deposit product non-
price terms (described in Table 2).
The deposit contract insurance status is determined by the size of the deposit product and the
minimum insurance coverage. The Uninsured deposit product =0 if the upper size of the product is
below 700K rubles, the dummy takes value 1 if the lower product size is above 700K. One of the

16
advantages of our data is the availability of information on the exact deposit product size. We use
the mid-point of the upper and lower product size limits as a deposit size measure. Including this
variable in the model allows us to control for a possible size premium which could arise from the
fact that it is less costly for a bank to process larger deposits.
The bank-level characteristics include the two risk variables, regulatory capital ratio and
nonperforming loans (NPL) to total loans ratio. Other bank-level right hand side variables include
private loans to assets ratio, bank size, and bank reliance on household deposit funds, measured as
the ratio of household deposits to total deposits. We also control for the local market competition
with a regional bank dummy and for the bank ownership type with foreign and state bank dummy
variables.
To reduce the dimension of our dataset from the bank-month-deposit product to bank-deposit
product data structure, we collapse the time dimension (April 2011 – February 2012) of our panel by
“cross-sectionalizing” the data at the bank-deposit product level11
. After the calculation of the time
average for each deposit product over the 11-month period, we end up with 7,429 deposit products
observations for a sample of 371 unique Russian banks.
The estimated coefficients and robust standard errors to the above specified model are
reported in Table 5. To account for possible correlation of error terms across deposit rates on
deposit products within a bank, we cluster all standard errors at the bank level. All regression
specifications in our paper employ the commonly used in statistics Cook’s distance measure for
detecting and removing outliers which might distort the estimation precision.
11
To conduct the cross-sectionalizing of data, we follow Khwaja and Mian (2005) empirical approach. Because our
panel is relatively short (11 months only) and because we are primarily interesting in the cross-sectional variation
between high and low risk banks, this conversion works well on our data. In addition, as justified by Khwaja and Milan,
it allows to avoid excessive autocorrelation and to produce more reliable standard errors.
17
[Table 5]
The left panel of the table reports OLS regression results for a full sample of the deposit
products obtained from 371 Russian banks. We run separate regressions for insured and uninsured
deposits and report the results in columns two and three. Let us focus on the bank level variables:
the coefficient on the regulatory capital ratio is statistically significant for the sub-sample of
uninsured deposit products only. The coefficient on the loans to assets variable is statistically
significant for both insured and uninsured deposit products but the magnitude for uninsured products
is two times larger. These results suggest that the deposit rates on uninsured products are more
sensitive to banks’ risk characteristics in a large cross-section of banks. The coefficients on NPL
loans to assets are not statistically significant for this sample in neither specification.
The right panel of Table 5 reports regression results for the deposit products obtained from
28 Russian banks that according to the CBR’s guidelines are classified as being aggressive on the
household deposit market. As described earlier, aggressive deposit-taking banks are banks with
above 25% of household deposit to liabilities ratio that simultaneously grow the volume of their
deposit base 1.3 times faster than comparable banks in local markets.
The estimated coefficients on the regulatory capital ratio are statistically significant and have
the same magnitude for both sub-samples of insured and uninsured products. The coefficients on
NPL loans to assets are statistically significant for the aggressive banks, have an expected sign and
the coefficient for uninsured products has a higher magnitude. The results for bank risk variables
indicate that deposit rates on both insured and uninsured products exhibit significant sensitivity to
banks’ risk characteristics for this group of banks.
It is worth noting that the coefficients on household deposits to total deposits ratio are
significantly positively associated with the deposit rates on both types of the deposit products for
these banks and the magnitude is higher for the coefficient on insured deposits. This suggests that
18
the aggressive banks are able to increase their household deposits base by offering higher rates on
insured deposits, which could be a sign of the moral hazard behavior.
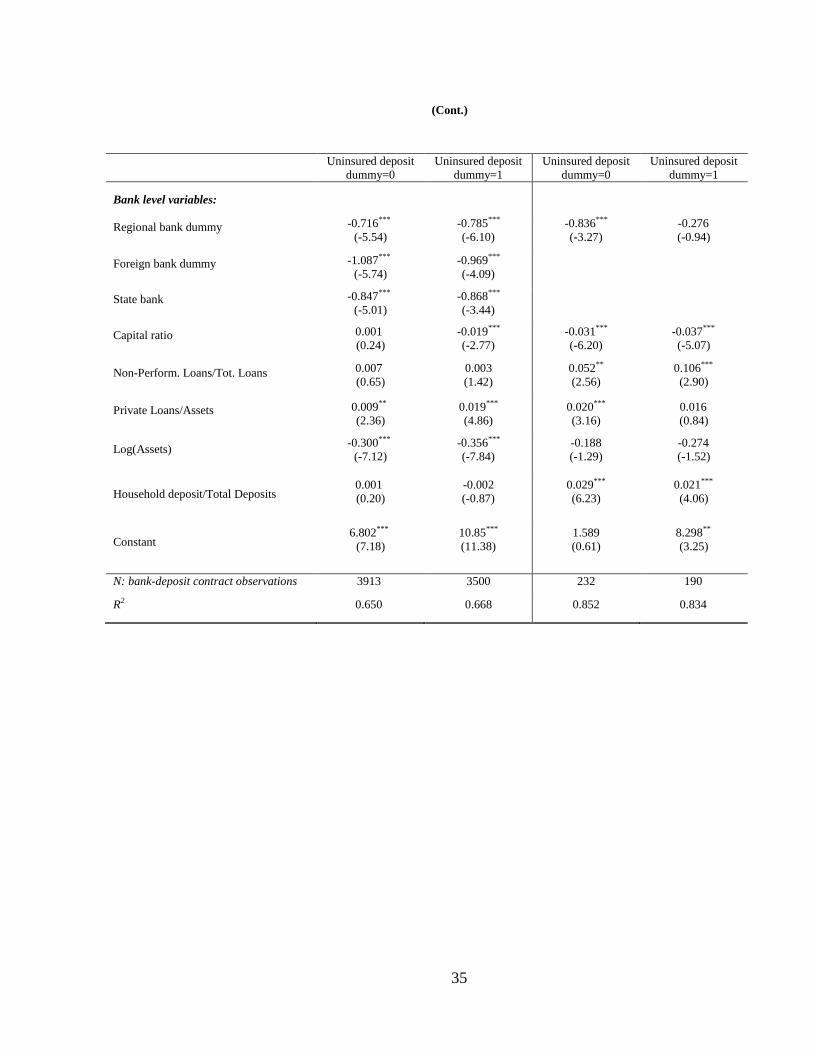
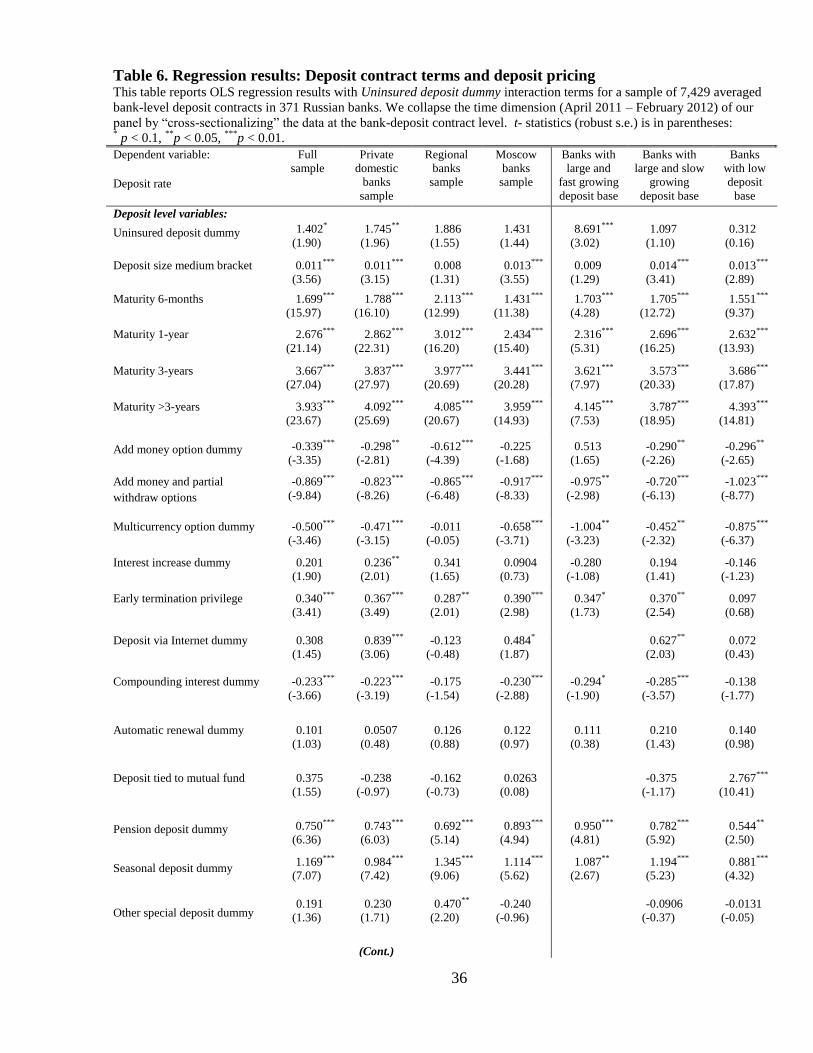
Regressions with interaction terms
In order to capture the differences in the deposit products pricing and their sensitivity to the
bank risk profile across insured and uninsured deposit products within the same bank, we introduce
a set of interaction terms by interacting all major bank characteristics with the Uninsured deposit
product dummy variable. The estimated coefficients of the regression specification that includes the
interacted terms are presented in Table 6. For bank-level variables without an interactive term, the
coefficient estimates report the slopes of the regression lines between the bank level variable and the
deposit rate on fully insured deposit products. The value on the interacted terms is the difference in
slopes between the insured and uninsured deposit products. The first column of this table reports the
results for the whole sample. To test a stability of the estimated coefficients, we perform simple
robustness tests by rerunning our main model for subsample of domestic private banks only and for
samples of regional banks (local markets with relatively low competition) and Moscow banks (a
local market with high degree of competition). More importantly, we single out the group of
aggressive deposit-taking banks, as defined by the regulatory guidelines, and report results for such
banks that fall under the regulatory radar in column 5. The last two columns, for large deposit base
but slow growing banks and for low deposit banks are reported for comparison.
The main effect for the Uninsured deposit dummy variable is reported in the first row of the
table and as expected, the coefficient is positive, indicating the deposit rate premium of about 1.4%
for uninsured products, all else equal. However, for the full sample, this coefficient is only
marginally statistically significant. The constant term in this specification is the expected value of
19
the deposit rate for insured deposits when all other model variables are zero. The estimate for the
full sample yields 9.2% .
For private domestic banks, the risk premium on uninsured products is more pronounced
(1.7%) and is statistically significant. Across other examined subsamples, the most striking results
is a very high premium on uninsured deposit contracts offered by aggressive deposit-taking banks:
8.7% and significant at the 1% level. In interpretation of this coefficient magnitude, it is also worth
noting that for this subsample our specification predicts low base rate for insured deposits as
indicated by the constant term coefficient.
[Table 6]
In the first four columns of the Table 6, we vary sample by the degree of the local market
competition (Moscow vs. regional banks) and by the ownership structure (by excluding state and
foreign banks as special cases). Our main finding here is a highly significant coefficient on the
interaction of Uninsured product dummy and bank regulatory capital measure. The negative sign
indicates that better capitalized banks offer significantly lower deposit rates on uninsured products
while the relationship between bank capitalization and deposit rates on insured products is not
significant.
For bank credit risk, NPL ratio seems to be only weakly related to risk premium on
uninsured products while the supplementary credit risk measure, Private Loans to Asset ratio, seems
to be more robustly related to the risk premium as, other things being equal, banks with higher share
of loans in their portfolio tend to offer higher rates on uninsured deposit products.
We also find that larger banks and banks in non-competitive (regional markets) offer lower
rates. Large banks may choose to offer lower deposit rates for a number of reasons, including too-
big-to-fail advantages, higher market power, better access to alternative funding sources and/or
better name recognition.
20
Finally, we find that foreign banks and state banks offer lower rates on all deposit products,
even after controlling for the product features and bank stability and performance characteristics.
This finding may suggest a distinct reputation al advantages for these two types of banks in the
Russian deposit markets.
Even more interesting results are obtained when we focus on subsamples of banks by their
household deposits reliance classification. We report these results in the last three columns of Table
6. In column 5, we identify a subsample of aggressive banks with large and fast growing deposit
base as stipulated in regulatory requirements of the Central Bank of Russia. For this sub-sample, all
non-interacted terms for bank-level risk variables are statistically significant. The signs on Capital
ratio, NPL/Loans and Private loans/Assets indicate that bank risk and bank deposit rates on the fully
insured deposit products are positively related. This result has two alternative interpretations. On
the one hand, the fact that the riskier banks have to pay higher deposit rates suggests that the market
discipline works. Alternatively, these high-risk aggressive deposit-taking banks may exhibit moral
hazard behavior by offering above-the-market interest rates on fully government insured deposit
products. The later claim is supported by a significant and positive coefficient on non-interacted
Household deposits/Total deposits term and significant and negative interacted term for this
variable. This illustrate that higher proportion of household deposits for this category of banks is
associated with higher rates offered on fully insured deposit products.
Column 6 reports the results for banks that do rely on household deposits as s significant
source of funding but do not exhibit high growth. Most banks fall into this category and results for
this subsample largely correspond to the full sample results reported in column 1. Finally column 7
covers banks with insubstantial dependence on the household deposits market and as expected
results for most bank-level variables are not statistically significant for this subsample.
21
Overall, these findings support two important conclusions. First, in line with prior
theoretical and empirical banking literature, they indicate that uninsured depositors are systemically
more sensitive to bank-level risk than insured ones. Second, they show that aggressive deposit-
taking banks have to offer high premium in competitive deposit markets. The latter is a new result.
Table 6 also reports several supplementary results that shed more light on the design and
pricing of various explicit and implicit terms of deposit products in this market. The contract
maturity dummy variables are also positive and highly significant. The magnitude of the
coefficients on the maturity variables is consistently increasing with the increase of the maturity
brackets. Most of the additional build-in features of the deposit product also seem to be priced, with
the general trend of significant and negative coefficients on deposit features that create additional
convenience, liquidity, or value for depositors. For example, the add money, partial withdrawal,
multicurrency, and monthly compounding features are associated with lower deposit rates.
5. Extensions, robustness checks, and regulatory implications: Next steps.
The extensions and robustness tests of the data analysis is in process and should be
completed shortly.
As a next step of empirical analyses, we will exploit the panel structure of our deposit
product sample to test if and how the changes in the bank risk profile effect the bank decision on the
issuance of insured and uninsured deposit products. We will explore the bank-level determinants of
the deposit products choices in the fixed effect regression framework, controlling for unobserved
heterogeneity effects and looking more closely at the within-bank dynamic.
Second, we will examine the monthly dynamic of deposit levels in sample banks by using
the level and the growth of household deposits as our supplementary dependent variables. The
explanatory variables of interest are lagged deposit rates on insured and uninsured deposit products,
controlling for bank risk characteristics. For high-risk banks, we expect that the deposit growth is

22
largely driven by the wide selection of insured deposit products and by high rates on these products.
We also expect that attractive rates and choices on uninsured deposits in weak banks will have
insignificant or weak effects on the total deposit growth. For low-risk banks, we expect the opposite
effects and the stronger association between uninsured deposit product offerings and subsequent
deposit growth.
For completeness, we also plan to look at the range and variability of nonprice deposit
product features to shed more light on how insured and uninsured deposits are structured in terms of
their implicit (nonprice) incentives and characteristics.
We are also working on the development of the policy recommendations regarding the
interplay on the interaction of the regulatory and depositor discipline in an emerging market context,
with a special focus on potential signaling effects that regulators can extract from deposit market
behavior. For example, the simple ratio of insured to total deposits in a bank is a promising indicator
of the bank risk profile, all else equal. Another potential avenue that may strengthen the deposit
rates regulatory monitoring is the introduction of the separate ceiling thresholds to guide market
participants, for insured and uninsured products, to better capture the dangerous market share
redistributions in insured deposit segments with weak depositor discipline.
6. Conclusions
{In process}
References
Calomiris C., Powell A. (2001). Can emerging market bank regulators establish credible discipline?
The case of Argentina, 1992–1999. In Frederic S. Mishkin (ed) “Prudential supervision:
What works and what doesn’t?” University of Chicago Press, Chicago.
Caprio G., Honohan P. (2004). Can the unsophisticated market provide discipline? In “Market
Discipline across Countries and Industries”, edited by C. Borio, W. Hunter, G. Kaufman and
K. Tsatsaronis, Cambridge, MIT Press.
23
Chernykh L., Cole R., (2011). Does deposit insurance improve financial intermediation? Evidence
from the Russian experiment. Journal of Banking and Finance 35, 388-402.
Demirguc-Kunt A., Detragiache E. (2002). Does deposit insurance increase banking system
stability? An empirical investigation. Journal of Monetary Economics 1272-1406.
Flannery M. (1983) Removing deposit rate ceilings: How will bank profits fare? Business review.
Kahn C., Pennacchi G., Sopranzetti B. (1999). Bank Deposit Rate Clustering: Theory and Empirical
Evidence. Journal of Finance 54, 2185-2214
Karas A., Pyle W., Schoors K. (2010). How do Russian depositors discipline their banks? Evidence
of a Backward Bending Deposit Supply Function. Oxford Economic Papers 62, 36-61.
Khwaja A., Mian A. (2005). Do Lenders Favor Politically Connected Firms? Rent Provision in an
Emerging Financial Market. Quarterly Journal of Economics 120, 1371-1411.
Levy-Yeyati E., Martinez-Peria M.S., Schmukler S. (2004). Market discipline in emerging
economies: Beyond bank fundamentals. In “Market Discipline across Countries and
Industries”, edited by C. Borio, W. Hunter, G. Kaufman and K. Tsatsaronis, Cambridge,
MIT Press.
Martinez-Peria M.S., Schmukler S. (2001). Do depositors punish banks for bad behavior? Market
discipline, deposit insurance, and banking crises. Journal of Finance 56, 1029-1052.
Matutes C., Vives X. (1996). Competition for Deposits, Fragility, and Insurance. Journal of
Financial Intermediation 5, 184–216
Mondschean T., Opiela T. (1999). Bank Time Deposit Rates and Market Discipline in Poland: The
Impact of State Ownership and Deposit Insurance Reform. Journal of Financial Services
Research 15, 179-196.
Peresetsky A., Karminsky A., Karminsky M., Golovan, S. (2007). Russian Banks' Private Deposit
Interest Rates and Market Discipline. BOFIT Discussion Paper No. 2/2007.
Rosen R. (2007). Banking market conditions and deposit interest rates. Journal of Banking &
Finance 31, 3862–3884
Ungan E., Caner S., Özyildirim S. (2008). Depositors’ assessment of bank riskiness in the Russian
Federation. Journal of Financial Services Research 33, 77-101.
24
Figure 1. Evolution of the Household Deposits in Russia: 2000 – 2012
This graph shows absolute and relative growth patterns of the household deposits in the Russian
banking sector. The annual macro-level raw data for this graph come from various issues of the
Central Bank of Russia Development Reports and Bulletins of Banking Statistics. The 2004-2005 is
the period of the de novo deposit insurance system introduction in Russia. Since 2006, all
household deposit-taking banks are DIS members. The 2008 is the financial crisis period, with a
short-term deposit run that was effectively resolved with the increase of deposit insurance limit from
RUB400,000 to RUB700,000 in October 2008.
* as of October 1, 2012
0
2,000
4,000
6,000
8,000
10,000
12,000
14,000
0%
5%
10%
15%
20%
25%
30%
2000 2001 2002 2003 2004 2005 2006 2007 2008 2009 2010 2011 2012*
Household Deposits (Billion of RUB)
Household Deposits / Bank assets
Household Deposits / GDP
25
Figure 2. Distribution of Household Deposits by Deposit Size: 2008 and 2011.
The macro-level data for this graph are obtained from the Russian Deposit Insurance Agency Annual Review
(2011) and report the distribution of household deposits by the deposit size thresholds in rubles. The
insurance limit for the two presented periods, 2008 (the earliest available comparable data) and 2011, is RUB
700K: all household deposits below 700K are fully insured; all deposits above 700K are only partially
insured.
0%
10%
20%
30%
40%
50%
60%
70%
80%
90%
100%
2008 2011
1M+
700K - 1M
400-700K
100-400K
<100K
26
Figure 3. Deposit and Lending Rates in the Russian banking Sector (Apr 2006 – Sep 2012).
The monthly data for this graph are obtained from the Central Bank of Russia official statistics disclosures.
April 2006 is the starting date for the refined aggregate reported statistics that accounts for branch-level data
and and excludes the state-controlled megabank (Sberbank). The solid lines represent the aggregate, macro-
level, data, for the ruble-denominated deposits from households and loans to nonfinancial firms with up to
one year original maturities. The dotted line shows data from the Central Bank of Russia monitoring of
deposit rates in the 10 largest deposit-taking banks, launched in July 2009. For the monitoring purposes, the
Central Bank collects and averages the maximum quoted rate across all deposit maturities in these banks. The
later indicator serves as a regulatory non-binding benchmark to communicate the highest acceptable rates and
to detect banks with excessively aggressive deposit pricing policies.
0%
2%
4%
6%
8%
10%
12%
14%
16%
18%
20%
Deposit rates: All banks (Household deposits, <= 1y maturities)
Deposit rates: Top 10 banks (Household deposits, averaged max rate, all maturities)
Lending rates: All banks (Business loans, <= 1y maturities)

27
Figure 4. Mean Interest Rates on Insured vs. Uninsured Deposits: Study sample of 78,959
deposit products in 371 Russian banks (Apr 2011 – Feb 2012).
This graph shows the patterns of the mean interest rates for insured and uninsured household deposit products
for the study sample. The premium on an average uninsured deposit product remains relatively constant
during the sample period, with an average of 0.66% and a range from 0.58% in July 2011 to 0.74% in
February 2012.
5.00%
5.50%
6.00%
6.50%
7.00%
7.50%
8.00%
Apr-11 May-11 Jun-11 Jul-11 Aug-11 Sep-11 Oct-11 Nov-11 Dec-11 Jan-12 Feb-12
Insured Uninsured
28
Appendix1.
Household deposit products in Russian banks: Two examples of raw data structure.
This Appendix describes our dataset structure by providing two examples. In Panel A, we report 41 deposit products offered by the private domestic
commercial bank Renaissance Credit”in September 2012. For comparison, Panel B reports features and brackets of the 51 deposit products for the state-
controlled commercial bank VTB24 in the same month. We count unique deposit products by the number of offered rates. For example, in Panel A, there
are five distinct deposit products in the “Profitable” deposit brand category, for five different maturities and there is only one deposit product with the
brand name “Perspective”. Panel B represents a more complex case, with a broader set of deposit products and options. The total number of deposit
products for the bank-month observation is 151. The total number of deposit product observations in our current 11-month dataset is 78,959 and the total
number of unique banks is 371. We are currently updating the dataset to include 18 months, up to October 2012.
Panel A. Household deposit products for Commercial Bank “Renaissance Credit” in September 2012 (41 deposit products).
Deposit’s
lower size
bracket in
Rubles
Duration in days Add
money
option
Partial
withdraw
option
Early
termination
priveledge
Interest
compoun-
ding
Interest
increase
Automatic
renewal
31
days
91
days
181
days
367
days
731
days
1100
days
Deposit brand name: “Profitable”
5K 8.25 % 9.75 % 11 % 12 % 12 % No No Yes No No Yes
Deposit brand name: “Accumulating”
5K 8 % 9.5 % 10.75 % 11.75 % 11.75 % Yes No No Monthly Yes Yes
100K 8.1 % 9.6 % 10.85 % 11.85 % 11.85 %
500K 8.25 % 9.75 % 11 % 12 % 12 %
Deposit brand name: “Convenient”
50K 7 % 8.5 % 9.75 % 10.75 % 10.75 % Yes Yes No No No Yes
300K 7.1 % 8.6 % 9.85 % 10.85 % 10.85 %
700K 7.25 % 8.75 % 10 % 11 % 11 %
Deposit brand name: “Perspective”
100K 12 % Yes No No Annually No Yes
Deposit brand name: “For pensioners”
3K 8 % 8.75 % 11 % 11.5 % 11.5 % Yes No No Quarterly No Yes
29
Panel B. Household Deposit Products for Commercial Bank VTB24 in September 2012 (151 deposit products). Deposit’s
lower size
bracket in Rubles
Duration in days Add
money option
Partial
withdraw option
Early
termination privilege
Interest
compoun-ding
Interest increase
Automatic renewal
Internet account
60 days
90 days
180 days
394 days
545 days
731 days
1101 days
1830 days
2562 days
Deposit brand name: “Profitable” (online only)
10K 6.6 % 6.8 % 7.6 % 7.6 % 8.3 % 7.7 % 8 %
No No No No No Yes, 2 times
Yes, this
is online only
deposit
100K 6.6 % 6.8 % 7.65 % 7.8 % 8.55 % 7.9 % 8.2 %
300K 6.6 % 6.8 % 7.7 % 8 % 8.8 % 8.1 % 8.4 %
1000K 6.6 % 6.8 % 8.45 % 8.8 % 9.3 % 8.35 % 8.65 %
Deposit brand name: “Comfortable”
50K 5.3 % 5.65 % 6.05 % 6.25 %
Yes Yes Yes Monthly No Yes, 4
times
Yes; add
0.3% if
open online
100K 5.55 % 5.9 % 6.3 % 6.5 %
500K 5.9 % 6.45 % 6.85 % 7.05 %
1500K 6.3 % 6.85 % 7.25 % 7.05 %
10000K 6.35 % 6.9 % 7.3 % 7.45 %
Deposit brand name: “Freedom of choice”
15K 5.55 % 5.75 % 7.4 % 7.1 % 7.8 % 7.55 % 7.75 %
Yes No Yes Monthly/ Quarterly
No Yes, 4 times
No
150K 5.8 % 6 % 7.45% 7.35 % 7.9 % 7.8 % 8 %
350K 6.05 % 6.25 % 7.5 % 7.6 % 8 % 8.05 % 8.25 %
750K 6.25 % 6.45 % 7.55 % 7.8 % 8.1 % 8.3 % 8.5 %
1000K 6.3 % 6.5 % 8.35 % 8.7 % 8.4 % 8.3 % 8.6 %
3500K 6.5 % 6.7 % 8.45 % 8.75 % 8.6 % 8.3 % 8.6 %
5000K 6.55 % 6.75 % 8.75 % 8.95 % 9 % 8.3 % 8.6 %
Deposit brand name: “Targeted” (online only)
10K 5.95 % 6.5 % 6.65 % 6.6 %
Yes No No Monthly Yes Yes, 2 times
Yes, this
is online only
deposit
100K 6.2 % 6.75 % 6.9 % 6.85 %
300K 6.45 % 6.95 % 7.15 % 7.1 %
1000K 6.7 % 7.2 % 7.4 % 7.35 %
5000K 6.95 % 7.45 % 7.55 % 7.6 %
9500K 6.95 % 7.45 % 7.55 % 7.6 %
Deposit brand name: “Index”(This a floating rate deposit calculated as Central Bank of Russia Refinancing Rate – fixed rate. In Sept. 2012, the Refinancing rate was 8.25%)
50K CB-1.70% CB-1.65% CB-1.60% CB-1.55%
Yes No No Monthly Yes Yes, 2
times No 1000K CB-1.65% CR-1.60% CB-1.55% CB-1.50%
3000K CB-1.60% CR-1.55% CB-1.50% CB-1.45%
Deposit brand name: “Growing income” (This is a 3 year deposit with three different rates applied during the 1st, 2nd and 3rd year)
30K 6 % 8 % 10 %
Yes Yes Yes Monthly/ Quarterly
No Yes, 2 times
No 300K 6 % 8 % 10 %
1000K 6 % 8 % 10 %
3000K 6 % 8 % 10 %
Deposit brand name: “Mortgage downpayment”(This deposit is offered exclusively for clients waiting for the VTB24 mortgage approval)
400K 3.1 %
Yes Yes No Monthly No Yes, 2
times No
700K 3.2 %
1000K 3.3 %
1700K 3.4 %
3000K 3.45 %
5100K 3.55 %
30
Table 1. Descriptive statistics: Product-level characteristics (78,959 deposit products)
Panel A. Distribution of deposit products by size: Frequency of deposit size brackets (in RUB)
Insured deposit products (N bank-month-deposit product obs.= 41,773 products):
Deposit size lower limit Deposit size upper limit
Total number 100K 350K 700K
1K 3,459 506 734 4,699
10K 7,098 4,652 1,828 13,578
100K 3,933 6,879 6,404 17,216
300K 1,036 4,525 5,561
700K
719 719
Total number 14,490 13,073 14,210 41,773
Uninsured deposits (N bank-month-deposit product obs.= 38,261 products):
Deposit size lower limit Deposit size upper limit
Total number 3M 5M 10M >10M
700K 787 96 255 3,117 4,255
1M 2,311 2,220 562 7,155 12,268
3M 1,379 1,212 1,775 5,965 10,331
5M
154 888 3,344 4,386
10M 156 3,888 4,044
>10M
2,977 2,977
Total number 4,497 3,682 3,636 26,446 38,261
Panel B. Distribution of deposit products by maturity
Maturities % of Total
products % of Uninsured products
with a given maturity Deposit rate for a given
maturity (Mean; %)
Up to 3 months 8.90 44.86 4.43
3 to 6 months 16.17 45.16 6.12
6 months to 1year 30.48 46.95 7.00
1 to 3 years 39.64 49.64 7.84
Above 3 years 4.81 52.19 7.72
Total 100.00
Panel C. Deposit rates and the number of deposit products per bank
Mean St. dev. Min p25 p50 p75 Max
Insured deposit products (N bank-month-deposit product obs.= 41,251):
Deposit rate (%) 6.64 1.89 0.01 5.45 6.80 8.00 12.00
N of products per bank 53.18 45.27 3 21 42 73 240
Uninsured deposit products (N bank-month-deposit product obs.= 37,708):
Deposit rate (%) 7.31 1.85 0.75 6.00 7.50 8.75 12.10
N of products per bank 48.98 33.69 2 25 42 70 177
31
Table 2. Deposit special terms and deposit rates: Definitions, frequencies, and univariate comparisons (78,959 deposit products). This table provides the explanation of various deposit contract terms used in the Russian household deposit market and reports the distribution of these
terms across insured and uninsured deposits. It also reports the descriptive statistics for the interest rates, using 1-year products as example. Since each
product can have unlimited number of features, the total percentages do not sum up to 100%.
Deposit contract terms
and options Description
% Total
products
% of Uninsured
products among
all products with
a feature
Mean deposit rate for a 1-year
product (Mean, %)
with a
feature without
a feature Diff.
(t-test)
1. Add money option The depositor has an option to add money to a deposit
under initial terms 48.37 44.29 7.00 7.00 0.00
2. Add money or partial
withdrawal The depositor has an option to add money to a deposit
or to do partial withdrawals without penalty 24.96 53.33 6.62 7.12 -0.50***
3. No add money or
withdrawal options Neither addition nor partial withdrawals are allowed 26.15 47.58 7.35 6.87 0.48***
4. Multicurrency The depositor has an option to convert the deposit to
another currency over the life of the deposit 3.88 58.48 6.30 7.03 -0.73***
5. Interest increase Increase in the interest rate if the deposit moves to a
higher size bracket (due to the compounding) 20.38 43.36 6.96 7.00 -0.04**
6. Early termination The deposit will pay an interest above the demand-
deposit rate in case of the early deposit termination. 30.82 51.63 7.29 6.88 0.41***
7. Internet access Deposit can be opened by the Internet or through the
ATM 2.09 43.64 6.63 7.00 -0.37***
8. Monthly
compounding The quoted interest rate is compounded monthly 50.14 46.83 6.94 7.05 -0.11***
9. Automatic renewal Deposit is automatically renewed after its expiration
under the current term 67.86 49.97 7.02 6.95 0.07***
10. Deposit tied to
mutual fund Special deposits offered to bank clients that purchase
mutual funds through the same bank 1.25 52.33 7.98 6.98 1.00***
11. Pension deposit Deposits offered to clients that are pensioners with the
pension direct deposit through a bank 10.25 17.72 7.38 6.95 0.43***
12. Seasonal deposit Deposits offered through an advertising campaign
(usually around the national holidays) 0.73 36.76 7.94 6.99 0.95***
13. Other special
features Deposits offered to specific socio-economic groups
(students, newly married, home buyers, etc.) 1.74 32.75 6.94 7.00 -0.06

32
Table 3. Descriptive statistics: Bank-level characteristics (371Russian banks) This table reports bank-level characteristics for a sample of 371 unique Russian banks with publicly
advertised deposit contract terms during 11-month sample period. To construct bank-level variables, we
collapse the time dimension (Apr 2011- Feb2012) of our panel by “cross-sectionalizing” the data at the bank
level. In Panels B-D, we define bank groups by the two combined criteria used by the Russian regulators to
detect aggressive deposit-taking banks: (1) Household deposit to Liabilities ratio exceeds 25% and (2)
Household deposits grow at a rate of above 1.3 times the market average. The subsample of our primary
interest is the group of aggressive deposit-taking banks (Panel B).
Log
(Assets)
Regulatory
capital ratio
NPL Loans/
Total loans
Private
Loans/
Assets
Household
deposit/ Total
Deposits
Household
deposit/
Liabilities
Insured
deposits’
rate
Uninsured
deposits’
rate
Panel A: Full sample (371 bank)
Mean 15.80 21.26 5.52 45.74 75.25 34.88 6.76 7.48
St. dev. 1.80 13.16 6.65 17.58 23.64 21.38 1.82 1.77
Min 12.33 10.43 0 0.00 0.60 0 0.01 0.93
p25 14.52 12.68 1.54 34.64 64.63 15.63 5.5 6.2
p50 15.51 16.71 3.71 46.17 82.91 33.72 6.95 7.65
p75 16.94 24.14 6.53 57.65 93.11 50.65 8.1 8.83
Max 22.95 96.51 55.02 100.00 100.00 82.26 11.62 12
Panel B: Banks with large and fast growing deposit base (28 banks)
Mean 15.21 25.47 5.48 48.13 80.70 42.97 7.85 8.67
St. dev. 1.32 15.45 7.01 13.55 18.73 20.31 1.84 1.65
Min 12.79 11.12 0.06 15.74 37.47 25.08 2.36 3.48
p25 14.30 14.45 0.75 37.72 68.51 37.76 6.50 7.91
p50 15.08 17.26 2.43 51.40 89.51 43.69 8.23 9.08
p75 15.99 37.85 6.81 59.31 95.38 58.62 9.31 9.81
Max 18.62 66.92 25.23 64.15 100.00 76.77 11.5 11.65
Panel C: Banks with large and slow growing deposit base (268 banks)
Mean 15.78 18.31 5.57 47.13 82.84 41.46 6.84 7.53
St. dev. 1.61 8.31 6.67 16.61 14.56 18.35 1.80 1.80
Min 12.36 10.43 0 0.00 31.26 25.08 0.01 0.92
p25 14.65 12.29 1.64 36.75 74.91 37.63 5.59 6.32
p50 15.56 15.04 3.95 48.41 85.97 41.30 7.00 7.77
p75 16.81 20.52 6.81 58.66 94.99 55.59 8.18 8.91
Max 22.97 61.92 55.02 99.37 100.00 82.26 11.62 12
Panel D: Banks with low deposit base (75 banks)
Mean 16.21 27.67 5.33 43.88 46.55 8.39 6.36 7.16
St. dev. 2.40 18.93 6.53 22.51 29.24 5.38 1.74 1.63
Min 12.36 10.65 0.00 0.00 0.64 0.00 0.5 1.84
p25 14.04 14.29 1.31 29.79 21.09 3.8 5.25 6.05
p50 15.96 21.20 3.68 43.63 42.18 8.01 6.5 7.24
p75 18.19 34.37 6.17 54.63 69.56 12.48 7.52 8.35
Max 20.96 92.26 37.88 100.00 100.00 22.816 10.5 11.5
33
Table 4. Descriptive statistics: Bank risk and deposit rates in insured and uninsured products This table compares price and non-price contract terms for insured and uninsured deposit products by bank
risk and bank size characteristics. To contrast bank-level characteristics, we define banks in the upper and
lower quartiles based on the bank capital risk (Regulatory capital ratio), credit risk (Private loans to assets
ratio), and size (log of banks assets) distributions.
Deposit products
Full
sample
Regulatory capital ratio Private Loans/Assets Log (Assets)
Lower
quartile
(<12.6%)
Upper
quartile
(>24.1%)
Lower
quartile
(<34.6%)
Upper
quartile
(>57.6%)
Lower
quartile
(<14.52)
Upper
quartile
(>16.93)
Total N of deposit products per bank:
Mean 36.28 44.23 29.38 38.31 26.69 22.14 60.14
Median 25 27 20 29 16 15 57
Distribution by insurance status:
- % of insured
deposits (Mean)
52 49 59 48 55 70 46
- % of uninsured
deposits (Mean)
48 51 41 52 45 30 54
Deposit interest rates in %:
- insured deposits
(Mean)
6.75 6.61 7.22 6.51 6.86 7.31 6.36
- uninsured
deposits (Mean)
7.46 7.53 7.54 6.96 8.09 8.32 7.12
N of non-price features per deposit product
- in insured
deposits
(Mean/Median)
2.46/
2
2.58/
2.5
2.43/
2
2.52/
2
2.18/
2
2.27/
2
2.56/
2
- in uninsured
deposits
(Mean/Median)
2.42/
2
2.54/
3
2.27/
2
2.27/
2
2.29/
2
2.06/
2
2.53/
2
34
Table 5. Regression results: Deposit contract terms and deposit pricing
The left panel of the table reports OLS regression results for a full sample of the deposit products obtained from 371
Russian banks. The right panel of the table reports regression results for the deposit products obtained from 28 Russian
banks that according to the CBR’s guidelines are classified as being aggressive on the household deposit market. We
collapse the time dimension (April 2011 – February 2012) of our panel by “cross-sectionalizing” the data at the bank-
deposit contract level. t- statistics (robust s.e.) is in parentheses: * p < 0.1,
**p < 0.05,
***p < 0.01.
Dependent variable: Full sample Banks with large and fast growing
deposit base
Deposit rate Uninsured deposit
dummy=0
Uninsured deposit
dummy=1
Uninsured deposit
dummy=0
Uninsured deposit
dummy=1
Deposit level variables:
Deposit size medium bracket 0.216***
(5.59)
0.010***
(3.18)
0.333***
(8.27)
0.005
(0.85)
Maturity 6-months 1.681***
(14.12)
1.627***
(12.50)
1.552**
(3.94)
2.414***
(6.26)
Maturity 1-year 2.646***
(18.95)
2.632***
(16.72)
2.345***
(6.08)
3.175***
(7.23)
Maturity <3-years 3.600***
(23.78)
3.637***
(24.65)
3.632***
(8.11)
4.395***
(10.37)
Maturity >3-years 3.903***
(20.99)
3.882***
(21.47)
4.395***
(7.78)
4.484***
(9.29)
Add money option dummy -0.386***
(-3.14)
-0.299***
(-2.61)
0.822**
(2.16)
0.451
(1.43)
Add money and partial withdraw
options
-1.116***
(-9.57)
-0.701***
(-7.00)
-1.150**
(-2.65)
-0.553*
(-1.87)
Multicurrency option dummy -0.725***
(-4.87)
-0.423**
(-2.27)
-1.855***
(-6.28)
-0.642
(-1.60)
Interest increase dummy 0.290***
(2.64)
0.143
(1.09)
-0.818***
(-3.15)
-0.371
(-1.04)
Early termination privilege 0.244**
(2.06)
0.386***
(3.47)
0.664***
(3.48)
0.0200
(0.08)
Deposit via Internet dummy 0.224
(1.27)
0.288
(1.11)
Compounding interest dummy -0.218***
(-2.79)
-0.204**
(-2.54)
-0.0514
(-0.21)
-0.634***
(-3.12)
Automatic renewal dummy 0.088
(0.72)
0.067
(0.59)
0.354
(1.22)
-0.367
(-1.07)
Deposit tied to mutual fund 0.390
(1.91)
0.0251
(0.17)
Pension deposit dummy 0.905***
(6.49)
0.607***
(4.33)
1.639***
(6.27)
Seasonal deposit dummy 1.296***
(8.11)
0.882***
(4.35)
1.020**
(2.85)
Other special deposit dummy 0.203
(1.61)
0.020
(0.100)
(Cont.)
35
(Cont.)
Uninsured deposit
dummy=0
Uninsured deposit
dummy=1
Uninsured deposit
dummy=0
Uninsured deposit
dummy=1
Bank level variables:
Regional bank dummy -0.716***
(-5.54)
-0.785***
(-6.10)
-0.836***
(-3.27)
-0.276
(-0.94)
Foreign bank dummy -1.087***
(-5.74)
-0.969***
(-4.09)
State bank -0.847***
(-5.01)
-0.868***
(-3.44)
Capital ratio 0.001
(0.24)
-0.019***
(-2.77)
-0.031***
(-6.20)
-0.037***
(-5.07)
Non-Perform. Loans/Tot. Loans 0.007
(0.65)
0.003
(1.42)
0.052**
(2.56)
0.106***
(2.90)
Private Loans/Assets 0.009**
(2.36)
0.019***
(4.86)
0.020***
(3.16)
0.016
(0.84)
Log(Assets) -0.300***
(-7.12)
-0.356***
(-7.84)
-0.188
(-1.29)
-0.274
(-1.52)
Household deposit/Total Deposits 0.001
(0.20)
-0.002
(-0.87)
0.029***
(6.23)
0.021***
(4.06)
Constant 6.802***
(7.18)
10.85***
(11.38)
1.589
(0.61)
8.298**
(3.25)
N: bank-deposit contract observations 3913 3500 232 190
R2 0.650 0.668 0.852 0.834
36
Table 6. Regression results: Deposit contract terms and deposit pricing This table reports OLS regression results with Uninsured deposit dummy interaction terms for a sample of 7,429 averaged
bank-level deposit contracts in 371 Russian banks. We collapse the time dimension (April 2011 – February 2012) of our
panel by “cross-sectionalizing” the data at the bank-deposit contract level. t- statistics (robust s.e.) is in parentheses: * p < 0.1,
**p < 0.05,
***p < 0.01.
Dependent variable:
Deposit rate
Full
sample
Private
domestic
banks
sample
Regional
banks
sample
Moscow
banks
sample
Banks with
large and
fast growing
deposit base
Banks with
large and slow
growing
deposit base
Banks
with low
deposit
base
Deposit level variables:
Uninsured deposit dummy 1.402*
(1.90)
1.745**
(1.96)
1.886
(1.55)
1.431
(1.44)
8.691***
(3.02)
1.097
(1.10)
0.312
(0.16)
Deposit size medium bracket 0.011***
(3.56)
0.011***
(3.15)
0.008
(1.31)
0.013***
(3.55)
0.009
(1.29)
0.014***
(3.41)
0.013***
(2.89)
Maturity 6-months 1.699***
(15.97)
1.788***
(16.10)
2.113***
(12.99)
1.431***
(11.38)
1.703***
(4.28)
1.705***
(12.72)
1.551***
(9.37)
Maturity 1-year 2.676***
(21.14)
2.862***
(22.31)
3.012***
(16.20)
2.434***
(15.40)
2.316***
(5.31)
2.696***
(16.25)
2.632***
(13.93)
Maturity 3-years 3.667***
(27.04)
3.837***
(27.97)
3.977***
(20.69)
3.441***
(20.28)
3.621***
(7.97)
3.573***
(20.33)
3.686***
(17.87)
Maturity >3-years 3.933***
(23.67)
4.092***
(25.69)
4.085***
(20.67)
3.959***
(14.93)
4.145***
(7.53)
3.787***
(18.95)
4.393***
(14.81)
Add money option dummy -0.339***
(-3.35)
-0.298**
(-2.81)
-0.612***
(-4.39)
-0.225
(-1.68)
0.513
(1.65)
-0.290**
(-2.26)
-0.296**
(-2.65)
Add money and partial
withdraw options
-0.869***
(-9.84)
-0.823***
(-8.26)
-0.865***
(-6.48)
-0.917***
(-8.33)
-0.975**
(-2.98)
-0.720***
(-6.13)
-1.023***
(-8.77)
Multicurrency option dummy -0.500***
(-3.46)
-0.471***
(-3.15)
-0.011
(-0.05)
-0.658***
(-3.71)
-1.004**
(-3.23)
-0.452**
(-2.32)
-0.875***
(-6.37)
Interest increase dummy 0.201
(1.90)
0.236**
(2.01)
0.341
(1.65)
0.0904
(0.73)
-0.280
(-1.08)
0.194
(1.41)
-0.146
(-1.23)
Early termination privilege 0.340***
(3.41)
0.367***
(3.49)
0.287**
(2.01)
0.390***
(2.98)
0.347*
(1.73)
0.370**
(2.54)
0.097
(0.68)
Deposit via Internet dummy 0.308
(1.45)
0.839***
(3.06)
-0.123
(-0.48)
0.484*
(1.87)
0.627**
(2.03)
0.072
(0.43)
Compounding interest dummy -0.233***
(-3.66)
-0.223***
(-3.19)
-0.175
(-1.54)
-0.230***
(-2.88)
-0.294*
(-1.90)
-0.285***
(-3.57)
-0.138
(-1.77)
Automatic renewal dummy 0.101
(1.03)
0.0507
(0.48)
0.126
(0.88)
0.122
(0.97)
0.111
(0.38)
0.210
(1.43)
0.140
(0.98)
Deposit tied to mutual fund 0.375
(1.55)
-0.238
(-0.97)
-0.162
(-0.73)
0.0263
(0.08)
-0.375
(-1.17)
2.767***
(10.41)
Pension deposit dummy 0.750***
(6.36)
0.743***
(6.03)
0.692***
(5.14)
0.893***
(4.94)
0.950***
(4.81)
0.782***
(5.92)
0.544**
(2.50)
Seasonal deposit dummy 1.169***
(7.07)
0.984***
(7.42)
1.345***
(9.06)
1.114***
(5.62)
1.087**
(2.67)
1.194***
(5.23)
0.881***
(4.32)
Other special deposit dummy 0.191
(1.36)
0.230
(1.71)
0.470**
(2.20)
-0.240
(-0.96)
-0.0906
(-0.37)
-0.0131
(-0.05)
(Cont.)

37
(Cont.)
Full
sample
Private
domestic
banks
sample
Regional
banks
sample
Moscow
banks
sample
Banks with
large and
fast growing
deposit base
Banks with
large and slow
growing
deposit base
Banks with
low deposit
base
Bank level variables:
Regional bank -0.774***
(-6.05)
-0.765***
(-5.80)
-0.862**
(-2.56)
-0.862***
(-5.12)
-0.038
(-0.20)
Regional bank *Uninsured
deposit
-0.028
(-0.25)
-0.009
(-0.07)
0.159
(0.49)
-0.073
(-0.53)
0.038
(0.17)
Foreign bank -1.000***
(-5.45)
-1.019***
(-4.95)
-0.860**
(-2.53)
-0.979***
(-5.07)
Foreign bank *Uninsured
deposit
-0.012
(-0.07)
-0.045
(-0.22)
-0.270
(-1.03)
-0.084
(-0.29)
State bank -0.888***
(-5.14)
-0.500**
(-2.92)
-1.111***
(-3.55)
-1.139***
(-4.02)
-0.436
(-1.60)
State bank*Uninsured deposit -0.061
(-0.33)
0.179
(0.49)
0.053
(0.20)
-0.266
(-1.13)
-0.445
(-1.34)
Capital ratio -0.001
(-0.03)
0.006
(0.81)
0.016
(1.00)
0.002
(0.24)
-0.032***
(-4.25)
0.004
(0.42)
0.005
(0.32)
Capital ratio *Uninsured
deposit
-0.018**
(-2.44)
-0.022***
(-2.84)
-0.033***
(-2.89)
-0.014
(-1.44)
-0.013
(-1.51)
-0.019*
(-1.83)
-0.020
(-1.20)
NPL/Total Loans 0.006
(0.62)
-0.014
(-1.32)
-0.028***
(-2.81)
0.032***
(3.63)
0.066*
(1.87)
0.004
(0.33)
0.001
(0.06)
NPL/Total Loans*Uninsured
deposit
-0.001
(-0.07)
-0.001
(-0.02)
0.005
(0.38)
-0.009
(-1.07)
0.061
(1.57)
-0.003
(-0.27)
-0.003
(-0.21)
Private Loans/Assets 0.008***
(2.26)
0.005
(1.23)
0.009
(1.87)
0.004
(0.69)
0.033***
(3.08)
0.010**
(2.31)
0.004
(0.61)
Private Loans/Assets
*Uninsured deposit
0.011***
(2.61)
0.011**
(2.37)
0.017***
(3.17)
0.013**
(2.07)
0.012
(1.38)
0.009*
(1.79)
0.014
(1.64)
Log(Assets) -0.302***
(-7.32)
-0.239***
(-4.88)
-0.196**
(-2.92)
-0.320***
(-5.82)
-0.041
(-0.21)
-0.269***
(-4.78)
-0.284***
(-4.34)
Log(Assets)*Uninsured deposit -0.046
(-1.28)
-0.060
(-1.41)
-0.008
(-1.30)
-0.049
(-0.99)
-0.437**
(-2.46)
-0.053
(-1.11)
0.015
(0.17)
Household deposits /Total
Deposits
-0.001
(-0.08)
0.001
(0.45)
-0.003
(-0.82)
0.003
(1.32)
0.042***
(8.52)
-0.005
(-1.00)
0.005**
(2.01)
Household deposits /Total
Deposits*Uninsured deposit
-0.001
(-0.66)
-0.002
(-0.91)
-0.001
(-0.21)
-0.002
(-0.92)
-0.022***
(-4.04)
0.004
(1.19)
0.002
(0.49)
Constant 9.234***
(11.48)
8.091***
(8.55)
6.734***
(5.39)
9.513***
(8.93)
1.811
(0.56)
8.793***
(7.70)
8.667***
(5.99)
N: bank-deposit contract
observations
7409 6147 2897 4510 433 5045 1935
R2 0.668 0.636 0.663 0.699 0.798 0.652 0.759