deploying a common pi infrastructure across …€¦ · deploying a common pi infrastructure across...
TRANSCRIPT
Presented by
© Copyr igh t 2013 OSIso f t , LLC.
Deploying a common PI Infrastructure across
Barrick Gold- Asia Pacific
CASE STUDY: Rolling out a Regional Data Historian
Presented by: Gavin StrackManager - Process ControlBarrick Australia Pacific
2
Case Study
Rolling out a regional data historian
Case Study
Rolling out a regional data historian
August 2013August 2013
3
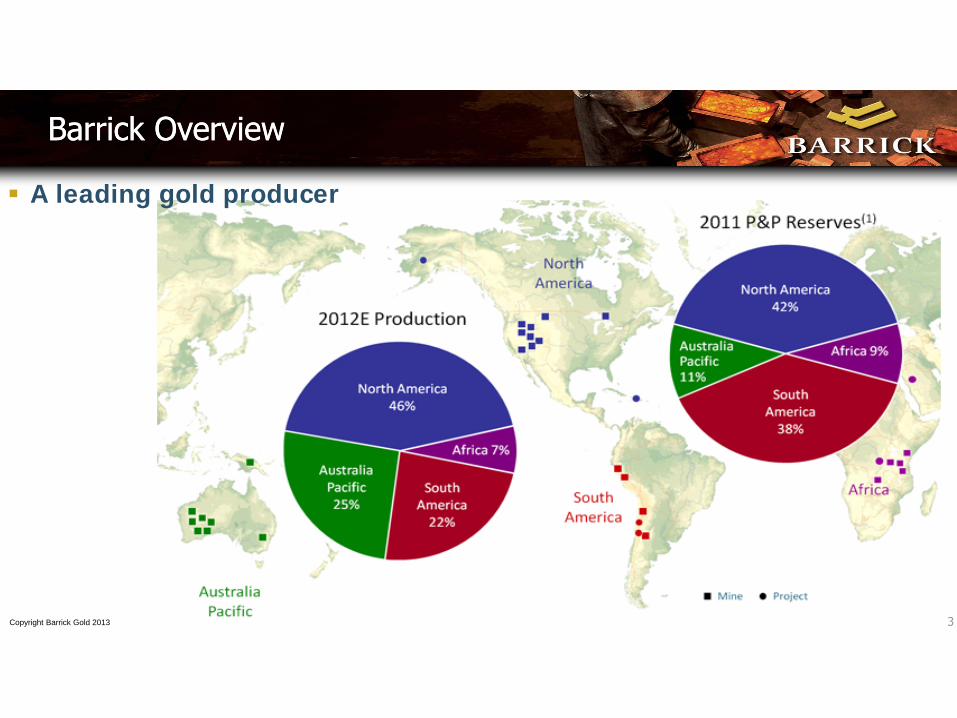
Barrick OverviewBarrick Overview
Copyright Barrick Gold 2013
A leading gold producer
4
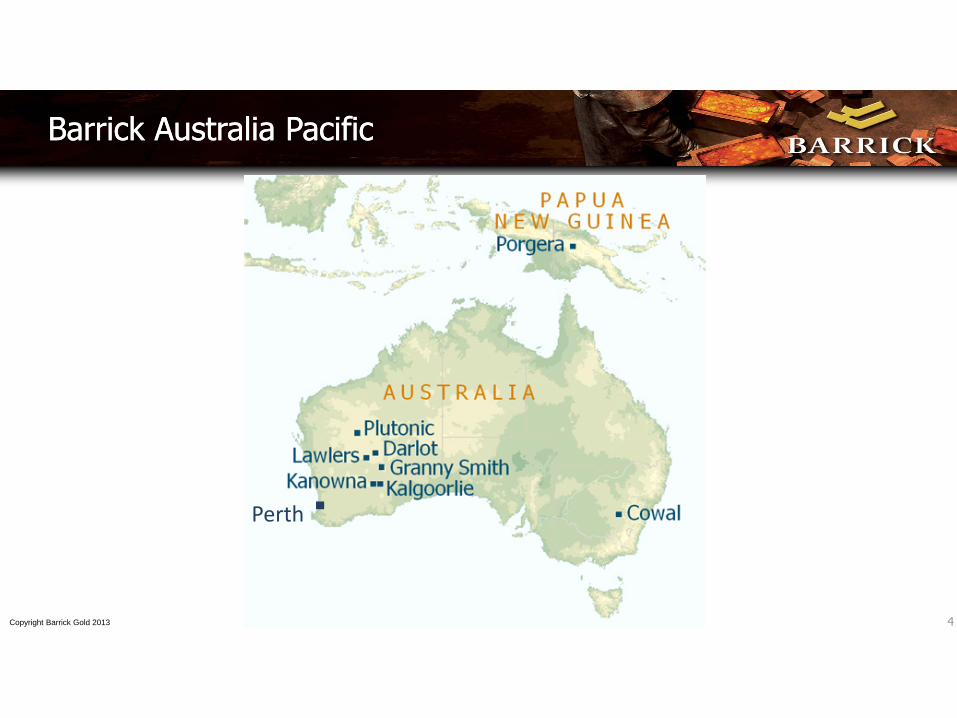
Barrick Australia PacificBarrick Australia Pacific
Copyright Barrick Gold 2013
Perth
5
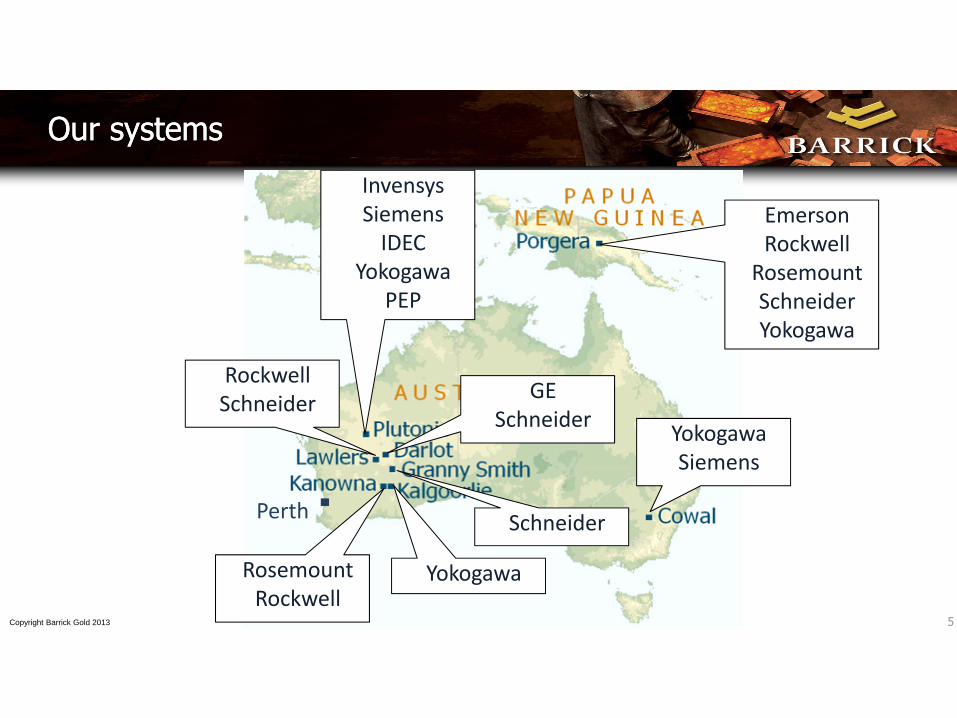
Our systemsOur systems
Copyright Barrick Gold 2013
EmersonRockwell
RosemountSchneiderYokogawa
RockwellSchneider
RosemountRockwell
YokogawaSiemens
Schneider
Yokogawa
GESchneider
InvensysSiemensIDEC
YokogawaPEP
Perth
6
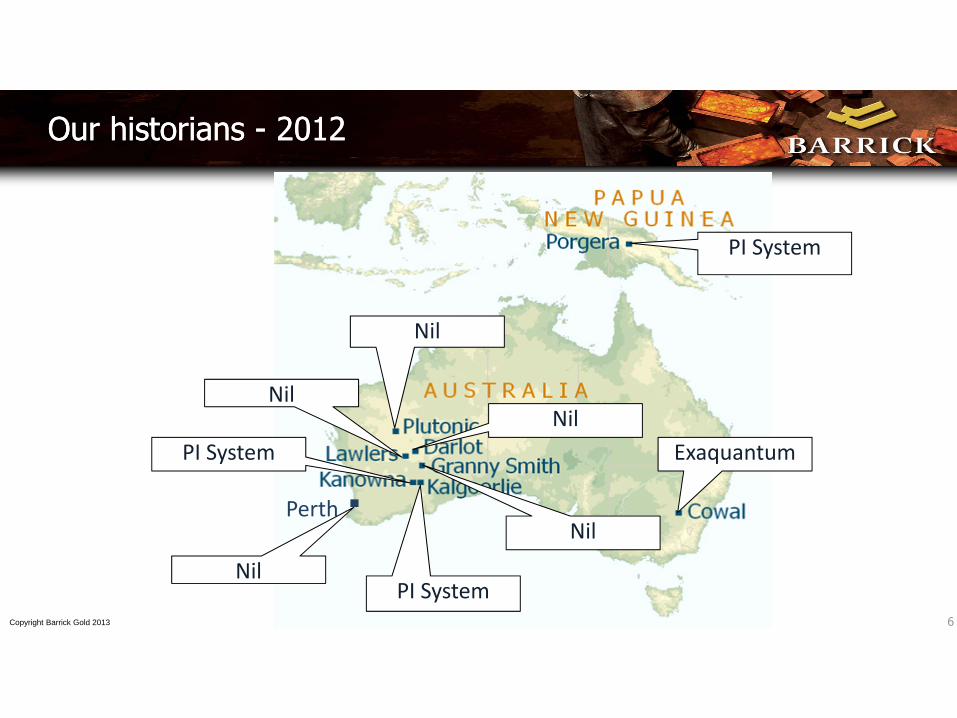
Our historians - 2012Our historians - 2012
Copyright Barrick Gold 2013
PI System
Nil
PI System Exaquantum
Nil
PI System
Nil
Nil
Perth
Nil
7
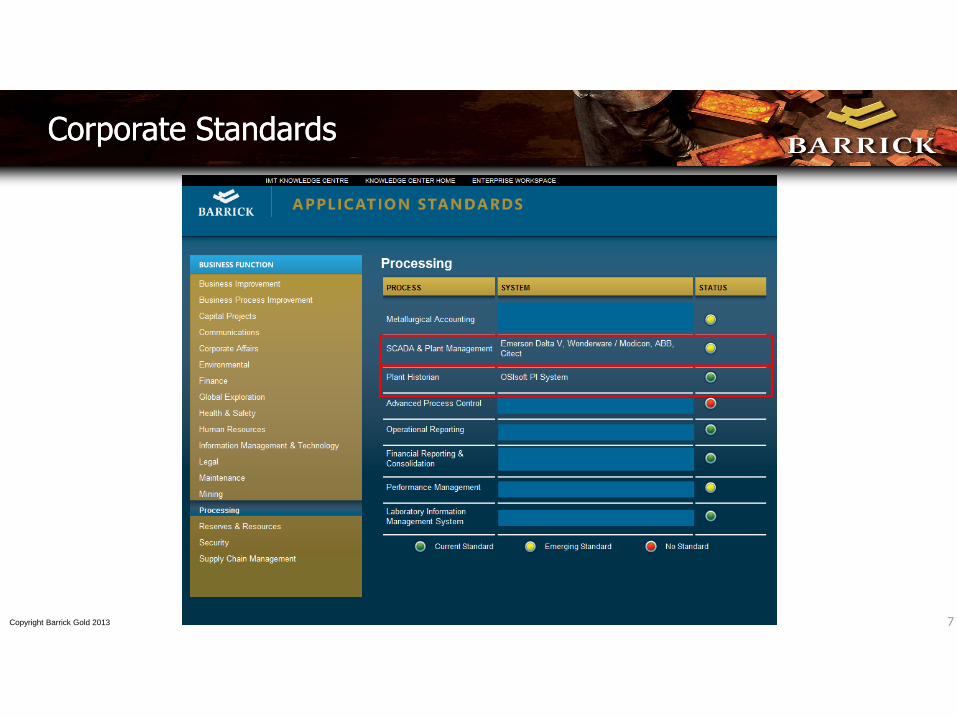
Corporate StandardsCorporate Standards
Copyright Barrick Gold 2013

8
Project InitiationProject Initiation
• Scope and plan developed
• Project Scope:• New infrastructure at Darlot, Lawlers, Granny Smith,
Plutonic and Perth• Upgrade of the existing PI System data historians at
Kanowna Belle
• Iterative approach to develop a standard IT-OT interfaceCopyright Barrick Gold 2013
9
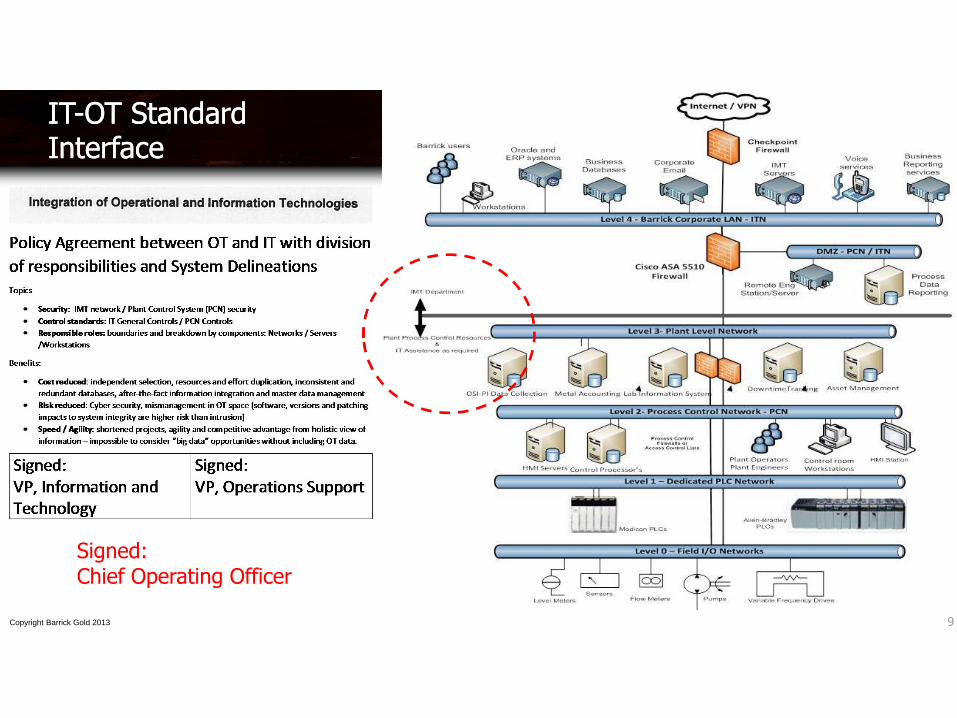
IT-OT Standard InterfaceIT-OT Standard Interface
Copyright Barrick Gold 2013
Signed:Chief Operating Officer

10
Construction updateConstruction update
Perth Perth
2012 2013
Copyright Barrick Gold 2013
Funding method to be confirmed.
Funding method determined.
Under construction.
Infrastructure in place.
11
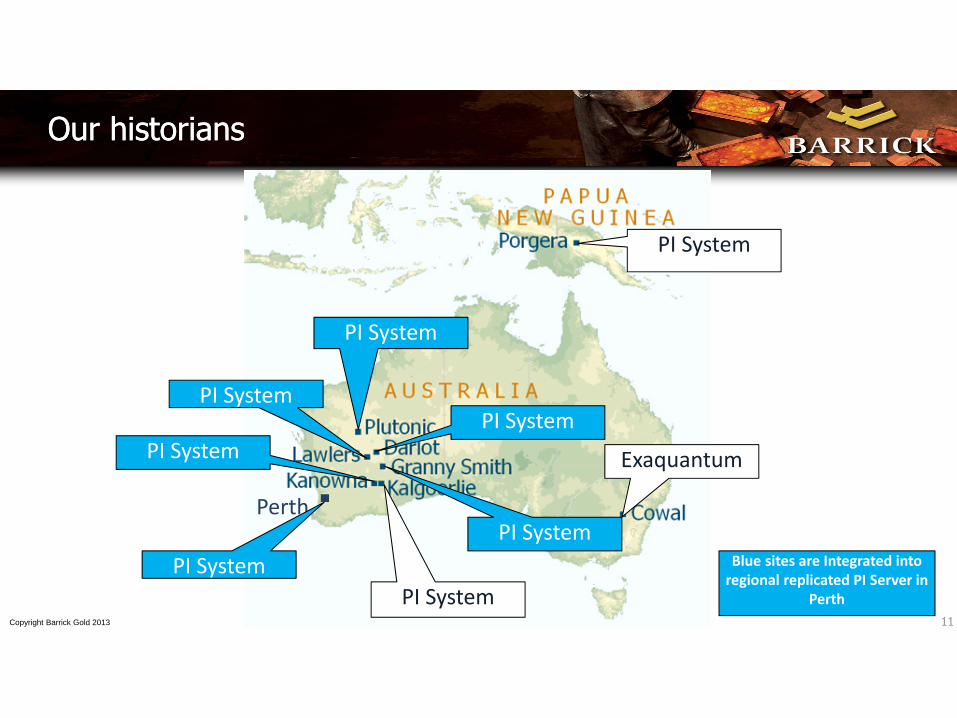
Our historiansOur historians
Copyright Barrick Gold 2013
PI System
PI System
PI System Exaquantum
PI System
PI System
PI System
PI System
Perth
PI System Blue sites are Integrated into regional replicated PI Server in
Perth

12
How could we add value?How could we add value?
Copyright Barrick Gold 2013

13
Remote connectivityRemote connectivity
Visibility of the process from any computer connected to the Barrick Intranet
Copyright Barrick Gold 2013
14
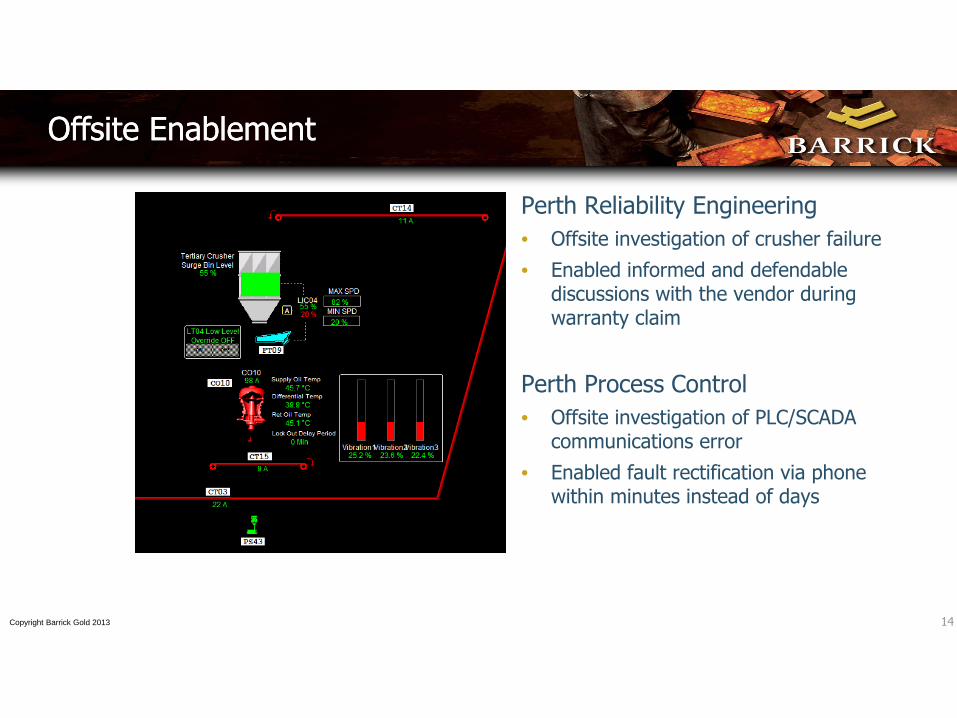
Offsite EnablementOffsite Enablement
Perth Reliability Engineering• Offsite investigation of crusher failure• Enabled informed and defendable
discussions with the vendor during warranty claim
Perth Process Control• Offsite investigation of PLC/SCADA
communications error• Enabled fault rectification via phone
within minutes instead of days
Copyright Barrick Gold 2013
15
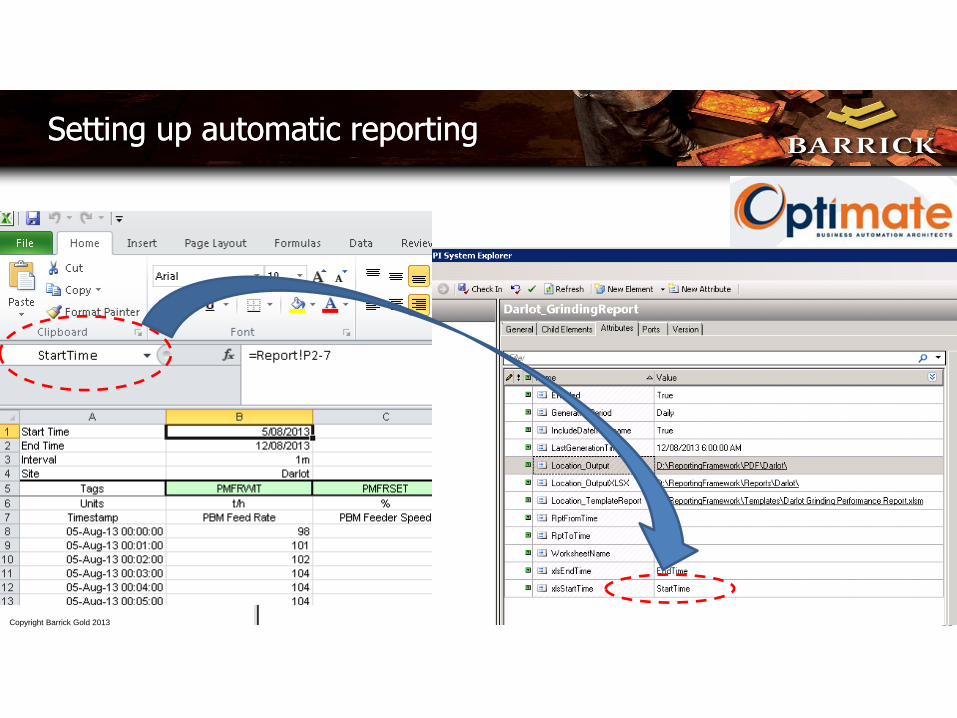
Setting up automatic reportingSetting up automatic reporting
Copyright Barrick Gold 2013

16
Improved OperationsImproved Operations
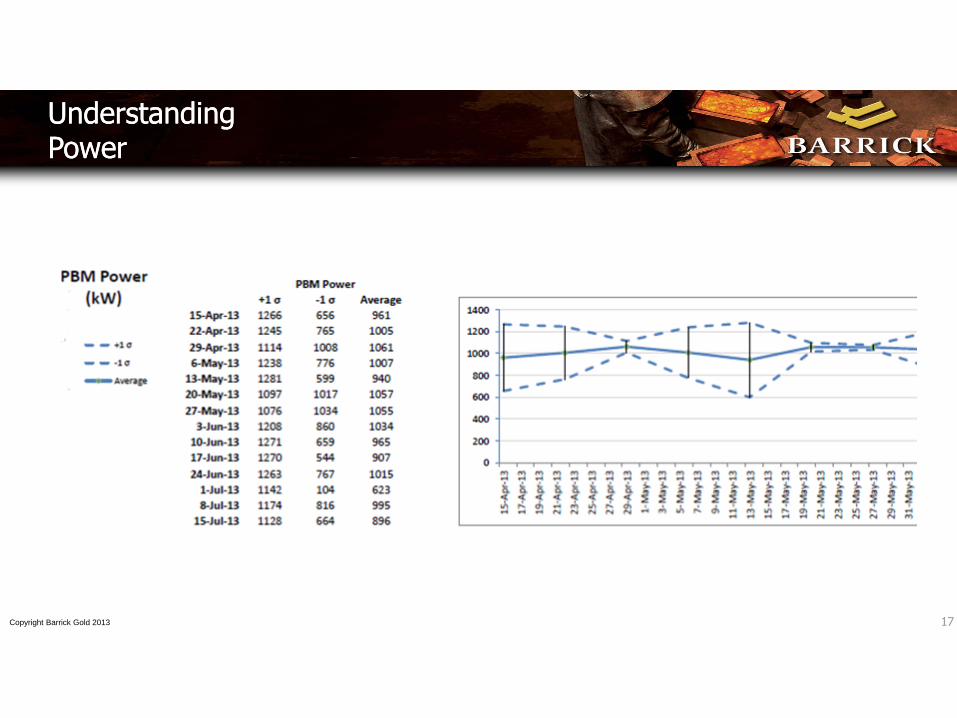
Automatic Production Reporting• Production achieved• Asset/plant area performance• Statistical analysis (e.g. +/- 3σ)• No OT access required
Copyright Barrick Gold 2013
17
UnderstandingPowerUnderstandingPower
Copyright Barrick Gold 2013
18
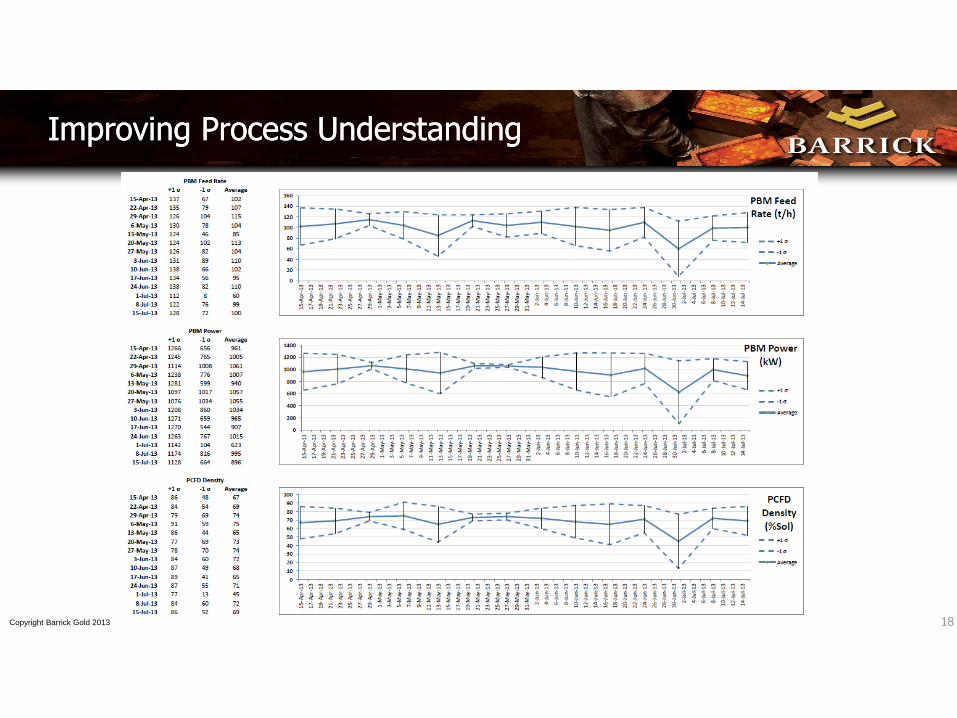
Improving Process UnderstandingImproving Process Understanding
Copyright Barrick Gold 2013
19
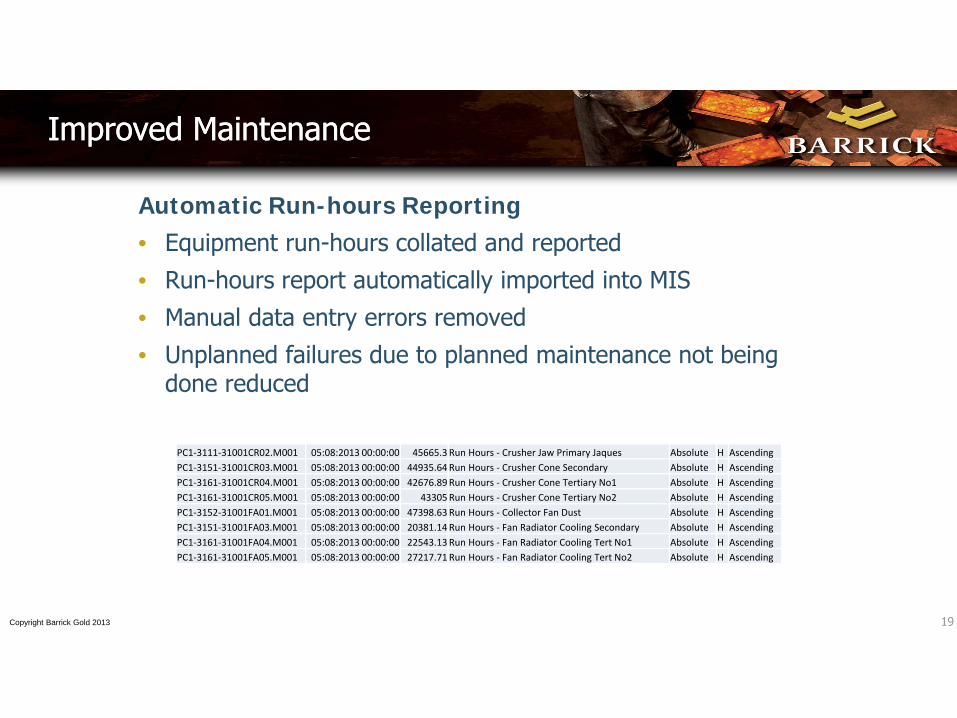
Improved MaintenanceImproved Maintenance
Automatic Run-hours Reporting• Equipment run-hours collated and reported• Run-hours report automatically imported into MIS• Manual data entry errors removed• Unplanned failures due to planned maintenance not being
done reduced
PC1‐3111‐31001CR02.M001 05:08:2013 00:00:00 45665.3Run Hours ‐ Crusher Jaw Primary Jaques Absolute H AscendingPC1‐3151‐31001CR03.M001 05:08:2013 00:00:00 44935.64Run Hours ‐ Crusher Cone Secondary Absolute H AscendingPC1‐3161‐31001CR04.M001 05:08:2013 00:00:00 42676.89Run Hours ‐ Crusher Cone Tertiary No1 Absolute H AscendingPC1‐3161‐31001CR05.M001 05:08:2013 00:00:00 43305Run Hours ‐ Crusher Cone Tertiary No2 Absolute H AscendingPC1‐3152‐31001FA01.M001 05:08:2013 00:00:00 47398.63Run Hours ‐ Collector Fan Dust Absolute H AscendingPC1‐3151‐31001FA03.M001 05:08:2013 00:00:00 20381.14Run Hours ‐ Fan Radiator Cooling Secondary Absolute H AscendingPC1‐3161‐31001FA04.M001 05:08:2013 00:00:00 22543.13Run Hours ‐ Fan Radiator Cooling Tert No1 Absolute H AscendingPC1‐3161‐31001FA05.M001 05:08:2013 00:00:00 27217.71Run Hours ‐ Fan Radiator Cooling Tert No2 Absolute H Ascending
Copyright Barrick Gold 2013
20
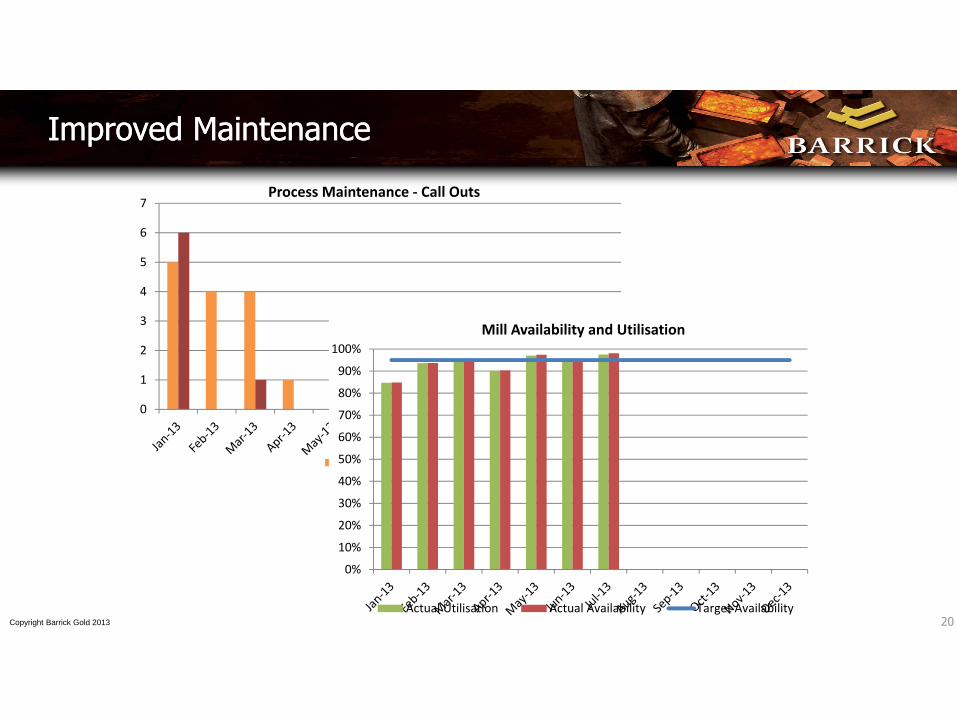
Improved MaintenanceImproved Maintenance
0
1
2
3
4
5
6
7Process Maintenance ‐ Call Outs
Mechanical SI
0%
10%
20%
30%
40%
50%
60%
70%
80%
90%
100%Mill Availability and Utilisation
Actual Utilisation Actual Availability Target AvailabilityCopyright Barrick Gold 2013
21
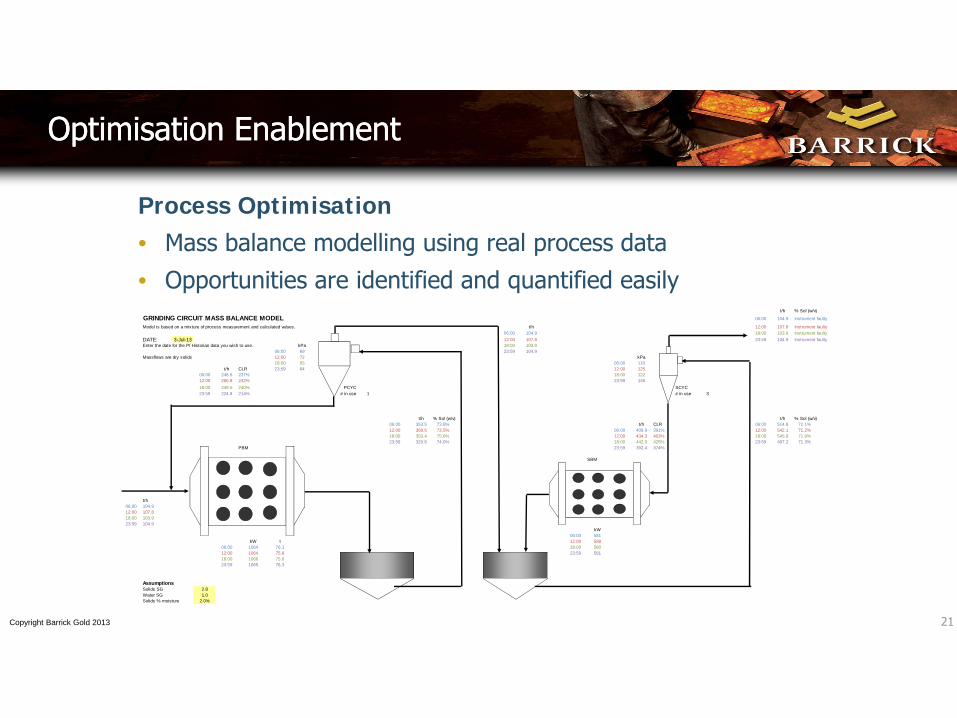
Optimisation EnablementOptimisation Enablement
Process Optimisation• Mass balance modelling using real process data• Opportunities are identified and quantified easily
t/h % Sol (w/v)
GRINDING CIRCUIT MASS BALANCE MODEL 06:00 104.9 Instrument faulty
Model is based on a mixture of process measurement and calculated values. t/h 12:00 107.8 Instrument faulty06:00 104.9 18:00 103.9 Instrument faulty
DATE: 3-Jul-13 12:00 107.8 23:59 104.9 Instrument faultyEnter the date for the PI Historian data you wish to use. kPa 18:00 103.9
06:00 69 23:59 104.9Massflows are dry solids 12:00 72 kPa
18:00 65 06:00 110t/h CLR 23:59 64 12:00 125
06:00 248.6 237% 18:00 12212:00 260.8 242% 23:59 14618:00 249.5 240% PCYC SCYC23:59 224.8 214% # in use 1 # in use 3
t/h % Sol (w/v) t/h % Sol (w/v)06:00 353.5 73.8% t/h CLR 06:00 514.8 72.1%12:00 368.6 73.5% 06:00 409.9 391% 12:00 542.1 71.2%18:00 353.4 75.6% 12:00 434.3 403% 18:00 545.9 71.9%23:59 329.6 74.0% 18:00 442.0 425% 23:59 497.2 71.3%
PBM 23:59 392.4 374%
SBM
t/h06:00 104.912:00 107.818:00 103.923:59 104.9
kW06:00 581
kW t 12:00 58806:00 1064 76.1 18:00 58012:00 1064 75.8 23:59 58118:00 1066 75.623:59 1065 76.3
AssumptionsSolids SG 2.8Water SG 1.0Solids % moisture 2.0%
Copyright Barrick Gold 2013
22
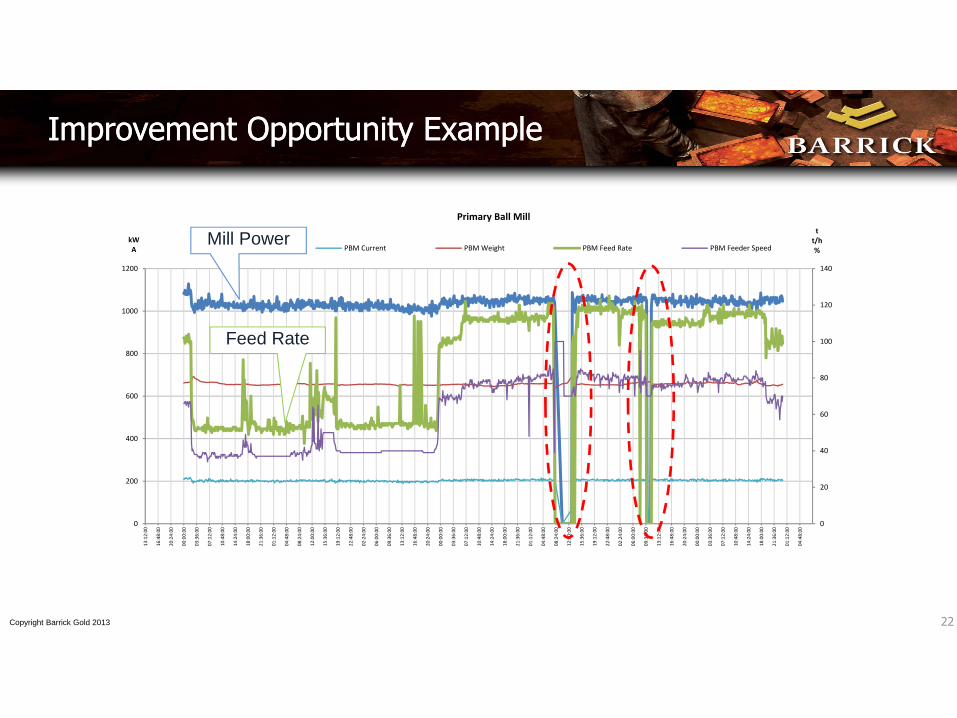
Improvement Opportunity ExampleImprovement Opportunity Example
0
20
40
60
80
100
120
140
0
200
400
600
800
1000
1200
13:12:00
16:48:00
20:24:00
00:00:00
03:36:00
07:12:00
10:48:00
14:24:00
18:00:00
21:36:00
01:12:00
04:48:00
08:24:00
12:00:00
15:36:00
19:12:00
22:48:00
02:24:00
06:00:00
09:36:00
13:12:00
16:48:00
20:24:00
00:00:00
03:36:00
07:12:00
10:48:00
14:24:00
18:00:00
21:36:00
01:12:00
04:48:00
08:24:00
12:00:00
15:36:00
19:12:00
22:48:00
02:24:00
06:00:00
09:36:00
13:12:00
16:48:00
20:24:00
00:00:00
03:36:00
07:12:00
10:48:00
14:24:00
18:00:00
21:36:00
01:12:00
04:48:00
tt/h%
kWA
Primary Ball Mill
PM_KW_PV PBM Current PBM Weight PBM Feed Rate PBM Feeder SpeedMill Power
Feed Rate
Copyright Barrick Gold 2013
23
Business Case DevelopmentBusiness Case Development
Feb-Apr 2013 data ~ 17,000t loss @ 115t/h (69 KTPA) 4g/t head grade (2012) 93.5% Recovery (2012) ~300 oz
Benefit is ~$400k p.a. maintaining 115t/h Indicative project cost: $150k. Payback is ~ 4 months.
If we lift tonnes, its pure profit.
Copyright Barrick Gold 2013
24
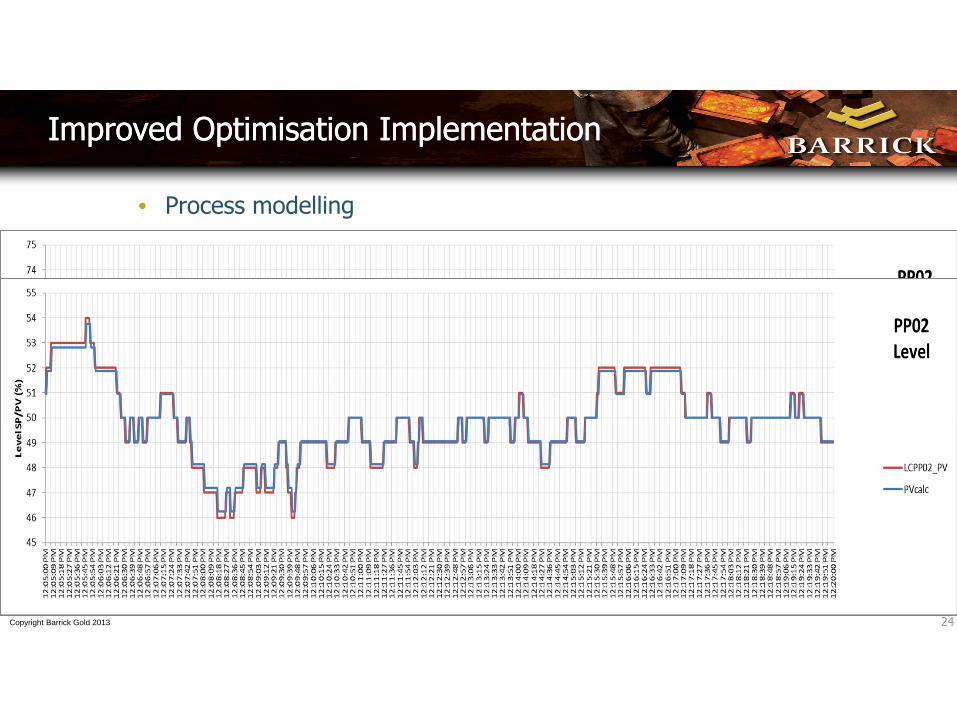
Improved Optimisation ImplementationImproved Optimisation Implementation
• Process modelling
Copyright Barrick Gold 2013
25
Improved Process VisualisationImproved Process Visualisation
• Process visibility anywhere• No SCADA licenses• Visibility without control – reduced risk• Standardise process visualisation regionally
Copyright Barrick Gold 2013

26
Typical HMI ExampleTypical HMI Example
Copyright Barrick Gold 2013
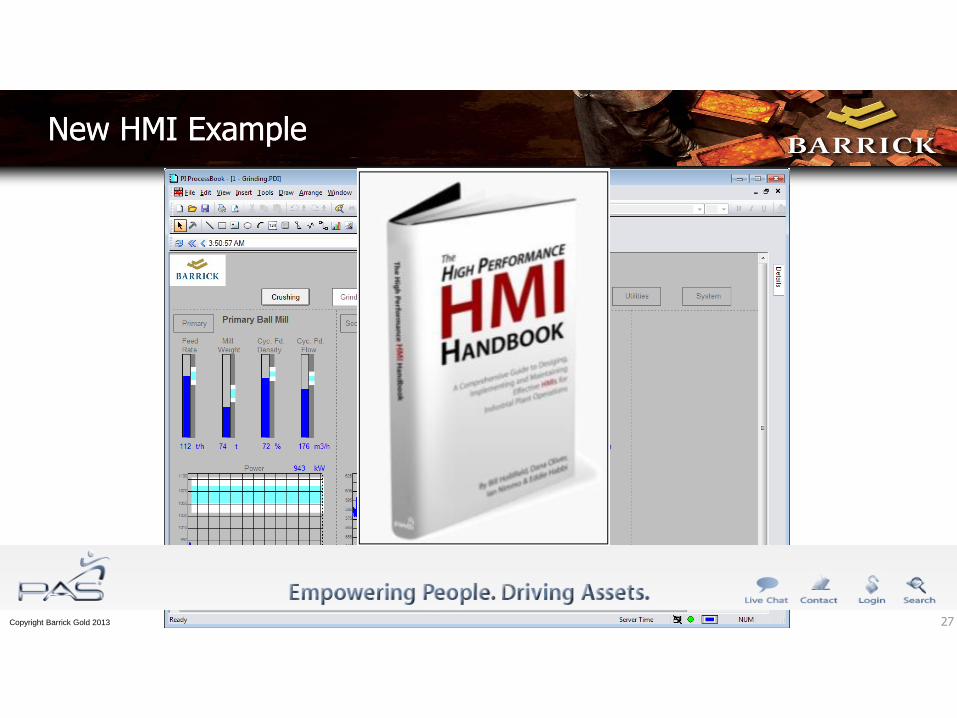
27
New HMI ExampleNew HMI Example
Copyright Barrick Gold 2013
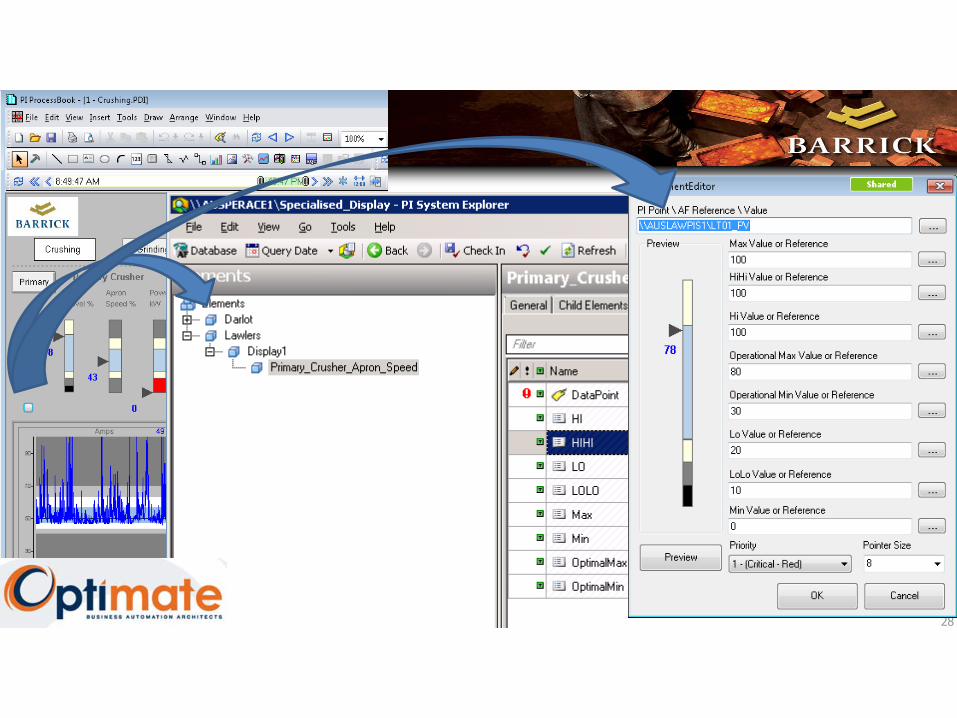
28
New HMI ExampleNew HMI Example
Copyright Barrick Gold 2013

29
Human Centred HMI DesignHuman Centred HMI Design
Copyright Barrick Gold 2013
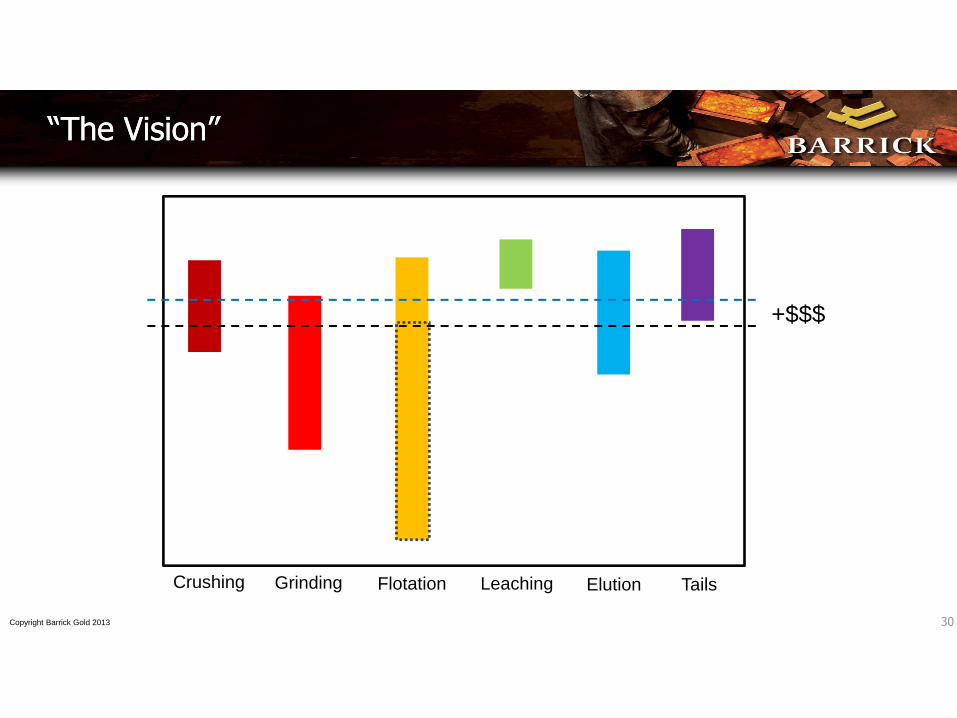
30
“The Vision”“The Vision”
Crushing Grinding Flotation Leaching Elution Tails
+$$$
Copyright Barrick Gold 2013

31
Now imagine it regionally?Now imagine it regionally?
Copyright Barrick Gold 2013
Region
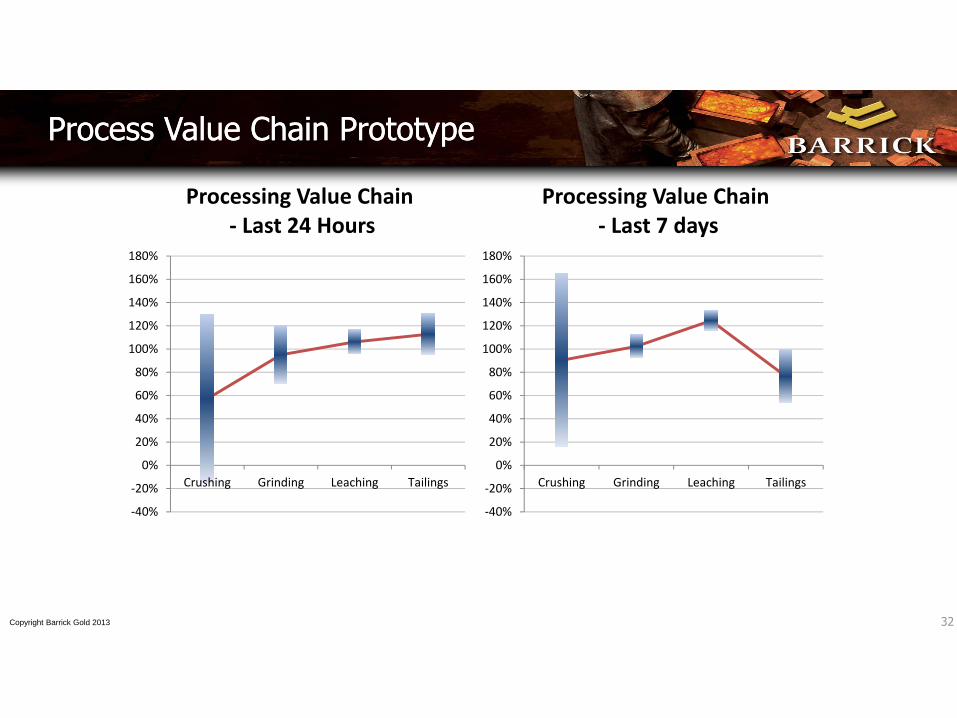
32
Process Value Chain PrototypeProcess Value Chain Prototype
‐40%
‐20%
0%
20%
40%
60%
80%
100%
120%
140%
160%
180%
Crushing Grinding Leaching Tailings
Processing Value Chain‐ Last 24 Hours
‐40%
‐20%
0%
20%
40%
60%
80%
100%
120%
140%
160%
180%
Crushing Grinding Leaching Tailings
Processing Value Chain‐ Last 7 days
Copyright Barrick Gold 2013
33
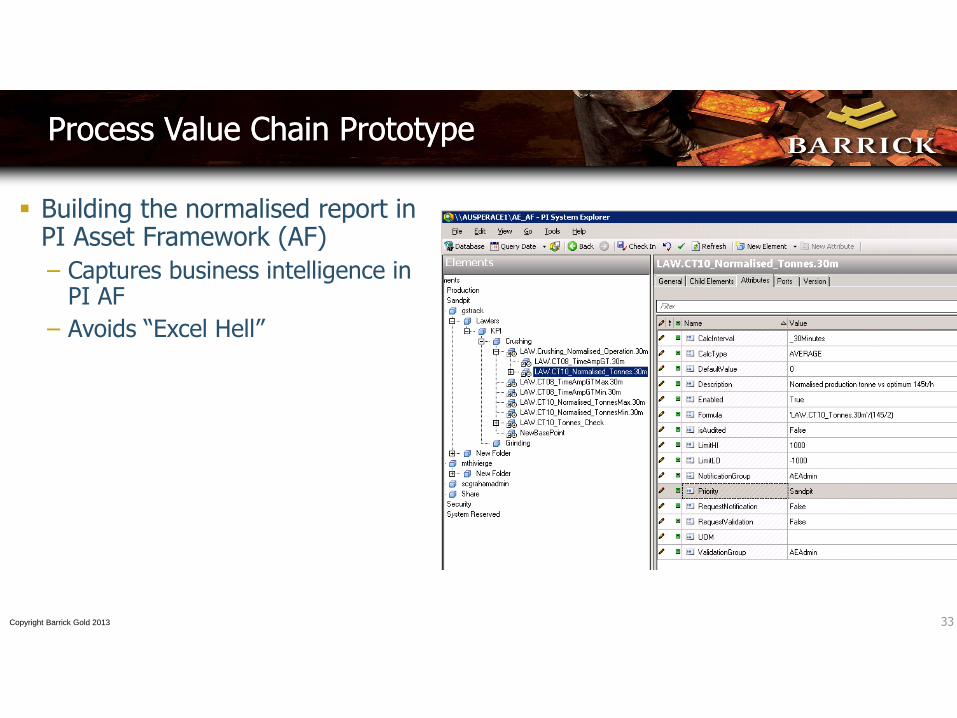
Process Value Chain PrototypeProcess Value Chain Prototype
Copyright Barrick Gold 2013
Building the normalised report in PI Asset Framework (AF)– Captures business intelligence in
PI AF– Avoids “Excel Hell”
34
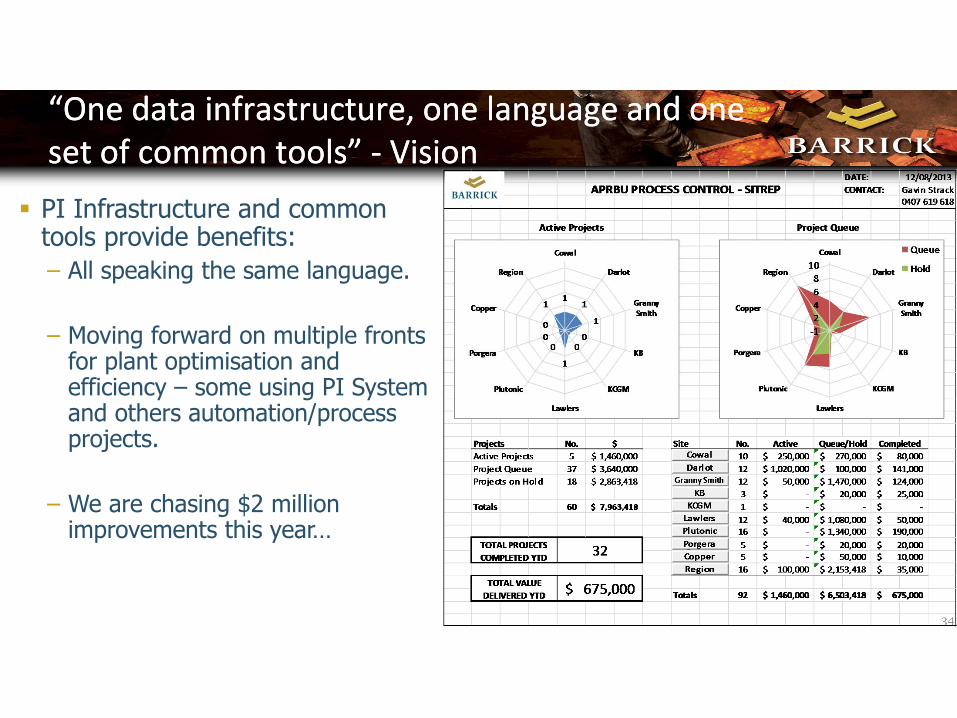
“One data infrastructure, one language and one set of common tools” ‐ Vision“One data infrastructure, one language and one set of common tools” ‐ Vision
PI Infrastructure and common tools provide benefits:– All speaking the same language.
– Moving forward on multiple fronts for plant optimisation and efficiency – some using PI System and others automation/process projects.
– We are chasing $2 million improvements this year…

35
SummarySummary
We can integrate our disparate systems We can see what is happening at remote operations from anywhere We can quantify opportunities using real data and validate improvements are
delivered We can make life easier for the operator, and focus their efforts on adding
value Our process data is secure, accessible, auditable and traceable
36
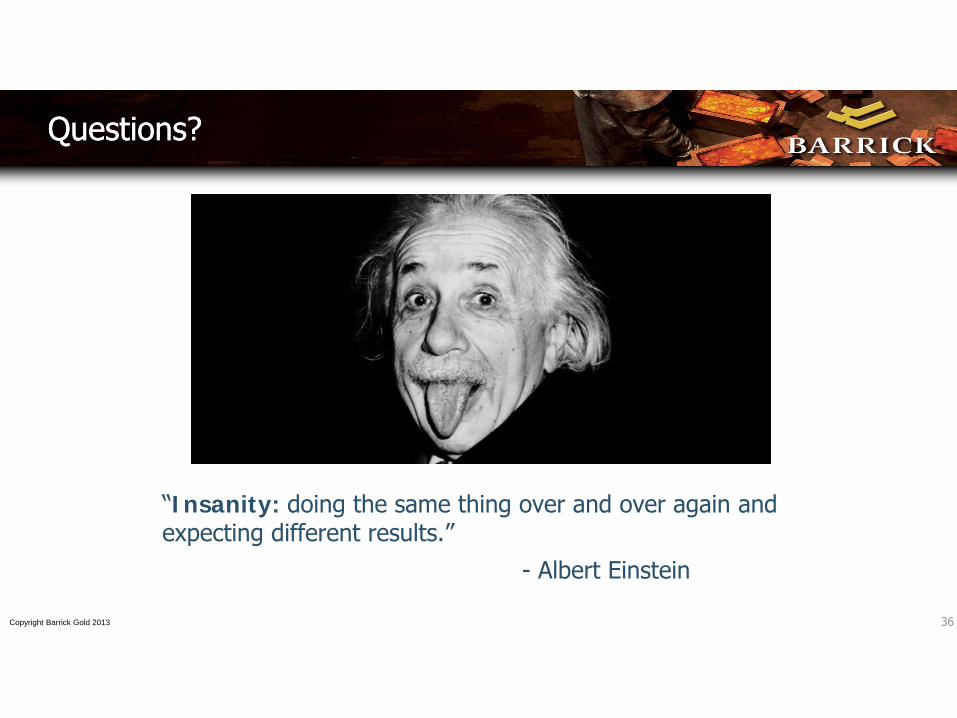
“Insanity: doing the same thing over and over again and expecting different results.”
- Albert Einstein
Questions?Questions?
Copyright Barrick Gold 2013
© Copyr igh t 2013 OSIso f t , LLC. 37
Gavin Strack Manager - Process ControlBarrick Australia Pacific

Brought to you by
© Copyr igh t 2013 OSIso f t , LLC.