departments development social for management performance ... · guide on performance management...
TRANSCRIPT
i
Public Service Commission
Guide on performance management forsocial development departments
Published in the Republic of South Africa by:
THE PUBLIC SERVICE COMMISSION (PSC)Commission House
Cnr. Hamilton & Ziervogel StreetsArcadia, 0083
Private Bag x121Pretoria, 0001
Tel. (012) 352-1000Fax (012) 325-8382
Website: www.opsc.gov.za
National Anti-Corruption Hotline Number: 0800 701 701 (Toll-Free)
Compiled by: Branch: Monitoring and Evaluation
Distribution by: Directorate: Communication and Information Services
ISBN: 0-621-37005-3RP: 10/2007
i
i
Public Service Commission
Guide on performance management forsocial development departments
Published in the Republic of South Africa by:
THE PUBLIC SERVICE COMMISSION (PSC)Commission House
Cnr. Hamilton & Ziervogel StreetsArcadia, 0083
Private Bag x121Pretoria, 0001
Tel. (012) 352-1000Fax (012) 325-8382
Website: www.opsc.gov.za
National Anti-Corruption Hotline Number: 0800 701 701 (Toll-Free)
Compiled by: Branch: Monitoring and Evaluation
Distribution by: Directorate: Communication and Information Services
ISBN: 0-621-37005-3RP: 10/2007
Published in the Republic of South Africa by:
THE PUBLIC SERVICE COMMISSION (PSC) Commission House
cnr. Hamilton & Ziervogel Streets Pretoria, 0083
Private Bag X121Pretoria, 0001
Tel: (012) 352 1000Fax: (012) 352 8382
Website: www.psc.gov.za
National Anti-Corruption Hotline Number: 0800 701 701 (Toll-Free)Compiled by Branch: Investigations and Human Resource Reviews
Distributed by Directorate: Communication and Information ServicesRP: 232/2007
ISBN: 978-0-621-37546-6
Public Service Commission
Report on the Audit on Vacancy Rates in National and Provincial Departments
PROOF4.indd 1 08/11/2007 11:35:53
ii
ii
CONTENTSPage
EXECUTIVE SUMMARYiii
1 INTRODUCTION1
1.1Background11.2Problem statement11.3Scope21.4Methodology21.5Limitations3
2.RELATIONSHIPS AND BOUNDARY SETTING4
2.1Constitutional framework42.2Legal Framework and Codes62.3Operational Framework and Practice8
3.CURRENT STATE AND PERSPECTIVES10
3.1Executive Authorities (Ministers and MECs)113.2Deputy Ministers153.3Special Advisors163.4Heads of Department17
4.COMPARATIVE INTERNATIONAL EXPERIENCES IN ROLE CLARIFICATION19
Foreword
In 1994 the democratic government made a lasting commitment to the citizens of this country, the promise of a “Better Life for All”. For the State to make this a reality, the expertise, skills and competencies of its machinery, the Public Service, are critical. Today, the higher than normal vacancy rate in national and provincial departments remains one of the critical challenges which threaten the success of the State to deliver on this promise.
The failure, or perceived failure, to deliver on the mandate of the State has created a negative perception on the outlook of the Public Service. The effects of the vacancy rates must be viewed against the large number of service delivery complaints lodged with the Public Service Commission (PSC). This is evidenced in the findings of the soon to be released Report on Trend Analysis of Complaints lodged with the PSC. In this report poor service delivery is among the top three types of complaints lodged. Indeed, where posts remain vacant for extended periods, service delivery is constantly under threat in various departments.
This report reflects the audit of the progress with regard to vacancy rates in all national and provincial departments. It is a response to the request by the Standing Committee on Public Accounts (SCOPA) during August 2007 for the PSC to carry out such an audit. The PSC undertook this audit in accordance with section 196 of the Constitution which, inter alia, empowers the PSC to promote the values and principles of public administration provided for in section 195.
The findings made in this report show that due to poor record keeping and ineffective monitoring of vacancies in the Public Service, it is difficult to determine the exact vacancy rate. Despite various attempts to validate the vacancy rate this has not been possible. What has indeed come to the fore is that the vacancy rate is much lower than the figures reflected on PERSAL. Furthermore, the report includes recommendations aimed at assisting the Public Service in dealing with the vacancy rates.
I would like to thank all the stakeholders who participated in this audit within the tight timeframe set for the pro-vision of information, as this report would not have been possible without their co-operation, participation and inputs.
PROF SS SANGWENICHAIRPERSON
PROOF4.indd 2 08/11/2007 11:36:08
ii
CONTENTSPage
EXECUTIVE SUMMARYiii
1 INTRODUCTION1
1.1Background11.2Problem statement11.3Scope21.4Methodology21.5Limitations3
2.RELATIONSHIPS AND BOUNDARY SETTING4
2.1Constitutional framework42.2Legal Framework and Codes62.3Operational Framework and Practice8
3.CURRENT STATE AND PERSPECTIVES10
3.1Executive Authorities (Ministers and MECs)113.2Deputy Ministers153.3Special Advisors163.4Heads of Department17
4.COMPARATIVE INTERNATIONAL EXPERIENCES IN ROLE CLARIFICATION19
iii
Contents Page
Foreword ii
Executive Summary v
Chapter 1: Introduction 1
1.1 INTRODUCTION 2
1.2 THE PSC’S LEGISLATIVE MANDATE 2
1.3 OBJECTIVES OF THE REPORT 3
1.4 SCOPE OF THE AUDIT 3
1.5 METHODOLOGY 3
1.6 LIMITATIONS EXPERIENCED 4
1.7 OUTLINE OF THE REPORT 5
Chapter 2: Review of Applicable Prescripts 7
2.1 INTRODUCTION 8
2.2 CONSTITUTION OF THE REPUBLIC OF SOUTH AFRICA, 1996 8
2.3 PUBLIC SERVICE ACT, 1994 8
2.4 PUBLIC FINANCE MANAGEMENT ACT, 1999 8
2.5 PUBLIC SERVICE REGULATIONS, 2001 9
2.6 PUBLIC SERVICE CO-ORDINATING BARGAINING COUNCIL (PSCBC)
RESOLUTION 1 OF 2007 10
Chapter 3: Data Analysis and Findings 11
3.1 INTRODUCTION 12
3.2 TOTAL NUMBER OF FUNDED VACANCIES IN THE PUBLIC SERVICE 12
3.3 DETERMINING THE VACANCY RATE IN THE PUBLIC SERVICE AS AT 1 AUGUST 2007 14
3.4 COMPENSATION OF EMPLOYEES 17
3.5 SALARY LEVELS OF FUNDED VACANT POSTS 20
3.6 PROGRESS REGARDING THE RECRUITMENT PROCESS 21
3.7 AVERAGE TURNAROUND TIME TAKEN FOR THE FILLING OF POSTS 25
3.8 FACTORS IMPACTING ON THE FILLING OF POSTS 26
3.9 STRATEGIES TO DEAL WITH THE HIGH VACANCY RATE IN DEPARTMENTS 28
Chapter 4: Recommendations 31
Chapter 5: Conclusion 35
PROOF4.indd 3 08/11/2007 11:36:08

ii
CONTENTSPage
EXECUTIVE SUMMARY iii
1 INTRODUCTION 1
1.1 Background 11.2 Problem statement 11.3 Scope 21.4 Methodology 21.5 Limitations 3
2. RELATIONSHIPS AND BOUNDARY SETTING 4
2.1 Constitutional framework 42.2 Legal Framework and Codes 62.3 Operational Framework and Practice 8
3. CURRENT STATE AND PERSPECTIVES 10
3.1 Executive Authorities (Ministers and MECs) 113.2 Deputy Ministers 153.3 Special Advisors 163.4 Heads of Department 17
4. COMPARATIVE INTERNATIONAL EXPERIENCES IN ROLE CLARIFICATION 19
iv
ANNEXURE A: TEMPLATE ON THE AUDIT INTO THE PROGRESS WITH REGARD TO VACANCY RATES IN ALL NATIONAL AND PROVINCIAL DEPARTMENTS 37
ANNEXURE B: BREAKDOWN OF THE TOTAL NUMBER OF FUNDED VACANT POSTS REPORTED BY NATIONAL AND PROVINCIAL DEPARTMENTS, AND THE TOTAL NUMBER OF FUNDED VACANT POSTS REFLECTED ON PERSAL 39
List of Figures
Figure 1 Vacancy rate in the Public Service as at 31 August 2007Figure 2 Comparison of vacancy rates and actual expenditure on compensation of employees as a
percentage of the HR budget.Figure 3 Number of vacancies and vacancy rate per salary categoryFigure 4 Recruitment process as a percentage of the total number of vacancies reported by departmentsFigure 5 Average turnaround time taken to fill a postFigure 6 Factors impacting on the filling of postsFigure 7 Analysis of responses of national and provincial departments on whether they have strategies in
place to deal with the high vacancy rates
List of Tables
Table 1 Departments that failed to provide an input to the PSC by 25 September 2007Table 2 Summary of the total number of posts and funded vacant posts reflected on PERSAL and the total
number of funded vacant posts reported by national and provincial departments, as well as the percentage deviation between the information provided.
Table 3 Departments with the highest discrepanciesTable 4 Departments with the highest vacancy rates in accordance with PERSAL informationTable 5 Departments with the highest vacancy rates in accordance with departmental informationTable 6 Actual expenditure on the compensation of employees as a percentage of the main budget as at
31 August 2007Table 7 Examples of posts advertised which have, according to departments, not been job evaluated
List of Abbreviations
AsgiSA Accelerated and Shared Growth InitiativeEA Executing AuthorityDPSA Department of Public Service and AdministrationHoD Head of DepartmentJIPSA Joint Initiative on Priority Skills AcquisitionKZN KwaZulu-NatalMPSA Minister for the Public Service and AdministrationOPSC Office of the Public Service CommissionPERSAL Personnel and Salary Administration SystemPSC Public Service CommissionPSCBC Public Service Co-ordinating Bargaining CouncilSAPS South African Police ServiceSCOPA Standing Committee on Public AccountsSMS Senior Management Service
PROOF4.indd 4 08/11/2007 11:36:08

ii
CONTENTSPage
EXECUTIVE SUMMARY iii
1 INTRODUCTION 1
1.1 Background 11.2 Problem statement 11.3 Scope 21.4 Methodology 21.5 Limitations 3
2. RELATIONSHIPS AND BOUNDARY SETTING 4
2.1 Constitutional framework 42.2 Legal Framework and Codes 62.3 Operational Framework and Practice 8
3. CURRENT STATE AND PERSPECTIVES 10
3.1 Executive Authorities (Ministers and MECs) 113.2 Deputy Ministers 153.3 Special Advisors 163.4 Heads of Department 17
4. COMPARATIVE INTERNATIONAL EXPERIENCES IN ROLE CLARIFICATION 19
i
Public Service Commission
Guide on performance management forsocial development departments
Published in the Republic of South Africa by:
THE PUBLIC SERVICE COMMISSION (PSC)Commission House
Cnr. Hamilton & Ziervogel StreetsArcadia, 0083
Private Bag x121Pretoria, 0001
Tel. (012) 352-1000Fax (012) 325-8382
Website: www.opsc.gov.za
National Anti-Corruption Hotline Number: 0800 701 701 (Toll-Free)
Compiled by: Branch: Monitoring and Evaluation
Distribution by: Directorate: Communication and Information Services
ISBN: 0-621-37005-3RP: 10/2007
v
Executive Summary
1. INTRODUCTION
The Standing Committee on Public Accounts (SCOPA) in August 2007 requested the Public Service Commission (PSC) to brief it on the progress with regard to vacancy rates in all national and provincial departments.
In addition to promoting the values and principles in section 195 of the Constitution of the Republic of South Africa, 1996, the PSC has the mandate to conduct investigations in terms of section 196 (4)(f)(i) of the Constitution of the Republic of South Africa, 1996, as well as section 9 and 10 of the Public Service Act, 1997.
2. DATA ANALYSIS AND FINDINGS
The PSC obtained data on vacancies in the Public Service from departments and the Personnel and Salary Admin-istration System (PERSAL). In order to enhance data integrity, these two sets of data were compared with each other. The difference between the number of funded vacancies reported by national and provincial departments and those reflected on PERSAL was quite substantial. On enquiry with the Department of Public Service and Adminis-tration (DPSA), it was indicated that this anomaly is, amongst others, attributed to the fact that when departments update their organizational structures on PERSAL, abolished posts and other changes are not updated on PERSAL timeously. PERSAL also does not accurately reflect whether or not posts are funded. As a point of reference, all calculations in this report have been made on the basis that PERSAL reflects a total number of 1 433 401 funded posts in the Public Service.
2.1 TOTAL NUMBER OF FUNDED VACANCIES IN THE PUBLIC SERVICE
The national and provincial departments which responded to the audit indicated that as at 31 August 2007, they had 88 323 funded vacancies, whereas, according to PERSAL a total number of 330 987 funded vacancies existed on the same date. This presents a difference of 242 664 vacancies (73.3%) between the data provided by the depart-ments and PERSAL. It should, however, be taken into consideration that six departments did not provide informa-tion on funded vacancies, which could mean that the figure of 88 323 is higher.
2.2 DETERMINING THE VACANCY RATE IN THE PUBLIC SERVICE AS AT 1 AUGUST 2007
Due to the variance in the information provided by PERSAL and national and provincial departments, it is difficult to determine the exact vacancy rate in the Public Service. The vacancy rate has been determined following an analysis of the total number of posts at national and provincial level according to PERSAL, compared to the total number of vacancies on PERSAL and the total number of vacancies reported by departments. For ease of reference the discussion of these two vacancy rates have been broken down in the discussion that follows.
Vacancy rate according to information provided by PERSAL
The vacancy rate in the Public Service based on the total number of funded posts according to PERSAL (1 433 401) against the total number of vacancies reflected on PERSAL (330 987) is 23.1%. Overall national departments have
PROOF4.indd 5 08/11/2007 11:36:08
vi
the lowest vacancy rate at 15.6% and the Free State Province the highest at 30.7%. The vacancy rates of national departments (15.6%), the Western Cape (17.6%) and KwaZulu-Natal (21.6%) provinces are below the average vacancy rate of 23.1%.
Vacancy rate according to information provided by departments
A comparison of the total number of posts in the Public Service according to PERSAL (1 433 401) against the total number of funded vacancies reported by departments (88 323) shows a vacancy rate of 5.8%. The Western Cape (4.4%), Gauteng (5.5%), Limpopo (2.6%), Eastern Cape (2.5%), and Free State (3.6%) provinces have vacancy rates below the overall vacancy rate of 5.8%. Mpumalanga Province has the highest vacancy rate at 9%.
Variance of the information provided by the two data sources
Due to the variance (17.5%) of the information provided by the two sources of data, namely the vacancy rate based on PERSAL information (23.1%) and the vacancy rate based on information provided by national and provincial departments (5.8%), it is not possible to determine what the actual vacancy rate is in the Public Service. However, due to the inaccuracies in the information on PERSAL it can be stated with a reasonable measure of certainty that the probable vacancy rate in the Public Service is well below the average PERSAL vacancy rate of 23.1%.
2.3 COMPENSATION OF EMPLOYEES
As at 31 August 2007 the total budget on the compensation of employees (government wage bill) was R174,2 bil-lion and of this, an amount of R68,8 billion was spent by national and provincial departments on the compensation of employees. Thus, the average actual expenditure on compensation of employees as a percentage of R174,2 billion is 39.8%, with national departments at 38.8% and provinces at 39.9%. As at 31 August 2007, the spending norm was at 41.67%, resulting in an overall under spending of only 1.87%. The latter suggests that a large number of the vacant posts identified through the two sources of data are in actual fact not funded. It can therefore be concluded that the vacancy rate should be much lower than the vacancy rate according to PERSAL (23.1%, based on 330 987 vacancies) and the vacancy rate according to the information provided by departments (5.8%, based on 88 323 vacancies).
2.4 SALARY LEVELS OF FUNDED VACANT POSTS
Of the total of 88 323 vacant posts reported by departments, the highest number of vacancies is at salary levels 6 to 8 (33 667 vacancies), followed by salary levels 1 to 5 (32 735 vacancies). The vacancy rate on salary levels 13 to 16 [Senior Management Service (SMS)] is the highest at 14%, and second highest vacancy rate is at salary levels 9 to 12 at 9%. The high vacancy trends at these levels are cause for concern since these are the strategists who translate and implement policy respectively. The SMS and employees on salary levels 9 - 12 are also at the forefront of devising innovative programmes and interventions to enhance service delivery within their departments given their expertise and responsibilities.
2.5 PROGRESS REGARDING THE RECRUITMENT PROCESS
Departments have made some measure of progress to fill vacancies identified during the audit, as 46% (40 438) of vacant funded posts identified during the audit have been advertised, the selection process have commenced in respect of 28% (24 798) of the posts, and in respect of 6% (5 520) of the posts selection committees have made recommendations to the Executive Authority/delegated authority on the appointment of a suitable candidate.
PROOF4.indd 6 08/11/2007 11:36:09

i
Public Service Commission
Guide on performance management forsocial development departments
Published in the Republic of South Africa by:
THE PUBLIC SERVICE COMMISSION (PSC)Commission House
Cnr. Hamilton & Ziervogel StreetsArcadia, 0083
Private Bag x121Pretoria, 0001
Tel. (012) 352-1000Fax (012) 325-8382
Website: www.opsc.gov.za
National Anti-Corruption Hotline Number: 0800 701 701 (Toll-Free)
Compiled by: Branch: Monitoring and Evaluation
Distribution by: Directorate: Communication and Information Services
ISBN: 0-621-37005-3RP: 10/2007
vii
For ease of reference a separate discussion follows on each of the phases in the recruitment and selection process.
Job evaluation of posts on salary levels 9 and above
On salary levels 9 to 12 departments have yet to job evaluate 25% (4 084) of funded vacant posts and on salary levels 13 to 16 departments have yet to job evaluate 27% (469) of funded vacant posts.
Percentage of vacant funded posts advertised
46% of vacant funded posts have already been advertised by departments as at 31 August 2007 and the highest percentage of posts has been advertised on salary levels 9 to 12 (51%), whereas the lowest percentage of posts has been advertised on salary levels 1 to 5 (43%). Considering that the highest vacancy rate is at salary levels 13 to 16 (14%), it is disconcerting that only 46% of these posts have been advertised.
Bearing in mind that PSCBC Resolution 1 of 2007 determines that all current funded vacancies should be adver-tised within six months of the agreement, which was signed on 5 July 2007, departments will have to accelerate the advertising of posts if they want to advertise the remaining 54% of vacant posts before January 2008.
Percentage of funded vacant posts where the selection process has commenced
Departments have commenced with the selection process in respect of 28% (24 794) of vacant funded posts. At salary levels 1 to 5, departments have reported the highest percentage of instances (32%) in which the selection process has commenced whilst at salary levels 9 to 12 it is at its lowest at 23%. It is disconcerting to note that the highest vacancy rate is at salary levels 13 to 16 (14%), whilst departments have only commenced with the selection process in respect of 27% of vacant posts. However, the fact that in some instances the closing dates of advertised posts have not passed, influences the percentage of posts where the selection process has commenced.
Percentage of recommendations made to the executing authority/delegated authority
The selection committees have made recommendations to the Executing Authority or his/her delegate in 6% of the funded vacant posts as at 31 August 2007. This figure constitutes a total number of 5 520 posts in respect of which recommendations on the suitability of candidates following an interview have been made. The fact that a fairly small percentage of recommendations have been made in respect of salary levels 1 to 5 (4%), points to the fact that line managers below SMS, who are usually responsible for the recruitment and selection process of these employees, are less effective. Should all these recommendations be approved by the Executing Authority or his/her delegate it could bring the overall vacancy rate down by 0.4%. It should be taken into consideration that a percentage of these recommendations would affect serving public servants who have applied for higher posts. The appointments made to these funded vacant posts will therefore not necessarily have a positive effect on reducing the vacancy rate.
2.6 AVERAGE TURNAROUND TIME TAKEN FOR THE FILLING OF POSTS
The majority of departments (59.8%) indicated that the average turnaround time for the filling of posts is 2 to 3 months. This is substantially different from findings of research conducted by the DPSA1 which found that the average period that posts are vacant is just above 15 months. Yet again, as the information extracted from PERSAL has proven to be inaccurate, abolished posts still reflected as active vacant posts on PERSAL could have an impact on the turnaround time to fill posts. The longest turnaround time reported was by the Department of Economic
1 Public Management Watch. June 2007. Provincial and Sectoral Analysis: DPSA
PROOF4.indd 7 08/11/2007 11:36:09
viii
Development, Environment and Tourism in Limpopo Province, which indicated the turnaround time is between 6 to 18 months.
2.7 FACTORS IMPACTING ON THE FILLING OF POSTS
Scarce skills and the unavailability of selection committee members are the two top factors impacting on the filling of posts. 10 departments indicated that restructuring is an important factor impacting on the vacancy rate. The fact that these departments are in the process of restructuring could have had an impact on the substantial variation in the number of vacancies on PERSAL compared to the information provided by departments. Thirteen (13) depart-ments indicated that a high staff turnover and job hopping contributes to the vacancy rate in the Public Service. This is largely ascribed to inconsistencies in the grading of similar posts across the Public Service and the demand for certain skills or people with specific profiles. Seven (7) departments indicated that the vacancy rate is negatively affected by the fact that other departments retain staff by making higher counter offers. Recommended candidates therefore do not accept appointments to the advertised posts to which they had been appointed, but remain in their employing departments at a higher salary level.
2.8 STRATEGIES TO DEAL WITH THE HIGH VACANCY RATE IN DEPARTMENTS
72% of departments indicated that they have strategies in place to fill vacancies. In Mpumalanga Province, with the highest vacancy rate at 9%, 70% of departments have a strategy in place. Of concern is the fact that in the Northern Cape, where the vacancy rate is at 6.4%, of the 11 departments in the Northern Cape Province that responded to this question, only 2 indicated that they have a strategy in place. Also in KwaZulu-Natal Province, with a vacancy rate at 8.2%, 5 of the 12 departments indicated that they do not have a strategy in place.
3. RECOMMENDATIONS
3.1 ACCELERATING THE FILLING OF POSTS
All departments should design and implement specific strategies for the filling of vacant posts. They should prioritize areas where service delivery is compromised by high vacancy rates.
3.2 IMPROVE THE ACCURACY OF INFORMATION ON PERSAL
The PSC found large discrepancies between the information provided by departments and PERSAL regarding the number of funded vacancies. To address this challenge, it is recommended that:
• Depar tments should ensure that information regarding their establishment and vacancies on their establishment are captured properly and on time. Information should also be updated on PERSAL within 30 days once a post(s) becomes vacant. This will assist in ensuring that PERSAL operates as closely as possible to real-time information than is currently the case.
• Departments should ensure that PERSAL Controllers and those employees responsible for the input of data on PERSAL is adequately capacitated to perform this function.
• An assessment should be done by the DPSA and National Treasury in collaboration with departments on
PROOF4.indd 8 08/11/2007 11:36:09
i
Public Service Commission
Guide on performance management forsocial development departments
Published in the Republic of South Africa by:
THE PUBLIC SERVICE COMMISSION (PSC)Commission House
Cnr. Hamilton & Ziervogel StreetsArcadia, 0083
Private Bag x121Pretoria, 0001
Tel. (012) 352-1000Fax (012) 325-8382
Website: www.opsc.gov.za
National Anti-Corruption Hotline Number: 0800 701 701 (Toll-Free)
Compiled by: Branch: Monitoring and Evaluation
Distribution by: Directorate: Communication and Information Services
ISBN: 0-621-37005-3RP: 10/2007
ix
how best to provide usable, accurate and user friendly information and to improve PERSAL as a reliable management information tool.
• Departments should ensure that information on PERSAL is verified and corrected as a matter of urgency. This will assist greatly in improving the integrity of the information in its database. It will also enhance the confidence of its stakeholders who access such information on a day to day basis.
3.3 MONITOR IMPLEMENTATION AND COMPLIANCE WITH THE REGULATORY FRAMEWORK
HoDs should display strict adherence to the regulatory framework governing the recruitment and selection process. Departments should compile regular management reports on the filling of posts, challenges experienced and ways to ensure the availability of sufficient and competent staff for efficient service delivery. Departments are also encouraged to utilize the PSC’s Toolkit on Recruitment and Selection to improve the overall handling of the recruitment and selection process.
3.4 NEED FOR REPORTING ON THE ACTUAL EXPENDITURE ON COMPENSATION OF EMPLOYEES AGAINST FUNDED VACANCIES
It is recommended that departments put in place periodical reporting mechanisms for tracking actual expenditure on compensation against funded vacancies. This will assist departments to identify any changes in expenditure patterns between the latter variables and take appropriate action when the need arises.
3.5 MANAGING THE CHALLENGES IMPACTING ON THE FILLING OF POSTS
Scarce skills, unavailability of selection committee members, and salaries not being market related are the top three contenders impacting on the filling of posts. Departments have a responsibility to ensure that they handle the recruitment of scarce skills according to the relevant framework provided by the DPSA.
Although managers are immersed in operational issues and regard the filling of posts as an add-on responsibility, there should be tighter monitoring of how they manage their units, with closer scrutiny of the filling of vacancies. Similarly, Human Resource managers should also comply with specific standards in the recruitment and selection process. To assist this process, departments should develop an accountability matrix to specify clearly the roles and responsibilities of Line Managers and those of human resources managers.
A good practice which certain departments have already introduced, is an approach whereby interviews are conducted after hours and in some instances during weekends. This practice seeks to ensure that service delivery is prioritized.
3.6 TAKING RETENTION TO THE NEXT LEVEL
The system of open competition came into being with the promulgation of the new regulatory framework, which provided for the mandatory advertisement of all vacant posts. There is a direct relationship between the reten-tion of staff and job-hopping and the system of open competition, since employees have many opportunities to move between departments to higher posts and negotiate higher salaries on the basis of offers made by other
PROOF4.indd 9 08/11/2007 11:36:09
x
ii
CONTENTSPage
EXECUTIVE SUMMARY iii
1 INTRODUCTION 1
1.1 Background 11.2 Problem statement 11.3 Scope 21.4 Methodology 21.5 Limitations 3
2. RELATIONSHIPS AND BOUNDARY SETTING 4
2.1 Constitutional framework 42.2 Legal Framework and Codes 62.3 Operational Framework and Practice 8
3. CURRENT STATE AND PERSPECTIVES 10
3.1 Executive Authorities (Ministers and MECs) 113.2 Deputy Ministers 153.3 Special Advisors 163.4 Heads of Department 17
4. COMPARATIVE INTERNATIONAL EXPERIENCES IN ROLE CLARIFICATION 19
departments. In order to sensitize and guide departments about staff retention, the DPSA has published an infor-mation guide on managing the retention of employees. Departments should use this guide to develop retention strategies in an attempt to retain staff and to curb job hopping.
It is doubtful whether this is enough. For this reason, the DPSA should consider mechanisms that provides for career pathing opportunities based on competencies, experience and completion of compulsory training. Although such a process might protract the turnaround time for the filling of posts this is offset by the fact that it will curb the high turnover and job hopping to some extent.
4. CONCLUSION
Although this report identifies several limitations with respect to the accuracy of the data used, it brings to the fore some critical issues around the filling of posts in the Public Service. It shows that the provinces have high vacancy rates, but that they do not have specific strategies in place to effectively deal with the challenges that they face in the filling of posts. The report also reflects that although departments are able to report on their funded vacancies, there is no correlation between number of vacancies and the overall spending rate on the compensation of employees, as the spending rate is almost on par with the expected spending norm as at 31 August 2007. It is clear from the audit that departments need to put in place monitoring and reporting mechanisms to effectively report on and manage their vacancies. More significantly this audit highlights issues of non-compliance with regulatory requirements relating to the filling of posts, which invariably also impact negatively on the promotion of sound labour relations. Various recommendations have been made in this report in an attempt to address the shortcomings identified during the audit.
There is no doubt that the capacity of the Public Service to improve its delivery of services remains central in government’s efforts to provide a better life for all South Africans. However, if departments fail to or unnecessarily delay the filling of vacant posts, this denies the citizenry the promised better life. Therefore, as a starting point, departments need to respond with urgency to the filling of vacant posts and ensure that service delivery and the necessary capacity to make it possible is available so that they can realize the service delivery mandate of government.
PROOF4.indd 10 08/11/2007 11:36:10

ii
CONTENTSPage
EXECUTIVE SUMMARY iii
1 INTRODUCTION 1
1.1 Background 11.2 Problem statement 11.3 Scope 21.4 Methodology 21.5 Limitations 3
2. RELATIONSHIPS AND BOUNDARY SETTING 4
2.1 Constitutional framework 42.2 Legal Framework and Codes 62.3 Operational Framework and Practice 8
3. CURRENT STATE AND PERSPECTIVES 10
3.1 Executive Authorities (Ministers and MECs) 113.2 Deputy Ministers 153.3 Special Advisors 163.4 Heads of Department 17
4. COMPARATIVE INTERNATIONAL EXPERIENCES IN ROLE CLARIFICATION 19
1
Ch
ap
ter
1
Introduction
PROOF4.indd 1 08/11/2007 11:36:10
2
CHAPTER 1: INTRODUCTION
1.1 INTRODUCTION
The issue of the capacity of the Public Service to improve as well as accelerate the rate at which it is delivering services to the country’s citizens has come under the spotlight in the recent years. This has been influenced by, inter alia, the fact that the citizens are increasingly becoming impatient with having to wait for services that sometimes take longer to be delivered and even when delivered, at times fall short of the citizen’s expectations.
The vacancy rate in departments has proven to be one of the biggest challenges that are central to the problem of service delivery both within national and provincial departments. Linked to this challenge to deliver is the slow rate at which departments are able to fill posts. In relation to the above, there is a commonly held view that the higher the number of vacancies in a department, the bigger the department’s challenge to deliver on Government’s service delivery mandate. As a result, some departments have either resorted to or have been forced to rely heavily on the services of consultants to make up for the capacity gap. This approach can be fairly costly and such over reliance does not actually have a sustaining effect in filling capacity gaps within a department.
Also worth noting is the extent to which the Auditor-General has in the past financial years often pointed to the failure or neglect by departments to address the filling of vacancies2. It has been indicated that some departments took too long to fill posts and thereby exhibited high vacancy rates and under spending in terms of their human resource budgets. Despite such findings, in certain departments this trend has continued. There could be various reasons advanced by departments for the latter state of affairs. However, one thing remains certain, that service delivery is badly affected by the slow rate at which the Public Service is filling vacancies.
Linked to the above is the tendency by some departments to perpetuate “acting positions” in favour of the filling of vacancies. Departments in some instances end up using these funds as savings for expenses other than human resources. In such instances, the pressure certainly becomes too much to bear for the few employees who have to keep the department “functional”. Ultimately it could lead to multiple tasking, fatigue and work-related stress.
Within the context of some of the challenges reflected above and particularly the Auditor-General’s reports, the Standing Committee on Public Accounts (SCOPA) requested the Public Service Commission (PSC) to brief it on the progress with regard to vacancy rates in all national and provincial departments.
1.2 THE PSC’S LEGISLATIVE MANDATE
Section 196 of the Constitution of the Republic of South Africa, 1996, empowers the PSC to promote the values and principles provided for in section 195 which, amongst others, provide that –
• resources must be used efficiently, economically and effectively;
• people’s needs must be responded to and the public must be encouraged to participate in policy-making; and
• in order to maximize human potential good human resource management and career-development practices must be cultivated.
2 Republic of South Afr ica: Minutes of the Meeting of the SCOPA held on Tuesday, 31 October 2006 in the Main Chamber, Legislature Complex at 13:00
PROOF4.indd 2 08/11/2007 11:36:10

i
Public Service Commission
Guide on performance management forsocial development departments
Published in the Republic of South Africa by:
THE PUBLIC SERVICE COMMISSION (PSC)Commission House
Cnr. Hamilton & Ziervogel StreetsArcadia, 0083
Private Bag x121Pretoria, 0001
Tel. (012) 352-1000Fax (012) 325-8382
Website: www.opsc.gov.za
National Anti-Corruption Hotline Number: 0800 701 701 (Toll-Free)
Compiled by: Branch: Monitoring and Evaluation
Distribution by: Directorate: Communication and Information Services
ISBN: 0-621-37005-3RP: 10/2007
3
In addition to promoting the above values and principles, the PSC has the mandate to conduct investigations in terms of section 196 (4)(f)(i) of the Constitution of the Republic of South Africa, 1996, as well as section 9 and 10 of the Public Service Act, 1997.
This report meets the constitutional responsibilities of the PSC in that it promotes the above-mentioned values and principles.
1.3 OBJECTIVES OF THE REPORT
In accordance with the request from SCOPA, the audit aimed to establish the following:
(a) The total number of funded vacant posts in the Public Service. (b) The vacancy rate in the Public Service as at 31 August 2007.
(c) Progress with the recruitment and selection process in respect of vacant funded posts.
(d) The average turnaround time taken for the filling of posts.
(e) Factors impacting on the filling of posts.
(f) Strategies to deal with the vacancy rates in departments.
1.4 SCOPE OF THE AUDIT
The investigation covered all national and provincial departments in the Public Service.
1.5 METHODOLOGY
In a letter dated 16 August 2007, the PSC received a request from SCOPA for a briefing on the “Progress with regard to vacancy rates at Government Departments” to be held on 29 August 2007. Given the fact that the PSC had not done any holistic research in this area, and the demands of its existing work plan, the PSC requested that the briefing takes place towards the end of October 2007.
In light of the limited time frame within which the audit had to be executed as well as taking into account the need to ensure the effective and efficient utilization of the PSC’s resources, the audit team applied the following methodology:
• A circular dated 5 September 2007 was sent to all national and provincial depar tments informing them that the PSC is embarking upon an audit on the progress with regard to vacancy rates in all national and provincial departments. Heads of Department (HoDs) were advised of the nature, scope and the time frame of the audit, and requested to provide information regarding funded vacancies on a template (attached as Annexure A) which contained the questions to which departments had to respond. Some departments did not respond within the time frame given by the PSC and reminders were directed to those departments.
• A request was made to the administrators of the Personnel and Salary Administration System (PERSAL) for the provision of information in relation to the vacancy rate in national and provincial departments.
PROOF4.indd 3 08/11/2007 11:36:10

4
The same information requested from departments was also requested from PERSAL in order to draw comparisons.
• As the PSC was aware that the Depar tment of Public Ser vice and Administration (DPSA) wasconducting research on resources in the public sector from 2002 to 2007, a request was made to the DPSA for the provision of relevant information. The DPSA also provided the PSC with information they had obtained from National Treasury on the compensation of employees as at 31 August 2007 3 .
• Information obtained from both PERSAL and national and provincial departments was collated and analyzed. In instances where certain information was unclear or not provided from either PERSAL or the national and provincial departments, follow-up was made via telephone to request the provision of outstanding information.
1.6 LIMITATIONS EXPERIENCED
• The request from SCOPA for a briefing by 29 August 2007 placed immense pressure on the PSC to carry out the audit within a short space of time. Even though the PSC agreed to hold the briefing towards the end of October 2007, departments had limited time within which to submit the required information, as they were requested to provide inputs by not later than 25 September 2007. This impacted on the quality of the information provided and also resulted in some departments not providing information in the required format.
• By 25 September 2007 the departments mentioned in Table 1 below failed to provide a response to the PSC:
Table 1: Departments that failed to provide an input to the PSC by 25 September 2007
National/Province Department
Gauteng Gauteng Shared Services Centre
KZN Arts, Culture & Tourism
National Communications
Labour
National Prosecuting Authority
Secretariat for Safety and Security
• Some depar tments indicated that they were not able to provide accurate information within the time frame, or were in the process of restructuring, which impacted on the figures provided. The fact that departments are in the process of restructuring also impacted negatively on the PERSAL data, as not all abolished posts have been removed from PERSAL. This contributed to the large variance between the data from PERSAL and the data provided by departments.
3 Republic of South Afr ica. National Treasur y. In-year Management, Monitoring and Reporting System
PROOF4.indd 4 08/11/2007 11:36:10

i
Public Service Commission
Guide on performance management forsocial development departments
Published in the Republic of South Africa by:
THE PUBLIC SERVICE COMMISSION (PSC)Commission House
Cnr. Hamilton & Ziervogel StreetsArcadia, 0083
Private Bag x121Pretoria, 0001
Tel. (012) 352-1000Fax (012) 325-8382
Website: www.opsc.gov.za
National Anti-Corruption Hotline Number: 0800 701 701 (Toll-Free)
Compiled by: Branch: Monitoring and Evaluation
Distribution by: Directorate: Communication and Information Services
ISBN: 0-621-37005-3RP: 10/2007
5
• On average, the circular took between 7 days and 2 weeks before it was forwarded from the HoD’s office to the contact person, thereby leading to requests for the extension of the set deadline and at times the late submission of information.
• Not all departments had the same understanding of the information template and this led to varying responses to the same issue. As a result, some departments had to be requested to provide a second response to one or two of the questions.
• Some departments were also unable to indicate within the time frame for responses the percentage of personnel expenditure as at 31 August 2007, and others provided a breakdown of the budget per salary level, instead of the percentage of personnel expenditure.
• At the time of the audit, all departments had not yet issued their annual reports for the 2006/2007 financial year. The PSC was therefore unable to use the human resources management information contained in annual reports as a benchmark to determine the progress made by departments on the filling of vacancies.
Despite the limitations, the PSC believes that it has provided a report that allows for solid engagement on vacancy rates within the Public Service.
1.7 OUTLINE OF THE REPORT
This Chapter provided the introduction to the audit, the PSC’s legislative mandate and the objectives, scope and limitations of the audit. Chapter 2 provides a brief outline of the regulatory framework relevant to the post establishment and the filling of vacancies. This is followed by Chapter 3, which provides for a statistical overview of the information provided by national and provincial departments and PERSAL, as well as an analysis and findings on these statistics. Chapter 4 contains the recommendations emanating from the findings made in the previous Chapter and is aimed at assisting the Public Service in dealing with the vacancy rates. The final Chapter of the report provides concluding remarks regarding the audit.
PROOF4.indd 5 08/11/2007 11:36:11

ii
CONTENTSPage
EXECUTIVE SUMMARYiii
1 INTRODUCTION1
1.1Background11.2Problem statement11.3Scope21.4Methodology21.5Limitations3
2.RELATIONSHIPS AND BOUNDARY SETTING4
2.1Constitutional framework42.2Legal Framework and Codes62.3Operational Framework and Practice8
3.CURRENT STATE AND PERSPECTIVES10
3.1Executive Authorities (Ministers and MECs)113.2Deputy Ministers153.3Special Advisors163.4Heads of Department17
4.COMPARATIVE INTERNATIONAL EXPERIENCES IN ROLE CLARIFICATION19
6
ii
CONTENTSPage
EXECUTIVE SUMMARY iii
1 INTRODUCTION 1
1.1 Background 11.2 Problem statement 11.3 Scope 21.4 Methodology 21.5 Limitations 3
2. RELATIONSHIPS AND BOUNDARY SETTING 4
2.1 Constitutional framework 42.2 Legal Framework and Codes 62.3 Operational Framework and Practice 8
3. CURRENT STATE AND PERSPECTIVES 10
3.1 Executive Authorities (Ministers and MECs) 113.2 Deputy Ministers 153.3 Special Advisors 163.4 Heads of Department 17
4. COMPARATIVE INTERNATIONAL EXPERIENCES IN ROLE CLARIFICATION 19
PROOF4.indd 6 08/11/2007 11:36:11
ii
CONTENTSPage
EXECUTIVE SUMMARYiii
1 INTRODUCTION1
1.1Background11.2Problem statement11.3Scope21.4Methodology21.5Limitations3
2.RELATIONSHIPS AND BOUNDARY SETTING4
2.1Constitutional framework42.2Legal Framework and Codes62.3Operational Framework and Practice8
3.CURRENT STATE AND PERSPECTIVES10
3.1Executive Authorities (Ministers and MECs)113.2Deputy Ministers153.3Special Advisors163.4Heads of Department17
4.COMPARATIVE INTERNATIONAL EXPERIENCES IN ROLE CLARIFICATION19
ii
CONTENTSPage
EXECUTIVE SUMMARY iii
1 INTRODUCTION 1
1.1 Background 11.2 Problem statement 11.3 Scope 21.4 Methodology 21.5 Limitations 3
2. RELATIONSHIPS AND BOUNDARY SETTING 4
2.1 Constitutional framework 42.2 Legal Framework and Codes 62.3 Operational Framework and Practice 8
3. CURRENT STATE AND PERSPECTIVES 10
3.1 Executive Authorities (Ministers and MECs) 113.2 Deputy Ministers 153.3 Special Advisors 163.4 Heads of Department 17
4. COMPARATIVE INTERNATIONAL EXPERIENCES IN ROLE CLARIFICATION 19
7
Ch
ap
ter
2
Review of Applicable Prescripts
PROOF4.indd 7 08/11/2007 11:36:11
8
CHAPTER 2: REVIEW OF APPLICABLE PRESCRIPTS
2.1 INTRODUCTION
A synopsis of the most relevant prescripts applicable to the management of vacancies in the Public Service is provided in this Chapter.
The regulatory framework relevant to the post establishment and the filling of vacancies in the Public Service is contained in various pieces of legislation, of which the Constitution of the Republic of South Africa, 19964, provides the guiding principles. Specific Acts of Parliament, as well as subordinate legislation, also guides these matters. These are accordingly discussed.
2.2 CONSTITUTION OF THE REPUBLIC OF SOUTH AFRICA, 1996
Section 195(1)(h) and (i) of the Constitution of the Republic of South Africa, 19965, determines that public administration must be governed by the democratic values and principles enshrined in the Constitution, including the following principles:
“(h) Good human-resource management and career-development practices, to maximize human potential, must be cultivated.”
“(i) Public administration must be broadly representative of the South African people, with employment and personnel management practices based on ability, objectivity, fairness, and the need to redress the imbalances of the past to achieve broad representation.”
2.3 PUBLIC SERVICE ACT, 1994
Section 3(5)(b) and (c) of the Public Service Act, 19946, also stipulates that an executing authority shall have powers and duties regarding the–
• post establishment of that office or department, including the creation, grading and abolition of posts and the provision for the employment of persons additional to the fixed establishment where the class of work is of a temporary nature; and
• recruitment and appointment of employees.
In terms of section 7(3)(b) of the Public Service Act, 1994, HoDs are responsible for the efficient management and administration of departments, including the effective utilization of staff.
2.4 PUBLIC FINANCE MANAGEMENT ACT, 1999
Section 36(2)(b) of the Public Finance Management Act (PFMA), 19997, stipulates that the HoD is the Accounting Officer for a department. One of the responsibilities of the accounting officer, as specified by section 38(1)(b) of
4 Republic of South Afr ica. The Constitution of the Republic of South Afr ica. Act 108 of 1996. 5 Republic of South Afr ica. The Constitution of the Republic of South Afr ica. Act 108 of 1996. 6 Republic of South Afr ica. Public Ser vice Act. Act 103 if 1994. 7 Republic of South Afr ica. The Public Finance Management Act. Act 1 of 1999.
PROOF4.indd 8 08/11/2007 11:36:11

i
Public Service Commission
Guide on performance management forsocial development departments
Published in the Republic of South Africa by:
THE PUBLIC SERVICE COMMISSION (PSC)Commission House
Cnr. Hamilton & Ziervogel StreetsArcadia, 0083
Private Bag x121Pretoria, 0001
Tel. (012) 352-1000Fax (012) 325-8382
Website: www.opsc.gov.za
National Anti-Corruption Hotline Number: 0800 701 701 (Toll-Free)
Compiled by: Branch: Monitoring and Evaluation
Distribution by: Directorate: Communication and Information Services
ISBN: 0-621-37005-3RP: 10/2007
9
the PFMA, is that he/she “is responsible for the effective, efficient, economical and transparent use of the resources of the department”.
2.5 PUBLIC SERVICE REGULATIONS, 2001
In order to give effect to the Constitutional principles, the Public Service Regulation (PSR) Chapter 18, determines as follows:
2.5.1 STRATEGIC PLANNING
PSR Chapter 1, B.2 determines that based on the strategic plan of the department, an executing authority shall-
(a) determine, after consultation with the Minister of Public Service and Administration (MPSA), the department’s organizational structure in terms of its core and support functions;
(b) define the posts necessary to perform the relevant functions while remaining within the current budget and medium-term expenditure framework of the department, and the posts so defined shall constitute the department’s approved establishment;
(c) grade proposed new jobs according to the job evaluation system referred to in Part IV; and
(d) engage in the human resource planning in accordance with regulation III D with a view to meeting the resulting human resource needs.
PSR Chapter 1, B.2A9, which came into effect on 1 April 2006, stipulates that directives issued in terms of section 3(3)(e) of the Act, shall specify which determinations on the organizational structure of the department, shall be subject to consultation with the MPSA. For purpose of such consultation, the information to be supplied shall be set out in such directive.
2.5.2 HUMAN RESOURCE PLANNING
PSR Chapter 1.D.1 stipulates that an executing authority shall -
• assess the human resources necessary to perform her or his department’s functions, with particular reference to the number of employees required; and
• plan within the available budgeted funds, including funds for the remaining period of the relevant medium- term expenditure framework, for the recruitment, retention, deployment and development of human resources according to the department’s requirements determined in terms of regulation III D.1(a).
2.5.3 CREATION AND FILLING OF POSTS
PSR Chapter 1.F determines that before creating a post for any newly defined job, or filling any vacancy, an executing authority shall-
8 Republic of South Afr ica. Public Ser vice Regulations. Government Notice No. R. 1 of 5 Januar y 2001 9 Republic of South Africa. Public Service Regulation B.2 as amended by Government Notice No. R. 412 of 8 April 2006 with effect from 1 July 2006.
PROOF4.indd 9 08/11/2007 11:36:12
10
ii
CONTENTSPage
EXECUTIVE SUMMARY iii
1 INTRODUCTION 1
1.1 Background 11.2 Problem statement 11.3 Scope 21.4 Methodology 21.5 Limitations 3
2. RELATIONSHIPS AND BOUNDARY SETTING 4
2.1 Constitutional framework 42.2 Legal Framework and Codes 62.3 Operational Framework and Practice 8
3. CURRENT STATE AND PERSPECTIVES 10
3.1 Executive Authorities (Ministers and MECs) 113.2 Deputy Ministers 153.3 Special Advisors 163.4 Heads of Department 17
4. COMPARATIVE INTERNATIONAL EXPERIENCES IN ROLE CLARIFICATION 19
(a) confirm that she or he requires the post to meet the department’s objectives;
(b)10 in the case of a newly defined job, evaluate the job in terms of the job evaluation system;
(c) in the case of a vacant post on grade 9 or higher, evaluate the job unless the specific job has been evaluated previously; and
(d) ensure that sufficient budgeted funds, including funds for the remaining period of the medium-term expenditure framework, are available for filling the post.
2.5.4 ADDITIONAL EMPLOYMENT
PSR Chapter 1.G determines that an executing authority may, within the relevant budget, employ persons additional to the approved establishment where-
(a) the incumbent of a post is expected to be absent for such a period that her or his duties cannot be performed by other personnel; or
(b) a temporary increase in work occurs; or
(c) it is necessary for any other reason to temporarily increase the staff of the department.
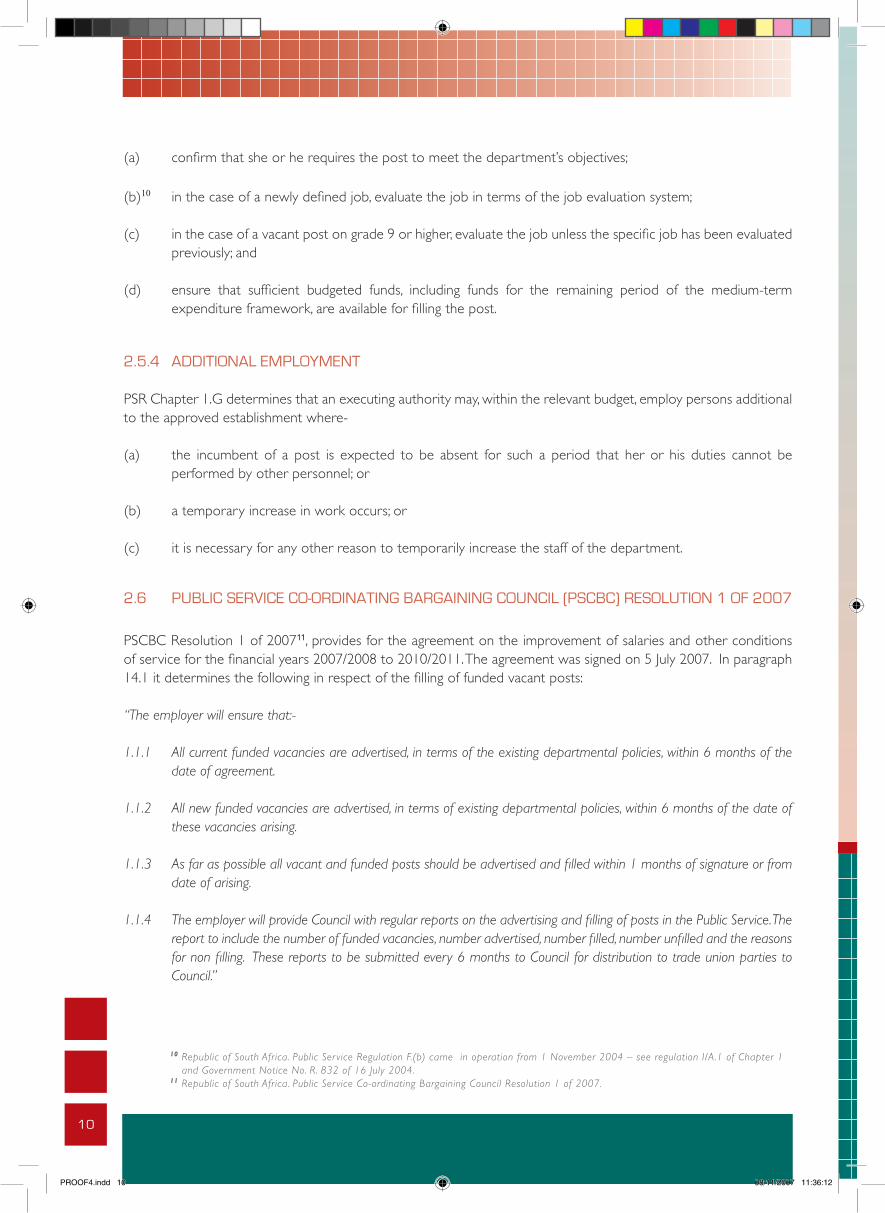
2.6 PUBLIC SERVICE CO-ORDINATING BARGAINING COUNCIL (PSCBC) RESOLUTION 1 OF 2007
PSCBC Resolution 1 of 200711, provides for the agreement on the improvement of salaries and other conditions of service for the financial years 2007/2008 to 2010/2011. The agreement was signed on 5 July 2007. In paragraph 14.1 it determines the following in respect of the filling of funded vacant posts:
“The employer will ensure that:-
1.1.1 All current funded vacancies are advertised, in terms of the existing departmental policies, within 6 months of the date of agreement.
1.1.2 All new funded vacancies are advertised, in terms of existing departmental policies, within 6 months of the date of these vacancies arising.
1.1.3 As far as possible all vacant and funded posts should be advertised and filled within 1 months of signature or from date of arising.
1.1.4 The employer will provide Council with regular reports on the advertising and filling of posts in the Public Service. The report to include the number of funded vacancies, number advertised, number filled, number unfilled and the reasons for non filling. These reports to be submitted every 6 months to Council for distribution to trade union parties to Council.”
10 Republic of South Afr ica. Public Ser vice Regulation F.(b) came in operation from 1 November 2004 – see regulation I/A.1 of Chapter 1 and Government Notice No. R. 832 of 16 July 2004. 11 Republic of South Afr ica. Public Ser vice Co-ordinating Bargaining Council Resolution 1 of 2007.
PROOF4.indd 10 08/11/2007 11:36:12

ii
CONTENTSPage
EXECUTIVE SUMMARY iii
1 INTRODUCTION 1
1.1 Background 11.2 Problem statement 11.3 Scope 21.4 Methodology 21.5 Limitations 3
2. RELATIONSHIPS AND BOUNDARY SETTING 4
2.1 Constitutional framework 42.2 Legal Framework and Codes 62.3 Operational Framework and Practice 8
3. CURRENT STATE AND PERSPECTIVES 10
3.1 Executive Authorities (Ministers and MECs) 113.2 Deputy Ministers 153.3 Special Advisors 163.4 Heads of Department 17
4. COMPARATIVE INTERNATIONAL EXPERIENCES IN ROLE CLARIFICATION 19
11
Ch
ap
ter
3
Data Analysis and Findings
PROOF4.indd 11 08/11/2007 11:36:12
12
CHAPTER 3: DATA ANALYSIS AND FINDINGS
3.1 INTRODUCTION
The PSC obtained data on vacancies in the Public Service from departments and PERSAL. In order to enhance data integrity, these two sets of data were compared with each other. The difference between the number of funded vacancies reported by national and provincial departments and those reflected on PERSAL was quite substantial. On enquiry with the DPSA it was indicated that this anomaly is, amongst others, attributed to the fact that when departments update their organization structures on PERSAL, abolished posts and other changes are not updated on PERSAL timeously. PERSAL also does not accurately reflect whether or not posts are funded.
The statistical overview provided below will for the sake of completeness reflect the information provided by provincial and national departments and PERSAL. As a point of reference, all calculations in this report have been made on the basis that PERSAL reflects a total number of 1 433 401 funded posts in the Public Service.
3.2 TOTAL NUMBER OF FUNDED VACANCIES IN THE PUBLIC SERVICE
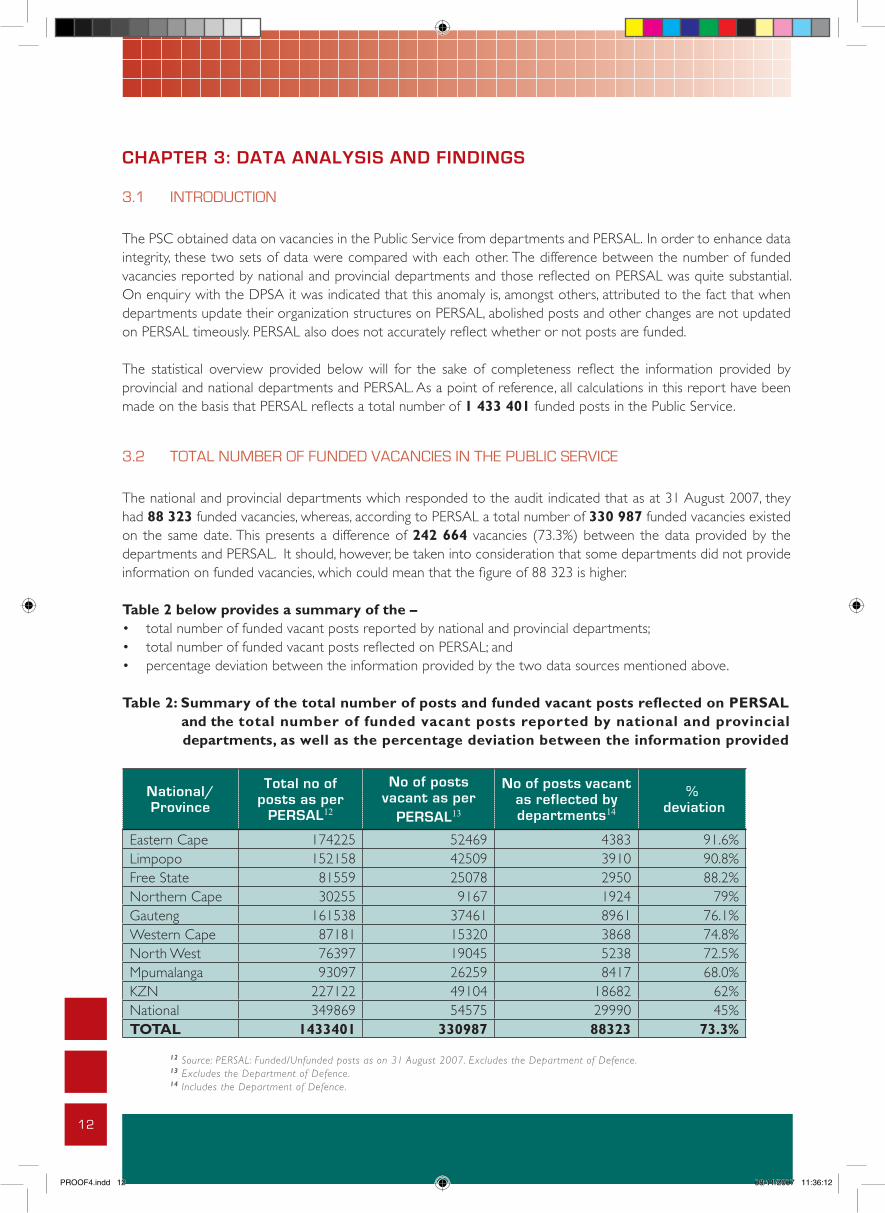
The national and provincial departments which responded to the audit indicated that as at 31 August 2007, they had 88 323 funded vacancies, whereas, according to PERSAL a total number of 330 987 funded vacancies existed on the same date. This presents a difference of 242 664 vacancies (73.3%) between the data provided by the departments and PERSAL. It should, however, be taken into consideration that some departments did not provide information on funded vacancies, which could mean that the figure of 88 323 is higher.
Table 2 below provides a summary of the –• total number of funded vacant posts reported by national and provincial departments;• total number of funded vacant posts reflected on PERSAL; and• percentage deviation between the information provided by the two data sources mentioned above.
Table 2: Summary of the total number of posts and funded vacant posts reflected on PERSAL and the total number of funded vacant posts reported by national and provincial
departments, as well as the percentage deviation between the information provided
National/Province
Total no of posts as per
PERSAL12
No of posts vacant as per
PERSAL13
No of posts vacant as reflected by departments14
% deviation
Eastern Cape 174225 52469 4383 91.6%Limpopo 152158 42509 3910 90.8%Free State 81559 25078 2950 88.2%Northern Cape 30255 9167 1924 79%Gauteng 161538 37461 8961 76.1%Western Cape 87181 15320 3868 74.8%North West 76397 19045 5238 72.5%Mpumalanga 93097 26259 8417 68.0%KZN 227122 49104 18682 62%National 349869 54575 29990 45%TOTAL 1433401 330987 88323 73.3%
12 Source: PERSAL: Funded/Unfunded posts as on 31 August 2007. Excludes the Department of Defence. 13 Excludes the Department of Defence. 14 Includes the Department of Defence.
PROOF4.indd 12 08/11/2007 11:36:12
i
Public Service Commission
Guide on performance management forsocial development departments
Published in the Republic of South Africa by:
THE PUBLIC SERVICE COMMISSION (PSC)Commission House
Cnr. Hamilton & Ziervogel StreetsArcadia, 0083
Private Bag x121Pretoria, 0001
Tel. (012) 352-1000Fax (012) 325-8382
Website: www.opsc.gov.za
National Anti-Corruption Hotline Number: 0800 701 701 (Toll-Free)
Compiled by: Branch: Monitoring and Evaluation
Distribution by: Directorate: Communication and Information Services
ISBN: 0-621-37005-3RP: 10/2007
13
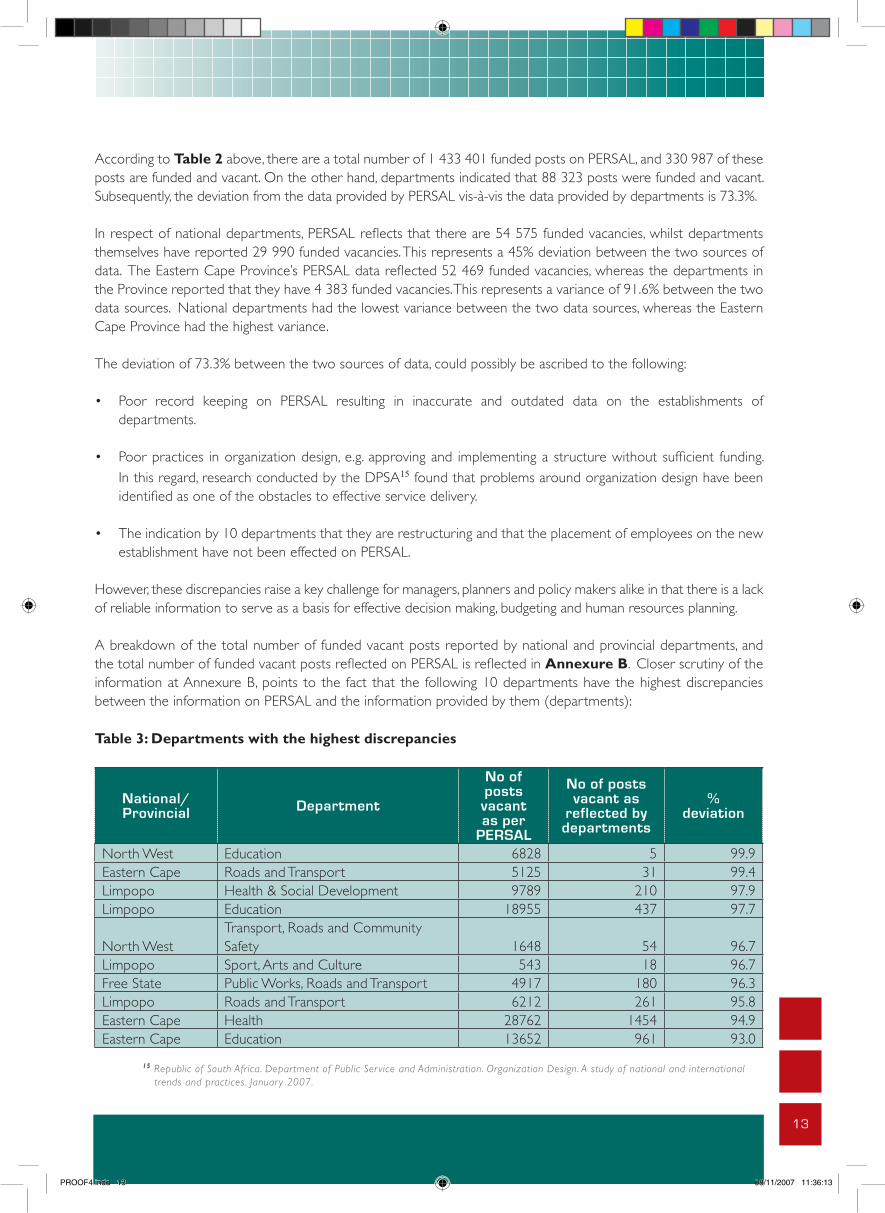
According to Table 2 above, there are a total number of 1 433 401 funded posts on PERSAL, and 330 987 of these posts are funded and vacant. On the other hand, departments indicated that 88 323 posts were funded and vacant. Subsequently, the deviation from the data provided by PERSAL vis-à-vis the data provided by departments is 73.3%.
In respect of national departments, PERSAL reflects that there are 54 575 funded vacancies, whilst departments themselves have reported 29 990 funded vacancies. This represents a 45% deviation between the two sources of data. The Eastern Cape Province’s PERSAL data reflected 52 469 funded vacancies, whereas the departments in the Province reported that they have 4 383 funded vacancies. This represents a variance of 91.6% between the two data sources. National departments had the lowest variance between the two data sources, whereas the Eastern Cape Province had the highest variance.
The deviation of 73.3% between the two sources of data, could possibly be ascribed to the following:
• Poor record keeping on PERSAL resulting in inaccurate and outdated data on the establishments of departments.
• Poor practices in organization design, e.g. approving and implementing a structure without sufficient funding. In this regard, research conducted by the DPSA15 found that problems around organization design have been identified as one of the obstacles to effective service delivery.
• The indication by 10 departments that they are restructuring and that the placement of employees on the new establishment have not been effected on PERSAL.
However, these discrepancies raise a key challenge for managers, planners and policy makers alike in that there is a lack of reliable information to serve as a basis for effective decision making, budgeting and human resources planning.
A breakdown of the total number of funded vacant posts reported by national and provincial departments, and the total number of funded vacant posts reflected on PERSAL is reflected in Annexure B. Closer scrutiny of the information at Annexure B, points to the fact that the following 10 departments have the highest discrepancies between the information on PERSAL and the information provided by them (departments):
Table 3: Departments with the highest discrepancies
National/Provincial Department
No of posts vacant as per
PERSAL
No of posts vacant as
reflected by departments
%deviation
North West Education 6828 5 99.9Eastern Cape Roads and Transport 5125 31 99.4Limpopo Health & Social Development 9789 210 97.9Limpopo Education 18955 437 97.7
North WestTransport, Roads and Community Safety 1648 54 96.7
Limpopo Sport, Arts and Culture 543 18 96.7Free State Public Works, Roads and Transport 4917 180 96.3Limpopo Roads and Transport 6212 261 95.8Eastern Cape Health 28762 1454 94.9Eastern Cape Education 13652 961 93.0
15 Republic of South Afr ica. Department of Public Ser vice and Administration. Organization Design. A study of national and international trends and practices. Januar y 2007.
PROOF4.indd 13 08/11/2007 11:36:13
14
In the case of the North West Department of Education, it was indicated that they have 2 309 unfunded vacancies and only 5 funded vacancies. It would therefore appear that the latter Department’s post establishment information on PERSAL is not accurately updated. The same might apply to the other departments mentioned in Table 3 (previous page), in that they have not updated PERSAL by indicating whether vacancies are funded or alternatively they have not updated their post establishment on PERSAL.
Table 3 also shows that three departments of Education and two departments of Health in the provinces are amongst the departments with the highest discrepancies between PERSAL and departmental information. This points the fact that the departments with the highest numbers of posts are unable to manage their establishment on PERSAL effectively.
3.3 DETERMINING THE VACANCY RATE IN THE PUBLIC SERVICE AS AT 1 AUGUST 2007
Due to the variance in the information provided by PERSAL and national and provincial departments as reflected in Table 2 above, it is difficult to determine the exact vacancy rate in the Public Service. Hence, in the discussion below, reference is made to two different vacancy rates emanating from two sets of data, that is, one determined according to information from PERSAL and the other on information provided by national and provincial departments. In the latter instance, it should therefore be taken into consideration that not all departments (137 out of 143) provided information to the PSC.
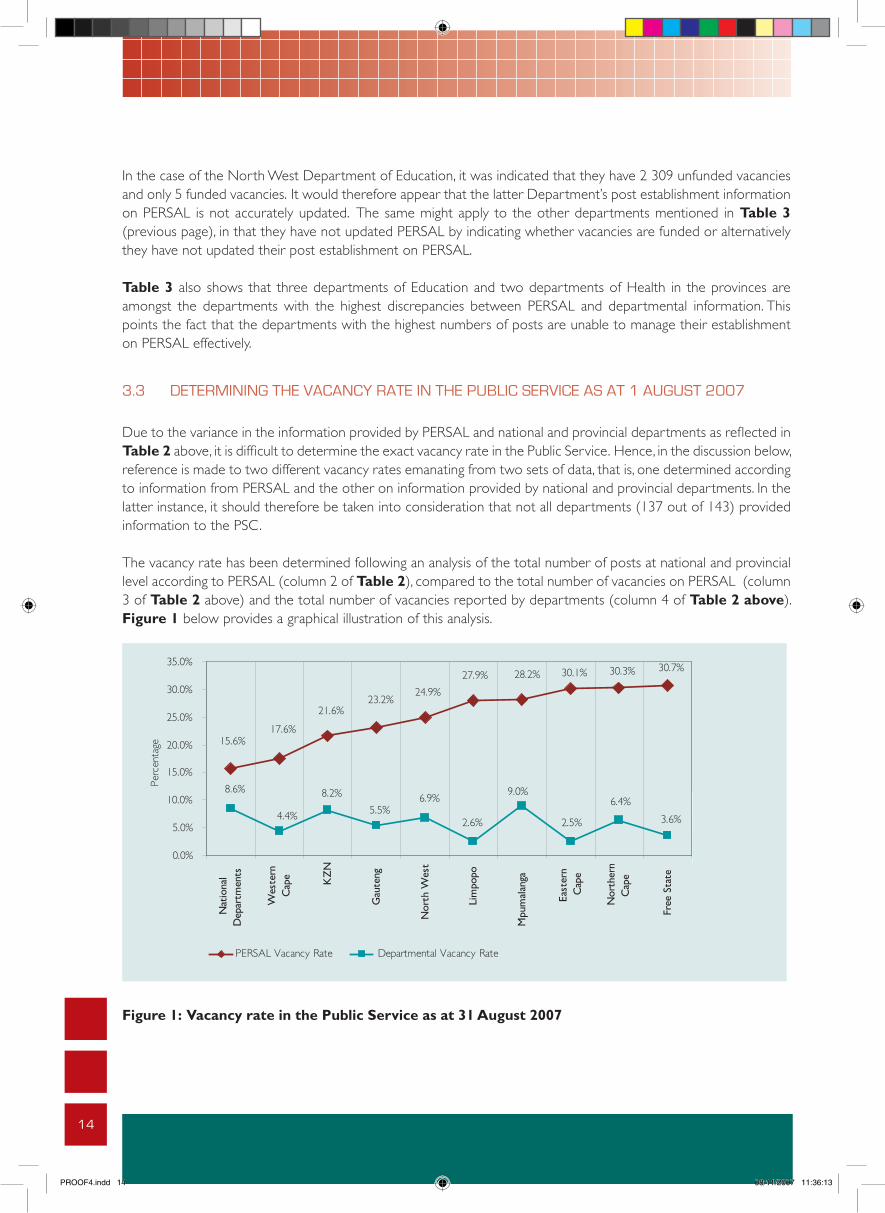
The vacancy rate has been determined following an analysis of the total number of posts at national and provincial level according to PERSAL (column 2 of Table 2), compared to the total number of vacancies on PERSAL (column 3 of Table 2 above) and the total number of vacancies reported by departments (column 4 of Table 2 above). Figure 1 below provides a graphical illustration of this analysis.
���������������������
����������
�����
����������
�����
���� ����
����
����
��������
����
����
���� ����
����
����
�����
�����
�����
�����
�����
�����
���
����
��
����
����
��
���
����
���
� ��
�
���
����
���
����
���
���
����
���
���
����
����
���
���
�
���
����
��
���
����
����
��
����
����
��
������������������� �������������������������
Figure 1: Vacancy rate in the Public Service as at 31 August 2007
PROOF4.indd 14 08/11/2007 11:36:13

i
Public Service Commission
Guide on performance management forsocial development departments
Published in the Republic of South Africa by:
THE PUBLIC SERVICE COMMISSION (PSC)Commission House
Cnr. Hamilton & Ziervogel StreetsArcadia, 0083
Private Bag x121Pretoria, 0001
Tel. (012) 352-1000Fax (012) 325-8382
Website: www.opsc.gov.za
National Anti-Corruption Hotline Number: 0800 701 701 (Toll-Free)
Compiled by: Branch: Monitoring and Evaluation
Distribution by: Directorate: Communication and Information Services
ISBN: 0-621-37005-3RP: 10/2007
15
Figure 1 (previous page) reflects two separate vacancy rates based on the two data sources, namely:
• total number of funded vacant posts reported by national and provincial departments; and
• total number of funded vacant posts reflected on PERSAL.
For ease of reference the discussion of these two vacancy rates have been broken down in the discussion that follows.
3.3.1 VACANCY RATE ACCORDING TO INFORMATION PROVIDED BY PERSAL
The vacancy rate in the Public Service based on the total number of funded posts according to PERSAL (1 433 401) against the total number of vacancies reflected on PERSAL (330 987) is 23.1%.
Figure 1 shows that overall national departments have the lowest vacancy rate at 15.6% and the Free State Province the highest at 30.7%. It also shows that, according to the information on PERSAL, the vacancy rates of national departments (15.6%), the Western Cape (17.6%) and KwaZulu-Natal (21.6%) provinces are below the average vacancy rate of 23.1%.
Considering that national departments have a vacancy rate of 15.6%, they are 7.5% below the average vacancy rate of 23.1%. The Western Cape, with a vacancy rate of 17.6%, is 5.5% below the average vacancy rate and KwaZulu-Natal, with a vacancy rate of 21.6%, is 1.5% below the average vacancy rate of 23.1%. This is an indication that currently, national departments and these two provinces are managing their vacancy rates more effectively.
It should be mentioned that research conducted by the DPSA16 following an analysis of PERSAL information confirms that national departments (16%) and the Western Cape Province (18%) have, as at the end of June 2007, the lowest vacancy rates within the Public Service. This suggests that national departments and the Western Cape particularly take a reasonable period to update information on PERSAL once changes emerge.
The vacancy rates of the remaining seven provinces (Gauteng, North West, Limpopo, Mpumalanga, Eastern Cape, Northern Cape, Free State) are above the national average vacancy rate of 23.1% and could be an indication that they need specific strategies to deal with the high vacancy rates. These high vacancy rates are disconcerting as the provinces are at the coalface of service delivery and also play a role in ensuring successful local government in their provinces.
On a departmental level, after calculating the vacancy rates of departments according to the total number of posts on PERSAL, and the total number of vacancies on PERSAL, the departments mentioned in Table 4 below have the highest vacancy rates.
Table 4: Departments with the highest vacancy rates in accordance with PERSAL information
National/Province Department
Total no of posts on PERSAL
No of posts vacant as per
PERSAL
PERSAL Vacancy rate
Eastern Cape Provincial Treasury 609 466 76.5%Limpopo Safety, Security and Liaison 297 222 74.7%Northern Cape Provincial Treasury 454 316 69.6%Limpopo Premier’s Office 3302 2256 68.3%Northern Cape Sport, Arts and Culture 580 391 67.4%
16 Republic of South Afr ica. Department of Public Ser vice and Administration. Public Ser vice Trends 2002 till 2007. Towards deliver y of our developmental goals .
PROOF4.indd 15 08/11/2007 11:36:13

16
National/Province Department
Total no of posts on PERSAL
No of posts vacant as per
PERSAL
PERSAL Vacancy rate
North West Social Development 3033 2043 67.4%North West Sport, Arts and Culture 1255 810 64.5%KZN Sport and Recreation 374 240 64.2%Eastern Cape Roads and Transport 8483 5125 60.4%
MpumalangaEconomic Development and Planning 888 522 58.8%
Table 4 above shows that the vacancy rates in the above departments are exceptionally high, even to the extent that they would not be able to function effectively. The high vacancy rates could also point to inaccurate information reflected on PERSAL and calls for these departments to urgently review information on PERSAL.
3.3.2 VACANCY RATE ACCORDING TO INFORMATION PROVIDED BY DEPARTMENTS
A comparison of the total number of posts in the Public Ser vice according to PERSAL (1 433 401) against the total number of funded vacancies reported by departments (88 323) shows a vacancy rate of 5.8%.
Figure 1 illustrates that the Western Cape (4.4%), Gauteng (5.5%), Limpopo (2.6%), Eastern Cape (2.5%), and Free State (3.6%) provinces have vacancy rates below the overall vacancy rate of 5.8%. This bodes well for service delivery since fewer vacancies will imply that departments have reasonable capacity to deliver on their mandate, and ultimately improve service delivery. The figure also shows that National Departments, with a vacancy rate of 8.6% is above the national average vacancy rate of 5.8%.
Figure 1 shows that Mpumalanga Province, on the other hand, has the highest vacancy rate at 9%. The high vacancy rate does not auger well for the Province, since it increases the likelihood that service delivery will slow down and/or the quality is negatively affected as there are fewer hands to service the full complement of government’s customers.
On a departmental level, after calculating the vacancy rates of departments according to the total number of posts on PERSAL, and the total number of vacancies as indicated by departments, the departments mentioned in Table 5 below have the highest vacancy rates.
Table 5: Departments with the highest vacancy rates in accordance with departmental information
National/Province Department
Total no of
posts on PERSAL
No of posts vacant as
reflected by departments
Departmental vacancy rate
Gauteng Gauteng Treasury 207 93 44.9%
Northern CapeTourism, Environment and Conservation 350 140 40.0%
Limpopo Provincial Treasury 895 333 37.2%KZN Local Govn and Traditional Affairs 1980 713 36.0%
North WestEconomic Development and Tourism 278 98 35.3%
Limpopo Local Government and Housing 1844 648 35.1%
PROOF4.indd 16 08/11/2007 11:36:14
i
Public Service Commission
Guide on performance management forsocial development departments
Published in the Republic of South Africa by:
THE PUBLIC SERVICE COMMISSION (PSC)Commission House
Cnr. Hamilton & Ziervogel StreetsArcadia, 0083
Private Bag x121Pretoria, 0001
Tel. (012) 352-1000Fax (012) 325-8382
Website: www.opsc.gov.za
National Anti-Corruption Hotline Number: 0800 701 701 (Toll-Free)
Compiled by: Branch: Monitoring and Evaluation
Distribution by: Directorate: Communication and Information Services
ISBN: 0-621-37005-3RP: 10/2007
17
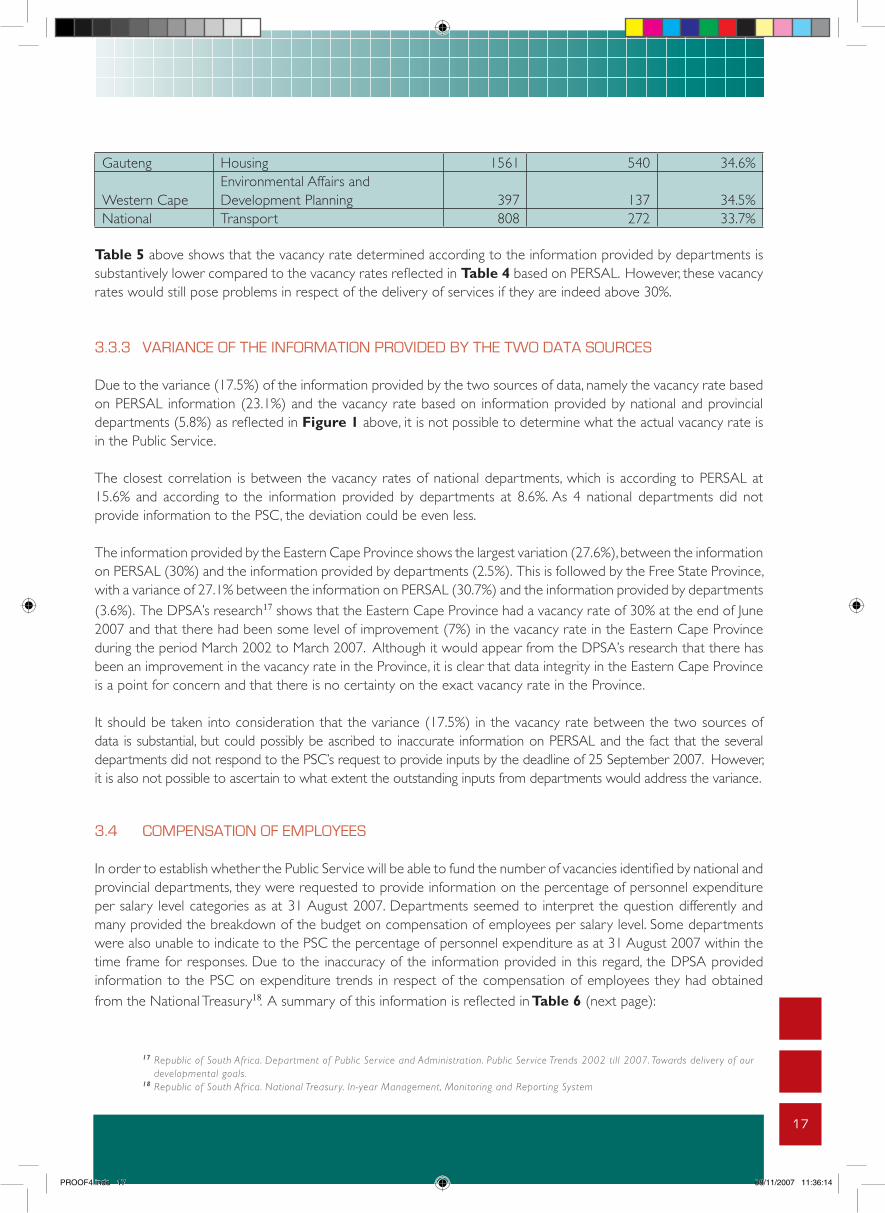
Gauteng Housing 1561 540 34.6%
Western CapeEnvironmental Affairs and Development Planning 397 137 34.5%
National Transport 808 272 33.7%
Table 5 above shows that the vacancy rate determined according to the information provided by departments is substantively lower compared to the vacancy rates reflected in Table 4 based on PERSAL. However, these vacancy rates would still pose problems in respect of the delivery of services if they are indeed above 30%.
3.3.3 VARIANCE OF THE INFORMATION PROVIDED BY THE TWO DATA SOURCES
Due to the variance (17.5%) of the information provided by the two sources of data, namely the vacancy rate based on PERSAL information (23.1%) and the vacancy rate based on information provided by national and provincial departments (5.8%) as reflected in Figure 1 above, it is not possible to determine what the actual vacancy rate is in the Public Service.
The closest correlation is between the vacancy rates of national departments, which is according to PERSAL at 15.6% and according to the information provided by departments at 8.6%. As 4 national departments did not provide information to the PSC, the deviation could be even less.
The information provided by the Eastern Cape Province shows the largest variation (27.6%), between the information on PERSAL (30%) and the information provided by departments (2.5%). This is followed by the Free State Province, with a variance of 27.1% between the information on PERSAL (30.7%) and the information provided by departments (3.6%). The DPSA’s research17 shows that the Eastern Cape Province had a vacancy rate of 30% at the end of June 2007 and that there had been some level of improvement (7%) in the vacancy rate in the Eastern Cape Province during the period March 2002 to March 2007. Although it would appear from the DPSA’s research that there has been an improvement in the vacancy rate in the Province, it is clear that data integrity in the Eastern Cape Province is a point for concern and that there is no certainty on the exact vacancy rate in the Province.
It should be taken into consideration that the variance (17.5%) in the vacancy rate between the two sources of data is substantial, but could possibly be ascribed to inaccurate information on PERSAL and the fact that the several departments did not respond to the PSC’s request to provide inputs by the deadline of 25 September 2007. However, it is also not possible to ascertain to what extent the outstanding inputs from departments would address the variance.
3.4 COMPENSATION OF EMPLOYEES
In order to establish whether the Public Service will be able to fund the number of vacancies identified by national and provincial departments, they were requested to provide information on the percentage of personnel expenditure per salary level categories as at 31 August 2007. Departments seemed to interpret the question differently and many provided the breakdown of the budget on compensation of employees per salary level. Some departments were also unable to indicate to the PSC the percentage of personnel expenditure as at 31 August 2007 within the time frame for responses. Due to the inaccuracy of the information provided in this regard, the DPSA provided information to the PSC on expenditure trends in respect of the compensation of employees they had obtained from the National Treasury18. A summary of this information is reflected in Table 6 (next page):
17 Republic of South Afr ica. Department of Public Ser vice and Administration. Public Ser vice Trends 2002 till 2007. Towards deliver y of our developmental goals . 18 Republic of South Afr ica. National Treasur y. In-year Management, Monitoring and Reporting System
PROOF4.indd 17 08/11/2007 11:36:14
18
Table 6: Actual expenditure on the compensation of employees as a percentage of the main budget as at 31 August 2007
National/Province
R billion
Main appropriation on compensation of
employees
Actual expenditure
Actual expenditure as %
of main budget
Eastern Cape 18,639 7,343 39.4%Free State 7,992 3,221 40.3%Gauteng 18,882 7,369 39.0%KwaZulu-Natal 25,024 10,067 40.2%Limpopo 15,852 6,451 40.7%Mpumalanga 9,502 3,675 38.7%Northern Cape 3,114 1,252 40.2%North West 7,845 3,314 42.3%Western Cape 11,284 4,349 38.5%Provincial Total 118,139 47,046 39.9%National Departments Total 56,135 21,792 38.8%Grand Total 174,275 68,838 39.8%
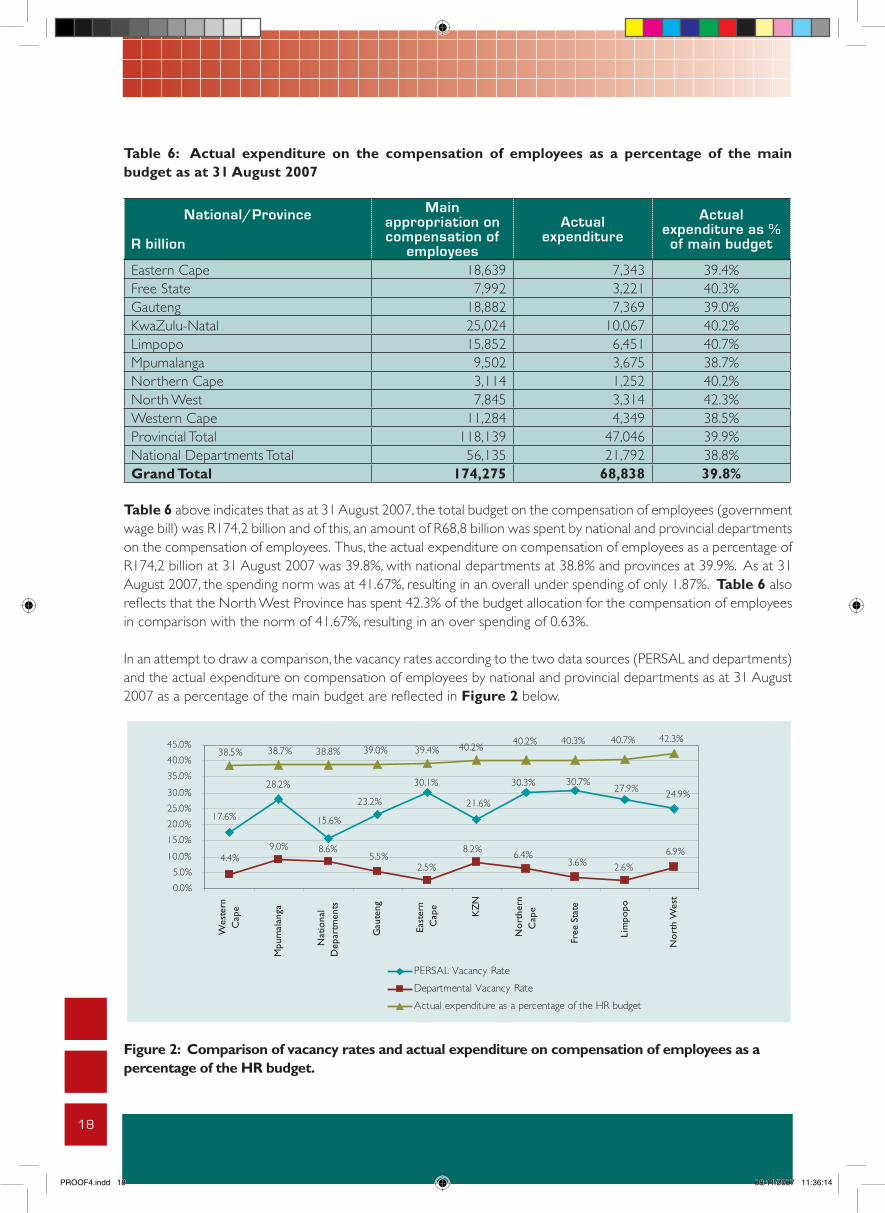
Table 6 above indicates that as at 31 August 2007, the total budget on the compensation of employees (government wage bill) was R174,2 billion and of this, an amount of R68,8 billion was spent by national and provincial departments on the compensation of employees. Thus, the actual expenditure on compensation of employees as a percentage of R174,2 billion at 31 August 2007 was 39.8%, with national departments at 38.8% and provinces at 39.9%. As at 31 August 2007, the spending norm was at 41.67%, resulting in an overall under spending of only 1.87%. Table 6 also reflects that the North West Province has spent 42.3% of the budget allocation for the compensation of employees in comparison with the norm of 41.67%, resulting in an over spending of 0.63%.
In an attempt to draw a comparison, the vacancy rates according to the two data sources (PERSAL and departments) and the actual expenditure on compensation of employees by national and provincial departments as at 31 August 2007 as a percentage of the main budget are reflected in Figure 2 below.
����������
����������
�����
�����
�����
�����
�����
�����
����
������������
����
��������
������������
��������������������������������������������������
����
����
�����
�����
�����
�����
�����
�����
�����
�����
���
����
���
�
���
���
����
���
����
��
����
����
��
���
����
����
���
���
�
��
�
���
����
��
���
����
����
��
���
����
���
����
���
�������������������
�������������������������
���������������������������������������������������
Figure 2: Comparison of vacancy rates and actual expenditure on compensation of employees as a percentage of the HR budget.
PROOF4.indd 18 08/11/2007 11:36:14

i
Public Service Commission
Guide on performance management forsocial development departments
Published in the Republic of South Africa by:
THE PUBLIC SERVICE COMMISSION (PSC)Commission House
Cnr. Hamilton & Ziervogel StreetsArcadia, 0083
Private Bag x121Pretoria, 0001
Tel. (012) 352-1000Fax (012) 325-8382
Website: www.opsc.gov.za
National Anti-Corruption Hotline Number: 0800 701 701 (Toll-Free)
Compiled by: Branch: Monitoring and Evaluation
Distribution by: Directorate: Communication and Information Services
ISBN: 0-621-37005-3RP: 10/2007
19
Figure 2 reveals that the North West Province (42.3%), Limpopo (40.7%), Free State (40.3%) Northern Cape (40.2%) and KwaZulu-Natal (40.2%) provinces have already expended more than 40% of their budget on the compensation of employees. The Western Cape Province has expended the least of its budget on the compensation of employees at 38.5%.
Figure 2 also shows that in the North West Province, the vacancy rate according to PERSAL is at 24.9% and according to departments in the Province at 6.9%, whereas their actual expenditure on the compensation of employees as at 31 August 2007 was 42.3%. This represents an overspending of 0.63% on the compensation of employees. The over expenditure in the North West Province is ascribed to the Department of Education in the Province, whose spending rate as at 31 August 2007 was at 49%, representing an over expenditure of 7.3%. The latter Department reported that they have a total of 5 funded vacant posts at SMS level. In view of the overspending it can be deduced that the Department will not be able to fund these vacancies if they are to be filled.
Closer scrutiny of the information provided on the expenditure trends as on 31 August 2007 in respect of the compensation of employees obtained from the National Treasury points to the following anomalies:
• The Department of Economic Development and Planning in Mpumalanga Province has 105 vacancies and has spent 50.3% of their budget (representing an over expenditure of 8.63%).
• The Office of the Premier in the Northern Cape has 199 funded vacancies, and has spent 46% of their budget (representing an over expenditure of 4.3%).
• The Gauteng Department of Public Transport, Roads and Works has 676 vacancies and has spent 44.1% of their budget (representing an over expenditure of 2.4%).
• The National Department of Water Affairs and Forestry has 2144 vacancies and has spent 43.6% of their budget (representing an over expenditure of 1.9%).
• The Northern Cape Department of Agriculture and Land Reform has 51 vacancies and has spent 43.1% of their budget (representing an over expenditure of 1.4%).
It was noted that in respect of the 2006/2007 financial year, the DPSA19 has calculated that in accordance with the spending on compensation of employees in the Public Service and the projected under expenditure in-
• national departments, funding was available to fill approximately 14,967 vacant posts; and
• provincial departments, funding was available to fill approximately 7,856 vacant posts.
The above calculations by the DPSA suggested that funding was not available to fund all the vacancies indicated on PERSAL. Departments were therefore in terms of the a directive issued by the MPSA and the amended PSR Chapter 1, B.2A20 requested to consult the MPSA on changes to their organizational structures affecting the top three tiers of the structure prior to approval. Through this mechanism departments are then advised to ensure proper alignment of their organizational structures, PERSAL and the available budgets to ensure that vacancies are correctly determined and filled. The DPSA has also established a database on these organizational structures, which could assist in future research on vacancy rates in the Public Service.
Considering the fact that as at 31 August 2007 the spending norm was at 41.67%, and the actual expenditure on
19 Republic of South Afr ica. Department of Public Ser vice and Administration response to National Assembly: Par liamentar y Question No: 278 dated 11 May 2007. 20 Republic of South Afr ica. Public Ser vice Regulation B.2 as amended by Government Notice No. R. 412 of 8 April 2006 with effect from 1 July 2006.
PROOF4.indd 19 08/11/2007 11:36:15
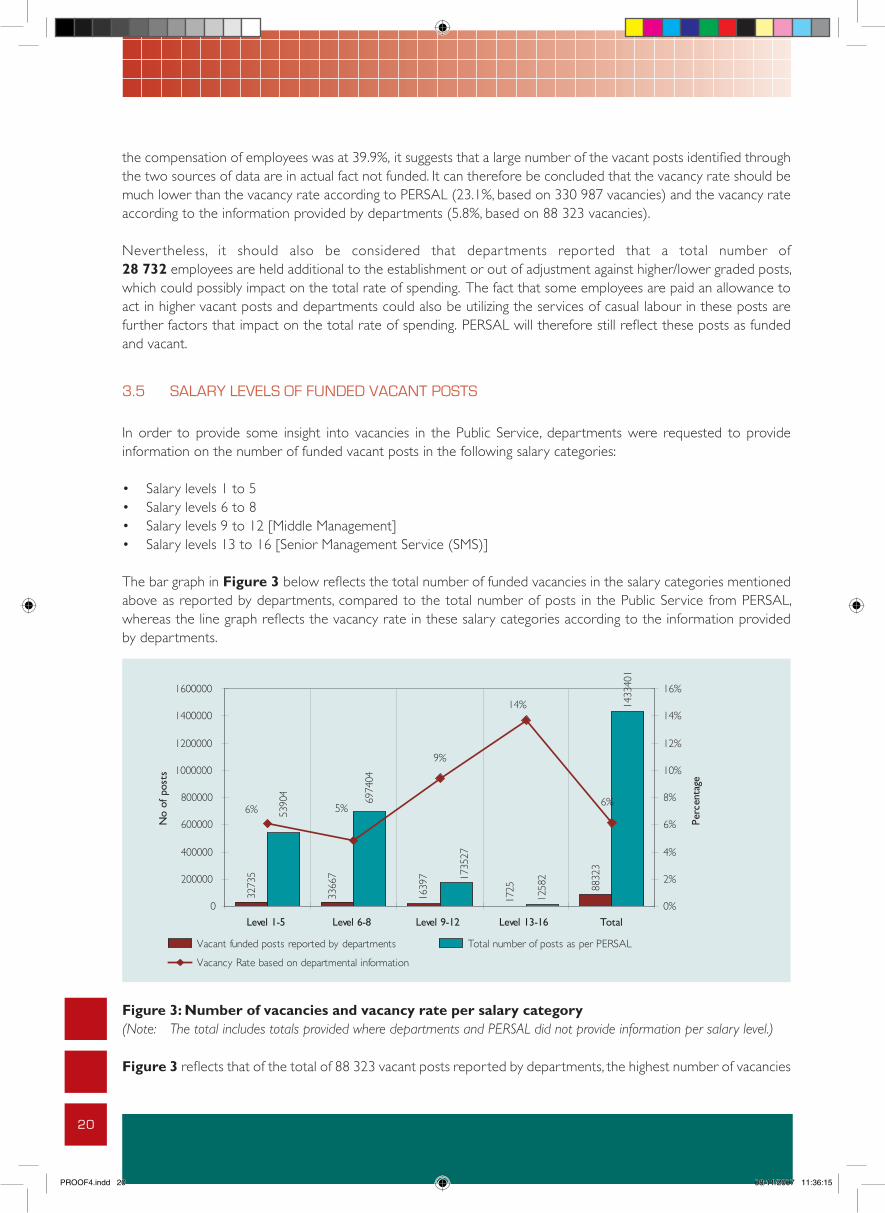
20
the compensation of employees was at 39.9%, it suggests that a large number of the vacant posts identified through the two sources of data are in actual fact not funded. It can therefore be concluded that the vacancy rate should be much lower than the vacancy rate according to PERSAL (23.1%, based on 330 987 vacancies) and the vacancy rate according to the information provided by departments (5.8%, based on 88 323 vacancies).
Never theless, it should also be considered that depar tments repor ted that a total number of 28 732 employees are held additional to the establishment or out of adjustment against higher/lower graded posts, which could possibly impact on the total rate of spending. The fact that some employees are paid an allowance to act in higher vacant posts and departments could also be utilizing the services of casual labour in these posts are further factors that impact on the total rate of spending. PERSAL will therefore still reflect these posts as funded and vacant.
3.5 SALARY LEVELS OF FUNDED VACANT POSTS
In order to provide some insight into vacancies in the Public Service, departments were requested to provide information on the number of funded vacant posts in the following salary categories:
• Salary levels 1 to 5• Salary levels 6 to 8• Salary levels 9 to 12 [Middle Management]• Salary levels 13 to 16 [Senior Management Service (SMS)]
The bar graph in Figure 3 below reflects the total number of funded vacancies in the salary categories mentioned above as reported by departments, compared to the total number of posts in the Public Service from PERSAL, whereas the line graph reflects the vacancy rate in these salary categories according to the information provided by departments.
�
����
�
����
�
���� ��
���
����
��
����
��
����
�
����
���
����
� ����
��
��
���
��
����
�
������
������
������
������
�������
�������
�������
�������
��������� ��������� ���������� ����������� �����
���
����
����
��
��
��
��
��
���
���
���
�����
����
����
������������������������������������������� �����������������������������������
����������������������������������������������
Figure 3: Number of vacancies and vacancy rate per salary category(Note: The total includes totals provided where departments and PERSAL did not provide information per salary level.)
Figure 3 reflects that of the total of 88 323 vacant posts reported by departments, the highest number of vacancies
PROOF4.indd 20 08/11/2007 11:36:15

i
Public Service Commission
Guide on performance management forsocial development departments
Published in the Republic of South Africa by:
THE PUBLIC SERVICE COMMISSION (PSC)Commission House
Cnr. Hamilton & Ziervogel StreetsArcadia, 0083
Private Bag x121Pretoria, 0001
Tel. (012) 352-1000Fax (012) 325-8382
Website: www.opsc.gov.za
National Anti-Corruption Hotline Number: 0800 701 701 (Toll-Free)
Compiled by: Branch: Monitoring and Evaluation
Distribution by: Directorate: Communication and Information Services
ISBN: 0-621-37005-3RP: 10/2007
21
is at salary levels 6 to 8 (33 667 vacancies), followed by salary levels 1 to 5 (32 735 vacancies). The lowest number of vacancies at salary levels 13 to 16 (1725 vacancies), which is also the salary level with the lowest number of posts (12 582).
Figure 3 shows that the vacancy rate on salary levels 13 to 16 (SMS) is the highest at 14%, and second highest vacancy rate is at salary levels 9 to 12 at 9%. It has been established that the posts of Director-General in the following national department and provinces were vacant as at 1 October 2007:
• Water Affairs and Forestry.• Northern Cape.• Western Cape.• North West.
The trend of the highest vacancies at salary levels 9 - 16 is cause for concern since these are the strategists who translate and implement policy respectively in any given department. In addition to this, the SMS and employees on salary levels 9 - 12 are also at the forefront of devising innovative programmes and interventions to enhance service delivery within their departments given the level of their expertise and responsibilities within their organizations. Such a high vacancy rate at these levels could possibly be ascribed to scarce skills, lack of retention strategies or a failure to attract suitable candidates from designated groups that are under represented in terms of departments’ Employment Equity Plans.
Although the highest number of employees is employed at salary levels 6 to 8, these levels have the lowest vacancy rate at 5%. However, considering the fact that departments reported that 33 667 posts on these levels are vacant, and the fact that employees on these levels are usually in the front office, these vacancies impact on the speed and quality of services to the public.
3.6 PROGRESS REGARDING THE RECRUITMENT PROCESS
In an attempt to determine the progress made by departments in the filling of posts, the following information on the recruitment and selection process was requested:
• Number of posts not job evaluated.• Number of funded vacant posts advertised.• Number of posts where the selection process has commenced.• Number of posts where the selection committee has made a recommendation to the Executing Authority/
delegated authority.
Figure 4 below provides an analysis of the various phases in the recruitment process, as a percentage of the total number of vacancies (88 323) reported by departments.
In terms of PSR Chapter 1, Part III, F, an executing authority shall, before creating a newly defined job, or the filling of any vacancy, in the case of a vacant post on grade 9 or higher, evaluate the job unless the specific job has been evaluated previously. In view of this provision of the PSR, departments cannot proceed with the recruitment process if posts on salary levels 9 and above have not been job evaluated. Due to its impact on the recruitment process, departments were therefore also requested to indicate the number of posts that have not been job evaluated.
PROOF4.indd 21 08/11/2007 11:36:15

22
�
���
���
��
���
���
��
���
���
���
��
���
���
���
��
���
���
���
��
��
���
���
���
���
���
���
����
����
��
��������� ��������� ���������� ����������� �����
�������������� ������������������������
�������������������������������� ���������������������������������������������
Figure 4: Recruitment process as a percentage of the total number of vacancies reported by departments
Figure 4 above shows that departments have made some measure of progress to fill vacancies identified during the audit, as 40 438 (46%) vacant funded posts identified during the audit have been advertised, the selection process have commenced in respect of 24 794 (28%) vacant posts, and in respect of 5 520 (6%) vacant posts, selection committees have made recommendations to the Executive Authority/delegated authority on the appointment of a suitable candidate.
For ease of reference a separate discussion follows in paragraphs 3.6.1 to 3.6.4 on the information on each of the phases in the recruitment and selection process identified in Figure 4.
3.6.1 JOB EVALUATION OF POSTS ON SALARY LEVELS 9 AND ABOVE
On salary levels 9 to 12 departments have yet to job evaluate 25% (4 084) of funded vacant posts and on salary levels 13 to 16 departments have yet to job evaluate 27% (469) of funded vacant posts.
During the analysis of the information it was noted that in some instances departments have advertised posts at these salary levels which have apparently not been job evaluated. Examples of such cases are reflected in Table 7 (next page).
PROOF4.indd 22 08/11/2007 11:36:16
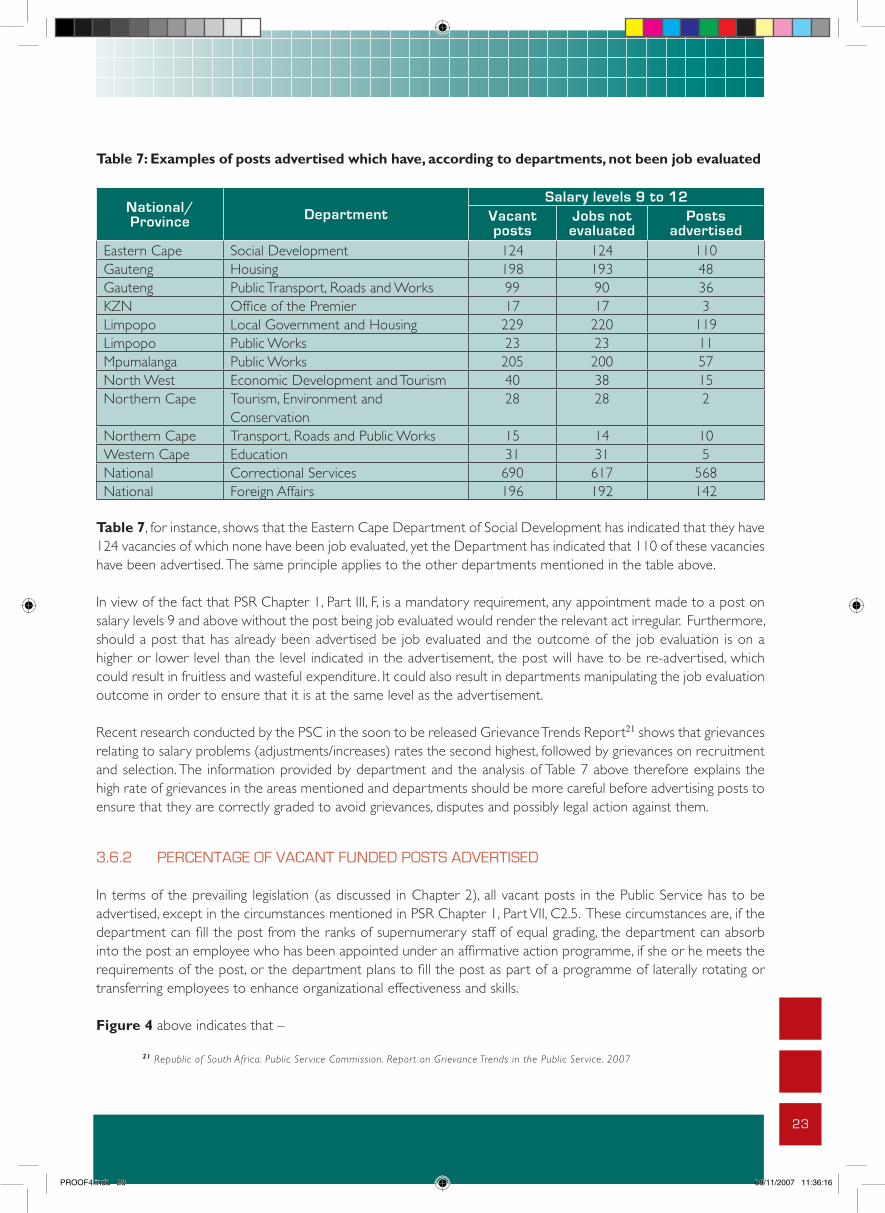
i
Public Service Commission
Guide on performance management forsocial development departments
Published in the Republic of South Africa by:
THE PUBLIC SERVICE COMMISSION (PSC)Commission House
Cnr. Hamilton & Ziervogel StreetsArcadia, 0083
Private Bag x121Pretoria, 0001
Tel. (012) 352-1000Fax (012) 325-8382
Website: www.opsc.gov.za
National Anti-Corruption Hotline Number: 0800 701 701 (Toll-Free)
Compiled by: Branch: Monitoring and Evaluation
Distribution by: Directorate: Communication and Information Services
ISBN: 0-621-37005-3RP: 10/2007
23
Table 7: Examples of posts advertised which have, according to departments, not been job evaluated
National/Province Department
Salary levels 9 to 12Vacant posts
Jobs not evaluated
Posts advertised
Eastern Cape Social Development 124 124 110Gauteng Housing 198 193 48Gauteng Public Transport, Roads and Works 99 90 36KZN Office of the Premier 17 17 3Limpopo Local Government and Housing 229 220 119Limpopo Public Works 23 23 11Mpumalanga Public Works 205 200 57North West Economic Development and Tourism 40 38 15Northern Cape Tourism, Environment and
Conservation28 28 2
Northern Cape Transport, Roads and Public Works 15 14 10Western Cape Education 31 31 5National Correctional Services 690 617 568National Foreign Affairs 196 192 142
Table 7, for instance, shows that the Eastern Cape Department of Social Development has indicated that they have 124 vacancies of which none have been job evaluated, yet the Department has indicated that 110 of these vacancies have been advertised. The same principle applies to the other departments mentioned in the table above.
In view of the fact that PSR Chapter 1, Part III, F, is a mandatory requirement, any appointment made to a post on salary levels 9 and above without the post being job evaluated would render the relevant act irregular. Furthermore, should a post that has already been advertised be job evaluated and the outcome of the job evaluation is on a higher or lower level than the level indicated in the advertisement, the post will have to be re-advertised, which could result in fruitless and wasteful expenditure. It could also result in departments manipulating the job evaluation outcome in order to ensure that it is at the same level as the advertisement.
Recent research conducted by the PSC in the soon to be released Grievance Trends Report21 shows that grievances relating to salary problems (adjustments/increases) rates the second highest, followed by grievances on recruitment and selection. The information provided by department and the analysis of Table 7 above therefore explains the high rate of grievances in the areas mentioned and departments should be more careful before advertising posts to ensure that they are correctly graded to avoid grievances, disputes and possibly legal action against them.
3.6.2 PERCENTAGE OF VACANT FUNDED POSTS ADVERTISED
In terms of the prevailing legislation (as discussed in Chapter 2), all vacant posts in the Public Service has to be advertised, except in the circumstances mentioned in PSR Chapter 1, Part VII, C2.5. These circumstances are, if the department can fill the post from the ranks of supernumerary staff of equal grading, the department can absorb into the post an employee who has been appointed under an affirmative action programme, if she or he meets the requirements of the post, or the department plans to fill the post as part of a programme of laterally rotating or transferring employees to enhance organizational effectiveness and skills.
Figure 4 above indicates that –
21 Republic of South Afr ica. Public Ser vice Commission. Report on Grievance Trends in the Public Ser vice. 2007
PROOF4.indd 23 08/11/2007 11:36:16
24
• 46% (40 438) of vacant funded posts have already been advertised by departments as at 31 August 2007; and• the highest percentage of posts has been advertised on salary levels 9 to 12 (51%), whereas the lowest
percentage of posts has been advertised on salary levels 1 to 5 (43%).
Considering that the highest vacancy rate is at salary levels 13 to 16 (14%), it is disconcerting that only 46% of these posts have been advertised.
Bearing in mind that PSCBC Resolution 1 of 2007 determines that all current funded vacancies should be advertised within six months of the agreement, which was signed on 5 July 2007, departments will have to accelerate the advertising of posts if they are to advertise the remaining 54% of vacant posts before January 2008.
3.6.3 PERCENTAGE OF FUNDED VACANT POSTS WHERE THE SELECTION PROCESS HAS COMMENCED
The selection process commences after the closing date stated in the advertisement for each post. It involves various phases, such as the screening of applications, short-listing process and interviewing which follows each other. This implies that each phase has to be finalized before the next phase commences. The effective and efficient management of these activities is dependent on various role-players, such as line managers and staff from the HR components. It sometimes even involves external stakeholders, such as members of selection committees from other departments or outside the Public Service. In order to ensure that posts are filled within a reasonable time frame, departments usually allocate time frames to each phase.
Figure 4 indicates departments have commenced with the selection process in respect of 28% (24 794) of vacant funded posts. It is noted that at salary levels 1 to 5, departments have reported the highest percentage of instances (32%) in which the selection process has commenced and at salary levels 9 to 12 it is at its lowest at 23% (3 824 posts). It is disconcerting to note that the highest vacancy rate is at salary levels 13 to 16 (14%), whilst departments have only commenced with the selection process in respect of 27% (472) of vacant posts. However, the fact that in some instances the closing dates of advertised posts have not passed, influences the percentage of posts whereby the selection process has commenced.
3.6.4 PERCENTAGE OF RECOMMENDATIONS MADE TO THE EXECUTING AUTHORITY/DELEGATED AUTHORITY
At the conclusion of the interview process, selection committees should make recommendations to the Executing Authority on the suitability of the candidate to be appointed. The PSC has through its many investigations on the filling of posts observed that in the case of posts below SMS level, many executing authorities have delegated the authority to approve appointments. This normally impacts positively on the turn-around time for the filling of posts.
Figure 4 indicates that the selection committees have made recommendations to the Executing Authority or his/her delegate in 6% of the funded vacant posts as at 31 August 2007. This figure constitutes a total number of 5 520 posts in respect of which recommendations on the suitability of candidates following an interview have been made. The highest percentage of posts where recommendations have been made is on salary levels 9 to 12 (9%), followed by SMS level (8%). A fair ly small percentage of recommendations have been made in respect of salary levels 1 to 5 (4%). This could point to the fact that line managers below SMS, who are usually responsible for the recruitment and selection process of these employees, are also experiencing problems to constitute selection committees.
PROOF4.indd 24 08/11/2007 11:36:16

i
Public Service Commission
Guide on performance management forsocial development departments
Published in the Republic of South Africa by:
THE PUBLIC SERVICE COMMISSION (PSC)Commission House
Cnr. Hamilton & Ziervogel StreetsArcadia, 0083
Private Bag x121Pretoria, 0001
Tel. (012) 352-1000Fax (012) 325-8382
Website: www.opsc.gov.za
National Anti-Corruption Hotline Number: 0800 701 701 (Toll-Free)
Compiled by: Branch: Monitoring and Evaluation
Distribution by: Directorate: Communication and Information Services
ISBN: 0-621-37005-3RP: 10/2007
25
Should all these recommendations be approved by the Executing Authority or his/her delegate it could bring the overall vacancy rate down by 0.4%. It should be taken into consideration that a percentage of these recommendations would affect serving public servants who have applied for higher posts. The appointments made to these funded vacant posts will therefore not necessarily have a marked positive effect on reducing the vacancy rate.
3.7 AVERAGE TURNAROUND TIME TAKEN FOR THE FILLING OF POSTS
Departments were requested to provide an indication of the average turnaround time to fill vacant posts. Of the 136 departments that provided an input to the PSC, 15 did not provide a response to this question. The responses provided by some departments indicate that some did not understand the question, as the planned time frame attached to each step in the recruitment process was provided, e.g. National Departments of Transport, Social Development and Home Affairs and Free State Department of Public Works, Roads and Transport.
For statistical purposes the responses were categorized in intervals of two months. Figure 5 below illustrates the average turnaround time for the filling of posts as indicated by departments.
����
�����
����� �����
����
�����
�����
�����
�����
�����
�����
����
����
��
�������������� ���������� ���������� ��������������
Figure 5: Average turnaround time taken to fill a post.
Figure 5 shows that the majority of departments (59.8%) indicated that the average turnaround time for the filling of posts is 2 to 3 months. This is substantially different from the findings of research conducted by the DPSA22 which found that the average period that posts are vacant is just above 15 months. Yet again, as the information extracted from PERSAL has proven to be inaccurate, abolished posts still reflected as active vacant posts on PERSAL could have an impact on the turnaround time to fill posts. The fact that some departments misunderstood the question by indicating the planned time frame for each phase of the recruitment and selection process in terms of their departmental policy (generic time frame and not the actual time frame) also impacted on the high number of departments indicating that the average turnaround time for the filling of posts is 2 to 3 months.
The longest turnaround time reported was by the Department of Economic Development, Environment and Tourism in Limpopo Province, which indicated the turnaround time is between 6 to 18 months. The Department of Local Government in the Gauteng Province, the Department of Economic Development and Environmental Affairs in the Eastern Cape Province and the Northern Cape Department of Health reported average turnaround times of 30 to 45 days to fill vacancies. The DPSA has advised departments to refrain from advertising posts with running periods of less than two weeks in order to provide ample time for advertisements to reach prospective candidates
22 Public Management Watch. June 2007. Provincial and Sectoral Analysis: DPSA
PROOF4.indd 25 08/11/2007 11:36:17
26
stationed in remote areas of the country. In practice the average running time for advertisements is therefore three to four weeks, where after departments allows a week for posted applications to reach them. Bearing this in mind, it is therefore highly unlikely that the average turnaround time for the filling of posts could be 30 to 45 days.
Some departments indicated that the average turnaround time for SMS posts is longer than those below the SMS, e.g. SAMDI and the National Department of Agriculture. This is most often ascribed to the unavailability of selection committee members to conduct short listing and interviews and the competency assessments for SMS members. In the latter regard, Cabinet on 16 February 200523 approved that the competency-based assessments for the SMS be implemented on a voluntary basis across all senior managerial positions in the Public Service for selection purposes. The assessments must be utilized as an aid in determining the suitability of candidates in conjunction with other selection tools such as interviews, reference checks and security clearances to come to a final recommendation. According to departments, the availability of short-listed candidates to undergo these assessments impacts negatively on the turnaround time to fill posts in the SMS.
The Department of Water Affairs and Forestry indicated that the average turnaround time for non-technical lower level posts is 2 months, whereas the turnaround time for technical posts is 5-6 months. The Department of Roads and Transport in Mpumalanga Province also indicated that it takes longer to fill technical posts, as compared to administrative posts.
The following practices reported by departments also have an impact on the average turnaround time for the filling of posts:
• The National Department of Education indicated they advertise posts on a quarterly basis in a bulk advertisement to save cost. Their departmental policy, however, does provide for exceptions if there is a need to fill posts urgently.
• The SAPS indicated that the majority of vacant posts exists on entry level and these posts are created at the commencement of each financial year (1 April) in terms of their enlistment plan. 45% of the initial planned (entry level) enlistments for 2007 were realized in the first 4 months of the financial year.
• The Department of Defence, who is governed by two sets of legislation, the Defence Act (Act 42 of 2002) and the Public Service Act, 1994, indicated that the uniformed component (79% of the human resources) is being staffed in terms of an annual staffing cycle through which the South African National Defence Force’s human resources are rejuvenated by Military Skills Development System intakes.
Notice periods are usually provided for in contracts of employment, and employees are generally required to give 30 days notice. Several departments commented that the notice period that has to be served by candidates appointed to posts also impacts negatively on the turnaround time for the filling of posts.
3.8 FACTORS IMPACTING ON THE FILLING OF POSTS
In order to have an understanding of the challenges faced by departments in the filling of posts, they were requested to indicate the factors impacting on the filling of posts. For ease of reference the responses of departments have been categorized and the ten most prevailing factors impacting on the filling of posts are reflected in Figure 6 (next page).
23 Republic of South Afr ica. Department of Public Ser vice and Administration Circular dated 3 May 2005
PROOF4.indd 26 08/11/2007 11:36:17
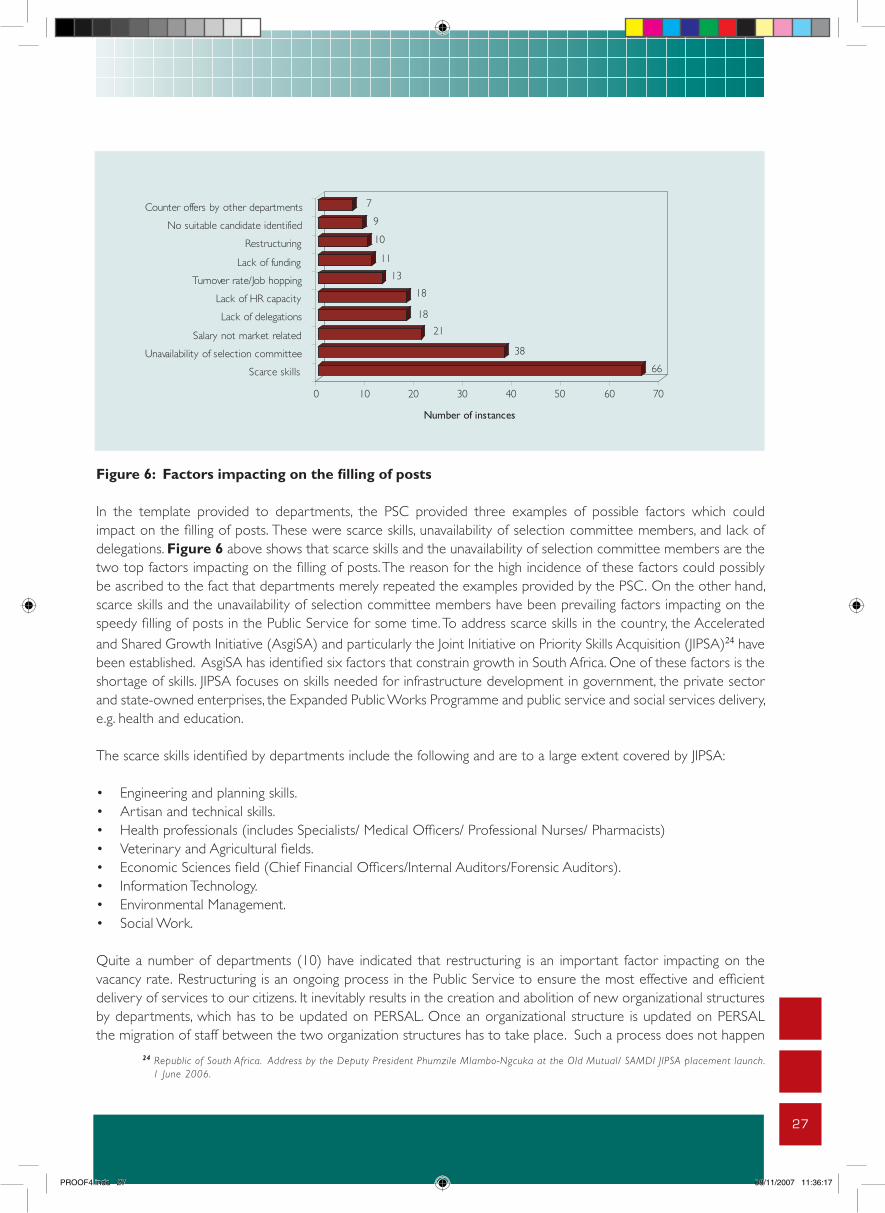
i
Public Service Commission
Guide on performance management forsocial development departments
Published in the Republic of South Africa by:
THE PUBLIC SERVICE COMMISSION (PSC)Commission House
Cnr. Hamilton & Ziervogel StreetsArcadia, 0083
Private Bag x121Pretoria, 0001
Tel. (012) 352-1000Fax (012) 325-8382
Website: www.opsc.gov.za
National Anti-Corruption Hotline Number: 0800 701 701 (Toll-Free)
Compiled by: Branch: Monitoring and Evaluation
Distribution by: Directorate: Communication and Information Services
ISBN: 0-621-37005-3RP: 10/2007
27
�
��
��
��
��
��
��
��
��
�
�
� �� �� �� �� �� �� ��
�������������������
�������������
�������������������������������������
�������������������������
�������������������
�������������������
�������������������������
���������������
�������������
��������������������������������
�����������������������������������
Figure 6: Factors impacting on the filling of posts
In the template provided to departments, the PSC provided three examples of possible factors which could impact on the filling of posts. These were scarce skills, unavailability of selection committee members, and lack of delegations. Figure 6 above shows that scarce skills and the unavailability of selection committee members are the two top factors impacting on the filling of posts. The reason for the high incidence of these factors could possibly be ascribed to the fact that departments merely repeated the examples provided by the PSC. On the other hand, scarce skills and the unavailability of selection committee members have been prevailing factors impacting on the speedy filling of posts in the Public Service for some time. To address scarce skills in the country, the Accelerated and Shared Growth Initiative (AsgiSA) and particularly the Joint Initiative on Priority Skills Acquisition (JIPSA)24 have been established. AsgiSA has identified six factors that constrain growth in South Africa. One of these factors is the shortage of skills. JIPSA focuses on skills needed for infrastructure development in government, the private sector and state-owned enterprises, the Expanded Public Works Programme and public service and social services delivery, e.g. health and education.
The scarce skills identified by departments include the following and are to a large extent covered by JIPSA:
• Engineering and planning skills.• Artisan and technical skills.• Health professionals (includes Specialists/ Medical Officers/ Professional Nurses/ Pharmacists)• Veterinary and Agricultural fields.• Economic Sciences field (Chief Financial Officers/Internal Auditors/Forensic Auditors).• Information Technology.• Environmental Management.• Social Work.
Quite a number of departments (10) have indicated that restructuring is an important factor impacting on the vacancy rate. Restructuring is an ongoing process in the Public Service to ensure the most effective and efficient delivery of services to our citizens. It inevitably results in the creation and abolition of new organizational structures by departments, which has to be updated on PERSAL. Once an organizational structure is updated on PERSAL the migration of staff between the two organization structures has to take place. Such a process does not happen 24 Republic of South Afr ica. Address by the Deputy President Phumzile Mlambo-Ngcuka at the Old Mutual/ SAMDI JIPSA placement launch. 1 June 2006.
PROOF4.indd 27 08/11/2007 11:36:17
28
overnight and if a PERSAL report on vacant posts is requested during a restructuring process, the new organizational structure could show that all posts are vacant. The fact that ten (10) departments are in the process of restructuring could therefore have had an impact on the substantial variation in the number of vacancies on PERSAL compared to the information provided by departments.
Figure 6 (previous page) reflects that thirteen (13) departments indicated that a high staff turnover and job hopping contributes to the vacancy rate in the Public Service. This is largely ascribed to inconsistencies in the grading of similar posts across the Public Service and the demand for certain skills or people with specific profiles.
Figure 6 (previous page) shows that seven (7) departments indicated that the vacancy rate is negatively affected by the fact that other departments retain staff by making higher counter offers. Recommended candidates therefore do not accept appointments to the advertised posts to which they had been appointed, but remain in their employing departments at a higher salary level. PSR Chapter 1, Part V, C, provides that an executing authority may set the salary for an employee above the minimum notch of the salary range indicated by the job weight if the job has been evaluated, but the executing authority was unable to recruit or retain an employee with the necessary competencies at the salary indicated by the job weight. Departments subsequently utilize this provision of the PSR to make counter offers to retain employees that were successful candidates for advertised posts in other departments. Such a trend could ultimately be very costly for the Public Service, and for this reason the MPSA had emphasized in a circular to all departments25 that the allocation of a higher salary notch/inclusive flexible remuneration package or higher salary level/remuneration band should be considered as a last option and be applied with circumspect. Furthermore, sufficient funds must be available on the department’s budget as well as the Medium Term Expenditure Framework to sustain the increase. Departments were therefore advised in the circular to establish rigorous control systems in allocating higher salaries and to include control systems in their departmental policies.
It was interesting to note that some departments mentioned factors such as a lack of office space to accommodate newly appointed employees, the large number of applications (up to 100 000 applications per advertisement) and the Employment Equity targets that have to be met impacts negatively on the filling of posts. In the latter regard it was indicated that some departments have failed to attract suitable candidates from designated groups that are under represented in terms of their Employment Equity Plans. A number of departments also commented that in view of the fact that employees are promoted internally to higher vacant posts, the vacancy rate does not improve.
3.9 STRATEGIES TO DEAL WITH THE HIGH VACANCY RATE IN DEPARTMENTS
As departments face various challenges in the filling of posts, they were requested to indicate whether they have strategies in place to overcome such challenges. Nineteen departments did not respond to the question. For ease of reference responses have been categorized as follows:
• Departments who have a strategy in place to deal with vacant posts.• Departments who have no strategy in place.
25 Republic of South Afr ica. Department of Public Ser vice and Administration. Circular dated 21 June 2001.
PROOF4.indd 28 08/11/2007 11:36:18
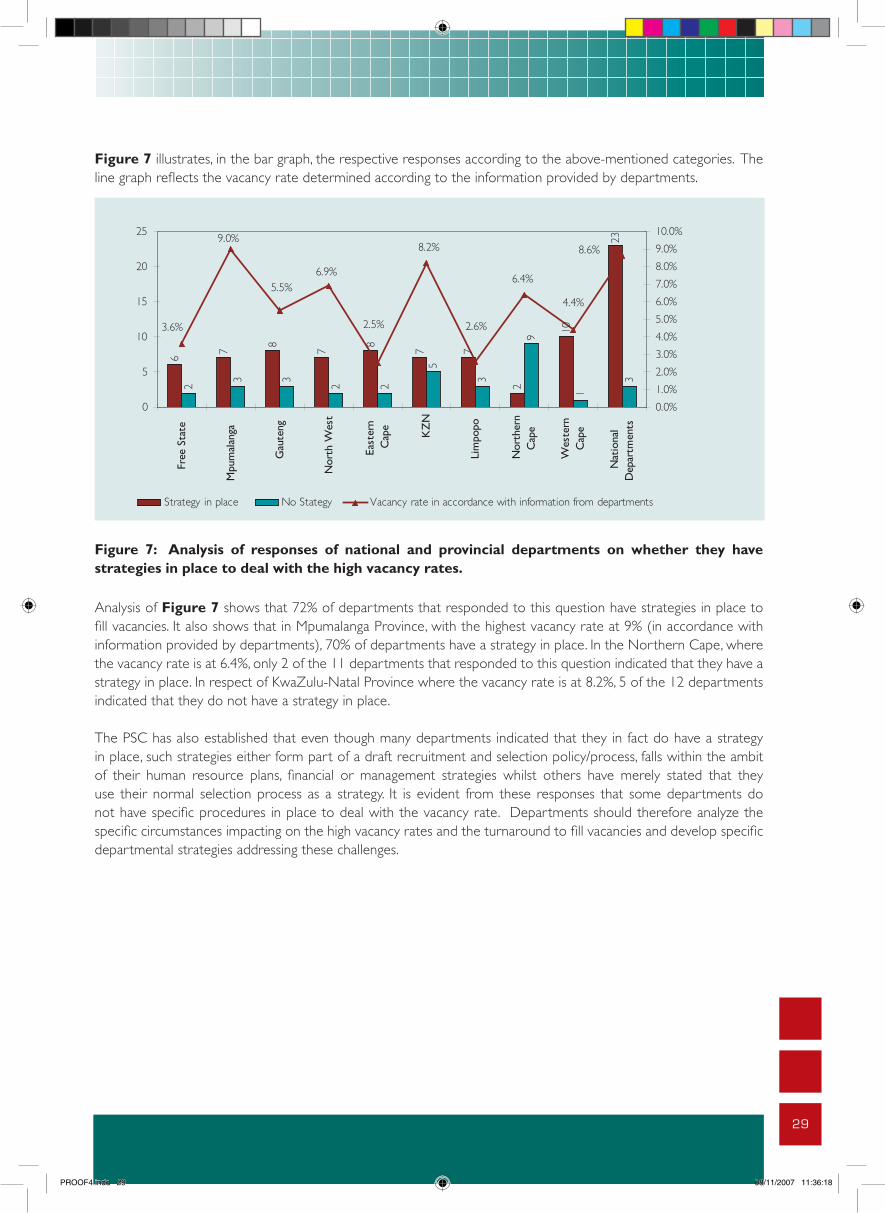
i
Public Service Commission
Guide on performance management forsocial development departments
Published in the Republic of South Africa by:
THE PUBLIC SERVICE COMMISSION (PSC)Commission House
Cnr. Hamilton & Ziervogel StreetsArcadia, 0083
Private Bag x121Pretoria, 0001
Tel. (012) 352-1000Fax (012) 325-8382
Website: www.opsc.gov.za
National Anti-Corruption Hotline Number: 0800 701 701 (Toll-Free)
Compiled by: Branch: Monitoring and Evaluation
Distribution by: Directorate: Communication and Information Services
ISBN: 0-621-37005-3RP: 10/2007
29
Figure 7 illustrates, in the bar graph, the respective responses according to the above-mentioned categories. The line graph reflects the vacancy rate determined according to the information provided by departments.
�
�
�
�
�
�
� �
�
��
��
�
� �
� �
�
�
�
�
�
����
����
����
����
����
����
��������
����
����
�
�
��
��
��
��
����
����
��
���
���
����
���
����
���
����
���
����
���
���
�
��
�
���
����
���
����
��
���
���
����
���
�
���
����
��
����
����
��
����
����
����
����
����
����
����
����
����
����
�����
����������������� ���������� ������������������������������������������������������������
Figure 7: Analysis of responses of national and provincial departments on whether they have strategies in place to deal with the high vacancy rates.
Analysis of Figure 7 shows that 72% of departments that responded to this question have strategies in place to fill vacancies. It also shows that in Mpumalanga Province, with the highest vacancy rate at 9% (in accordance with information provided by departments), 70% of departments have a strategy in place. In the Northern Cape, where the vacancy rate is at 6.4%, only 2 of the 11 departments that responded to this question indicated that they have a strategy in place. In respect of KwaZulu-Natal Province where the vacancy rate is at 8.2%, 5 of the 12 departments indicated that they do not have a strategy in place.
The PSC has also established that even though many departments indicated that they in fact do have a strategy in place, such strategies either form part of a draft recruitment and selection policy/process, falls within the ambit of their human resource plans, financial or management strategies whilst others have merely stated that they use their normal selection process as a strategy. It is evident from these responses that some departments do not have specific procedures in place to deal with the vacancy rate. Departments should therefore analyze the specific circumstances impacting on the high vacancy rates and the turnaround to fill vacancies and develop specific departmental strategies addressing these challenges.
PROOF4.indd 29 08/11/2007 11:36:18

30
ii
CONTENTSPage
EXECUTIVE SUMMARY iii
1 INTRODUCTION 1
1.1 Background 11.2 Problem statement 11.3 Scope 21.4 Methodology 21.5 Limitations 3
2. RELATIONSHIPS AND BOUNDARY SETTING 4
2.1 Constitutional framework 42.2 Legal Framework and Codes 62.3 Operational Framework and Practice 8
3. CURRENT STATE AND PERSPECTIVES 10
3.1 Executive Authorities (Ministers and MECs) 113.2 Deputy Ministers 153.3 Special Advisors 163.4 Heads of Department 17
4. COMPARATIVE INTERNATIONAL EXPERIENCES IN ROLE CLARIFICATION 19
ii
CONTENTSPage
EXECUTIVE SUMMARYiii
1 INTRODUCTION1
1.1Background11.2Problem statement11.3Scope21.4Methodology21.5Limitations3
2.RELATIONSHIPS AND BOUNDARY SETTING4
2.1Constitutional framework42.2Legal Framework and Codes62.3Operational Framework and Practice8
3.CURRENT STATE AND PERSPECTIVES10
3.1Executive Authorities (Ministers and MECs)113.2Deputy Ministers153.3Special Advisors163.4Heads of Department17
4.COMPARATIVE INTERNATIONAL EXPERIENCES IN ROLE CLARIFICATION19
PROOF4.indd 30 08/11/2007 11:36:19
ii
CONTENTSPage
EXECUTIVE SUMMARY iii
1 INTRODUCTION 1
1.1 Background 11.2 Problem statement 11.3 Scope 21.4 Methodology 21.5 Limitations 3
2. RELATIONSHIPS AND BOUNDARY SETTING 4
2.1 Constitutional framework 42.2 Legal Framework and Codes 62.3 Operational Framework and Practice 8
3. CURRENT STATE AND PERSPECTIVES 10
3.1 Executive Authorities (Ministers and MECs) 113.2 Deputy Ministers 153.3 Special Advisors 163.4 Heads of Department 17
4. COMPARATIVE INTERNATIONAL EXPERIENCES IN ROLE CLARIFICATION 19
31
ii
CONTENTSPage
EXECUTIVE SUMMARYiii
1 INTRODUCTION1
1.1Background11.2Problem statement11.3Scope21.4Methodology21.5Limitations3
2.RELATIONSHIPS AND BOUNDARY SETTING4
2.1Constitutional framework42.2Legal Framework and Codes62.3Operational Framework and Practice8
3.CURRENT STATE AND PERSPECTIVES10
3.1Executive Authorities (Ministers and MECs)113.2Deputy Ministers153.3Special Advisors163.4Heads of Department17
4.COMPARATIVE INTERNATIONAL EXPERIENCES IN ROLE CLARIFICATION19
Ch
ap
ter
4
Recommendations
PROOF4.indd 31 08/11/2007 11:36:19

32
CHAPTER 4: RECOMMENDATIONS
Chapter 3 shows that there is a need for the improvement of information on funded vacancies and the management of the vacancy rate within the Public Service. Challenges have also emerged around the need for particular strategies to deal with the vacancy rate in the Public Service and a need to accelerate the filling of posts. Below are specific recommendations made in response to the challenges that were identified during the audit.
4.1 ACCELERATING THE FILLING OF POSTS
Although the data provided does not provide clarity on the exact vacancy rate in the Public Service, the findings in this report show that departments face various challenges in the filling of posts and that there is a need for the Public Service to accelerate the filling of vacant posts. Although there are similarities in the challenges faced by departments in the filling of posts, there are also barriers that are unique to some departments. To address these, departments have to take specific measures to avoid them.
All departments should design and implement specific strategies to accelerate the filling of vacant posts. They should prioritize areas where service delivery is compromised by high vacancy rates.
4.2 IMPROVE THE ACCURACY OF INFORMATION ON PERSAL
According to the findings based on the data analysis at Chapter 3, the PSC found large discrepancies between the information provided by departments and PERSAL regarding the number of funded vacancies.
To address this challenge, it is recommended that:
• Departments should ensure that information regarding their establishment and vacancies on their establishment are captured properly and on time. Information should also be updated on PERSAL within 30 days once a post(s) becomes vacant. This will assist in ensuring that PERSAL operates as closely as possible to real-time information than is currently the case.
• Departments should ensure that PERSAL Controllers and those employees responsible for the input of data on PERSAL is adequately capacitated to perform this function.
• An assessment should be done by the DPSA and National Treasury in collaboration with departments on how best to provide usable, accurate and user friendly information and to improve PERSAL as a reliable management information tool.
• Departments should ensure that information on PERSAL is verified and corrected as a matter of urgency. This will assist greatly in improving the integrity of the information in its database. It will also enhance the confidence of its stakeholders who access such information on a day to day basis.
PROOF4.indd 32 08/11/2007 11:36:19
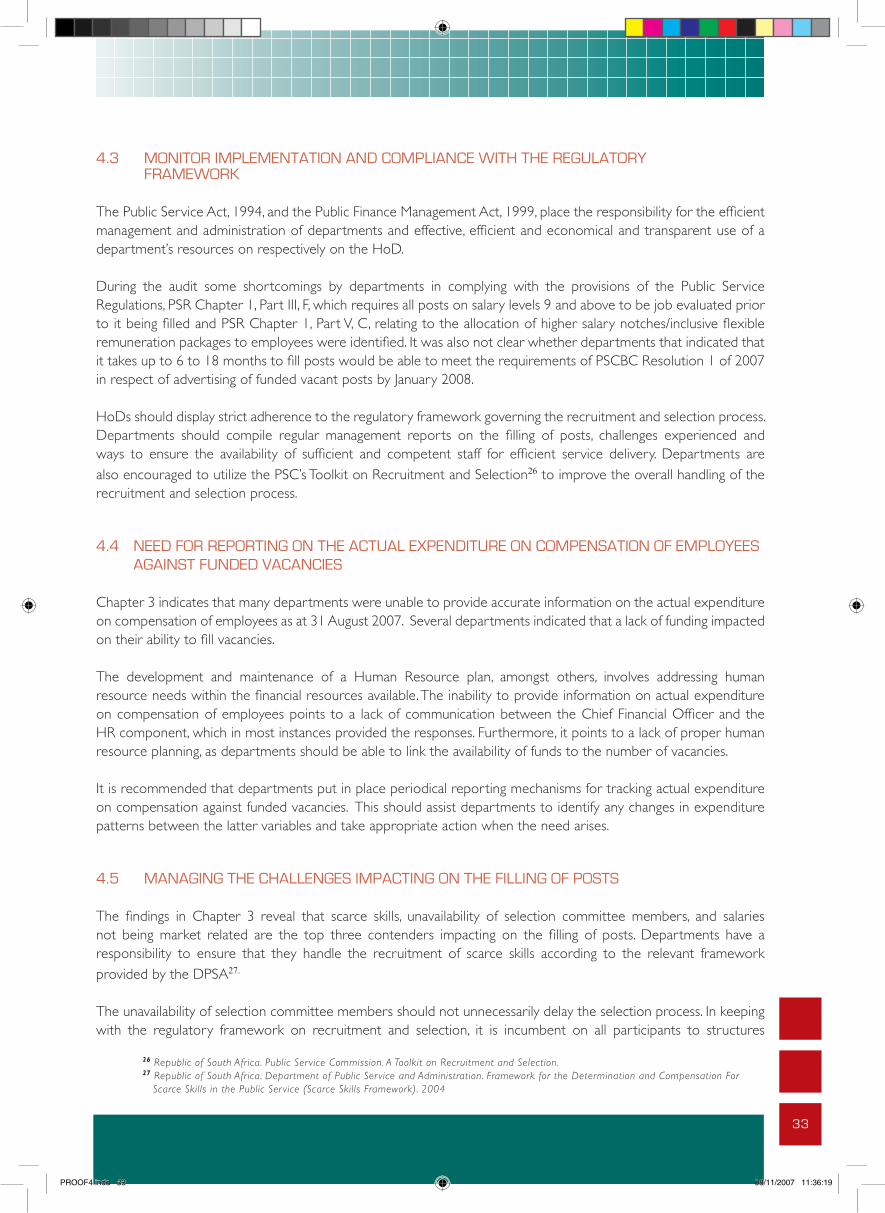
i
Public Service Commission
Guide on performance management forsocial development departments
Published in the Republic of South Africa by:
THE PUBLIC SERVICE COMMISSION (PSC)Commission House
Cnr. Hamilton & Ziervogel StreetsArcadia, 0083
Private Bag x121Pretoria, 0001
Tel. (012) 352-1000Fax (012) 325-8382
Website: www.opsc.gov.za
National Anti-Corruption Hotline Number: 0800 701 701 (Toll-Free)
Compiled by: Branch: Monitoring and Evaluation
Distribution by: Directorate: Communication and Information Services
ISBN: 0-621-37005-3RP: 10/2007
33
4.3 MONITOR IMPLEMENTATION AND COMPLIANCE WITH THE REGULATORY FRAMEWORK
The Public Service Act, 1994, and the Public Finance Management Act, 1999, place the responsibility for the efficient management and administration of departments and effective, efficient and economical and transparent use of a department’s resources on respectively on the HoD.
During the audit some shortcomings by departments in complying with the provisions of the Public Service Regulations, PSR Chapter 1, Part III, F, which requires all posts on salary levels 9 and above to be job evaluated prior to it being filled and PSR Chapter 1, Part V, C, relating to the allocation of higher salary notches/inclusive flexible remuneration packages to employees were identified. It was also not clear whether departments that indicated that it takes up to 6 to 18 months to fill posts would be able to meet the requirements of PSCBC Resolution 1 of 2007 in respect of advertising of funded vacant posts by January 2008.
HoDs should display strict adherence to the regulatory framework governing the recruitment and selection process. Departments should compile regular management reports on the filling of posts, challenges experienced and ways to ensure the availability of sufficient and competent staff for efficient service delivery. Departments are also encouraged to utilize the PSC’s Toolkit on Recruitment and Selection26 to improve the overall handling of the recruitment and selection process.
4.4 NEED FOR REPORTING ON THE ACTUAL EXPENDITURE ON COMPENSATION OF EMPLOYEES AGAINST FUNDED VACANCIES
Chapter 3 indicates that many departments were unable to provide accurate information on the actual expenditure on compensation of employees as at 31 August 2007. Several departments indicated that a lack of funding impacted on their ability to fill vacancies.
The development and maintenance of a Human Resource plan, amongst others, involves addressing human resource needs within the financial resources available. The inability to provide information on actual expenditure on compensation of employees points to a lack of communication between the Chief Financial Officer and the HR component, which in most instances provided the responses. Furthermore, it points to a lack of proper human resource planning, as departments should be able to link the availability of funds to the number of vacancies.
It is recommended that departments put in place periodical reporting mechanisms for tracking actual expenditure on compensation against funded vacancies. This should assist departments to identify any changes in expenditure patterns between the latter variables and take appropriate action when the need arises.
4.5 MANAGING THE CHALLENGES IMPACTING ON THE FILLING OF POSTS
The findings in Chapter 3 reveal that scarce skills, unavailability of selection committee members, and salaries not being market related are the top three contenders impacting on the filling of posts. Departments have a responsibility to ensure that they handle the recruitment of scarce skills according to the relevant framework provided by the DPSA27.
The unavailability of selection committee members should not unnecessarily delay the selection process. In keeping with the regulatory framework on recruitment and selection, it is incumbent on all participants to structures
26 Republic of South Afr ica. Public Ser vice Commission. A Toolkit on Recruitment and Selection. 27 Republic of South Afr ica. Department of Public Ser vice and Administration. Framework for the Determination and Compensation For Scarce Skills in the Public Ser vice (Scarce Skills Framework). 2004
PROOF4.indd 33 08/11/2007 11:36:19

34
ii
CONTENTSPage
EXECUTIVE SUMMARY iii
1 INTRODUCTION 1
1.1 Background 11.2 Problem statement 11.3 Scope 21.4 Methodology 21.5 Limitations 3
2. RELATIONSHIPS AND BOUNDARY SETTING 4
2.1 Constitutional framework 42.2 Legal Framework and Codes 62.3 Operational Framework and Practice 8
3. CURRENT STATE AND PERSPECTIVES 10
3.1 Executive Authorities (Ministers and MECs) 113.2 Deputy Ministers 153.3 Special Advisors 163.4 Heads of Department 17
4. COMPARATIVE INTERNATIONAL EXPERIENCES IN ROLE CLARIFICATION 19
involved in the recruitment and selection process to avail them selves during the process. Although managers are immersed in operational issues and regard the filling of posts as an add-on responsibility, there should be tighter monitoring of how they manage their units, with closer scrutiny of the filling of vacancies. Similarly, Human Resource managers should also comply with specific standards in the recruitment and selection process. To assist this process, departments should develop an accountability matrix to specify clearly the roles and responsibilities of Line Managers and those of human resources managers.
A good practice which certain departments have already introduced, is an approach whereby interviews are conducted after hours and in some instances during weekends. This practice seeks to ensure that service delivery is prioritized.
4.6 TAKING RETENTION TO THE NEXT LEVEL
The pre-1994 Public Service had strict policies in place that regulated personnel administration, e.g. Personnel Administration Standards. The latter provided for prerequisites for employment, particularly the number of years of experience. One of the major reasons for transforming the recruitment and selection process in the Public Service was the need to redress the imbalances of the past to achieve a public administration that is broadly representative of the South African people. The system of open competition came into being with the promulgation of the new regulatory framework, which provided for the mandatory advertisement of all vacant posts.
There is a direct relationship between the retention of staff and job-hopping and the system of open competition, since employees have many opportunities to move between departments to higher posts and negotiate higher salaries on the basis of offers made by other departments. The responses from the departments show that the retention of staff and job-hopping are important challenges impacting on the vacancy rate. In some instances employees remain in posts for a limited period (up to months) before they are appointed to advertised posts on a higher salary level.
In order to sensitize and guide departments about staff retention, the DPSA has published an information guide on managing the retention of employees. Departments should use this guide to develop retention strategies in an attempt to retain staff and to curb job hopping.
It is doubtful whether this is enough. For this reason, although the PSC does not suggest that rigid requirements regarding the number of years of experience similar to the repealed Public Administration Standards should be put in place, the DPSA should consider mechanisms that provides for career pathing opportunities based on competencies, experience and completion of compulsory training. While such a process might protract the turnaround time for the filling of posts this is offset by the fact that it will curb the high turnover and job hopping to some extent.
PROOF4.indd 34 08/11/2007 11:36:20
ii
CONTENTSPage
EXECUTIVE SUMMARY iii
1 INTRODUCTION 1
1.1 Background 11.2 Problem statement 11.3 Scope 21.4 Methodology 21.5 Limitations 3
2. RELATIONSHIPS AND BOUNDARY SETTING 4
2.1 Constitutional framework 42.2 Legal Framework and Codes 62.3 Operational Framework and Practice 8
3. CURRENT STATE AND PERSPECTIVES 10
3.1 Executive Authorities (Ministers and MECs) 113.2 Deputy Ministers 153.3 Special Advisors 163.4 Heads of Department 17
4. COMPARATIVE INTERNATIONAL EXPERIENCES IN ROLE CLARIFICATION 19
35
Ch
ap
ter
5
Conclusion
PROOF4.indd 35 08/11/2007 11:36:20

36
ii
CONTENTSPage
EXECUTIVE SUMMARY iii
1 INTRODUCTION 1
1.1 Background 11.2 Problem statement 11.3 Scope 21.4 Methodology 21.5 Limitations 3
2. RELATIONSHIPS AND BOUNDARY SETTING 4
2.1 Constitutional framework 42.2 Legal Framework and Codes 62.3 Operational Framework and Practice 8
3. CURRENT STATE AND PERSPECTIVES 10
3.1 Executive Authorities (Ministers and MECs) 113.2 Deputy Ministers 153.3 Special Advisors 163.4 Heads of Department 17
4. COMPARATIVE INTERNATIONAL EXPERIENCES IN ROLE CLARIFICATION 19
CHAPTER 5: CONCLUSION
Although this report identifies several limitations with respect to the accuracy of the data used, it brings to the fore some critical issues around the filling of posts in the Public Service. It shows that the provinces have high vacancy rates, but that they do not have specific strategies in place to effectively deal with the challenges that they face in the filling of posts. The report also reflects that although departments are able to report on their funded vacancies, there is no correlation between number of vacancies and the overall spending rate on the compensation of employees, as the spending rate is almost on par with the expected spending norm as at 31 August 2007. It is clear from the audit that departments need to put in place monitoring and reporting mechanisms to effectively report on and manage their vacancies. More significantly this audit highlights issues of non-compliance with regulatory requirements relating to the filling of posts, which invariably also impact negatively on the promotion of sound labour relations. Various recommendations have been made in this report in an attempt to address the shortcomings identified during the audit.
There is no doubt that the capacity of the Public Service to improve its delivery of services remains central in government’s efforts to provide a better life for all South Africans. However, if departments fail to or unnecessarily delay the filling of vacant posts, this denies the citizenry the promised better life. Therefore, as a starting point, departments need to respond with urgency to the filling of vacant posts and ensure that service delivery and the necessary capacity to make it possible is available so that they can realize the service delivery mandate of government.
PROOF4.indd 36 08/11/2007 11:36:20

ii
CONTENTSPage
EXECUTIVE SUMMARY iii
1 INTRODUCTION 1
1.1 Background 11.2 Problem statement 11.3 Scope 21.4 Methodology 21.5 Limitations 3
2. RELATIONSHIPS AND BOUNDARY SETTING 4
2.1 Constitutional framework 42.2 Legal Framework and Codes 62.3 Operational Framework and Practice 8
3. CURRENT STATE AND PERSPECTIVES 10
3.1 Executive Authorities (Ministers and MECs) 113.2 Deputy Ministers 153.3 Special Advisors 163.4 Heads of Department 17
4. COMPARATIVE INTERNATIONAL EXPERIENCES IN ROLE CLARIFICATION 19
37
An
nex
ure
A
Template on the Audit into the Progress with Regard to Vacancy Rates in all National and Provincial Departments
PROOF4.indd 37 08/11/2007 11:36:20
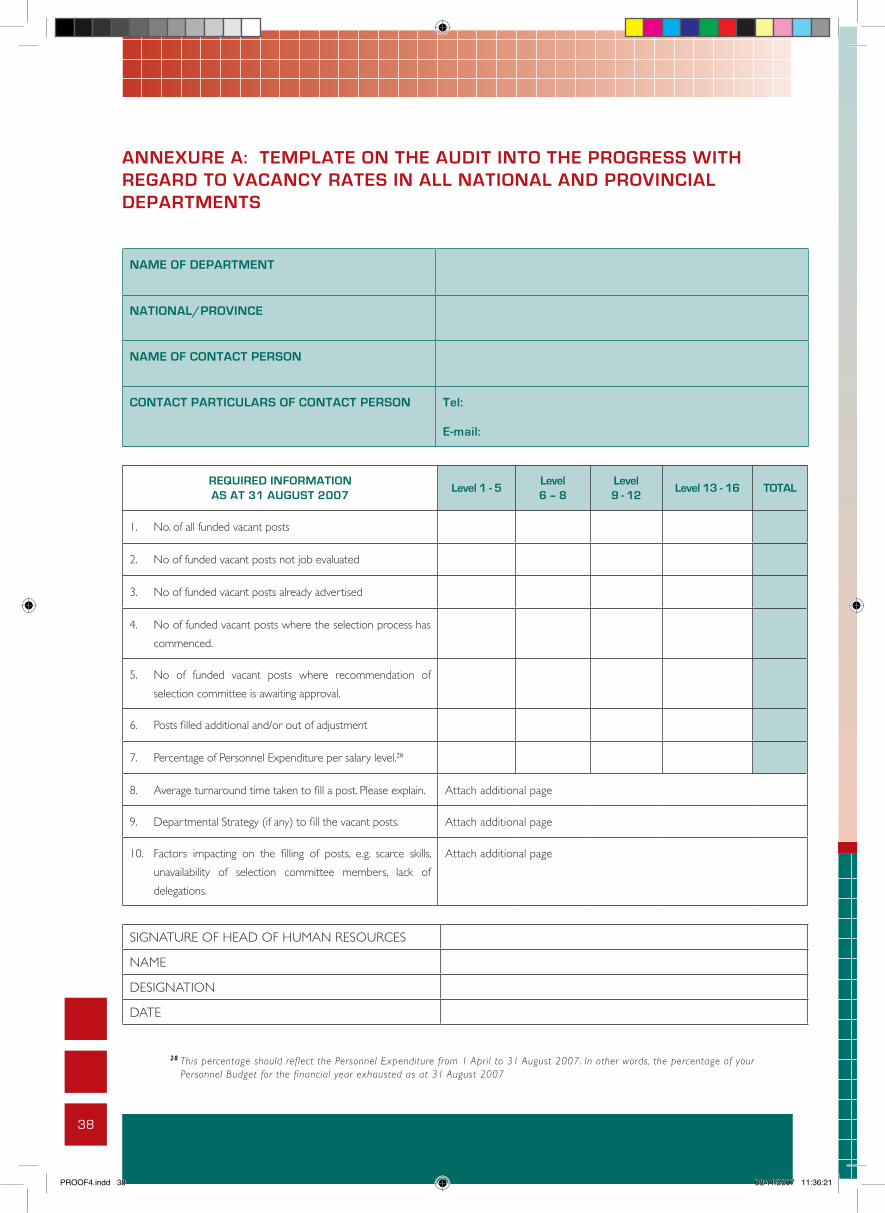
38
ii
CONTENTSPage
EXECUTIVE SUMMARY iii
1 INTRODUCTION 1
1.1 Background 11.2 Problem statement 11.3 Scope 21.4 Methodology 21.5 Limitations 3
2. RELATIONSHIPS AND BOUNDARY SETTING 4
2.1 Constitutional framework 42.2 Legal Framework and Codes 62.3 Operational Framework and Practice 8
3. CURRENT STATE AND PERSPECTIVES 10
3.1 Executive Authorities (Ministers and MECs) 113.2 Deputy Ministers 153.3 Special Advisors 163.4 Heads of Department 17
4. COMPARATIVE INTERNATIONAL EXPERIENCES IN ROLE CLARIFICATION 19
ANNEXURE A: TEMPLATE ON THE AUDIT INTO THE PROGRESS WITH REGARD TO VACANCY RATES IN ALL NATIONAL AND PROVINCIAL DEPARTMENTS
NAME OF DEPARTMENT
NATIONAL/PROVINCE
NAME OF CONTACT PERSON
CONTACT PARTICULARS OF CONTACT PERSON Tel:
E-mail:
REQUIRED INFORMATIONAS AT 31 AUGUST 2007
Level 1 - 5Level 6 – 8
Level 9 - 12
Level 13 - 16 TOTAL
1. No. of all funded vacant posts
2. No of funded vacant posts not job evaluated
3. No of funded vacant posts already advertised
4. No of funded vacant posts where the selection process has
commenced.
5. No of funded vacant posts where recommendation of
selection committee is awaiting approval.
6. Posts filled additional and/or out of adjustment
7. Percentage of Personnel Expenditure per salary level.28
8. Average turnaround time taken to fill a post. Please explain. Attach additional page
9. Departmental Strategy (if any) to fill the vacant posts. Attach additional page
10. Factors impacting on the filling of posts, e.g. scarce skills,
unavailability of selection committee members, lack of
delegations.
Attach additional page
SIGNATURE OF HEAD OF HUMAN RESOURCES
NAME
DESIGNATION
DATE
28 This percentage should reflect the Personnel Expenditure from 1 April to 31 August 2007. In other words, the percentage of your Personnel Budget for the financial year exhausted as at 31 August 2007
PROOF4.indd 38 08/11/2007 11:36:21

ii
CONTENTSPage
EXECUTIVE SUMMARY iii
1 INTRODUCTION 1
1.1 Background 11.2 Problem statement 11.3 Scope 21.4 Methodology 21.5 Limitations 3
2. RELATIONSHIPS AND BOUNDARY SETTING 4
2.1 Constitutional framework 42.2 Legal Framework and Codes 62.3 Operational Framework and Practice 8
3. CURRENT STATE AND PERSPECTIVES 10
3.1 Executive Authorities (Ministers and MECs) 113.2 Deputy Ministers 153.3 Special Advisors 163.4 Heads of Department 17
4. COMPARATIVE INTERNATIONAL EXPERIENCES IN ROLE CLARIFICATION 19
39
An
nex
ure
B
Breakdown of the Total Number of Funded Vacant Posts Reported by National and Provincial Departments, and theTotal Number of Funded Vacant Posts Reflected on PERSAL
PROOF4.indd 39 08/11/2007 11:36:21
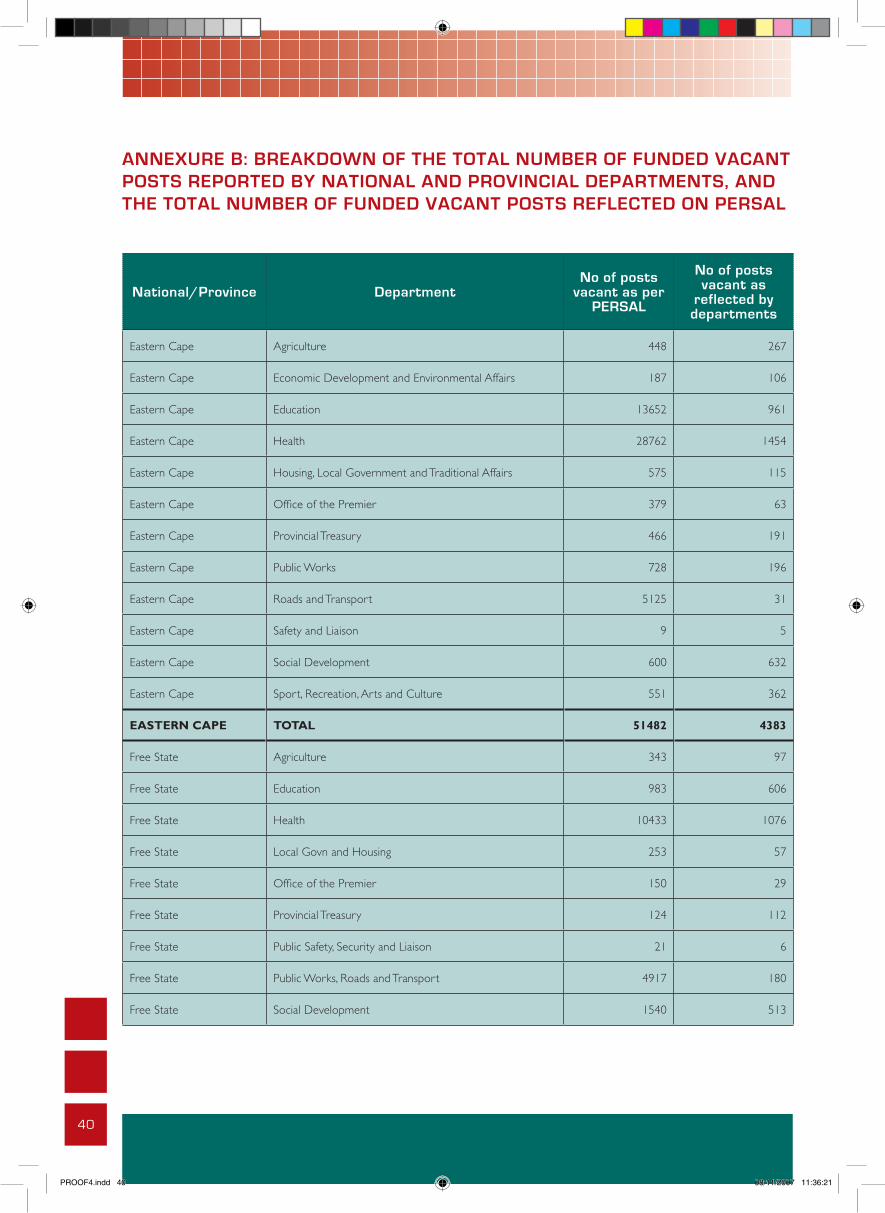
40
ANNEXURE B: BREAKDOWN OF THE TOTAL NUMBER OF FUNDED VACANT POSTS REPORTED BY NATIONAL AND PROVINCIAL DEPARTMENTS, AND THE TOTAL NUMBER OF FUNDED VACANT POSTS REFLECTED ON PERSAL
National/Province DepartmentNo of posts
vacant as per PERSAL
No of posts vacant as
reflected by departments
Eastern Cape Agriculture 448 267
Eastern Cape Economic Development and Environmental Affairs 187 106
Eastern Cape Education 13652 961
Eastern Cape Health 28762 1454
Eastern Cape Housing, Local Government and Traditional Affairs 575 115
Eastern Cape Office of the Premier 379 63
Eastern Cape Provincial Treasury 466 191
Eastern Cape Public Works 728 196
Eastern Cape Roads and Transport 5125 31
Eastern Cape Safety and Liaison 9 5
Eastern Cape Social Development 600 632
Eastern Cape Sport, Recreation, Arts and Culture 551 362
EASTERN CAPE TOTAL 51482 4383
Free State Agriculture 343 97
Free State Education 983 606
Free State Health 10433 1076
Free State Local Govn and Housing 253 57
Free State Office of the Premier 150 29
Free State Provincial Treasury 124 112
Free State Public Safety, Security and Liaison 21 6
Free State Public Works, Roads and Transport 4917 180
Free State Social Development 1540 513
PROOF4.indd 40 08/11/2007 11:36:21
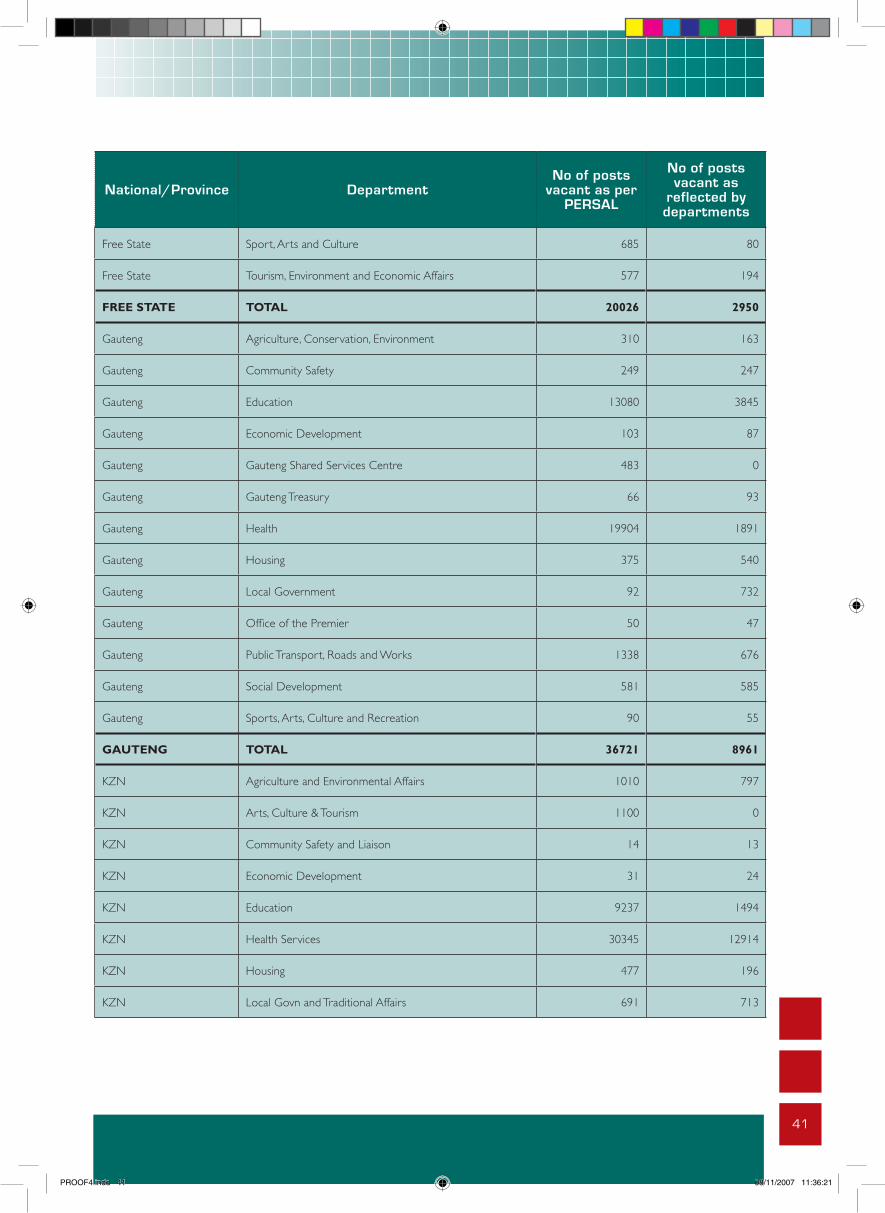
i
Public Service Commission
Guide on performance management forsocial development departments
Published in the Republic of South Africa by:
THE PUBLIC SERVICE COMMISSION (PSC)Commission House
Cnr. Hamilton & Ziervogel StreetsArcadia, 0083
Private Bag x121Pretoria, 0001
Tel. (012) 352-1000Fax (012) 325-8382
Website: www.opsc.gov.za
National Anti-Corruption Hotline Number: 0800 701 701 (Toll-Free)
Compiled by: Branch: Monitoring and Evaluation
Distribution by: Directorate: Communication and Information Services
ISBN: 0-621-37005-3RP: 10/2007
41
National/Province DepartmentNo of posts
vacant as per PERSAL
No of posts vacant as
reflected by departments
Free State Sport, Arts and Culture 685 80
Free State Tourism, Environment and Economic Affairs 577 194
FREE STATE TOTAL 20026 2950
Gauteng Agriculture, Conservation, Environment 310 163
Gauteng Community Safety 249 247
Gauteng Education 13080 3845
Gauteng Economic Development 103 87
Gauteng Gauteng Shared Services Centre 483 0
Gauteng Gauteng Treasury 66 93
Gauteng Health 19904 1891
Gauteng Housing 375 540
Gauteng Local Government 92 732
Gauteng Office of the Premier 50 47
Gauteng Public Transport, Roads and Works 1338 676
Gauteng Social Development 581 585
Gauteng Sports, Arts, Culture and Recreation 90 55
GAUTENG TOTAL 36721 8961
KZN Agriculture and Environmental Affairs 1010 797
KZN Arts, Culture & Tourism 1100 0
KZN Community Safety and Liaison 14 13
KZN Economic Development 31 24
KZN Education 9237 1494
KZN Health Services 30345 12914
KZN Housing 477 196
KZN Local Govn and Traditional Affairs 691 713
PROOF4.indd 41 08/11/2007 11:36:21
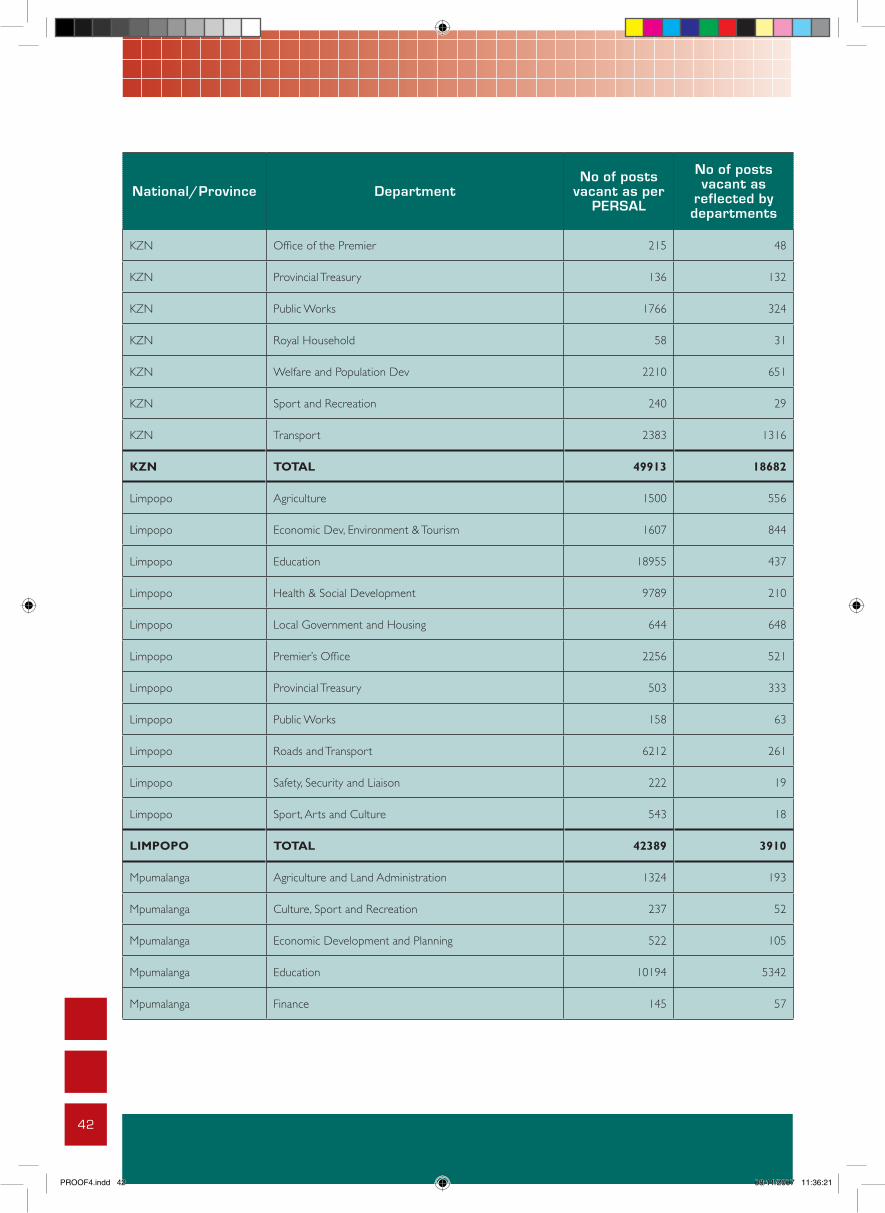
42
National/Province DepartmentNo of posts
vacant as per PERSAL
No of posts vacant as
reflected by departments
KZN Office of the Premier 215 48
KZN Provincial Treasury 136 132
KZN Public Works 1766 324
KZN Royal Household 58 31
KZN Welfare and Population Dev 2210 651
KZN Sport and Recreation 240 29
KZN Transport 2383 1316
KZN TOTAL 49913 18682
Limpopo Agriculture 1500 556
Limpopo Economic Dev, Environment & Tourism 1607 844
Limpopo Education 18955 437
Limpopo Health & Social Development 9789 210
Limpopo Local Government and Housing 644 648
Limpopo Premier’s Office 2256 521
Limpopo Provincial Treasury 503 333
Limpopo Public Works 158 63
Limpopo Roads and Transport 6212 261
Limpopo Safety, Security and Liaison 222 19
Limpopo Sport, Arts and Culture 543 18
LIMPOPO TOTAL 42389 3910
Mpumalanga Agriculture and Land Administration 1324 193
Mpumalanga Culture, Sport and Recreation 237 52
Mpumalanga Economic Development and Planning 522 105
Mpumalanga Education 10194 5342
Mpumalanga Finance 145 57
PROOF4.indd 42 08/11/2007 11:36:21

i
Public Service Commission
Guide on performance management forsocial development departments
Published in the Republic of South Africa by:
THE PUBLIC SERVICE COMMISSION (PSC)Commission House
Cnr. Hamilton & Ziervogel StreetsArcadia, 0083
Private Bag x121Pretoria, 0001
Tel. (012) 352-1000Fax (012) 325-8382
Website: www.opsc.gov.za
National Anti-Corruption Hotline Number: 0800 701 701 (Toll-Free)
Compiled by: Branch: Monitoring and Evaluation
Distribution by: Directorate: Communication and Information Services
ISBN: 0-621-37005-3RP: 10/2007
43
National/Province DepartmentNo of posts
vacant as per PERSAL
No of posts vacant as
reflected by departments
Mpumalanga Health and Social Services 10256 1149
Mpumalanga Local Government and Housing 326 44
Mpumalanga Office of the Premier 31 89
Mpumalanga Public Works 1260 290
Mpumalanga Roads and Transport 1108 1077
Mpumalanga Safety and Security 77 19
MPUMALANGA TOTAL 25480 8417
North West Agriculture 1079 349
North West Developmental Local Government and Housing 385 167
North West Economic Development and Tourism 110 98
North West Education 6828 5
North West Finance 276 271
North West Health 4880 2959
North West Office of the Premier 173 132
North West Public Works 552 554
North West Social Development 2043 499
North West Sport, Arts and Culture 810 150
North West Transport, Roads and Community Safety 1648 54
NORTH WEST TOTAL 18784 5238
Northern Cape Agriculture and Land Reform 288 51
Northern Cape Economic Affairs 69 25
Northern Cape Education 2432 253
Northern Cape Health 3866 746
Northern Cape Housing and Local Government 282 72
Northern Cape Office of the Premier 183 199
PROOF4.indd 43 08/11/2007 11:36:22
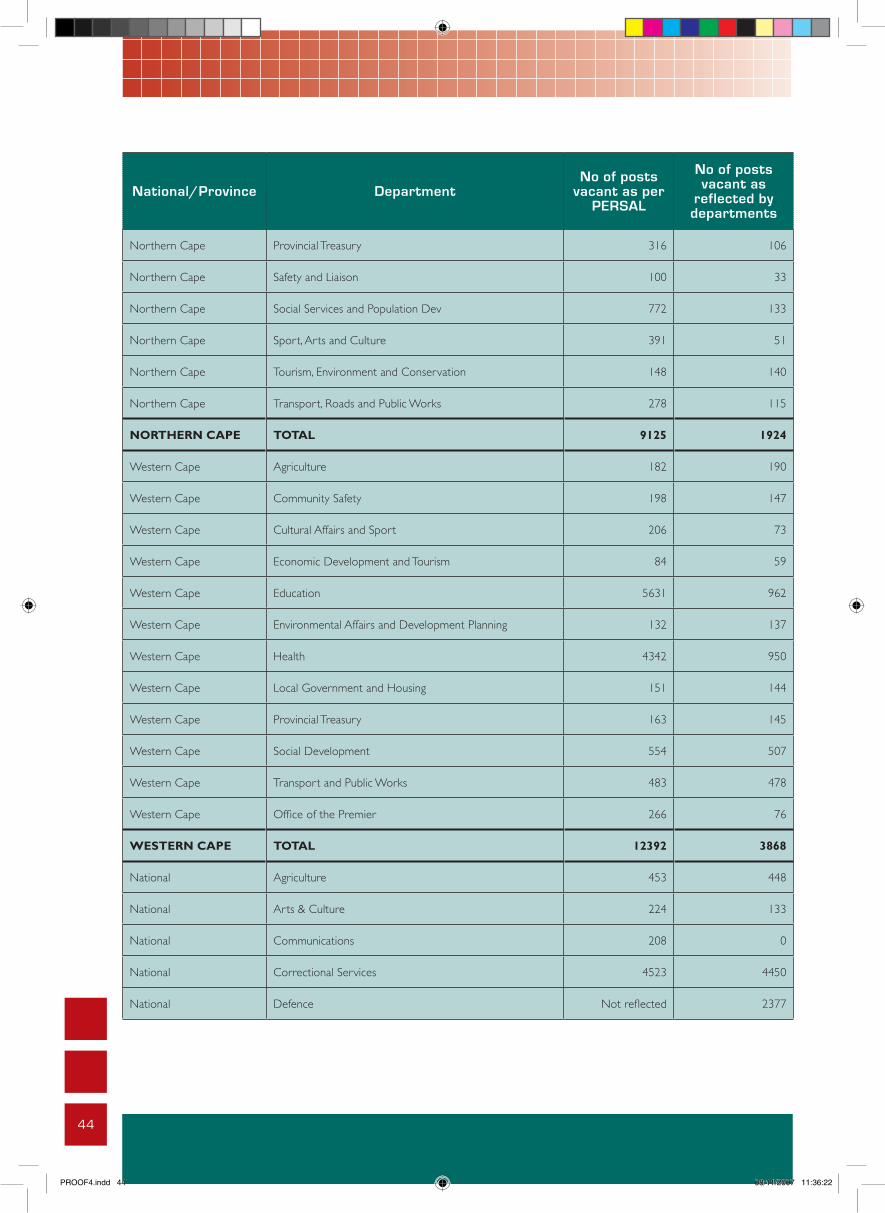
44
National/Province DepartmentNo of posts
vacant as per PERSAL
No of posts vacant as
reflected by departments
Northern Cape Provincial Treasury 316 106
Northern Cape Safety and Liaison 100 33
Northern Cape Social Services and Population Dev 772 133
Northern Cape Sport, Arts and Culture 391 51
Northern Cape Tourism, Environment and Conservation 148 140
Northern Cape Transport, Roads and Public Works 278 115
NORTHERN CAPE TOTAL 9125 1924
Western Cape Agriculture 182 190
Western Cape Community Safety 198 147
Western Cape Cultural Affairs and Sport 206 73
Western Cape Economic Development and Tourism 84 59
Western Cape Education 5631 962
Western Cape Environmental Affairs and Development Planning 132 137
Western Cape Health 4342 950
Western Cape Local Government and Housing 151 144
Western Cape Provincial Treasury 163 145
Western Cape Social Development 554 507
Western Cape Transport and Public Works 483 478
Western Cape Office of the Premier 266 76
WESTERN CAPE TOTAL 12392 3868
National Agriculture 453 448
National Arts & Culture 224 133
National Communications 208 0
National Correctional Services 4523 4450
National Defence Not reflected 2377
PROOF4.indd 44 08/11/2007 11:36:22
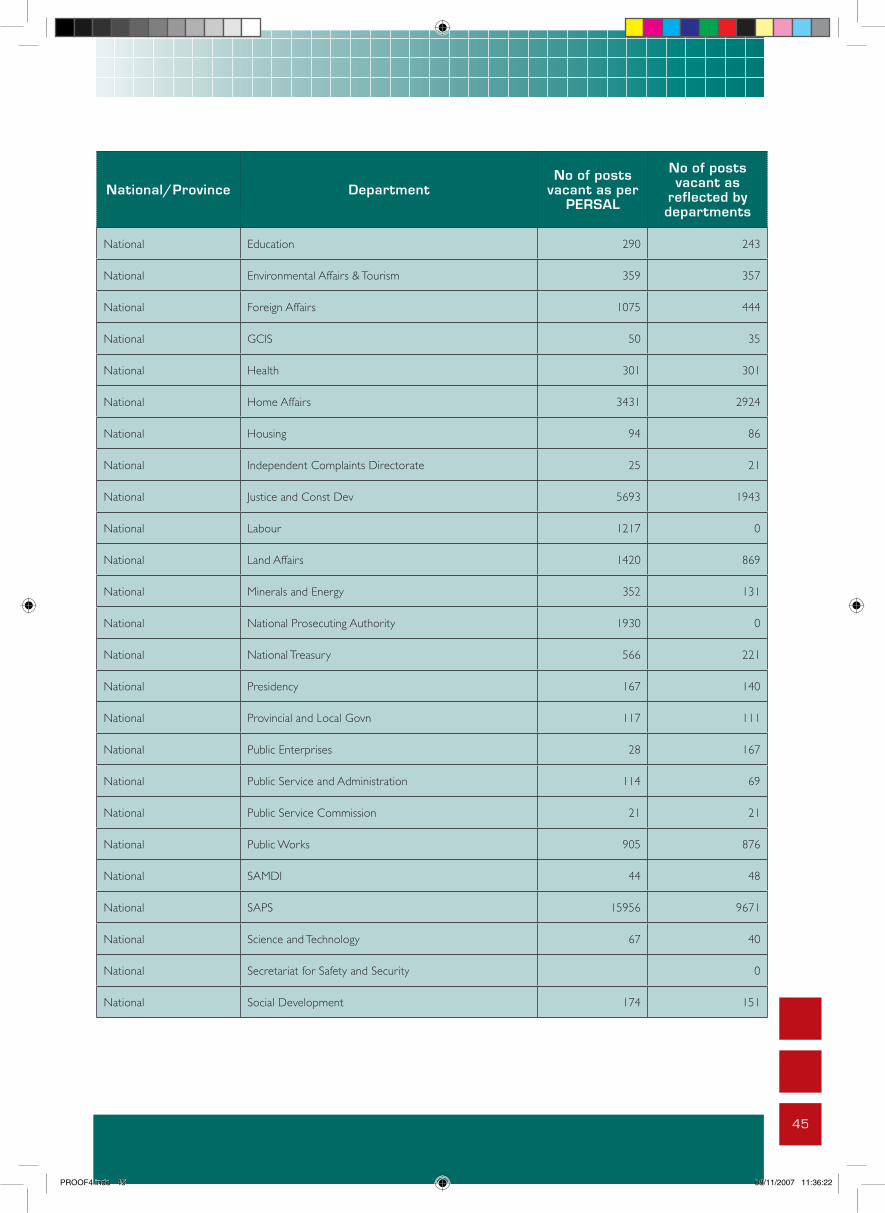
i
Public Service Commission
Guide on performance management forsocial development departments
Published in the Republic of South Africa by:
THE PUBLIC SERVICE COMMISSION (PSC)Commission House
Cnr. Hamilton & Ziervogel StreetsArcadia, 0083
Private Bag x121Pretoria, 0001
Tel. (012) 352-1000Fax (012) 325-8382
Website: www.opsc.gov.za
National Anti-Corruption Hotline Number: 0800 701 701 (Toll-Free)
Compiled by: Branch: Monitoring and Evaluation
Distribution by: Directorate: Communication and Information Services
ISBN: 0-621-37005-3RP: 10/2007
45
National/Province DepartmentNo of posts
vacant as per PERSAL
No of posts vacant as
reflected by departments
National Education 290 243
National Environmental Affairs & Tourism 359 357
National Foreign Affairs 1075 444
National GCIS 50 35
National Health 301 301
National Home Affairs 3431 2924
National Housing 94 86
National Independent Complaints Directorate 25 21
National Justice and Const Dev 5693 1943
National Labour 1217 0
National Land Affairs 1420 869
National Minerals and Energy 352 131
National National Prosecuting Authority 1930 0
National National Treasury 566 221
National Presidency 167 140
National Provincial and Local Govn 117 111
National Public Enterprises 28 167
National Public Service and Administration 114 69
National Public Service Commission 21 21
National Public Works 905 876
National SAMDI 44 48
National SAPS 15956 9671
National Science and Technology 67 40
National Secretariat for Safety and Security 0
National Social Development 174 151
PROOF4.indd 45 08/11/2007 11:36:22
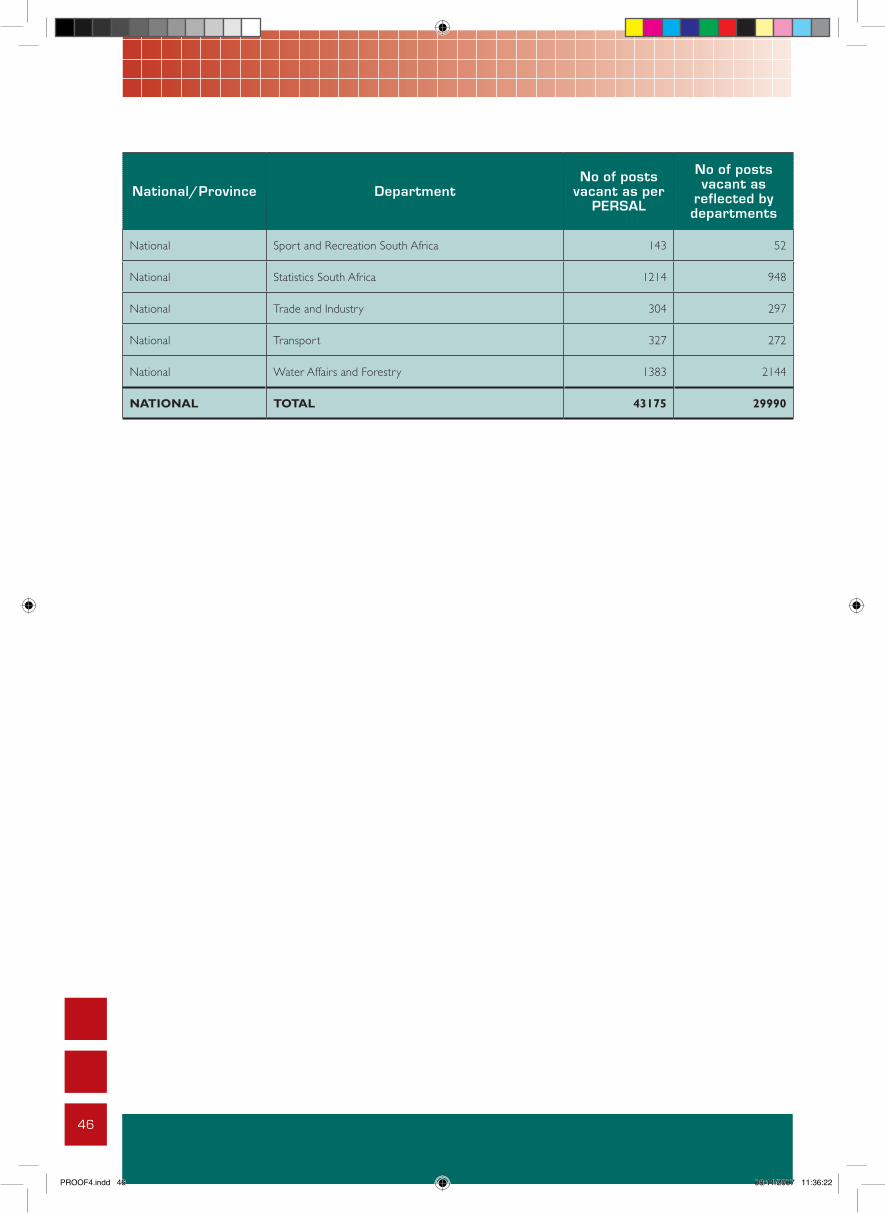
46
National/Province DepartmentNo of posts
vacant as per PERSAL
No of posts vacant as
reflected by departments
National Sport and Recreation South Africa 143 52
National Statistics South Africa 1214 948
National Trade and Industry 304 297
National Transport 327 272
National Water Affairs and Forestry 1383 2144
NATIONAL TOTAL 43175 29990
PROOF4.indd 46 08/11/2007 11:36:22