department-owned facilities
TRANSCRIPT

15FY 2018 Annual Report
ENTERPRISE TOLL OPERATIONS
Florida Department of Transportation
Alligator Alley Page 17• $32.8 million total toll revenue• 9.7 million total transactions• SunPass® participation increased to 66.6 percent
during the year
Pinellas Bayway System Page 27 • $5.1 million total toll revenue• 9.9 million total transactions• SunPass® participation increased to 71.1 percent
during the year
Sunshine Skyway Bridge Page 39 • $26.7 million total toll revenue• 22.2 million total transactions• SunPass® participation increased to 64.3 percent
during the year
Wekiva Parkway Page 49• $878 thousand total toll revenue• 1.1 million total transactions• SunPass® participation increased to 86.4
during the year
Department-owned Facilities

16 FY 2018 Annual Report
ENTERPRISE TOLL OPERATIONS
Florida Department of Transportation
THIS PAGE INTENTIONALLY LEFT BLANK
17FY 2018 Annual Report Alligator Alley
ENTERPRISE TOLL OPERATIONS
Florida Department of Transportation
17
Alligator Alley2.1 BACKGROUND Alligator Alley was originally constructed as a two-lane, controlled access, 78-mile toll facility connecting the southwestern coastal areas of Collier and Lee Counties (Naples and Fort Myers) to the southeastern coastal areas of Broward and Miami-Dade Counties (Fort Lauderdale and Miami).
During the late 1970’s and early 1980’s, the Department completed construction of the I-75 corridor on the west coast between Tampa and Naples. Additionally, from 1986 to 1992, the Department widened Alligator Alley to four lanes and made it a limited-access, tolled, interstate facility (I-75) that is part of the Strategic Intermodal System (SIS). The facility was constructed with a mainline plaza located at each end of the facility, and two intermediate toll-free interchanges. The East mainline plaza is located in Broward County near the US 27 interchange, while the West mainline plaza is located in Collier County near the CR 951 interchange. The two intermediate toll-free interchanges are located at SR 29, the route to Immokalee; and CR 833, serving the Miccosukee Indian Reservation.
The original toll configuration on Alligator Alley (payment made at the two mainline plazas in both directions) was converted to the one-stop toll configuration in May 1999. Under the one-stop toll configuration, a toll is collected at the West Plaza from vehicles traveling eastbound. The same toll is collected for the westbound traffic at the East plaza. With one-stop tolling, transactions on Alligator Alley decrease, but the total toll incurred to travel on the facility remains the same, thereby not impacting revenues.
The first toll rate increase since the facility opened to traffic in 1969 was implemented in February 2006. Toll rates were further adjusted in June 2012 (FY 2012) as toll indexing was implemented. SunPass® toll rates are indexed each year while cash rates are indexed every five years to pace with the rounding of the cash toll rate in quarter increments. Both SunPass® and cash toll rates were adjusted on October 29, 2017. For two-axle vehicles, the SunPass® toll increased from $2.90 to $2.94, while the cash toll increased from $3.00 to $3.25. Figure 2.1 shows a detailed map of the facility with the most recent toll rates effective on October 29, 2017.
Alligator Alley annual traffic and toll revenue from FY 2008 through FY 2018 are presented in Table 2.1. For this period, revenues have increased by 49.6 percent overall while transactions grew by 22.7 percent overall. This
Table 2.1 - Alligator Alley Historical Transactions and Revenue Growth
FY 2008 through FY 2018
Fiscal Year
Transactions (000)Toll Revenue(1)
($000)Average
TollToll
PayingNon
Revenue TotalPercent Change Amount
Percent Change
2008 7,919 14 7,933 - $21,962 - $2.768
2009 7,193 76 7,269 (8.4%) 19,384 (11.7%) 2.667
2010 7,530 24 7,554 3.9 19,962 3.0 2.643
2011 7,449 22 7,471 (1.1) 19,737 (1.1) 2.642
2012 7,492 32 7,524 0.7 19,647 (0.5) 2.611
2013 7,529 37 7,566 0.6 25,115 27.8 3.319
2014 7,962 38 8,000 5.7 26,711 6.4 3.339
2015 8,471 39 8,510 6.4 28,535 6.8 3.353
2016 9,134 35 9,169 7.7 30,523 7.0 3.329
2017 9,453 146 9,599 4.7 32,200 5.5 3.355
2018 9,444 289 9,733 1.4 32,845 2.0 3.375
Source: FDOT Office of the Comptroller and Turnpike Enterprise Finance Office.Note: The non-revenue class includes authorized vehicles that pass through a toll plaza without incurring a toll (i.e., law enforcement, emergency vehicles) and transactions reported during toll suspensions attributable to hurricanes.(1) Per new revenue reporting methodology, starting FY 2014 toll revenue excludes violation and miscellaneous revenues, which are immaterial to toll revenues reported within.

18 FY 2018 Annual ReportAlligator Alley
ENTERPRISE TOLL OPERATIONS
Florida Department of Transportation
CH
AR
LOTT
E
LEE
GLA
DES
HEN
DR
Y
PALM
BE
AC
H
BRO
WAR
D
MIA
MI-D
AD
EM
ON
RO
E
CO
LLIE
R
ATLA
NTI
CO
CE
AN
Orla
ndo
Tam
pa
Alli
gato
r Alle
y
Fort
Mye
rs
Ft. M
yers
SOU
RC
E:
Flor
ida
Dep
artm
ent o
f Tr
ansp
orta
tion
2018
; N
AVTE
Q/H
ERE
2017
05
10M
iles
41
Mia
mi
WES
TPL
AZA
EAST
PLA
ZA
GU
LFO
FM
EX
ICO
Biscayne Bay
Lake
Oke
echo
bee
Cap
eC
oral
La B
elle
Bel
leG
lade
Wes
t Pal
mB
each
Del
ray
Bea
ch Fort
Laud
erda
le
Mia
mi
Mia
mi
Bea
ch
Hom
este
ad
Nap
les
Mar
coIs
land
Ever
glad
es
Faka
hatc
hee
Stra
ndPr
eser
veSt
ate
Park
Big
Cyp
ress
Nat
iona
l Pre
serv
e
Ever
glad
es N
atio
nal P
ark
41
41
41
75
75
75
95
95
595
441
441
710
1
700
98
27
27
80
833
835
29
31
82
846
29
833
441
997
1
Inte
rsta
te H
ighw
ay
Prin
cipa
l Arte
rial
Min
or A
rteria
l
Cou
nty
Boun
dary
Oth
er R
oute
Allig
ator
Alle
y
Toll
Plaz
aIn
terc
hang
e
LEG
END
Turn
pike
Fac
ility
Oth
er T
olle
d R
oad
Oth
er T
olle
d Br
idge
45
45887 31
84
951
886
951
80
29
78
832
846
27
8025
880
80
9880
A1A
A1A
817
823
27 94
994
25
Imm
okal
ee
Figu
re 2
.1
Alli
gato
rA
lley
(I-75
)
L:\M
aps\
Tolls
TEA
R R
epor
t\Map
s\20
18\A
lliga
tor_
Alle
y.m
xd
EAST
BOU
ND
TO
LLS
SunP
ass
C
ash
$2.9
4
$3.
25
2 -
Axle
s$2
.94
$
3.25
E
ach
Addi
tiona
l Axl
e
WES
TBO
UN
D T
OLL
SSu
nPas
s
Cas
h$2
.94
$
3.25
2
- Ax
les
$2.9
4
$3.
25
Eac
h Ad
ditio
nal A
xle
19FY 2018 Annual Report
ENTERPRISE TOLL OPERATIONS
Florida Department of Transportation
Alligator Alley
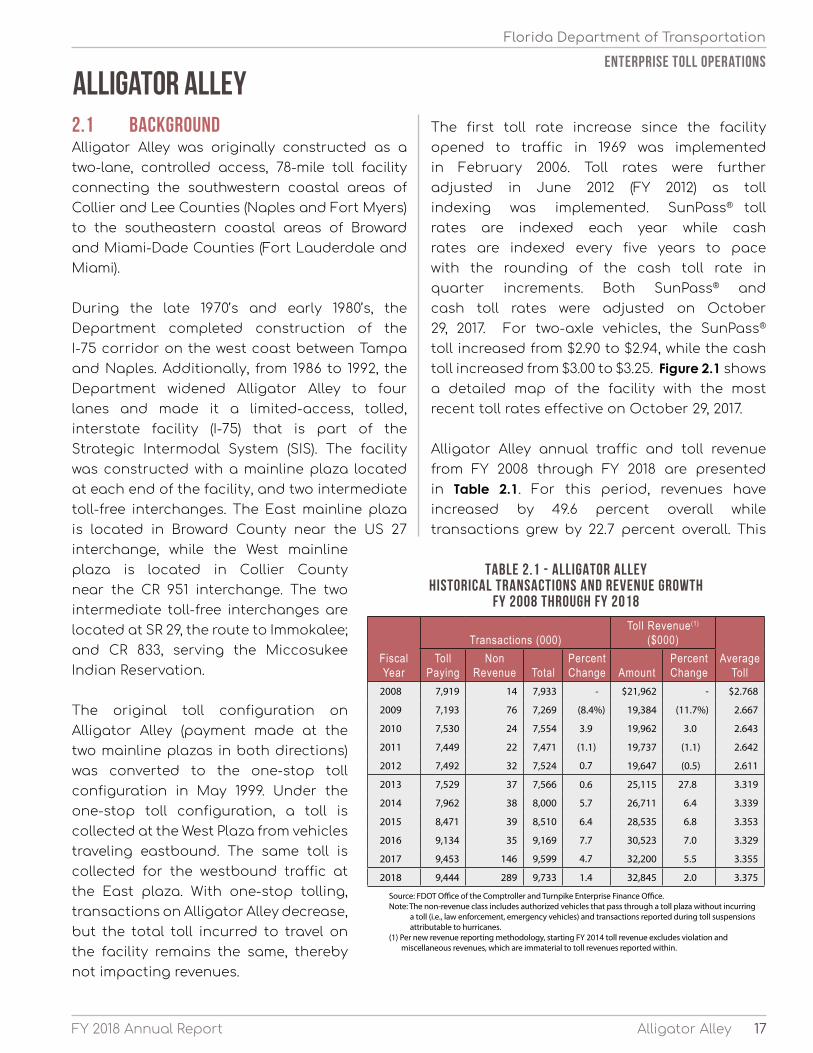
Maintenance of Alligator Alley, along with other portions of I-75, has been under private contract since the beginning of FY 2001, with the Department providing oversight through its Asset Management Coordinator. Maintenance activities include rest area preservation, mowing, canal and guardrail system upkeep, litter removal and repairs due to accidents. Road Ranger service is included under a separate contract, providing roadside assistance to stranded motorists as well as roadway debris removal.
2.2 FY 2018 TRANSACTIONS, REVENUES AND EXPENSES Monthly transactions and toll revenue on Alligator Alley during FY 2018 are presented in Table 2.3 and show the East and West mainline plazas, as well as system totals. Total transactions at the East plaza were just over 5.1 million for the year compared to 4.6 million at the West plaza, totaling approximately 9.7 million transactions on the facility for FY 2018. The corresponding revenues were
equates to an annual average growth rate of 4.1 percent for revenue and 2.1 percent for traffic. During the 10-year period, traffic and revenue were affected by both the toll rate adjustments and the downturn in the economy that was caused by the Great Recession. During FY 2018, tolls were suspended for fifteen days beginning on September 5, 2017, to aid in the evacuation and recovery efforts due to Hurricane Irma. This suspension resulted in an approximate $1.3 million revenue loss.
Historical operating and routine maintenance expenses from FY 2008 through FY 2018 are shown in Table 2.2. Operating expenses have increased from $3.5 million in FY 2008 to approximately $5.1 million in FY 2018. FY 2018 operating expenses increased 3.1 percent ($153 thousand) over FY 2017 operating expenses due to higher toll collection costs resulting from increased traffic growth.
During the same period, routine maintenance expenses increased from $2.1 million to $4.9 million. Combined, total O&M expenses increased from $5.5 million in FY 2008 to $10.0 million in FY 2018.
In addition to routine maintenance expenses, renewal and replacement and capital improvement periodic costs totaling $11.2 million were incurred primarily for a safety project, fencing and parking facility.
Table 2.2 - alligator alley Historical Operating and Routine
Maintenance Expenses FY 2008 through FY 2018
Fiscal Year
Operating Expense($000)
Routine Maintenance
Expense(1)
($000)
Total O&M Expenses
($000)2008 $3,460 $2,089 $5,549
2009 3,696 3,265 6,961
2010 3,085 3,262 6,347
2011 3,690 3,369 7,059
2012 3,781 3,409 7,190
2013 3,644 3,719 7,363
2014 4,007 4,252 8,259
2015 4,245 4,173 8,418
2016 4,507 4,225 8,732
2017 4,910 3,672 8,582
2018 5,063 4,910 9,973
Source: FDOT Office of the Comptroller.(1) Operating expense restated from FY 2014 through FY 2017.
20 FY 2018 Annual ReportAlligator Alley
ENTERPRISE TOLL OPERATIONS
Florida Department of Transportation
transactions.
The monthly seasonal transaction variation in FY 2018 is analyzed in Table 2.4. On average, 26,700 vehicles traveled through the East and West toll plazas each day. The seasonal transaction analysis identifies periods of the year when traffic exceeds or falls below the normal pattern observed on the facility under average conditions. Based on average daily transactions at the East and West plazas, March
approximately $17.4 million and $15.4 million at the East and West plazas, respectively, for a system-wide total of $32.8 million. The third quarter of FY 2018 (i.e., January through March) was the peak period for travel on the facility.
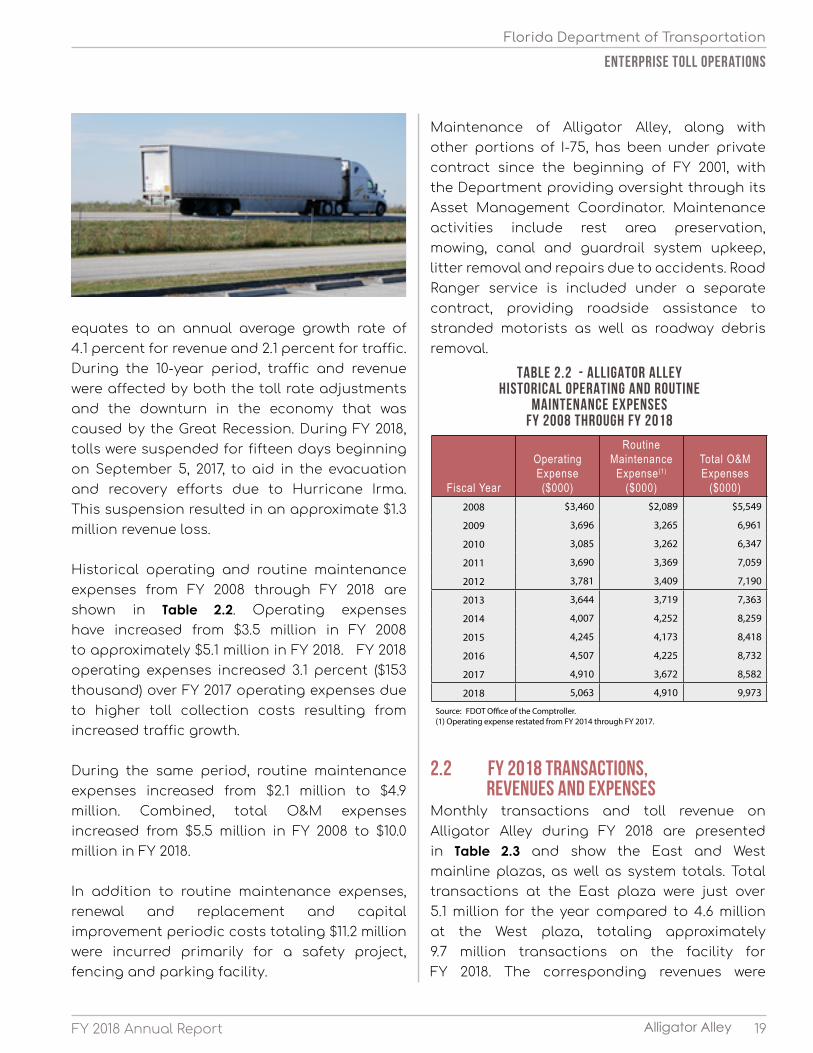
Transactions on Alligator Alley vary by time of day. Graph 2.1 shows the number of hourly weekday and weekend transactions of a typical week at the mainline plazas during FY 2018. Travel demand on the facility increases during the early morning hours and remains relatively high throughout the midday period, tapering off during the evening hours. For Alligator Alley, there is no clear morning or evening peak periods typical of commuter facilities. Instead, Alligator Alley serves long-distance trips between the southeastern and southwestern coasts of Florida. Due to recreational travel, weekend transactions tend to exceed weekday
Table 2.3 - Alligator alley Monthly Transactions and Toll Revenue
FY 2018
Month
Transactions(000) Toll Revenue($000)East
PlazaWest Plaza Total
East Plaza
West Plaza Total
July 2017 448 409 857 $1,514 $1,365 $2,879
August 400 360 760 1,385 1,232 2,617
September 353 277 630 675 599 1,274
1st Quarter Total 1,201 1,046 2,247 3,574 3,196 6,770
October 396 354 750 1,384 1,224 2,608
November 434 397 831 1,549 1,386 2,935
December 461 415 876 1,622 1,439 3,061
2nd Quarter Total 1,291 1,166 2,457 4,555 4,049 8,604
January 2018 432 390 822 1,549 1,362 2,911
February 423 379 802 1,494 1,329 2,823
March 494 448 942 1,737 1,535 3,272
3rd Quarter Total 1,349 1,217 2,566 4,780 4,226 9,006
April 441 399 840 1,556 1,376 2,932
May 421 381 802 1,501 1,323 2,824
June 430 391 821 1,439 1,270 2,709
4th Quarter Total 1,292 1,171 2,463 4,496 3,969 8,465
Annual Total 5,133 4,600 9,733 $17,405 $15,440 $32,845
Source: FDOT Office of the Comptroller (Annual Toll Revenue) and Turnpike Enterprise Finance Office.Note: Transactions represent toll-paying and non-revenue traffic at mainline plazas.
Table 2.4 - Alligator Alley Seasonal Transaction Variation
FY 2018
Month
Average Daily TransactionsSeasonal
FactorEast
PlazaWest Plaza Total
July 2017 14,400 13,200 27,600 1.03
August 12,900 11,600 24,500 0.92
September 11,800 9,200 21,000 0.79
October 12,800 11,400 24,200 0.91
November 14,500 13,200 27,700 1.04
December 14,900 13,400 28,300 1.06
January 2018 13,900 12,600 26,500 0.99
February 15,100 13,500 28,600 1.07
March 15,900 14,500 30,400 1.14
April 14,700 13,300 28,000 1.05
May 13,600 12,300 25,900 0.97
June 14,300 13,000 27,300 1.02
AADT 14,100 12,600 26,700 1.00
0
400
800
1,200
1,600
2,000
2,400
2,800
12:00AM
2:00AM
4:00AM
6:00AM
8:00AM
10:00AM
12:00PM
2:00PM
4:00PM
6:00PM
8:00PM
10:00PM
12:00AM
Tran
sact
ions
Time of DayWeekend Weekday
Graph 2.1 - Alligator Alley Typical Hourly Transactions
FY 2018
Source: Data obtained from Turnpike Enterprise Finance Office for the 7-day period beginning Monday, January 15, 2018.
21FY 2018 Annual Report Alligator Alley
ENTERPRISE TOLL OPERATIONS
Florida Department of Transportation
was the highest month at 14 percent above the average for the facility, while September was the lowest month at 21 percent below the average. September is typically the lowest month in south Florida due to fewer seasonal residents and tourists at that time of year.
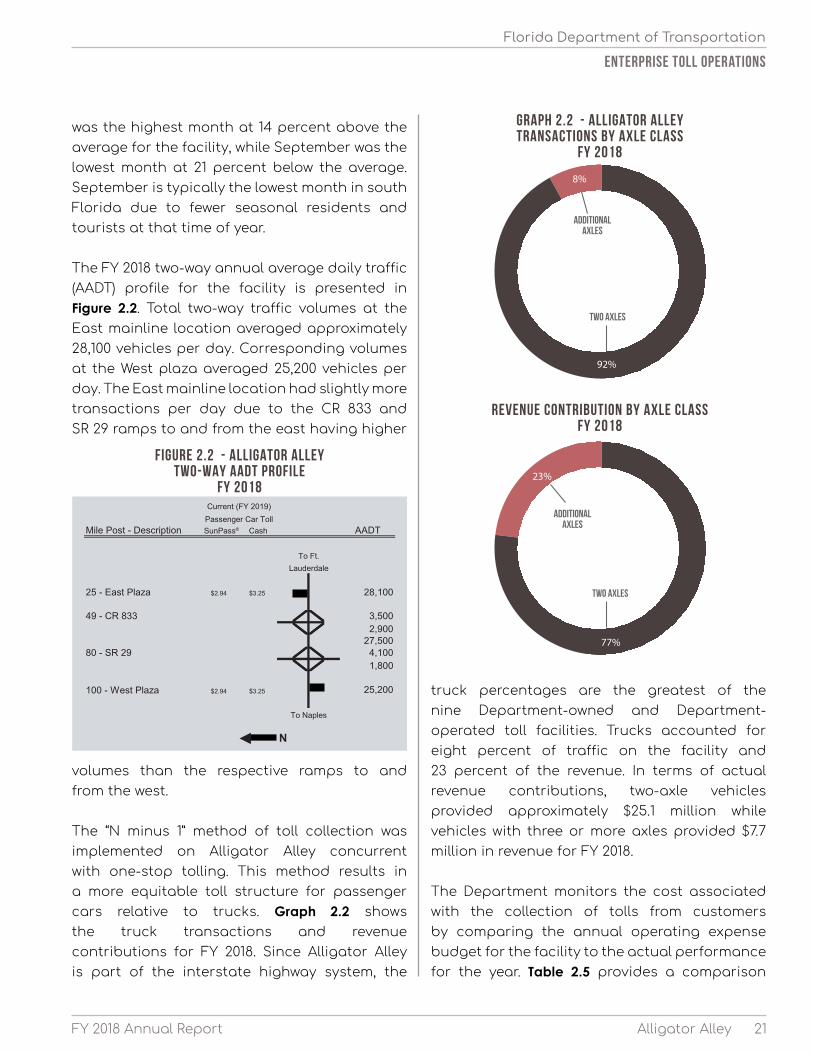
The FY 2018 two-way annual average daily traffic (AADT) profile for the facility is presented in Figure 2.2. Total two-way traffic volumes at the East mainline location averaged approximately 28,100 vehicles per day. Corresponding volumes at the West plaza averaged 25,200 vehicles per day. The East mainline location had slightly more transactions per day due to the CR 833 and SR 29 ramps to and from the east having higher
volumes than the respective ramps to and from the west.
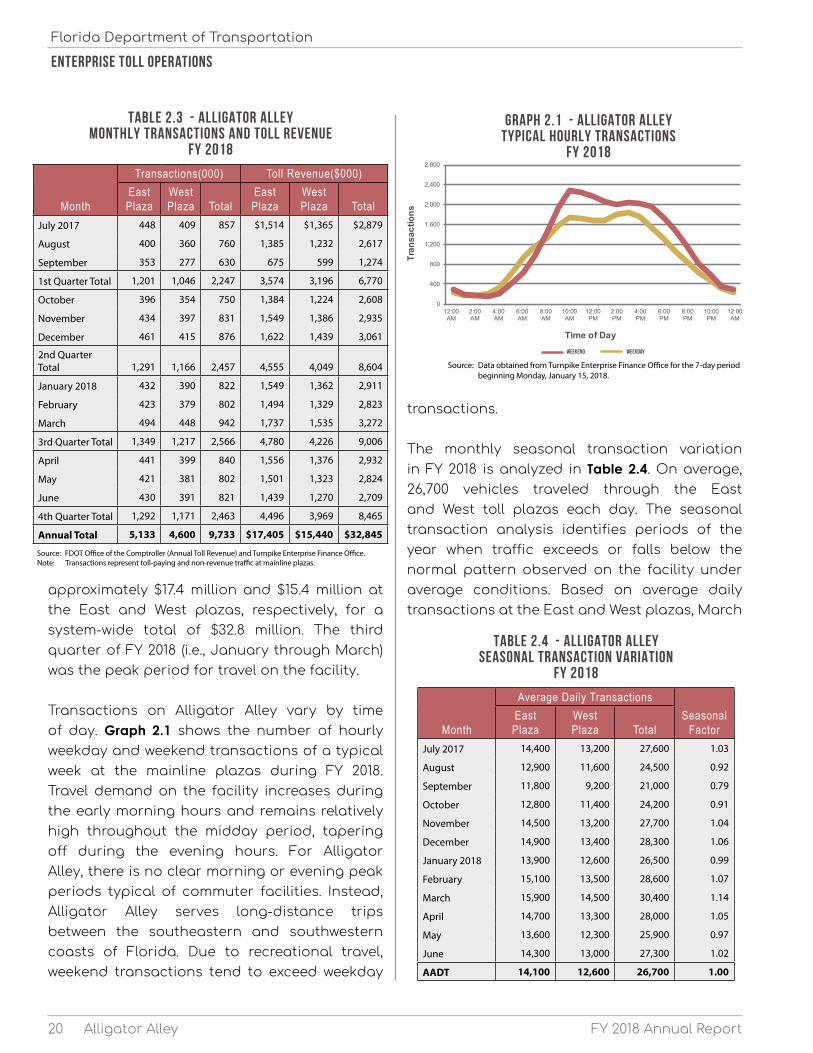
The “N minus 1” method of toll collection was implemented on Alligator Alley concurrent with one-stop tolling. This method results in a more equitable toll structure for passenger cars relative to trucks. Graph 2.2 shows the truck transactions and revenue contributions for FY 2018. Since Alligator Alley is part of the interstate highway system, the
truck percentages are the greatest of the nine Department-owned and Department-operated toll facilities. Trucks accounted for eight percent of traffic on the facility and 23 percent of the revenue. In terms of actual revenue contributions, two-axle vehicles provided approximately $25.1 million while vehicles with three or more axles provided $7.7 million in revenue for FY 2018.
The Department monitors the cost associated with the collection of tolls from customers by comparing the annual operating expense budget for the facility to the actual performance for the year. Table 2.5 provides a comparison
23%
77%
AdditionalAxles
Two Axles
8%
92%
AdditionalAxles
Two Axles
Revenue Contribution by Axle Class FY 2018
Graph 2.2 - Alligator Alley Transactions by Axle Class
FY 2018
Figure 2.2 - Alligator Alley Two-way AADT Profile
FY 2018

22 FY 2018 Annual ReportAlligator Alley
ENTERPRISE TOLL OPERATIONS
Florida Department of Transportation
between the FY 2018 actual and budgeted operating and routine maintenance expenses. Actual operating expenses were 2.3 percent more than the FY 2018 budget primarily due to higher costs associated with increased traffic growth. However, actual routine maintenance expenses were 20.5 percent higher due to timing differences that resulted in FY 2016 and FY 2017 budgeted expenses paid in FY 2018.
2.3 SUNPASS® SunPass® technology was implemented on Alligator Alley beginning in October 1999 (see Appendix A for current lane configurations).Table 2.6 shows transactions by payment method on Alligator Alley for FY 2018. SunPass® accounted for 66.6 percent of the total transactions in FY 2018, an increase from the 64.1 percent realized in FY 2017. Non-SunPass® transactions constituted the remaining 33.4 percent. Monthly SunPass® percentages ranged from approximately 64 percent to over 68 percent during the year. SunPass® participation on Alligator Alley is lower than most other Florida toll facilities due to fewer commuters using the facility.
Table 2.7 shows gross toll revenue by payment method. Revenue attributable to SunPass® was approximately $22.8 million, representing 69.3 percent of the total revenue in FY 2018. Monthly SunPass® revenue percentages ranged from 67 to 72 percent during the year. 2.4 NOTEWORTHY EVENTS
In 2007, the Legislature amended Section 338.165,
Table 2.5 - Alligator Alley Operating and Routine Maintenance Expenses
FY 2018
Type of ExpenseBudget($000)
Actual($000)
Over/ (Under)($000) Variance
Operating $4,950 $5,063 $113 2.3%
Routine Maintenance 4,076 4,910 834 20.5
Total $9,026 $9.973 $947 10.5%
Source: FDOT Office of the Comptroller, Turnpike Enterprise Finance Office and the FY 2017 Enterprise Toll Operations Traffic Engineer's Annual Report.
Table 2.6 - Alligator Alley Transactions by Payment Method
FY 2018
Month
Transactions (000)Percent
SunPass®SunPass®Non-
SunPass® TotalJuly 2017 579 278 857 67.6%
August 520 240 760 68.4
September 401 229 630 63.7
October 505 245 750 67.3
November 558 273 831 67.1
December 574 302 876 65.5
January 2018 539 283 822 65.6
February 523 279 802 65.2
March 615 327 942 65.3
April 562 278 840 66.9
May 547 255 802 68.2
June 560 261 821 68.2
Total 6,483 3,250 9,733
Percentage 66.6% 33.4% 100.0%
Source: Turnpike Enterprise Finance Office.
Table 2.7 - Alligator Alley Gross Toll Revenue by Payment Method
FY 2018
Month
Gross Toll Revenue ($000)Percent
SunPass®SunPass®Non-
SunPass® TotalJuly 2017 $2,018 $861 $2,879 70.1%
August 1,865 752 2,617 71.3
September 901 373 1,274 70.7
October 1,830 778 2,608 70.2
November 2,020 915 2,935 68.8
December 2,059 1,002 3,061 67.3
January 2018 1,976 935 2,911 67.9
February 1,908 915 2,823 67.6
March 2,215 1,057 3,272 67.7
April 2,046 886 2,932 69.8
May 1,975 849 2,824 69.9
June 1,951 758 2,709 72.0
Total $22,764 $10,081 $32,845
Percentage 69.3% 30.7% 100.0%
Source: FDOT Office of the Comptroller (Annual Toll Revenue) and Turnpike Enterprise Finance Office.

23FY 2018 Annual Report Alligator Alley
ENTERPRISE TOLL OPERATIONS
Florida Department of Transportation
Florida Statutes, to require the Turnpike System and other FDOT-owned facilities to index toll rates on existing toll facilities to the annual Consumer Price Index (CPI) from the prior calendar year. Toll rate adjustments for inflation may be made no more frequently than once a year (i.e., SunPass® toll rates) and must be made no less frequently than once every five years (i.e., cash toll rates) as necessary to accommodate cash toll rate schedules. Toll rates may be adjusted beyond these limits as directed by bond documents, covenants, or governing body authorization or pursuant to Department administrative rule.
For the prior calendar year, CPI of 1.3 percent prompts a $0.04 increase at the east and west toll plazas for two-axle toll rates for SunPass® customers. Furthermore, cash toll rates, last increased in 2012, experience the fifth-year CPI increase (6.6 percent for prior 5-year period rounded to the quarter) of $0.25 for two-axle vehicles. This most recent indexing is effective as of October 29, 2017 (FY 2018).
2.5 TRAFFIC, REVENUE AND EXPENSE FORECASTS The ratio between historical traffic growth and population growth is used along with projected population growth as a guideline to estimate future traffic on Alligator Alley. Historical population growth focused on the four counties that have a significant regional impact on Alligator Alley traffic. These counties are Broward, Collier, Lee and Miami-Dade. Since Alligator Alley is part of the interstate system, the statewide population growth was also considered.
From FY 2010 (i.e., post-recession) through FY 2018, the annual compounded
traffic growth rate on the Alligator Alley was approximately 3.2 percent, whereas, the historical annual compounded population growth rate for the same period for the four counties was 1.3 percent.
Future population estimates have been calculated based on medium projections from the most recent publication by the Bureau of Economic and Business Research (BEBR), College of Business Administration at the University of Florida. The corresponding estimated annual population growth rate through 2030 for the four counties is 1.3 percent, as previously shown in Table 1.3. The historical ratio of traffic growth to population growth for the period FY 2010 to FY 2017 was estimated at 2.5. This ratio was applied to projected population growth rates to obtain a general guideline to estimate future annual traffic growth on the Alligator Alley. Traffic profiles are provided in Appendix B.
Table 2.8 - Alligator Alley Traffic and Gross Toll Revenue Forecasts
FY 2019 through FY 2029
Fiscal Year
Total Traffic (000)
Toll Revenue ($000)Toll Revenue Comparisons
($000)Revenue
with Constant
Tolls(1)Indexing Impact
Gross Toll Revenue
2017 Annual Report
Forecast
Variance
Amount Percent2019 10,022 $35,038 0 $35,038 $35,314 ($276) (0.8%)
2020 10,305 36,115 $334 36,449 36,387 62 0.2
2021 10,534 36,909 683 37,592 37,431 161 0.4
2022 10,748 37,648 1,057 38,705 38,515 190 0.5
2023 10,966 38,401 2,227 40,628 40,434 194 0.5
2024 11,181 39,092 2,647 41,739 41,590 149 0.4
2025 11,371 39,756 3,084 42,840 42,724 116 0.3
2026 11,554 40,392 3,537 43,929 43,837 92 0.2
2027 11,731 40,998 4,021 45,019 44,953 66 0.1
2028 11,906 41,613 5,308 46,921 46,865 56 0.1
2029 12,081 42,196 5,826 48,022 N/A N/A N/A
Note: Total traffic corresponds to the gross toll revenue.N/A The FY 2017 Traffic Engineer's Annual Report forecast went through FY 2028.
(1) Toll revenue forecast without indexing.
24 FY 2018 Annual Report
ENTERPRISE TOLL OPERATIONS
Florida Department of Transportation
Alligator Alley
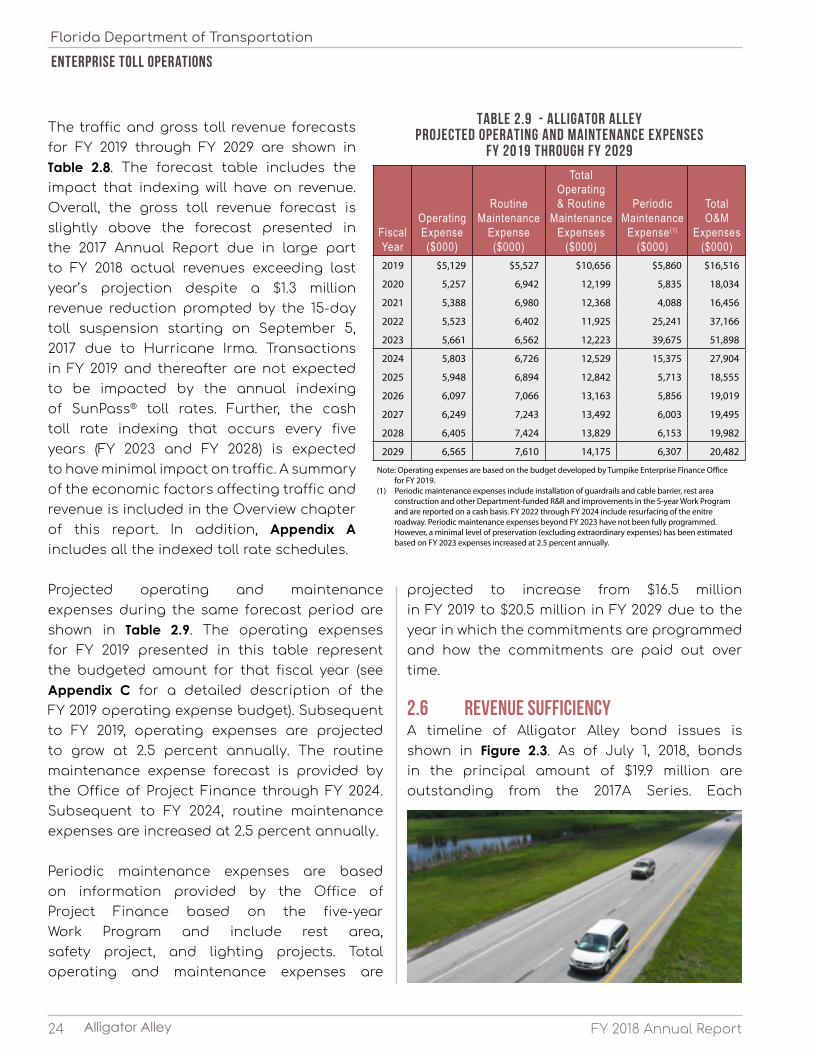
projected to increase from $16.5 million in FY 2019 to $20.5 million in FY 2029 due to the year in which the commitments are programmed and how the commitments are paid out over time.
2.6 REVENUE SUFFICIENCY A timeline of Alligator Alley bond issues is shown in Figure 2.3. As of July 1, 2018, bonds in the principal amount of $19.9 million are outstanding from the 2017A Series. Each
Table 2.9 - Alligator Alley Projected Operating and Maintenance Expenses
FY 2019 through FY 2029
Fiscal Year
Operating Expense($000)
Routine Maintenance
Expense($000)
Total Operating & Routine
Maintenance Expenses
($000)
Periodic Maintenance
Expense(1)
($000)
Total O&M
Expenses($000)
2019 $5,129 $5,527 $10,656 $5,860 $16,516
2020 5,257 6,942 12,199 5,835 18,034
2021 5,388 6,980 12,368 4,088 16,456
2022 5,523 6,402 11,925 25,241 37,166
2023 5,661 6,562 12,223 39,675 51,898
2024 5,803 6,726 12,529 15,375 27,904
2025 5,948 6,894 12,842 5,713 18,555
2026 6,097 7,066 13,163 5,856 19,019
2027 6,249 7,243 13,492 6,003 19,495
2028 6,405 7,424 13,829 6,153 19,982
2029 6,565 7,610 14,175 6,307 20,482
Note: Operating expenses are based on the budget developed by Turnpike Enterprise Finance Office for FY 2019.(1) Periodic maintenance expenses include installation of guardrails and cable barrier, rest area construction and other Department-funded R&R and improvements in the 5-year Work Program and are reported on a cash basis. FY 2022 through FY 2024 include resurfacing of the enitre roadway. Periodic maintenance expenses beyond FY 2023 have not been fully programmed. However, a minimal level of preservation (excluding extraordinary expenses) has been estimated based on FY 2023 expenses increased at 2.5 percent annually.
The traffic and gross toll revenue forecasts for FY 2019 through FY 2029 are shown in Table 2.8. The forecast table includes the impact that indexing will have on revenue. Overall, the gross toll revenue forecast is slightly above the forecast presented in the 2017 Annual Report due in large part to FY 2018 actual revenues exceeding last year’s projection despite a $1.3 million revenue reduction prompted by the 15-day toll suspension starting on September 5, 2017 due to Hurricane Irma. Transactions in FY 2019 and thereafter are not expected to be impacted by the annual indexing of SunPass® toll rates. Further, the cash toll rate indexing that occurs every five years (FY 2023 and FY 2028) is expected to have minimal impact on traffic. A summary of the economic factors affecting traffic and revenue is included in the Overview chapter of this report. In addition, Appendix A includes all the indexed toll rate schedules.
Projected operating and maintenance expenses during the same forecast period are shown in Table 2.9. The operating expenses for FY 2019 presented in this table represent the budgeted amount for that fiscal year (see Appendix C for a detailed description of the FY 2019 operating expense budget). Subsequent to FY 2019, operating expenses are projected to grow at 2.5 percent annually. The routine maintenance expense forecast is provided by the Office of Project Finance through FY 2024. Subsequent to FY 2024, routine maintenance expenses are increased at 2.5 percent annually.
Periodic maintenance expenses are based on information provided by the Office of Project Finance based on the five-year Work Program and include rest area, safety project, and lighting projects. Total operating and maintenance expenses are

25FY 2018 Annual Report
ENTERPRISE TOLL OPERATIONS
Florida Department of Transportation
Alligator Alley
year, an amount of principal and accrued interest (annual debt service) on the outstanding bonds becomes due and payable. As a test of the ability of a facility to repay the annual debt service, a “coverage” calculation is performed. In accordance with the Bond Resolution, gross revenues are first required to provide 100 percent of the administrative, operating and routine maintenance expenses. The amount of revenues remaining (net revenues) is then available for the payment of debt service. Both renewal and replacement and other expenses funded by the Department are not included in the operating and routine maintenance expenses for debt service calculations. The Bond Resolution requires that net revenues be at least 120 percent (1.2 times) of the annual debt service.
Table 2.10 provides a forecast of the sufficiency of Alligator Alley to meet annual debt service requirements through FY 2029. Generally, revenues used for debt service analysis on the facility include gross toll revenue and other income derived from (or in connection with) the operation of Alligator Alley. However, a conservative approach was taken for this analysis and only gross toll revenue was used in the calculation of net revenue (i.e., gross toll revenue less operating and routine
maintenance expenses). As shown in the table, Alligator Alley significantly exceeds the 1.2 minimum debt service coverage requirement.
As indicated in Figure 2.4, revenues remaining after the fulfillment of the annual debt service requirement are used next to fund renewal and
replacements.
The excess revenues remaining after all of these obligations have been determined and met are transferred to the South Florida Water Management District (SFWMD) to fund environmental projects designed to restore the Florida Everglades from the effects of the construction of Alligator Alley in accordance
1963 1997 2007 2017
$43.2 millionRevenue Refunding
Bonds
$21.6 millionRevenueRefunding
Bonds
$55.2 millionRevenue
Bonds
$17 million Revenue
Bonds
Note: A list of projects funded by each bond issue is included in Table 1.4 of this report.
Figure 2.3 Alligator Alley Bond Issues
Table 2.10 - Alligator Alley Net Toll Revenue Forecast and Debt
Service Coverage FY 2018 through FY 2029
Fiscal Year
Gross Toll Revenue
($000)
Operating & Routine
Maintenance Expenses(1)
($000)
Net Toll Revenue(2)
($000)
Debt Service(3)
Payment($000)
Coverage Ratio
2018 $32,845 $9,973 $22,872 $2,796 8.2
2019 35,038 10,656 24,382 2,799 8.7
2020 36,449 12,199 24,250 2,799 8.7
2021 37,592 12,368 25,224 2,799 9.0
2022 38,705 11,925 26,780 2,794 9.6
2023 40,628 12,223 28,405 2,795 10.2
2024 41,739 12,529 29,210 2,795 10.5
2025 42,840 12,842 29,998 2,795 10.7
2026 43,929 13,163 30,766 2,790 11.0
2027 45,019 13,492 31,527 2,793 11.3
2028 46,921 13,829 33,092 - -
2029 48,022 14,175 33,847 - -
(1) Periodic maintenance are not included in the operating and routine maintenance expenses as bond resolutions exclude these expenses when calculating net revenue.(2) Does not include investment income and operating revenues available for debt service.(3) Annual debt service is obtained from the Offical Statement for the 2017A Bonds.

26 FY 2018 Annual Report
ENTERPRISE TOLL OPERATIONS
Florida Department of Transportation
Alligator Alley
with Section 338.26, Florida Statutes.
In keeping with the intent of the statute, on June 30, 1997, the Department signed a Memorandum of Agreement ("MOA") with the SFWMD regarding the transfer of the excess toll revenues to the SFWMD. The agreement required for the total annual transfers made by the Department not to exceed $63.6 million by FY 2016. The department met this requirement and a new MOA with SFWMD was signed in June 2016 and goes through June 2019. In FY 2018, $8.0 million of
Toll Revenue
Administrative
Operating & Maintenance
Debt Service
Debt Service Reserve
Renewal & ReplacementFund
Arbitrage (Rebate)
STTF (Department Funded)Repair, Restoration,
Reconstruction, Improvement
SFWMD - Everglades Fund
Figure 2.4 - Alligator Alley Flow of Funds Series 2017A
Revenue Refunding Bonds
excess revenues were transferred to SFWMD.

27FY 2018 Annual Report Pinellas Bayway System
ENTERPRISE TOLL OPERATIONS
Florida Department of Transportation
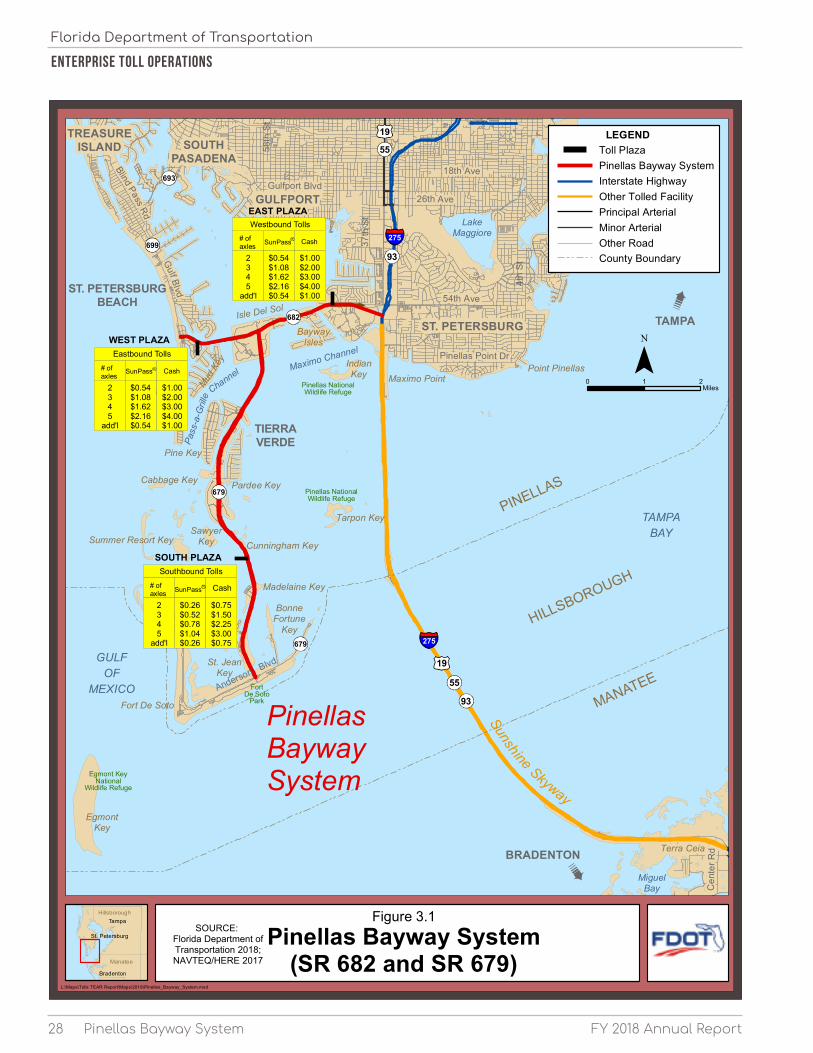
3.1 BACKGROUND The Pinellas Bayway System consists of a series of causeways and bridges providing a connection between St. Petersburg Beach, Fort DeSoto Park and I-275. The system is approximately 15.2 miles in length and includes 1.3 miles of bridges. Figure 3.1 shows a map of the facility with the most recent toll rates.
The east-west section of the facility (SR 682) provides a connection between I-275 (via 54th Avenue) on the east and Gulf Boulevard (SR 699) on the west. This section crosses the Bayway Isles and Isle Del Sol. The north-south section of the facility (SR 679) extends from Isle Del Sol through Tierra Verde Key to Fort DeSoto Park. The facility was opened to traffic in December 1962.
There are three mainline toll plazas on the Pinellas Bayway System. Tolls at the first plaza,
Pinellas Bayway Systemlocated at the northeast end of the facility on the mainland near Eckerd College, are collected for westbound travel only. The second plaza is located on the northwest end of the facility in St. Petersburg Beach, near the intersection with Gulf Boulevard (SR 699). Tolls at this plaza are collected for eastbound travel only. Finally, tolls at the third mainline plaza, located on Tierra Verde, are collected for southbound travel only.
In June 2012 (FY 2012), toll rate indexing was implemented on the Pinellas Bayway System, as mandated by the Florida Legislature. At the same time, the method used to calculate toll rates for three or more axle vehicles was changed from a per-axle basis to “N minus 1” to be consistent with the methodology used on other department facilities and the Turnpike System. Since then, SunPass® toll rates were indexed each year while cash toll rates were indexed every five years to pace with the rounding of the cash toll in quarter increments. Most recently, SunPass® and cash toll rates were adjusted on October 29, 2017 (FY 2018). For two-axle vehicles, the SunPass® toll increased by $0.01 at the east and west plazas located on SR 682 (CPI was not large enough to increase the $0.26 SunPass® toll rate at the south plaza). For two-axle vehicles, the cash toll increased by $0.25 at each of the three mainline plazas.
Annual transactions and revenue for the facility from FY 2008 through FY 2018 are presented in Table 3.1. Total transactions increased from approximately 9.7 million in FY 2008 to 9.9 million in FY 2018, an overall increase of 2.3 percent. During the same period, revenues increased from $3.7 million in FY 2008 to $5.1 in FY 2018, an overall increase of 39.5 percent, or 3.4 percent per year compounded. During this 10-year period, traffic and revenue declined from FY 2008 through FY 2010 due to the economic recession. Starting in FY 2011 traffic
28 FY 2018 Annual ReportPinellas Bayway System
ENTERPRISE TOLL OPERATIONS
Florida Department of Transportation
679
679
679
682
699
693
55
19
275
275
55
19
TREASUREISLAND SOUTH
PASADENA
GULFPORT
ST. PETERSBURGBEACH
ST. PETERSBURG TAMPA
BRADENTON
PINELLAS
MANATEE
BonneFortune
Key
Madelaine Key
Summer Resort Key
Pass-a-Grille BeachMaximo Point
Tarpon Key
Point Pinellas
Pine Key
Pardee Key
Cunningham Key
Terra Ceia
Isle Del Sol
IndianKey
TIERRAVERDE
Cabbage Key
SawyerKey
St. JeanKey
BaywayIsles
Mud
Key
EgmontKey
93
93
Fort De Soto
Sunshine Skyway
HILLSBOROUGH
Tampa
St. Petersburg
Bradenton
Hillsborough
Manatee
Pinellas Bayway System(SR 682 and SR 679)
SOURCE:Florida Department of Transportation 2018; NAVTEQ/HERE 2017
Figure 3.1
0 1 2Miles
GULFOF
MEXICO
TAMPABAY
MiguelBay
LakeMaggiore
PinellasBaywaySystemEgmont Key
NationalWildlife Refuge
FortDe Soto
Park
Pinellas NationalWildlife Refuge
Pinellas NationalWildlife Refuge
Gulf Blvd
Gulfport Blvd
58th
S t
18th Ave
26th Ave
54th Ave
4th
St
Pinellas Point Dr
Cen
ter R
d
BlindPass
Rd
37t h
St
Anderson Blvd
Maximo Channel
Pass
-a-G
rille
Channel
L:\Maps\Tolls TEAR Report\Maps\2018\Pinellas_Bayway_System.mxd
SOUTH PLAZASouthbound Tolls
# ofaxles
2345
add'l
SunPass Cash
$0.26$0.52$0.78$1.04$0.26
$0.75$1.50$2.25$3.00$0.75
WEST PLAZA
# ofaxles
2345
add'l
SunPass Cash
Eastbound Tolls
$0.54$1.08$1.62$2.16$0.54
$1.00$2.00$3.00$4.00$1.00
EAST PLAZA
2345
add'l
CashSunPass# ofaxles
Westbound Tolls
$0.54$1.08$1.62$2.16$0.54
$1.00$2.00$3.00$4.00$1.00
LEGEND
Interstate HighwayOther Tolled FacilityPrincipal ArterialMinor ArterialOther RoadCounty Boundary
Toll PlazaPinellas Bayway System

29FY 2018 Annual Report
ENTERPRISE TOLL OPERATIONS
Florida Department of Transportation
Pinellas Bayway System
expenses from FY 2008 through FY 2018 are presented in Table 3.2. As indicated, operating expenses have increased slightly since 2008. During the same period, routine maintenance expenses increased from $473 thousand to $977 thousand. Combined, total O&M expenses remained fairly level increasing slightly from $2.6 million in FY 2008 to $3.1 million in FY 2018.
Maintenance of the Pinellas Bayway System is performed under a private Asset Maintenance Contract. The current contract includes expenses for movable bridge maintenance for the one drawbridge, as well as maintenance and inspection of all other bridges on the Pinellas Bayway System. In addition to operating and routine maintenance expenses, renewal and replacement
and capital improvement (periodic) costs totaling $380 thousand were incurred during FY 2018 primarily due to toll system replacement.
and revenue began to increase annually as the economy began to slowly recover following the recession. Beginning in FY 2012 and lasting through FY 2013, transactions decreased as a result of various detours related to the SR 682 bridge replacement project, as well as the June 2012 toll rate increase. However, revenues increased sharply in FY 2013 as a result of this toll rate increase. Since then, the continuing growth in transaction is the result of the completion of the SR 682 bridge replacement project and the previously mentioned toll rate indexing for SunPass and cash customers in FY 2018. Lastly, during FY 2018, tolls were suspended for fifteen days beginning on September 5, 2017, to aid in the evacuation and recovery efforts due to Hurricane Irma. This suspension resulted in a $0.2 million revenue loss.
Historical operating and routine maintenance
Table 3.1 - Pinellas bayway system Historical Transactions and Revenue Growth
FY 2008 through FY 2018
Fiscal Year
Transactions (000)Toll Revenue(1)
($000)Average
TollToll
PayingNon
Revenue TotalPercent Change Amount
Percent Change
2008 9,649 30 9,679 - $3,656 - $0.378
2009 9,290 37 9,327 (3.6%) 3,535 (3.3%) 0.379
2010 9,142 26 9,168 (1.7) 3,510 (0.7) 0.383
2011 9,195 30 9,225 0.6 3,605 2.7 0.391
2012 9,098 37 9,135 (1.0) 3,535 (1.9) 0.387
2013 8,557 41 8,598 (5.9) 4,035 14.1 0.469
2014 8,779 38 8,817 2.5 4,111 1.9 0.466
2015 9,547 39 9,586 8.7 4,487 9.1 0.468
2016 9,835 40 9,875 3.0 4,656 3.8 0.471
2017 10,007 39 10,046 1.7 4,755 2.1 0.473
2018 9,605 294 9,899 (1.5) 5,100 7.3 0.515
Source: FDOT Office of the Comptroller and Turnpike Enterprise Finance Office.Note: The non-revenue class includes authorized vehicles that pass through a toll plaza without incurring a toll (i.e., law enforcement, emergency vehicles) and transactions reported during toll suspensions attributable to hurricanes. Higher non revenue transactions in FY 2018 due to toll suspension during Hurricane Irma.(1) Toll revenue reported net of the SunPass discount since FY 2000. Per new revenue reporting methodology, starting FY 2014 toll revenue excludes violation and miscellaneous revenues, which are immaterial to toll revenues reported within.
Table 3.2 - pinellas bayway system Historical Operating and Routine
Maintenance Expenses FY 2008 through FY 2018
Fiscal Year
Operating Expense($000)
Routine Maintenance
Expense(1)
($000)
Total O&M Expenses
($000)2008 $2,083 $473 $2,556
2009 2,122 588 2,710
2010 1,840 723 2,563
2011 1,802 747 2,549
2012 1,806 695 2,501
2013 1,720 739 2,459
2014 1,576 748 2,324
2015 1,799 811 2,610
2016 1,891 764 2,655
2017 2,058 883 2,941
2018 2,167 977 3,144
Source: FDOT Office of the Comptroller.(1) Operating expense restated from FY 2014 through FY 2017.

30 FY 2018 Annual ReportPinellas Bayway System
ENTERPRISE TOLL OPERATIONS
Florida Department of Transportation
3.2 FY 2018 TRANSACTIONS AND TOLL REVENUES Monthly transactions and toll revenue on the Pinellas Bayway System during FY 2018 are presented in Table 3.3. Taking into account the previously mentioned $0.2 million revenue loss prompted by the September 2017 toll suspension due to Hurricane Irma, the first quarter (i.e., July through September) typically generates more revenue compared to the remaining three quarters due to revenues from the general public annual passes (which represent a large
percent of the available types of passes) being recorded in September when the passes are primarily sold. The results indicate that the first quarter generated $1.3 million in revenues ($1.5 million if Hurricane Irma revenue loss is added back to normalize comparison) compared to the $1.3 million
(average) generated in each of the remaining three quarters. Graph 3.1 shows the monthly distribution of pass sales.
Graph 3.2 shows the number of hourly transactions on weekdays of a typical week during FY 2018 separated between the main east-west traffic on SR 682 and traffic on SR 679 traveling to Fort DeSoto Park. The majority of the transactions occur at the two plazas on SR 682, with a much smaller percentage occurring at the plaza on SR 679.
Table 3.3 - Pinellas Bayway System Monthly Transactions and Toll Revenue
FY 2018
MonthTransactions
(000)Toll Revenue
($000)July 2017 877 406
August 780 340
September 633 524
1st Quarter Total 2,290 1,270
October 763 368
November 766 384
December 790 401
2nd Quarter Total 2,319 1,153
January 2018 769 402
February 886 457
March 1,010 514
3rd Quarter Total 2,665 1,373
April 942 469
May 821 404
June 862 431
4th Quarter Total 2,625 1,304
Annual Total 9,899 $5,100
Source: FDOT Office of the Comptroller (Annual Toll Revenue) and Turnpike Enterprise Finance Office.
Note: Transactions represent toll-paying and non-revenue traffic at the mainline plazas.
Graph 3.2 - pinellas bayway system Typical Hourly Weekday Transactions
FY 2018
Source: Data obtained from Turnpike Enterprise Finance Office for the 5-day period beginning Monday, May 14, 2018.
SR 679SR 682
12AM
10PM
8PM
Tran
sact
ions
Time of day
0
500
1,000
1,500
2,000
6PM
4PM
2PM
12PM
10AM
8AM
6AM
4AM
2AM
12AM
Graph 3.1 - Pinellas bayway system Monthly Pass Sales Distribution ($000)
FY 2018
Note: Includes General Public and Bayway Isle passes.

31FY 2018 Annual Report Pinellas Bayway System
ENTERPRISE TOLL OPERATIONS
Florida Department of Transportation
As indicated, the travel demand on the facility quickly builds during the early morning hours and remains steady throughout the midday hours. Typical weekday traffic volumes peak in the early evening hours and quickly subside after 6:00 p.m., showing that the Pinellas Bayway System serves both commuter traffic and traffic related to the recreational beach activity in the area.
The monthly transaction variation in FY 2018 is illustrated in Table 3.4. Annual average daily traffic (AADT) on the Pinellas Bayway System for FY 2018 was approximately 27,100. The peak season occurred from February through April. This transaction level is expected during this period due to tourists and seasonal residents. September transactions are below the yearly average as a result of fewer tourists and seasonal residents in the area.
The FY 2018 two-way AADT profile for the facility is presented in Figure 3.2. The AADT at the East, West and South plazas during FY 2018 was 30,900, 19,900 and 3,400, respectively. The East Plaza
experiences the highest traffic volumes, while the number of drivers traveling to Fort DeSoto Park through the South Plaza is the lowest of the three plazas. Due to one-way tolling at each plaza, the sum of the two-way AADT volumes for the three tolled locations shown in the figure (54,200) is double that of the one-way transaction volume shown in Table 3.4. Table 3.4 - pinellas bayway system
Seasonal Transaction VariationFY 2018
Month
Average Daily
TransactionsSeasonal
FactorJuly 2017 28,300 1.04
August 25,100 0.93
September 21,100 0.78
October 24,600 0.91
November 25,500 0.94
December 25,500 0.94
January 2018 24,800 0.92
February 31,600 1.17
March 32,600 1.20
April 31,400 1.16
May 26,500 0.98
June 28,700 1.06
AADT 27,100 1.00
Figure 3.2 - Pinellas bayway system Two-way AADT Profile
FY 2018
32 FY 2018 Annual ReportPinellas Bayway System
ENTERPRISE TOLL OPERATIONS
Florida Department of Transportation
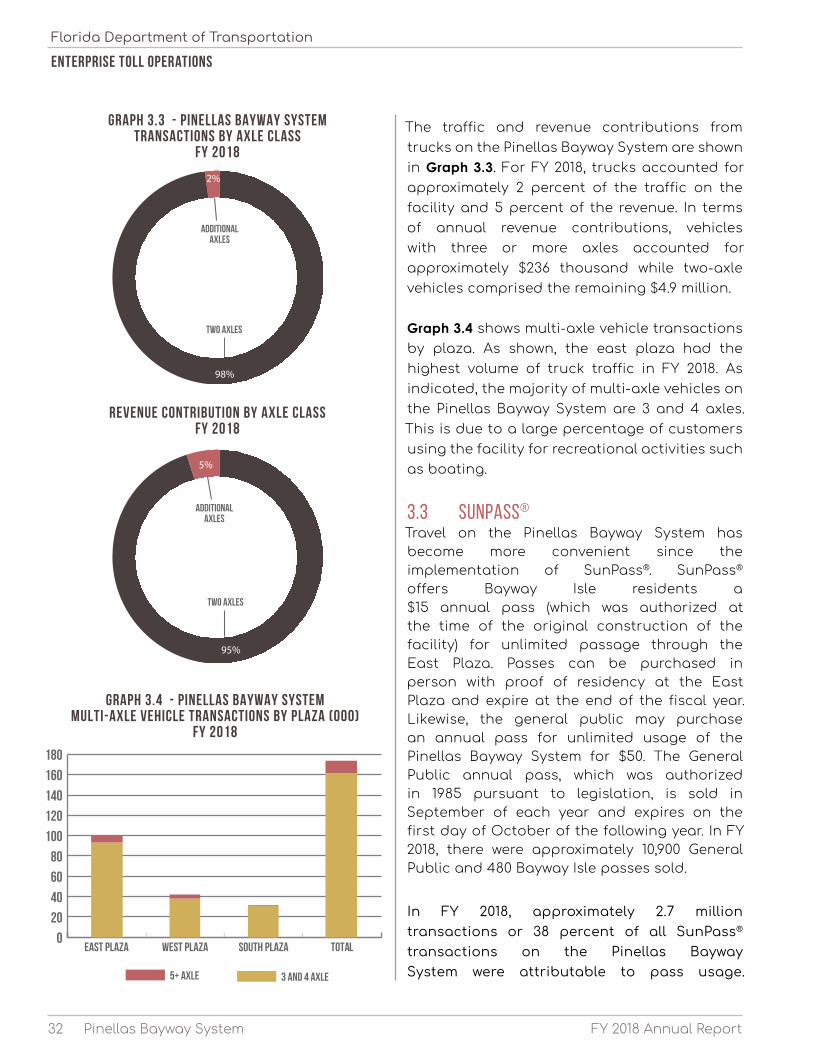
The traffic and revenue contributions from trucks on the Pinellas Bayway System are shown in Graph 3.3. For FY 2018, trucks accounted for approximately 2 percent of the traffic on the facility and 5 percent of the revenue. In terms of annual revenue contributions, vehicles with three or more axles accounted for approximately $236 thousand while two-axle vehicles comprised the remaining $4.9 million.
Graph 3.4 shows multi-axle vehicle transactions by plaza. As shown, the east plaza had the highest volume of truck traffic in FY 2018. As indicated, the majority of multi-axle vehicles on the Pinellas Bayway System are 3 and 4 axles. This is due to a large percentage of customers using the facility for recreational activities such as boating.
3.3 SUNPASS® Travel on the Pinellas Bayway System has become more convenient since the implementation of SunPass®. SunPass® offers Bayway Isle residents a $15 annual pass (which was authorized at the time of the original construction of the facility) for unlimited passage through the East Plaza. Passes can be purchased in person with proof of residency at the East Plaza and expire at the end of the fiscal year. Likewise, the general public may purchase an annual pass for unlimited usage of the Pinellas Bayway System for $50. The General Public annual pass, which was authorized in 1985 pursuant to legislation, is sold in September of each year and expires on the first day of October of the following year. In FY 2018, there were approximately 10,900 General Public and 480 Bayway Isle passes sold.
In FY 2018, approximately 2.7 million transactions or 38 percent of all SunPass® transactions on the Pinellas Bayway System were attributable to pass usage.
Graph 3.4 - pinellas bayway system Multi-Axle Vehicle Transactions by Plaza (000)
FY 2018
0
20
40
60
80
100
120
140
160
180
5+ Axle 3 and 4 Axle
TotalSouth PlazaWest PlazaEast Plaza
Graph 3.3 - pinellas bayway system Transactions by Axle Class
FY 2018
Revenue Contribution by Axle Class FY 2018
2%
98%
AdditionalAxles
Two Axles
5%
95%
AdditionalAxles
Two Axles

33FY 2018 Annual Report Pinellas Bayway System
ENTERPRISE TOLL OPERATIONS
Florida Department of Transportation
represented approximately 71 percent of total transactions in FY 2018. Monthly SunPass® participation percentages ranged from approximately 67 percent to 74 percent during the year. In general, SunPass® participation is the highest during off season months as a result of fewer tourists and seasonal residents, indicating that more commuters using SunPass®
travel on the facility during this time.
Table 3.7 shows gross toll revenue by payment method. SunPass® accounted for 54 percent of the total revenue in FY 2018. Monthly revenues are influenced by annual pass sales. As previously mentioned, General Public annual passes are primarily sold in September and October, and as a result, approximately 86 percent of revenue for the month of September is attributable to SunPass®. After October, sales drop significantly. The contribution to revenue from the Bayway Isle annual pass, with yearly renewal in June, is negligible.
Table 3.5 shows monthly SunPass® transactions by payment method. Correspondingly, annual pass sales accounted for $550 thousand (net of refunds) or 20 percent of total SunPass® revenue. With an average toll of $0.20 for pass transactions (overall, for the three toll plazas combined), the annual pass program provided a combined savings of approximately $834 thousand to pass holders. For those SunPass® customers who do not participate in the Bayway Isle or General Public pass programs, a standard 10 percent discount is offered when a threshold of 40 transactions per month is reached. Transactions for SunPass® customers with multi-axle vehicles on the Sunshine Skyway Bridge also count toward this minimum threshold. The FY 2018 total for the discount program was approximately $17 thousand.
Table 3.6 shows transactions by payment method on the facility. SunPass® transactions
Table 3.5 - pinellas bayway system SunPass® Transactions by Payment Method
FY 2018
Transactions (000)
MonthGeneral
Public PassBayway
Isle PassRegular
SunPass® TotalJuly 2017 185 11 393 589
August 194 10 348 552
September 172 9 266 447
October 209 12 334 555
November 218 12 328 558
December 211 13 334 558
January 2018 220 14 331 565
February 224 14 392 630
March 255 15 438 708
April 233 14 416 663
May 202 12 380 594
June 216 14 391 621
Total 2,539 150 4,351 7,040
Percentage 36.2% 2.1% 61.8% 100.0%
Source: Turnpike Enterprise Finance Office.
Table 3.6 - Pinellas bayway system Transactions by Payment Method
FY 2018
Month
Transactions (000)Percent
SunPass®SunPass®Non-
SunPass® TotalJuly 2017 589 288 877 67.2%
August 552 228 780 70.8
September 447 186 633 70.6
October 555 208 763 72.7
November 558 208 766 72.8
December 558 232 790 70.6
January 2018 565 204 769 73.5
February 630 256 886 71.1
March 708 302 1,010 70.1
April 663 279 942 70.4
May 594 227 821 72.4
June 621 241 862 72.0
Total 7,040 2,859 9,899
Percentage 71.1% 28.9% 100.0%
Source: Turnpike Enterprise Finance Office.Note: General Public and Bayway Isle passes are included in the SunPass® Program.
Cash transactions represent toll-paying and non-revenue transactions.

34 FY 2018 Annual Report
ENTERPRISE TOLL OPERATIONS
Florida Department of Transportation
Pinellas Bayway System
fifth-year CPI increase (6.6 percent for prior 5-year period rounded to the quarter) of $0.25 for two-axle vehicles. This most recent indexing is effective as of October 29, 2017 (FY 2018).
3.5 FY 2018 EXPENSES AND LIABILITIES A comparison between actual and budgeted operating and routine maintenance expenses for FY 2018 is presented in Table 3.8. Actual operating expenses were 11.1 percent higher than the FY 2018 budget due to higher costs related to Traffic Management Center and toll equipment. Actual routine maintenance expenses were lower than the FY 2018 budget by 1.9 percent. Overall, FY 2018 actual operating and routine maintenance expenses were approximately 6.7 percent, or $198 thousand, higher than the FY 2018 budget.
An analysis of the FY 2018 long-term liability on the facility is presented in Table 3.9. During FY 2018, approximately $0.4 million of capital improvement (periodic) expenditures were incurred.
3.4 NOTEWORTHY EVENTS In 2007, the Legislature amended Section 338.165, Florida Statutes, to require the Turnpike System and other FDOT-owned facilities to index toll rates on existing toll facilities to the annual Consumer Price Index (CPI) from the prior calendar year. Toll rate adjustments for inflation may be made no more frequently than once a year (i.e., SunPass® toll rates) and must be made no less frequently than once every five years (i.e., cash toll rates) as necessary to accommodate cash toll rate schedules. Toll rates may be adjusted beyond these limits as directed by bond documents, covenants, or governing body authorization or pursuant to Department administrative rule.
For the prior calendar year, CPI of 1.3 percent prompts a $0.01 increase at the east and west toll plazas for two-axle toll rates for SunPass® customers. Furthermore, cash toll rates, last increased in 2012, experience the
Table 3.8 - Pinellas bayway system Operating and Routine Maintenance Expenses
FY 2018
Type of ExpenseBudget($000)
Actual($000)
Over/ (Under)($000) Variance
Operating $1,950 $2,167 $217 11.1%
Routine Maintenance 996 977 (19) (1.9)
Total $2,946 $3,144 $198 6.7%
Source: FDOT Office of the Comptroller, Turnpike Enterprise Finance Office and the FY 2017 Enterprise Toll Operations Traffic Engineer’s Annual Report.
Table 3.7 - pinellas bayway system Gross Toll Revenue by Payment Method
FY 2018
Month
Gross Toll Revenue ($000)Percent
SunPass®SunPass®Non-
SunPass® TotalJuly 2017 $204 $202 $406 50.2%
August 182 158 340 53.5
September(1) 450 74 524 85.9
October 220 148 368 59.8
November 194 190 384 50.5
December 207 194 401 51.6
January 2018 215 187 402 53.5
February 225 232 457 49.2
March 241 273 514 46.9
April 221 248 469 47.1
May 199 205 404 49.3
June(2) 214 217 431 49.7
Total $2,772 $2,328 $5,100
Percentage 54.4% 45.6% 100.0%
Source: FDOT Office of the Comptroller (Annual Toll Revenue) and Turnpike Enterprise Finance Office.
Note: General Public and Bayway Isle passes are included in the SunPass® program.(1) General Public passes are sold in September.(2) Bayway Isle passes are sold in June.
Table 3.9 - Pinellas bayway system Long-Term Liability
FY 2018
TransactionAmount($000)
Balance, beginning of year $44,306
Periodic Maintenance Additions 380
Balance, end of year $44,686
Source: FDOT Office of the Comptroller.
35FY 2018 Annual Report
ENTERPRISE TOLL OPERATIONS
Florida Department of Transportation
Pinellas Bayway System
cash customers. The current gross toll revenue forecast is similar to the forecast presented in the 2017 Annual Report due to FY 2018 actual revenue meeting last year’s projection. Traffic in FY 2020 and thereafter are not expected to be impacted by the annual indexing of SunPass® or cash toll rates. A summary of the economic factors affecting traffic and revenue is included in the Overview chapter of this report. In addition, Appendix A includes current indexed toll rate schedules.
3.6 TRAFFIC, REVENUE AND EXPENSE FORECASTS Historically population growth in Pinellas County has had a significant impact on the facility. The ratio between historical traffic growth and population growth was used along with projected population growth to estimate future traffic growth on the Pinellas Bayway System.
According to the latest economic outlook prepared by the Bureau of Economic and Business Research (BEBR), College of Liberal Arts and Sciences at University of Florida, Florida’s population growth is forecast to increase at a compounded annual growth rate of 1.3 percent from the current year through 2030.
Future population estimates have been calculated based on medium projections from the most recent publication by the BEBR. The corresponding estimated annual population growth rate through 2030 for Pinellas County is 0.5 percent. The historical ratio of traffic growth to population growth was applied to projected population growth rates to obtain a general guideline to estimate future annual traffic growth on the Pinellas Bayway System. Traffic profiles are provided in Appendix B, showing two-way AADT on each segment of the system, for FY 2018 through FY 2029.
The traffic and gross toll revenue forecasts for FY 2019 through FY 2029 are shown in Table 3.10. The forecast table includes the revenue impact from toll indexing every year beginning in FY 2020 for SunPass® customers and every five years (FY 2023 and FY 2028) for
Table 3.10 - Pinellas bayway systemTraffic and Gross Toll Revenue Forecasts
FY 2019 through FY 2029
Fiscal Year
Total Traffic (000)
Toll Revenue ($000)Toll Revenue Comparisons
($000)Revenue
with Constant Tolls(1)
Indexing Impact
SunPass® Discount Impact
Gross Toll
Revenue
2017 Annual Report
Forecast
Variance
Amount Percent2019 10,008 $5,271 0 ($22) $5,249 $5,509 ($260) (4.7%)
2020 10,106 5,378 $60 (22) 5,416 5,559 (143) (2.6)
2021 10,332 5,486 106 (23) 5,569 5,626 (57) (1.0)
2022 10,536 5,585 156 (24) 5,717 5,763 (46) (0.8)
2023 10,716 5,674 543 (25) 6,192 6,046 146 2.4
2024 10,869 5,754 602 (26) 6,330 6,169 161 2.6
2025 11,001 5,823 661 (26) 6,458 6,284 174 2.8
2026 11,114 5,881 722 (27) 6,576 6,377 199 3.1
2027 11,226 5,940 778 (28) 6,690 6,475 215 3.3
2028 11,337 6,000 1,173 (29) 7,144 6,719 425 6.3
2029 11,450 6,059 1,244 (29) 7,274 N/A N/A N/A
Note: Total traffic corresponds to the gross toll revenue.N/A The FY 2017 Traffic Engineer’s Annual Report forecast went through FY 2028.(1) Toll revenue forecast without indexing.
36 FY 2018 Annual Report
ENTERPRISE TOLL OPERATIONS
Florida Department of Transportation
Pinellas Bayway System
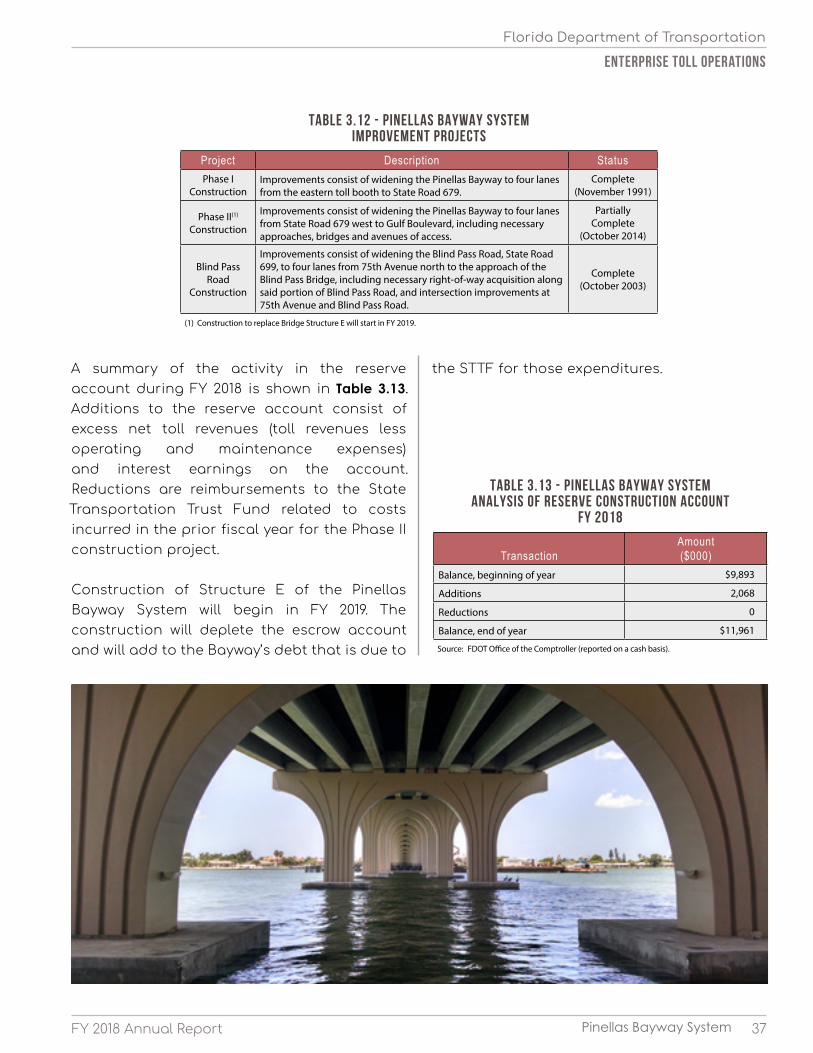
3.7 RESERVE CONSTRUCTION ACCOUNT Pursuant to legislation passed in 1985 (Chapter 85-364, Laws of Florida) and revised in 1995 (Chapter 95-382, Laws of Florida) and 2014 (Chapter 14-223, Laws of Florida), toll collection on the Pinellas Bayway System has continued since the retirement of all outstanding bonds. Beginning July 1, 2014, net revenues are defined as toll revenues less operating and maintenance expenses. Tolls collected were designated by the legislation for certain improvement projects: Phase I construction, Phase II construction and the Blind Pass Road widening. A description and status of each improvement project is shown in Table 3.12.
As indicated in Figure 3.3, the Phase II and Blind Pass Road projects were funded by a reserve construction account established by the Department to accumulate toll revenues after the payment of operating expenses. During FY 1995, the Department established an escrow account with the Department of Financial Services, Division of Treasury, to maintain and invest the reserve construction account. All interest earnings accumulate in this account and assist in funding the projects.
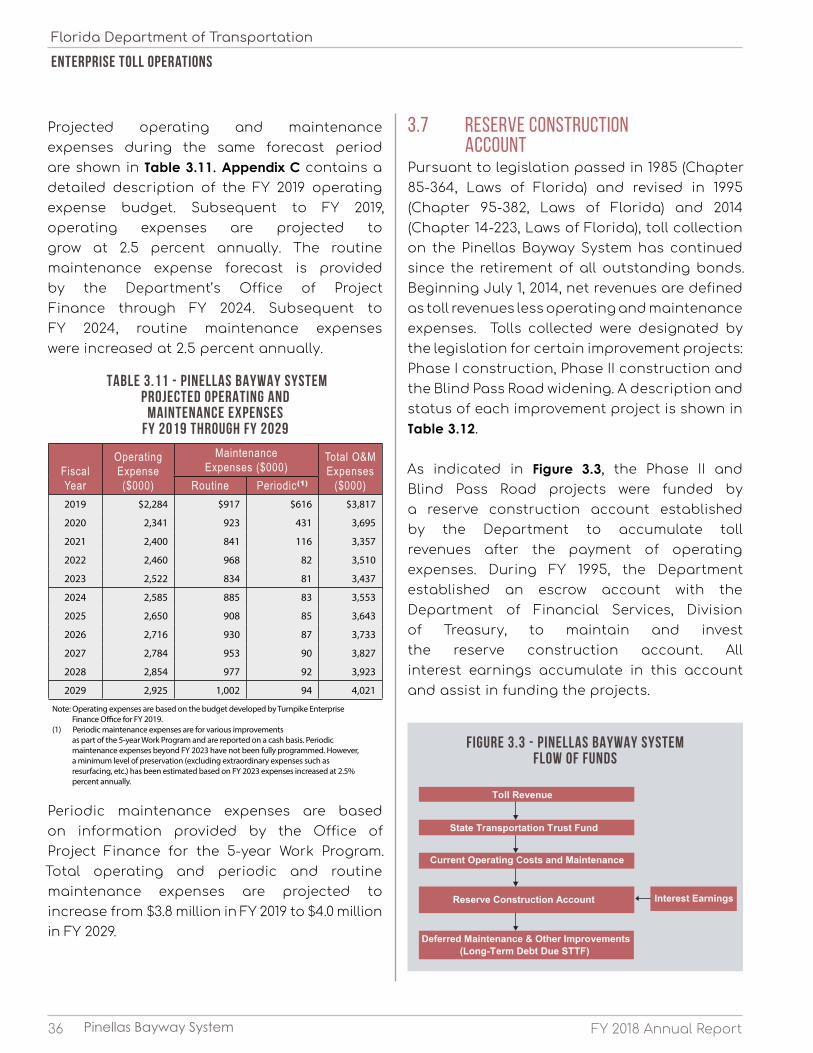
Projected operating and maintenance expenses during the same forecast period are shown in Table 3.11. Appendix C contains a detailed description of the FY 2019 operating expense budget. Subsequent to FY 2019, operating expenses are projected to grow at 2.5 percent annually. The routine maintenance expense forecast is provided by the Department’s Office of Project Finance through FY 2024. Subsequent to FY 2024, routine maintenance expenses were increased at 2.5 percent annually.
Periodic maintenance expenses are based on information provided by the Office of Project Finance for the 5-year Work Program. Total operating and periodic and routine maintenance expenses are projected to increase from $3.8 million in FY 2019 to $4.0 million in FY 2029.
Table 3.11 - Pinellas bayway system Projected Operating and
Maintenance Expenses FY 2019 through FY 2029
Fiscal Year
Operating Expense($000)
Maintenance Expenses ($000)
Total O&M Expenses
($000)Routine Periodic(1) 2019 $2,284 $917 $616 $3,817
2020 2,341 923 431 3,695
2021 2,400 841 116 3,357
2022 2,460 968 82 3,510
2023 2,522 834 81 3,437
2024 2,585 885 83 3,553
2025 2,650 908 85 3,643
2026 2,716 930 87 3,733
2027 2,784 953 90 3,827
2028 2,854 977 92 3,923
2029 2,925 1,002 94 4,021
Note: Operating expenses are based on the budget developed by Turnpike Enterprise Finance Office for FY 2019.(1) Periodic maintenance expenses are for various improvements as part of the 5-year Work Program and are reported on a cash basis. Periodic maintenance expenses beyond FY 2023 have not been fully programmed. However, a minimum level of preservation (excluding extraordinary expenses such as resurfacing, etc.) has been estimated based on FY 2023 expenses increased at 2.5% percent annually.
Toll Revenue
State Transportation Trust Fund
Current Operating Costs and Maintenance
Reserve Construction Account
Deferred Maintenance & Other Improvements(Long-Term Debt Due STTF)
Interest Earnings
Figure 3.3 - Pinellas bayway system Flow of Funds
37FY 2018 Annual Report
ENTERPRISE TOLL OPERATIONS
Florida Department of Transportation
Pinellas Bayway System
A summary of the activity in the reserve account during FY 2018 is shown in Table 3.13. Additions to the reserve account consist of excess net toll revenues (toll revenues less operating and maintenance expenses) and interest earnings on the account. Reductions are reimbursements to the State Transportation Trust Fund related to costs incurred in the prior fiscal year for the Phase II construction project.
Construction of Structure E of the Pinellas Bayway System will begin in FY 2019. The construction will deplete the escrow account and will add to the Bayway’s debt that is due to
the STTF for those expenditures.
Table 3.12 - Pinellas bayway system Improvement Projects
Project Description StatusPhase I
ConstructionImprovements consist of widening the Pinellas Bayway to four lanes from the eastern toll booth to State Road 679.
Complete (November 1991)
Phase II(1)
Construction
Improvements consist of widening the Pinellas Bayway to four lanes from State Road 679 west to Gulf Boulevard, including necessary approaches, bridges and avenues of access.
Partially Complete
(October 2014)
Blind Pass Road
Construction
Improvements consist of widening the Blind Pass Road, State Road 699, to four lanes from 75th Avenue north to the approach of the Blind Pass Bridge, including necessary right-of-way acquisition along said portion of Blind Pass Road, and intersection improvements at 75th Avenue and Blind Pass Road.
Complete (October 2003)
(1) Construction to replace Bridge Structure E will start in FY 2019.
Table 3.13 - Pinellas bayway systemAnalysis of Reserve Construction Account
FY 2018
TransactionAmount($000)
Balance, beginning of year $9,893
Additions 2,068
Reductions 0
Balance, end of year $11,961
Source: FDOT Office of the Comptroller (reported on a cash basis).

38 FY 2018 Annual Report
ENTERPRISE TOLL OPERATIONS
Florida Department of Transportation
THIS PAGE INTENTIONALLY LEFT BLANK
Pinellas Bayway System
39FY 2018 Annual Report Sunshine Skyway Bridge
ENTERPRISE TOLL OPERATIONS
Florida Department of Transportation
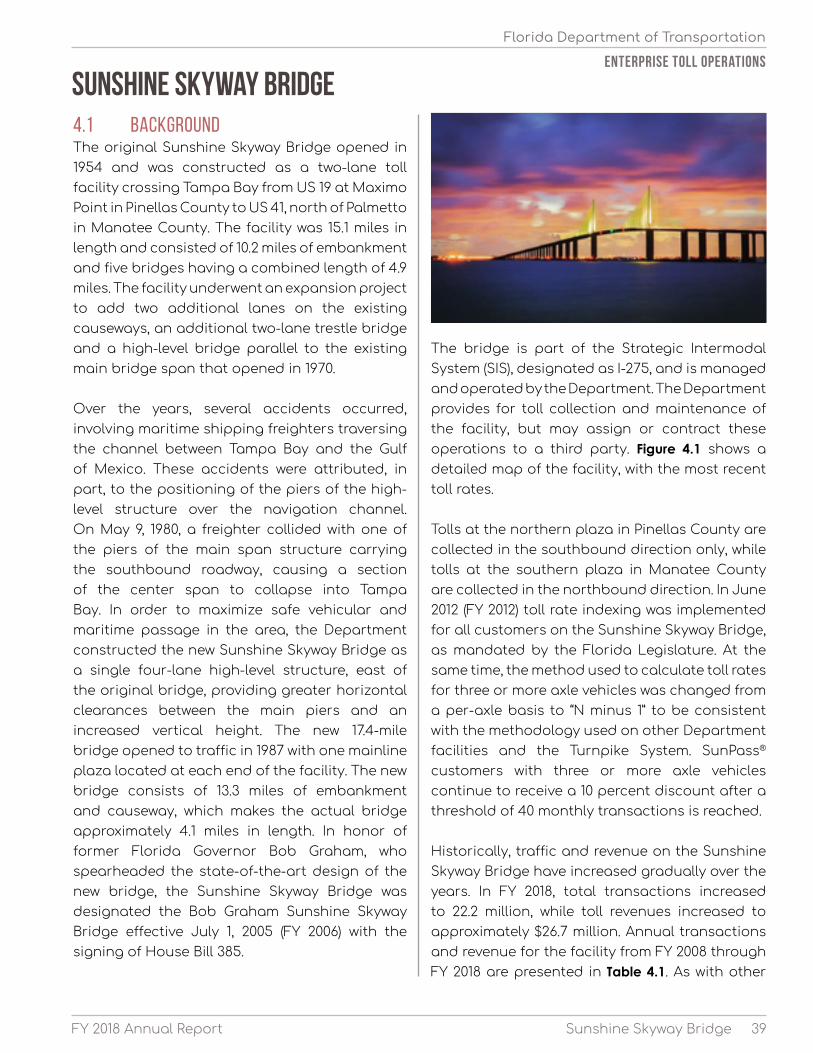
Sunshine Skyway Bridge4.1 BACKGROUND The original Sunshine Skyway Bridge opened in 1954 and was constructed as a two-lane toll facility crossing Tampa Bay from US 19 at Maximo Point in Pinellas County to US 41, north of Palmetto in Manatee County. The facility was 15.1 miles in length and consisted of 10.2 miles of embankment and five bridges having a combined length of 4.9 miles. The facility underwent an expansion project to add two additional lanes on the existing causeways, an additional two-lane trestle bridge and a high-level bridge parallel to the existing main bridge span that opened in 1970.
Over the years, several accidents occurred, involving maritime shipping freighters traversing the channel between Tampa Bay and the Gulf of Mexico. These accidents were attributed, in part, to the positioning of the piers of the high-level structure over the navigation channel. On May 9, 1980, a freighter collided with one of the piers of the main span structure carrying the southbound roadway, causing a section of the center span to collapse into Tampa Bay. In order to maximize safe vehicular and maritime passage in the area, the Department constructed the new Sunshine Skyway Bridge as a single four-lane high-level structure, east of the original bridge, providing greater horizontal clearances between the main piers and an increased vertical height. The new 17.4-mile bridge opened to traffic in 1987 with one mainline plaza located at each end of the facility. The new bridge consists of 13.3 miles of embankment and causeway, which makes the actual bridge approximately 4.1 miles in length. In honor of former Florida Governor Bob Graham, who spearheaded the state-of-the-art design of the new bridge, the Sunshine Skyway Bridge was designated the Bob Graham Sunshine Skyway Bridge effective July 1, 2005 (FY 2006) with the signing of House Bill 385.
The bridge is part of the Strategic Intermodal System (SIS), designated as I-275, and is managed and operated by the Department. The Department provides for toll collection and maintenance of the facility, but may assign or contract these operations to a third party. Figure 4.1 shows a detailed map of the facility, with the most recent toll rates.
Tolls at the northern plaza in Pinellas County are collected in the southbound direction only, while tolls at the southern plaza in Manatee County are collected in the northbound direction. In June 2012 (FY 2012) toll rate indexing was implemented for all customers on the Sunshine Skyway Bridge, as mandated by the Florida Legislature. At the same time, the method used to calculate toll rates for three or more axle vehicles was changed from a per-axle basis to “N minus 1” to be consistent with the methodology used on other Department facilities and the Turnpike System. SunPass® customers with three or more axle vehicles continue to receive a 10 percent discount after a threshold of 40 monthly transactions is reached.
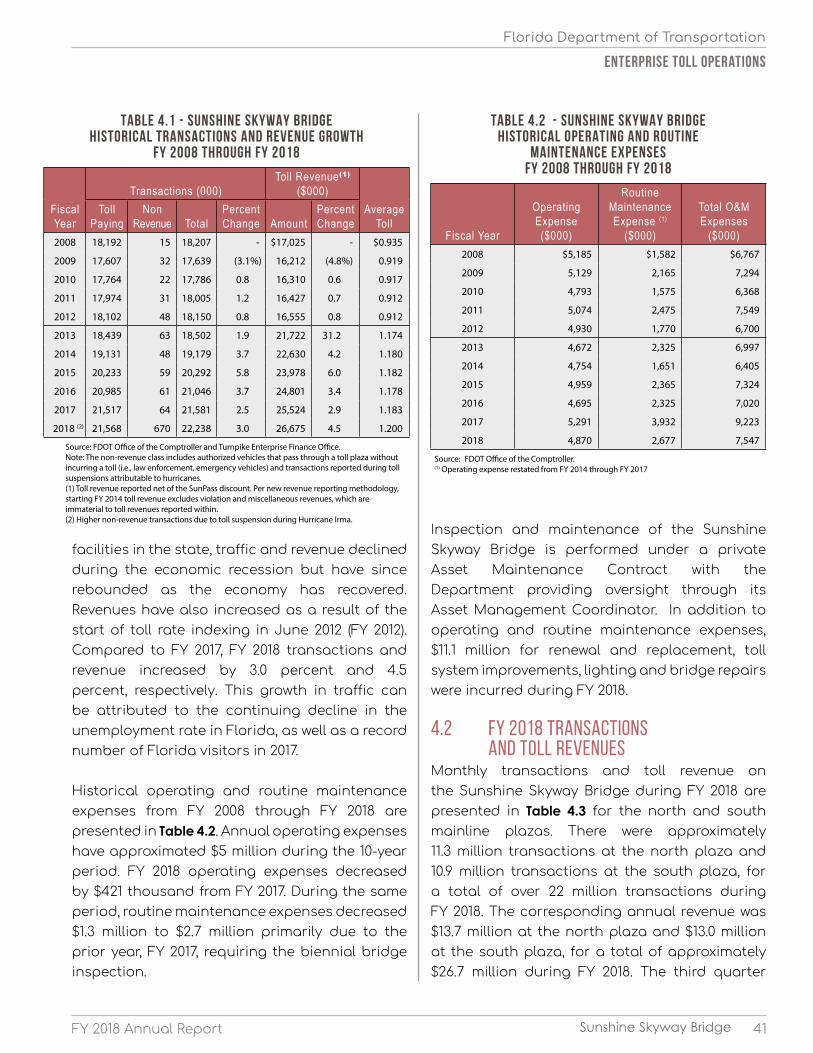
Historically, traffic and revenue on the Sunshine Skyway Bridge have increased gradually over the years. In FY 2018, total transactions increased to 22.2 million, while toll revenues increased to approximately $26.7 million. Annual transactions and revenue for the facility from FY 2008 through FY 2018 are presented in Table 4.1. As with other

40 FY 2018 Annual Report
ENTERPRISE TOLL OPERATIONS
Florida Department of Transportation
Sunshine Skyway Bridge
TREASUREISLAND
GULFPORT
ST. PETERSBURGBEACH
ST. PETERSBURGTAMPA
PINELLAS
MANATEE
Fort De Soto
Summer Resort Key
Pass-a-Grille Beach MaximoPoint
Point Pinellas
PineKey
TerraCeia
KENNETHCITY
693
699
682
19
55
275
375
175
HILLSBOROUGH
275
55
19
679
679
PinellasBayway
699
59519ALT 92
687
41
Piney Point
75
683
275
19
Rubonia
10
301
75
Rocky Bluff43
64
PALMETTO
BRADENTON
Ellenton
ANNA MARIA
HOLMES BEACH
301
41
5564 64
789
666
Long Key
Cabbage Key
TIERRAVERDE
93
EgmontKey
Anna Maria Key
PericoIsland
93
PORTMANATEE
45
93
93A
Tampa
St. Petersburg
Bradenton
Hillsborough
Manatee
Pinellas Sunshine Skyway Bridge(I-275)
SOURCE:Florida Department of Transportation 2018; NAVTEQ/HERE 2017
Figure 4.1
0 1 2 3Miles
GULFOF
MEXICO
TAMPABAY
LakeMaggiore
Boca Ciega Bay
SunshineSkywayBridge
Egmont KeyNationalWildlife Refuge
Boca Ciega Bay
Cockroach Bay
Bishop Harbor
Manatee River
PalmaSolaBay
L:\Maps\Tolls TEAR Report\Maps\2018\Sunshine_Skyway_Bridge.mxd
LEGEND
Interstate HighwayOther Tolled FacilityPrincipal ArterialMinor ArterialOther RoadCounty Boundary
Toll PlazaSunshine Skyway Bridge
NORTH PLAZA
CashSunPass# ofaxles
Southbound Tolls
2345
add'l
$1.50$3.00$4.50$6.00$1.50
$1.07$2.14$3.21$4.28$1.07
SOUTH PLAZANorthbound Tolls
SunPass Cash
2345
add'l
$1.07$2.14$3.21$4.28$1.07
# ofaxles
$1.50$3.00$4.50$6.00$1.50
41FY 2018 Annual Report
ENTERPRISE TOLL OPERATIONS
Florida Department of Transportation
Sunshine Skyway Bridge
Inspection and maintenance of the Sunshine Skyway Bridge is performed under a private Asset Maintenance Contract with the Department providing oversight through its Asset Management Coordinator. In addition to operating and routine maintenance expenses, $11.1 million for renewal and replacement, toll system improvements, lighting and bridge repairs were incurred during FY 2018.
4.2 FY 2018 TRANSACTIONS AND TOLL REVENUES Monthly transactions and toll revenue on the Sunshine Skyway Bridge during FY 2018 are presented in Table 4.3 for the north and south mainline plazas. There were approximately 11.3 million transactions at the north plaza and 10.9 million transactions at the south plaza, for a total of over 22 million transactions during FY 2018. The corresponding annual revenue was $13.7 million at the north plaza and $13.0 million at the south plaza, for a total of approximately $26.7 million during FY 2018. The third quarter
facilities in the state, traffic and revenue declined during the economic recession but have since rebounded as the economy has recovered. Revenues have also increased as a result of the start of toll rate indexing in June 2012 (FY 2012). Compared to FY 2017, FY 2018 transactions and revenue increased by 3.0 percent and 4.5 percent, respectively. This growth in traffic can be attributed to the continuing decline in the unemployment rate in Florida, as well as a record number of Florida visitors in 2017.
Historical operating and routine maintenance expenses from FY 2008 through FY 2018 are presented in Table 4.2. Annual operating expenses have approximated $5 million during the 10-year period. FY 2018 operating expenses decreased by $421 thousand from FY 2017. During the same period, routine maintenance expenses decreased $1.3 million to $2.7 million primarily due to the prior year, FY 2017, requiring the biennial bridge inspection.
Table 4.1 - Sunshine Skyway Bridge Historical Transactions and Revenue Growth
FY 2008 through FY 2018
Fiscal Year
Transactions (000)Toll Revenue(1)
($000)Average
TollToll
PayingNon
Revenue TotalPercent Change Amount
Percent Change
2008 18,192 15 18,207 - $17,025 - $0.935
2009 17,607 32 17,639 (3.1%) 16,212 (4.8%) 0.919
2010 17,764 22 17,786 0.8 16,310 0.6 0.917
2011 17,974 31 18,005 1.2 16,427 0.7 0.912
2012 18,102 48 18,150 0.8 16,555 0.8 0.912
2013 18,439 63 18,502 1.9 21,722 31.2 1.174
2014 19,131 48 19,179 3.7 22,630 4.2 1.180
2015 20,233 59 20,292 5.8 23,978 6.0 1.182
2016 20,985 61 21,046 3.7 24,801 3.4 1.178
2017 21,517 64 21,581 2.5 25,524 2.9 1.183
2018 (2) 21,568 670 22,238 3.0 26,675 4.5 1.200
Source: FDOT Office of the Comptroller and Turnpike Enterprise Finance Office.Note: The non-revenue class includes authorized vehicles that pass through a toll plaza without incurring a toll (i.e., law enforcement, emergency vehicles) and transactions reported during toll suspensions attributable to hurricanes.(1) Toll revenue reported net of the SunPass discount. Per new revenue reporting methodology, starting FY 2014 toll revenue excludes violation and miscellaneous revenues, which are immaterial to toll revenues reported within.(2) Higher non-revenue transactions due to toll suspension during Hurricane Irma.
Table 4.2 - Sunshine skyway Bridge Historical Operating and Routine
Maintenance Expenses FY 2008 through FY 2018
Fiscal Year
Operating Expense($000)
Routine Maintenance Expense (1)
($000)
Total O&M Expenses
($000)2008 $5,185 $1,582 $6,767
2009 5,129 2,165 7,294
2010 4,793 1,575 6,368
2011 5,074 2,475 7,549
2012 4,930 1,770 6,700
2013 4,672 2,325 6,997
2014 4,754 1,651 6,405
2015 4,959 2,365 7,324
2016 4,695 2,325 7,020
2017 5,291 3,932 9,223
2018 4,870 2,677 7,547
Source: FDOT Office of the Comptroller. (1) Operating expense restated from FY 2014 through FY 2017

42 FY 2018 Annual Report
ENTERPRISE TOLL OPERATIONS
Florida Department of Transportation
Sunshine Skyway Bridge
week during FY 2018 for both northbound and southbound traffic combined. The weekday traffic on the facility has a morning peak from 6:00 a.m. to 9:00 a.m. and an evening peak from 3:00 p.m. to 6:00 p.m., reflecting the presence of commuters on the facility. During weekends from 11:00 a.m. to 5:00 p.m. traffic levels are approximately 4 thousand vehicles per hour. On weekends, there is no clear morning or evening peak periods indicating that a large number of non-commuters use the facility (e.g. interstate travel influence).
The FY 2018 monthly transaction variation is analyzed in Table 4.4. Annual average daily transactions (AADT) on the Sunshine Skyway Bridge for FY 2018 was 60,900. The peak season occurred from February through April, with March being the highest month at 15 percent above average for the facility. This is due to
tourists and seasonal residents. Historically, the month of September has the fewest transactions.
Table 4.4 - Sunshine Skyway BridgeSeasonal Transaction Variation
FY 2018
Month
Average Daily TransactionsSeasonal
FactorNorth Plaza
South Plaza Total
July 2017 29,300 28,400 57,700 0.95
August 29,200 28,400 57,600 0.95
September 24,300 23,700 48,000 0.79
October 30,100 28,900 59,000 0.97
November 31,400 30,200 61,600 1.01
December 31,200 30,000 61,200 1.00
January 2018 30,800 29,900 60,700 1.00
February 34,600 33,000 67,600 1.11
March 35,900 34,200 70,100 1.15
April 33,400 32,300 65,700 1.08
May 30,700 29,600 60,300 0.99
June 31,600 30,400 62,000 1.02
AADT 31,000 29,900 60,900 1.00
experienced the largest amount of transactions in FY 2018, with March being the busiest month.
Graph 4.1 shows the number of hourly weekday and weekend transactions of a typical
Table 4.3 - Sunshine skyway Bridge Monthly Transactions and Toll Revenue
FY 2018
Month
Transactions (000) Toll Revenue ($000)North Plaza
South Plaza Total
North Plaza
South Plaza Total
July 2017 907 882 1,789 $1,074 $1,034 $2,108
August 907 879 1,786 1,072 1,041 2,113
September 730 711 1,441 492 460 952
1st Quarter Total 2,544 2,472 5,016 2,638 2,535 5,173
October 933 896 1,829 1,121 986 2,107
November 943 907 1,850 1,204 1,147 2,351
December 968 929 1,897 1,237 1,185 2,422
2nd Quarter Total 2,844 2,732 5,576 3,562 3,318 6,880
January 2018 955 927 1,882 1,215 1,179 2,394
February 968 925 1,893 1,237 1,178 2,415
March 1,114 1,059 2,173 1,412 1,340 2,752
3rd Quarter Total 3,037 2,911 5,948 3,864 3,697 7,561
April 1,002 968 1,970 1,252 1,218 2,470
May 951 917 1,868 1,191 1,148 2,339
June 947 913 1,860 1,146 1,106 2,252
4th Quarter Total 2,900 2,798 5,698 3,589 3,472 7,061
Annual Total 11,325 10,913 22,238 $13,653 $13,022 $26,675
Source: FDOT Office of the Comptroller (Annual Toll Revenue) and Turnpike Enterprise Finance Office.Note: Transactions represent toll-paying and non-revenue traffic at mainline plazas.
Source: Data obtained from Turnpike Enterprise Finance Office for the 7-day period beginning Monday, November 6, 2017
Graph 4.1 - Sunshine skyway bridge Typical Hourly Transactions
(Northbound and southbound) FY 2018
0
1,000
2,000
3,000
4,000
5,000
6,000
Tran
sact
ions
Time of DayWeekday Weekend
12AM
10PM
8PM
6PM
4PM
2PM
12PM
10AM
8AM
6AM
4AM
2AM
12AM

43FY 2018 Annual Report Sunshine Skyway Bridge
ENTERPRISE TOLL OPERATIONS
Florida Department of Transportation
transponder pay $0.43 less than cash drivers. As stated before, SunPass® customers with three or more axle vehicles receive a 10 percent retroactive discount when they reach a threshold of 40 monthly toll payments. The nearby Pinellas Bayway System also participates in the discount program. SunPass® discounts on the Sunshine Skyway Bridge totaled $22 thousand in FY 2018.
Table 4.5 shows the percentage of transactions by payment method on the Sunshine Skyway Bridge. Non-SunPass® transactions amounted to approximately 7.9 million, or 36 percent of all transactions; whereas, SunPass® transactions totaled 14.3 million, or 64 percent of all transactions on the facility. Over the course
of FY 2018, the monthly SunPass® transaction percentage ranged from approximately 62 to 67 percent.
Table 4.6 shows the gross toll revenue by payment
The traffic and revenue contributions from trucks on the Sunshine Skyway Bridge are shown in Graph 4.2. For FY 2018, trucks accounted for 3 percent of the traffic on the facility but accounted for 9 percent of the total revenue. In terms of actual revenue contributions, vehicles with three or more axles provided approximately
$2.4 million, while two-axle vehicles comprised the remaining $24.3 million.
4.3 SUNPASS® There are two dedicated SunPass® lanes and four mixed-use lanes at each toll plaza, serving both cash and SunPass® users. Drivers of two-axle vehicles with a SunPass®
Graph 4.2 - Sunshine Skyway Bridge Transactions by Axle Class
FY 2018
9%
91%
AdditionalAxles
Two Axles
3%
97%
AdditionalAxles
Two Axles
Revenue Contribution by Axle Class FY 2018
Table 4.5 - Sunshine Skyway Bridge Transactions by Payment Method
FY 2018
Month
Transactions (000)Percent
SunPass®SunPass®Non-
SunPass® TotalJuly 2017 1,121 668 1,789 62.7%
August 1,178 608 1,786 66.0
September 888 553 1,441 61.6
October 1,150 679 1,829 62.9
November 1,188 662 1,850 64.2
December 1,201 696 1,897 63.3
January 2018 1,219 663 1,882 64.8
February 1,203 690 1,893 63.5
March 1,366 807 2,173 62.9
April 1,286 684 1,970 65.3
May 1,251 617 1,868 67.0
June 1,247 613 1,860 67.0
Total 14,298 7,940 22,238
Percentage 64.3% 35.7% 100.0%
Source: Turnpike Enterprise Finance Office.Note: Non-SunPass® transactions represent cash and non-revenue transactions
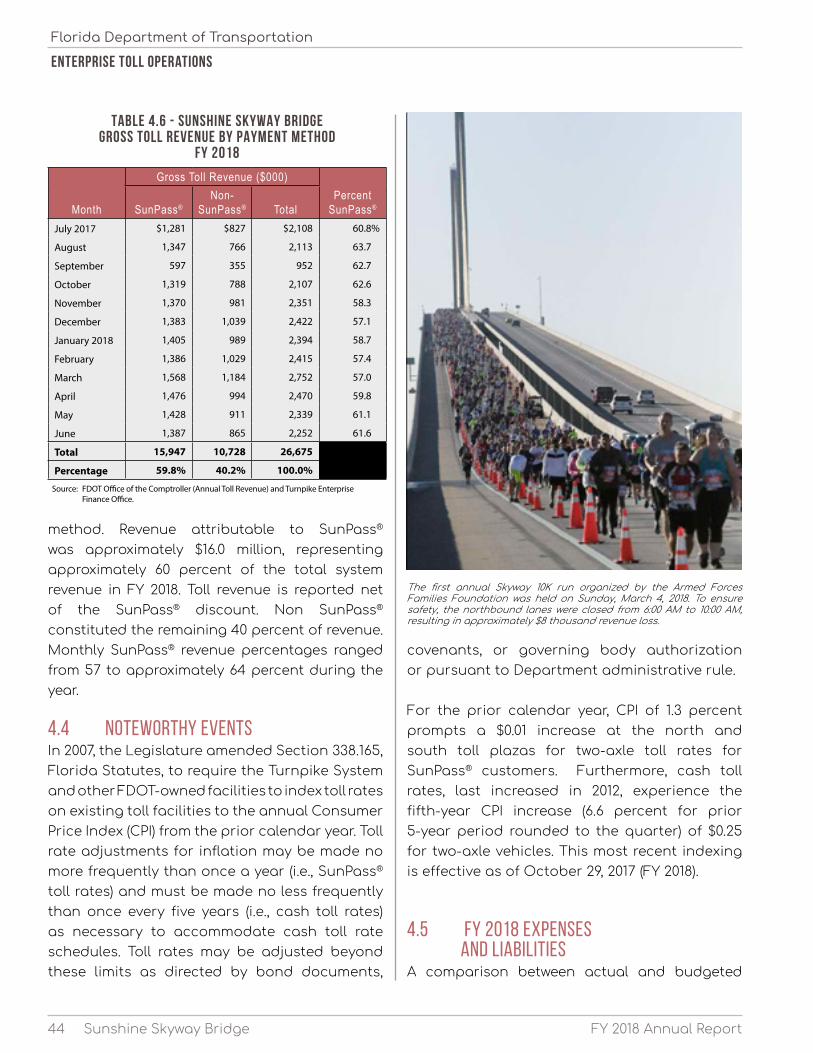
44 FY 2018 Annual ReportSunshine Skyway Bridge
ENTERPRISE TOLL OPERATIONS
Florida Department of Transportation
method. Revenue attributable to SunPass® was approximately $16.0 million, representing approximately 60 percent of the total system revenue in FY 2018. Toll revenue is reported net of the SunPass® discount. Non SunPass® constituted the remaining 40 percent of revenue. Monthly SunPass® revenue percentages ranged from 57 to approximately 64 percent during the year.
4.4 NOTEWORTHY EVENTS In 2007, the Legislature amended Section 338.165, Florida Statutes, to require the Turnpike System and other FDOT-owned facilities to index toll rates on existing toll facilities to the annual Consumer Price Index (CPI) from the prior calendar year. Toll rate adjustments for inflation may be made no more frequently than once a year (i.e., SunPass® toll rates) and must be made no less frequently than once every five years (i.e., cash toll rates) as necessary to accommodate cash toll rate schedules. Toll rates may be adjusted beyond these limits as directed by bond documents,
Table 4.6 - Sunshine Skyway Bridge Gross Toll Revenue by Payment Method
FY 2018
Month
Gross Toll Revenue ($000)Percent
SunPass®SunPass®Non-
SunPass® TotalJuly 2017 $1,281 $827 $2,108 60.8%
August 1,347 766 2,113 63.7
September 597 355 952 62.7
October 1,319 788 2,107 62.6
November 1,370 981 2,351 58.3
December 1,383 1,039 2,422 57.1
January 2018 1,405 989 2,394 58.7
February 1,386 1,029 2,415 57.4
March 1,568 1,184 2,752 57.0
April 1,476 994 2,470 59.8
May 1,428 911 2,339 61.1
June 1,387 865 2,252 61.6
Total 15,947 10,728 26,675
Percentage 59.8% 40.2% 100.0%
Source: FDOT Office of the Comptroller (Annual Toll Revenue) and Turnpike Enterprise Finance Office.
covenants, or governing body authorization or pursuant to Department administrative rule.
For the prior calendar year, CPI of 1.3 percent prompts a $0.01 increase at the north and south toll plazas for two-axle toll rates for SunPass® customers. Furthermore, cash toll rates, last increased in 2012, experience the fifth-year CPI increase (6.6 percent for prior 5-year period rounded to the quarter) of $0.25 for two-axle vehicles. This most recent indexing is effective as of October 29, 2017 (FY 2018).
4.5 FY 2018 EXPENSES AND LIABILITIES A comparison between actual and budgeted
The first annual Skyway 10K run organized by the Armed Forces Families Foundation was held on Sunday, March 4, 2018. To ensure safety, the northbound lanes were closed from 6:00 AM to 10:00 AM, resulting in approximately $8 thousand revenue loss.

45FY 2018 Annual Report Sunshine Skyway Bridge
ENTERPRISE TOLL OPERATIONS
Florida Department of Transportation
operating and routine maintenance expenses for FY 2018 is shown in Table 4.7.
Actual FY 2018 operating expenses were $10 thousand, lower than the FY 2018 operating budget. Routine maintenance expenses were 8.2 percent, or $204 thousand, higher than the FY 2018 budget amount primarily due to timing differences of FY 2017 budgeted expenses paid in FY 2018. Overall, actual FY 2018 operating and routine maintenance expenses were 2.6 percent higher than the budget.
The Sunshine Skyway Bridge has two liabilities due to the Department. First are expenditures for improvements or new projects on the Sunshine Skyway Bridge. An analysis of the FY 2018 liability
for facility costs is presented in Table 4.8, which shows the State Transportation Trust Fund (STTF)
advances for facility costs.
The second liability is for off-system improvements and is presented in Table 4.9. Off-system capital projects include the Right- of-Way purchases related to the Gateway Expressway, SR 70, Howard Frankland Bridge and reconstruction of the Skyway rest areas. These costs are initially funded by the STTF and are being reimbursed by excess revenue after operating and maintenance (O&M) expenses and facility costs and future revenue bonds. Pursuant to Section 338.165 (4), Florida Statutes, the Department is authorized to issue bonds backed by Sunshine Skyway Bridge toll revenues to help fund these needed transportation projects located in Manatee, Hillsborough and Pinellas Counties. Subject to change, the Department plans to issue bonds in FY 2019 backed by Sunshine Skyway Bridge revenue to fund those projects.
4.6 TRAFFIC, REVENUE AND EXPENSE FORECASTS The ratio between historical traffic growth and population growth was used along with projected population growth to estimate future traffic on the Sunshine Skyway Bridge. Population growth in Hillsborough, Manatee, Pasco, Pinellas and Sarasota counties has had a significant impact on the facility. Since
Table 4.7 - Sunshine Skyway Bridge Operating and Routine Maintenance
ExpenseFY 2018
Type of ExpenseBudget($000)
Actual($000)
Over/ (Under)($000) Variance
Operating $4,880 $4,870 ($10) (0.2%)
Routine Maintenance 2,473 2,677 204 8.2
Total $7,353 $7,547 $194 2.6%
Source: FDOT Office of the Comptroller, Turnpike Enterprise Finance Office and the FY 2017 Enterprise Toll Operations Traffic Engineer’s Annual Report.
Table 4.8 - Sunshine Skyway Bridge STTF Advances for Facility Costs
FY 2018
TransactionAmount($000)
Balance, beginning of year $9,884
Additions(1) 8,561
Reductions(2) (9,884)
Reclassification (1,016)
Balance, end of year $7,545
Source: FDOT Office of the Comptroller.(1) Additions represent costs incurred in the FY being reported.(2) Reductions represent costs from prior FY that were reimbursed in the
FY being reported.
Table 4.9 - SunShine skyway Bridge Deferred STTF Advances for Off-System
ImprovementsFY 2018
TransactionAmount($000)
Balance, beginning of year $12,391
Additions 2,505
Reductions (9,002)
Reclassification 1,016
Balance, end of year $6,910
Source: FDOT Office of the Comptroller.
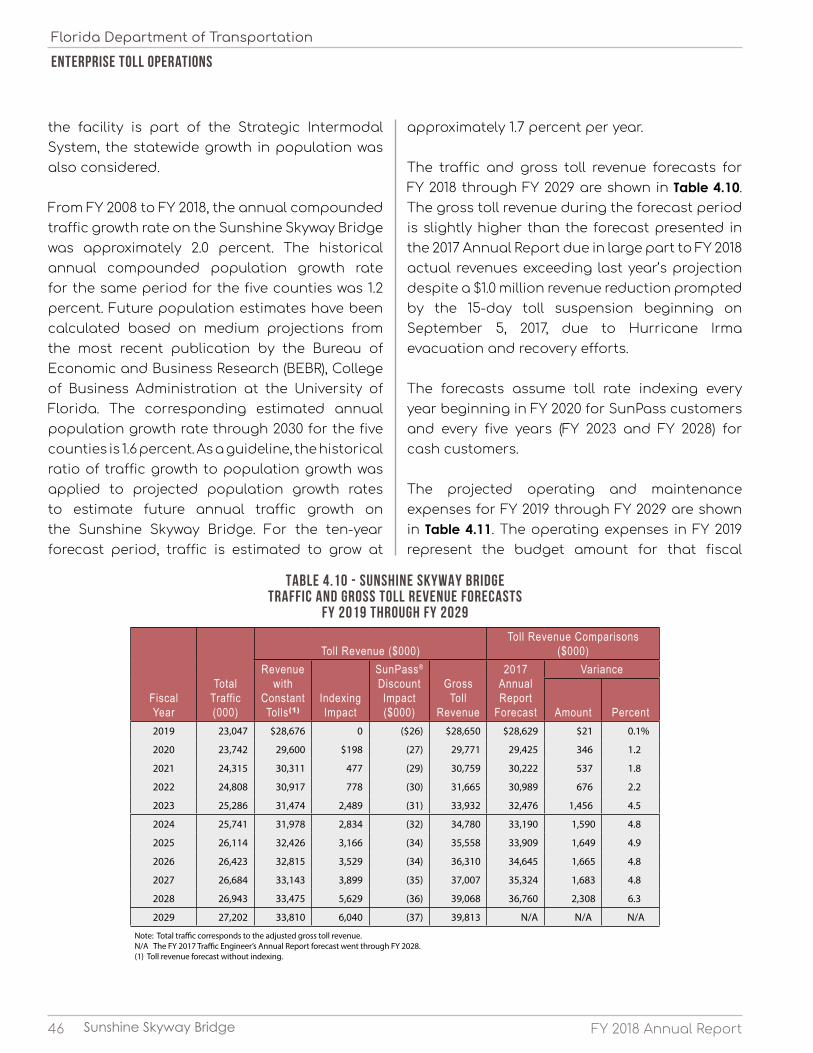
46 FY 2018 Annual Report
ENTERPRISE TOLL OPERATIONS
Florida Department of Transportation
Sunshine Skyway Bridge
approximately 1.7 percent per year.
The traffic and gross toll revenue forecasts for FY 2018 through FY 2029 are shown in Table 4.10. The gross toll revenue during the forecast period is slightly higher than the forecast presented in the 2017 Annual Report due in large part to FY 2018 actual revenues exceeding last year’s projection despite a $1.0 million revenue reduction prompted by the 15-day toll suspension beginning on September 5, 2017, due to Hurricane Irma evacuation and recovery efforts.
The forecasts assume toll rate indexing every year beginning in FY 2020 for SunPass customers and every five years (FY 2023 and FY 2028) for cash customers.
The projected operating and maintenance expenses for FY 2019 through FY 2029 are shown in Table 4.11. The operating expenses in FY 2019 represent the budget amount for that fiscal
the facility is part of the Strategic Intermodal System, the statewide growth in population was also considered.
From FY 2008 to FY 2018, the annual compounded traffic growth rate on the Sunshine Skyway Bridge was approximately 2.0 percent. The historical annual compounded population growth rate for the same period for the five counties was 1.2 percent. Future population estimates have been calculated based on medium projections from the most recent publication by the Bureau of Economic and Business Research (BEBR), College of Business Administration at the University of Florida. The corresponding estimated annual population growth rate through 2030 for the five counties is 1.6 percent. As a guideline, the historical ratio of traffic growth to population growth was applied to projected population growth rates to estimate future annual traffic growth on the Sunshine Skyway Bridge. For the ten-year forecast period, traffic is estimated to grow at
Table 4.10 - Sunshine Skyway Bridge Traffic and Gross Toll Revenue Forecasts
FY 2019 through FY 2029
Fiscal Year
Total Traffic (000)
Toll Revenue ($000)Toll Revenue Comparisons
($000)Revenue
with Constant Tolls(1)
Indexing Impact
SunPass® Discount Impact ($000)
Gross Toll
Revenue
2017 Annual Report
Forecast
Variance
Amount Percent2019 23,047 $28,676 0 ($26) $28,650 $28,629 $21 0.1%
2020 23,742 29,600 $198 (27) 29,771 29,425 346 1.2
2021 24,315 30,311 477 (29) 30,759 30,222 537 1.8
2022 24,808 30,917 778 (30) 31,665 30,989 676 2.2
2023 25,286 31,474 2,489 (31) 33,932 32,476 1,456 4.5
2024 25,741 31,978 2,834 (32) 34,780 33,190 1,590 4.8
2025 26,114 32,426 3,166 (34) 35,558 33,909 1,649 4.9
2026 26,423 32,815 3,529 (34) 36,310 34,645 1,665 4.8
2027 26,684 33,143 3,899 (35) 37,007 35,324 1,683 4.8
2028 26,943 33,475 5,629 (36) 39,068 36,760 2,308 6.3
2029 27,202 33,810 6,040 (37) 39,813 N/A N/A N/A
Note: Total traffic corresponds to the adjusted gross toll revenue. N/A The FY 2017 Traffic Engineer’s Annual Report forecast went through FY 2028.(1) Toll revenue forecast without indexing.

47FY 2018 Annual Report
ENTERPRISE TOLL OPERATIONS
Florida Department of Transportation
Sunshine Skyway Bridge
year. Subsequent to FY 2019, operating expenses are projected to grow at 2.5 percent annually to account for inflation.
The routine maintenance expense forecast is provided by the Department’s Office of Project Finance through FY 2024. Subsequent to FY 2024, routine maintenance expenses have been increased 2.5 percent annually.
Periodic maintenance expenses were provided by the Department’s Office of Project Finance and are based on estimated expenditures for projects included in the Work Program and include bridge repairs, bridge painting and fishing pier repairs.
Net revenues are currently being used to reimburse the Department, first for system related costs, and then non-system related costs (long term debt).
Table 4.11 - Sunshine skyway Bridge
Projected Operating and Maintenance Expenses FY 2019 through FY 2029
Fiscal Year
Operating Expense($000)
Routine Maintenance
Expense($000)
Total Operating &
Routine Maintenance
Expenses($000)
Periodic Maintenance Expense(1)
($000)
Total O&M Expenses
($000)2019 $5,157 $3,018 $8,175 $10,162 $18,337
2020 5,286 2,398 7,684 12,882 20,566
2021 5,418 3,062 8,480 8,557 17,037
2022 5,553 2,240 7,793 7,110 14,903
2023 5,692 3,138 8,830 3,869 12,699
2024 5,834 2,296 8,130 3,965 12,095
2025 5,980 3,217 9,197 4,064 13,261
2026 6,130 2,354 8,484 4,166 12,650
2027 6,283 3,297 9,580 4,270 13,850
2028 6,440 2,412 8,852 4,377 13,229
2029 6,601 3,380 9,981 4,486 14,467
Note: Operating expenses are based on the budget developed by Turnpike Enterprise Finance Office for FY 2019.(1) Periodic maintenance expenses include bridge repairs, bridge painting, Florida Highway Patrol services and other Department-funded improvements included in the 5-year Work Program and are reported on a cash basis. Periodic maintenance expenses beyond FY 2023 have not been fully programmed. However, a minimal level of preservation (excluding extraordinary expenses such as major bridge repairs) has been estimated based on FY 2023 expenses increased at 2.5 percent annually.

48 FY 2018 Annual Report
ENTERPRISE TOLL OPERATIONS
Florida Department of Transportation
THIS PAGE INTENTIONALLY LEFT BLANK
Sunshine Skyway Bridge
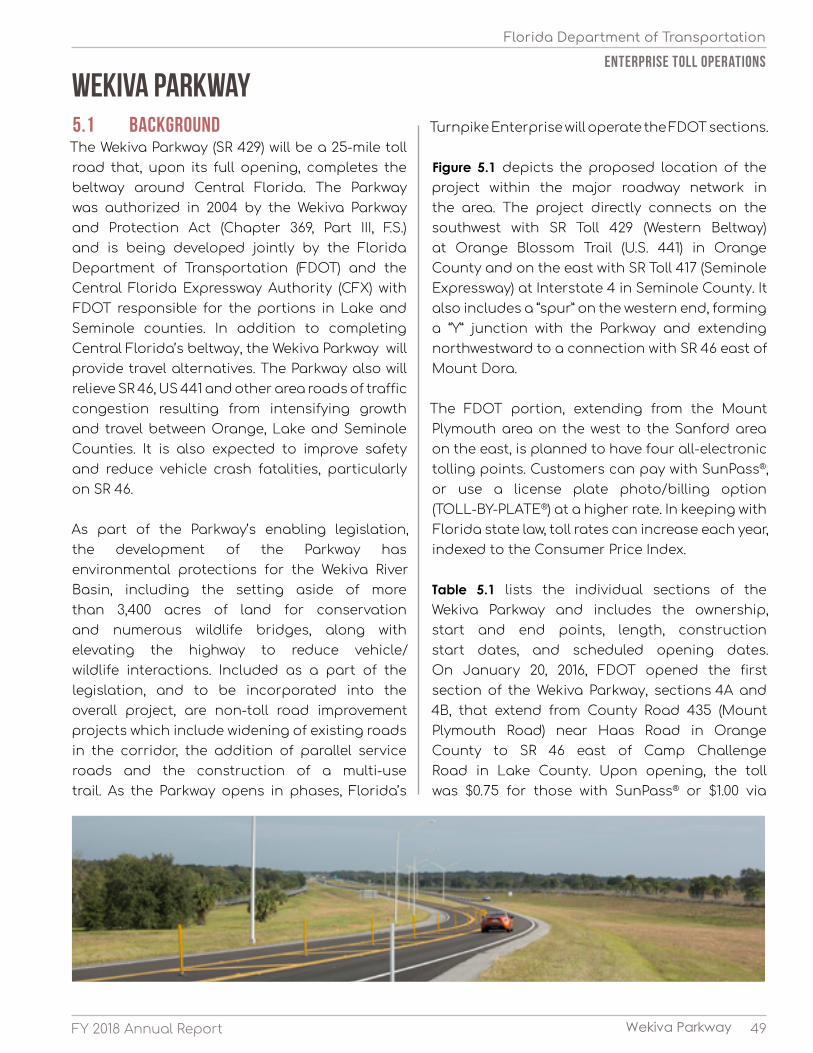
49FY 2018 Annual Report
ENTERPRISE TOLL OPERATIONS
Florida Department of Transportation
Wekiva Parkway
5.1 BACKGROUNDThe Wekiva Parkway (SR 429) will be a 25-mile toll road that, upon its full opening, completes the beltway around Central Florida. The Parkway was authorized in 2004 by the Wekiva Parkway and Protection Act (Chapter 369, Part III, F.S.) and is being developed jointly by the Florida Department of Transportation (FDOT) and the Central Florida Expressway Authority (CFX) with FDOT responsible for the portions in Lake and Seminole counties. In addition to completing Central Florida’s beltway, the Wekiva Parkway will provide travel alternatives. The Parkway also will relieve SR 46, US 441 and other area roads of traffic congestion resulting from intensifying growth and travel between Orange, Lake and Seminole Counties. It is also expected to improve safety and reduce vehicle crash fatalities, particularly on SR 46.
As part of the Parkway’s enabling legislation, the development of the Parkway has environmental protections for the Wekiva River Basin, including the setting aside of more than 3,400 acres of land for conservation and numerous wildlife bridges, along with elevating the highway to reduce vehicle/wildlife interactions. Included as a part of the legislation, and to be incorporated into the overall project, are non-toll road improvement projects which include widening of existing roads in the corridor, the addition of parallel service roads and the construction of a multi-use trail. As the Parkway opens in phases, Florida’s
Wekiva ParkwayTurnpike Enterprise will operate the FDOT sections.
Figure 5.1 depicts the proposed location of the project within the major roadway network in the area. The project directly connects on the southwest with SR Toll 429 (Western Beltway) at Orange Blossom Trail (U.S. 441) in Orange County and on the east with SR Toll 417 (Seminole Expressway) at Interstate 4 in Seminole County. It also includes a “spur” on the western end, forming a “Y” junction with the Parkway and extending northwestward to a connection with SR 46 east of Mount Dora.
The FDOT portion, extending from the Mount Plymouth area on the west to the Sanford area on the east, is planned to have four all-electronic tolling points. Customers can pay with SunPass®, or use a license plate photo/billing option (TOLL-BY-PLATE®) at a higher rate. In keeping with Florida state law, toll rates can increase each year, indexed to the Consumer Price Index.
Table 5.1 lists the individual sections of the Wekiva Parkway and includes the ownership, start and end points, length, construction start dates, and scheduled opening dates. On January 20, 2016, FDOT opened the first section of the Wekiva Parkway, sections 4A and 4B, that extend from County Road 435 (Mount Plymouth Road) near Haas Road in Orange County to SR 46 east of Camp Challenge Road in Lake County. Upon opening, the toll was $0.75 for those with SunPass® or $1.00 via
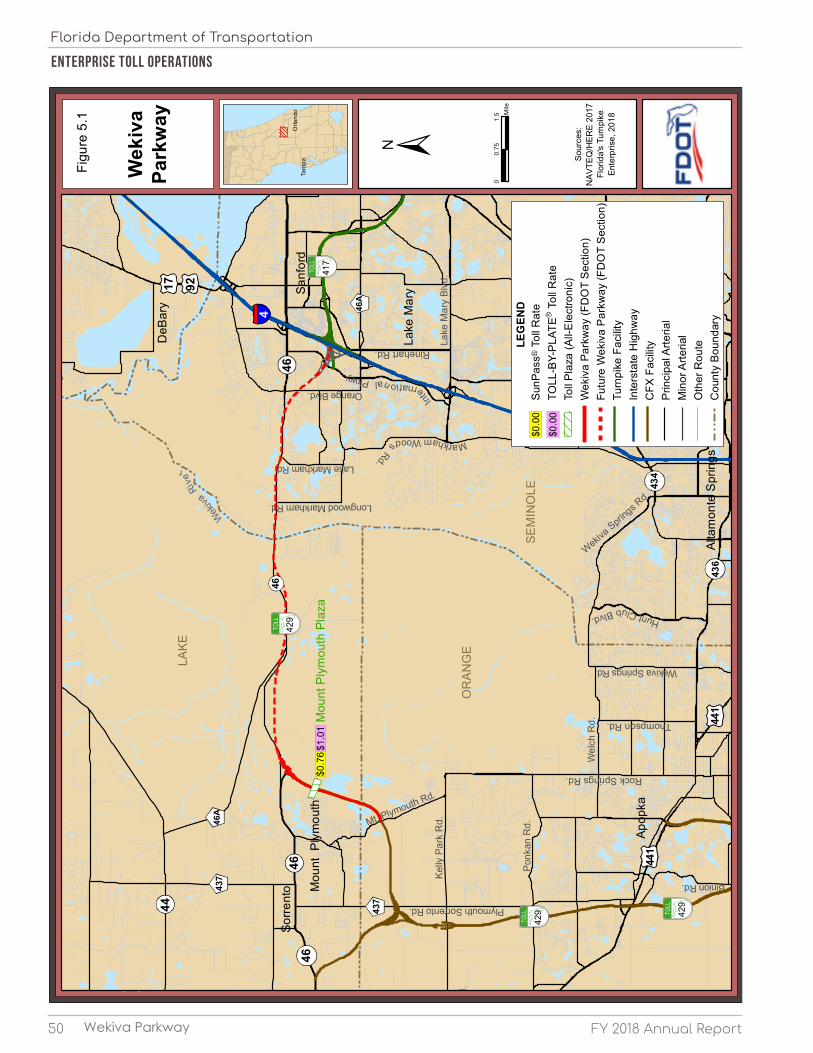
50 FY 2018 Annual Report
ENTERPRISE TOLL OPERATIONS
Florida Department of Transportation
Wekiva Parkway
Orla
ndo
Tam
pa Sour
ces:
NAV
TEQ
/HER
E 20
17Fl
orid
a's
Turn
pike
Ente
rpris
e, 2
018
00.
751.
5 Mile
DeB
ary
Sanf
ord
Lake
Mar
y
Apop
ka
Long
woo
d
Alta
mon
te S
prin
gs
Sorre
nto M
ount
Ply
mou
th
Plymouth Sorrento Rd.
Sadl
erR
d.
Kelly
Par
k R
d.
Ponk
an R
d.Mt. Plymouth Rd.
Lake
Mar
y Bl
vd.
Orange Blvd.
Longwood Markham Rd.
Lake Markham Rd.
Rinehart Rd.
SEM
INO
LE
OR
AN
GE
LAKE
Wekiva Spri
ngs Rd.
Wel
ch R
d.
Wekiva Springs Rd.
Rock Springs Rd.
Binion Rd.
Int
ernationalPkwy.
Thompson Rd.
46
46A 17 92
HuntClubBlvd.
Wek
iva
Rive
r
434
Mou
nt P
lym
outh
Pla
za
MarkhamWoodsRd.
4646
43744
46A
437
46
4
17 92
441
441
$1.0
1$0
.76
436
Figu
re 5
.1
Wek
iva
Park
way
LEG
END
$0.0
0
$0.0
0To
ll Pl
aza
(All-
Ele
ctro
nic)
Wek
iva
Park
way
(FD
OT
Sect
ion)
Futu
re W
ekiv
a Pa
rkw
ay (F
DO
T Se
ctio
n)Tu
rnpi
ke F
acilit
yIn
ters
tate
Hig
hway
CFX
Fac
ility
Prin
cipa
l Arte
rial
Min
or A
rteria
lO
ther
Rou
teC
ount
y Bo
unda
ry
SunP
ass
Tol
l Rat
eTO
LL-B
Y-PL
ATE
Tol
l Rat
e

51FY 2018 Annual Report
ENTERPRISE TOLL OPERATIONS
Florida Department of Transportation
Wekiva Parkway
the TOLL-BY-PLATE® program, plus $2.50 per invoice in administrative fees. Effective October 29, 2017 (FY 2018), tolls were indexed to $0.76 for SunPass® and $1.01 for TOLL-BY-PLATE® customers.
5.2 FY 2018 TRANSACTIONS, REVENUES AND EXPENSESAs shown in Table 5.2, there were 1.1 million transactions in FY 2018 and toll revenues amounting to over $0.9 million, resulting in an average toll of $0.80 per vehicle. During FY 2018, tolls were suspended for fifteen days beginning on September 5, 2017, to aid in the evacuation and recovering efforts due to Hurricane Irma. This suspension resulted in a $30 thousand revenue loss.
The monthly transaction variation for FY 2018 is analyzed in Table 5.3. On average, 3 thousand vehicles traveled through the toll plaza each day. Over the course of the year, the average daily traffic (ADT) has been generally increasing due to ramp up and completion of CFX section of this facility end of March 2018.
Table 5.1 - Wekiva Parkway Facility Project Descriptions
Owner Section Project LimitLength(miles)
ConstructionStart Date
ScheduledOpening Date
CFX
1A US 441 to Ponkan Road 2.13 Third Quarter, 2015 July 27, 2017
1B Ponkan Road to New Kelly Park Road Interchange 2.38 Third Quarter, 2015 July 27, 2017
2A Kelly Park Road Interchange to CR 435/Mt. Plymouth Road 2.90 Third Quarter, 2016 March 31, 2018
2B Systems Interchange (Haas Road-Ondich Road) 0.78 First Quarter, 2016 March 31, 2018
2C Round Lake Road to Lake County-Orange County Line 1.40 Second Quarter, 2016 March 31, 2018
FDOT
3A SR 46 from Vista View Lane to Round Lake Road 1.40 Third Quarter, 2017 Second Quarter, 2020
3B SR 46 from US 441 to Vista View Lane (US 441 flyover interchange) 0.00 Third Quarter, 2017 Second Quarter, 2020
4A CR 435/Mount Plymouth Road to the Lake County Line3.14 Fourth Quarter, 2012 January 20, 2016
4B Orange County Line to Old McDonald Road
5 CR 46A Realignment from Arundel Way to SR 46 2.50 Second Quarter, 2017 Third Quarter, 2019
6 Old McDonald Road to Wekiva Park Road 5.50 Fourth Quarter, 2017 First Quarter, 2021
7A Wekiva Park Drive to Orange Boulevard 3.53 Second Quarter, 2018 Second Quarter, 2022
7B SR 46 from Center Road to I-4 1.87 Third Quarter, 2019 First Quarter, 2021
8 Orange Boulevard to Rinehart Road 2.63 Fourth Quarter, 2018 Fourth Quarter, 2022
Source: www.wekivaparkway.com
Table 5.2 - Wekiva parkwayMonthly Transactions and Toll Revenue
FY 2018
Month
TransactionsTotal
Revenue (1)Average
TollToll
PayingNon
Revenue TotalFY 2016(2) 220,536 2,278 222,814 $165,952 $0.745
FY 2017 725,142 11,136 736,278 $587,966 $0.799
FY 2018:
July 2017 69,131 648 69,779 $56,935
August 79,251 707 79,958 66,724
September 35,138 33,726 68,864 28,901
October 77,356 858 78,214 63,975
November 75,286 626 75,912 62,760
December 75,925 510 76,435 63,375
January 2018 78,722 680 79,402 65,848
February 82,149 626 82,775 70,911
March 83,231 594 83,825 68,495
April 126,287 1,173 127,460 105,807
May 136,329 1,154 137,483 117,220
June 137,859 1,112 138,971 106,775
Total 1,056,664 42,414 1,099,078 $877,726 $0.799
Source: FDOT Office of the Comptroller and Turnpike Enterprise Finance Office.(1) Per new revenue reporting methodology, starting FY 2016 toll revenues exclude violation and miscellaneous revenues, which are immaterial to toll revenues reported within.(2) FY 2016 represents a partial year opening on January 20, 2016.
Note: The non-revenue class includes authorized vehicles that pass through a toll plaza without incurring a toll (i.e., law enforcement, emergency vehicles) and transactions reported during toll suspensions attributable to hurricanes. Higher non revenue transactions in September due to toll suspension during Hurricane Irma.

52 FY 2018 Annual Report
ENTERPRISE TOLL OPERATIONS
Florida Department of Transportation
Wekiva Parkway
Transactions on Wekiva Parkway also vary by time of day. Graph 5.1 shows the number of hourly weekday and weekend transactions of a typical week at the mainline plazas during FY 2018. Weekday travel demand on the facility peaks from 7:00 to 8:00 AM and again between
5:00 and 6:00 PM. Weekend traffic remains relatively flat throughout the day indicating that this facility is primarily used as a commuting route on weekdays.
The “N minus 1” method of toll collection is used on the Wekiva Parkway. This method results in a more equitable toll structure for passenger cars relative to trucks.
Graph 5.2 shows the truck transactions and revenue contributions for FY 2018. Trucks (3+ axle vehicles) accounted for 9 percent of traffic on the facility and 20 percent of the revenue. In terms of actual revenue contributions, two-axle vehicles provided approximately $703 thousand while
Table 5.3 - wekiva parkwaySeasonal Transaction Variation
FY 2018
Average Daily Transactions
MonthNorthbound
LanesSouthbound
Lanes TotalSeasonalFactor*
July 2017 1,200 1,100 2,300 0.77
August 1,400 1,200 2,600 0.87
September 1,200 1,100 2,300 0.77
October 1,300 1,200 2,500 0.83
November 1,300 1,200 2,500 0.83
December 1,300 1,200 2,500 0.83
January 2018 1,400 1,200 2,600 0.87
February 1,600 1,400 3,000 1.00
March (1) 1,300 1,400 2,700 0.90
April 2,300 1,900 4,200 1.40
May 2,400 2,000 4,400 1.47
June 2,500 2,100 4,600 1.53 AADT 1,600 1,400 3,000 1.00
Source: FDOT Office of the Comptroller and Turnpike Enterprise Finance Office.*Seasonal factors impacted by ramp up during early years after opening. (1) Northbound traffic declined due to closure of CR 435 northbound on ramp in preparation for opening of 5-mile CFX section of this facility.
Revenue Contribution by Axle Class FY 2018
20%
80%
AdditionalAxles
Two Axles0
50
100
150
200
250
300
350
400
12:00AM
2:00AM
4:00AM
6:00AM
8:00AM
10:00AM
12:00PM
2:00PM
4:00PM
6:00PM
8:00PM
10:00PM
12:00AM
Tran
sact
ion
s
Time of DayWeekday Weekend
Source: Data obtained from Turnpike Enterprise Finance Office for the 7-day period beginning Monday, January 15, 2018.
Graph 5.1 - wekiva parkway Typical Hourly Transactions
FY 2018
Graph 5.2 - Wekiva ParkwayTransactions by Axle Class
FY 2018
9%
91%
AdditionalAxles
Two Axles
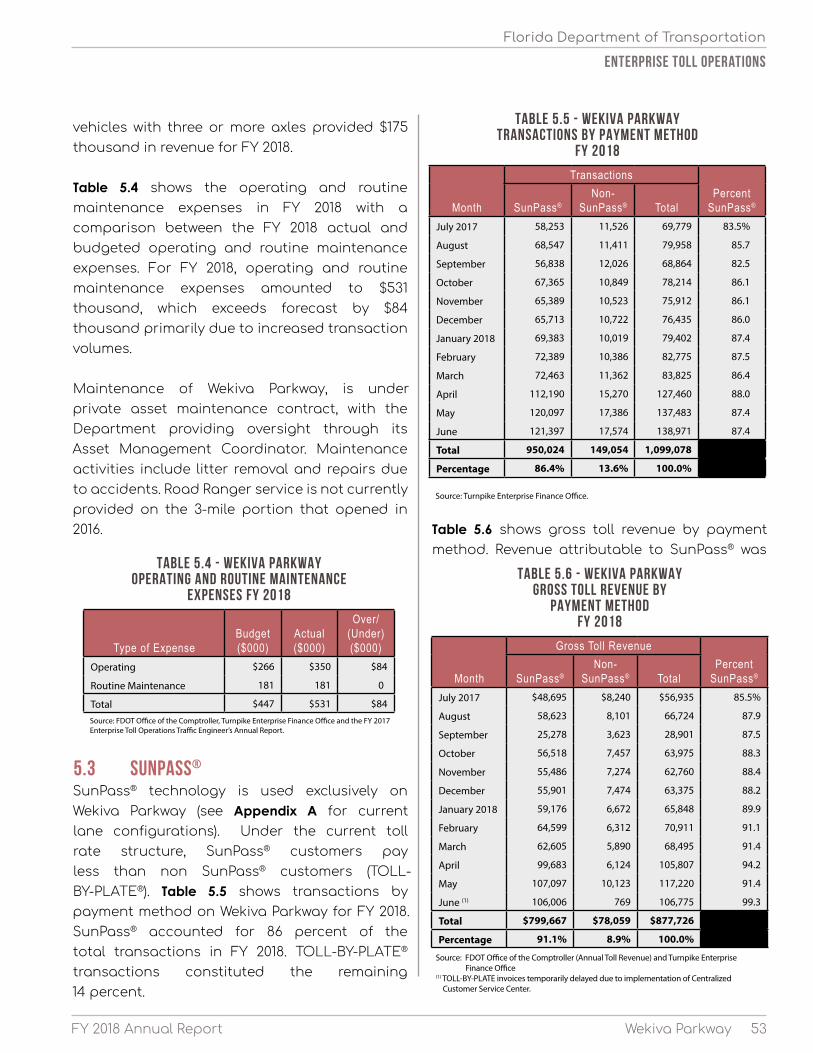
53FY 2018 Annual Report Wekiva Parkway
ENTERPRISE TOLL OPERATIONS
Florida Department of Transportation
Table 5.6 shows gross toll revenue by payment method. Revenue attributable to SunPass® was
vehicles with three or more axles provided $175 thousand in revenue for FY 2018.
Table 5.4 shows the operating and routine maintenance expenses in FY 2018 with a comparison between the FY 2018 actual and budgeted operating and routine maintenance expenses. For FY 2018, operating and routine maintenance expenses amounted to $531 thousand, which exceeds forecast by $84 thousand primarily due to increased transaction volumes.
Maintenance of Wekiva Parkway, is under private asset maintenance contract, with the Department providing oversight through its Asset Management Coordinator. Maintenance activities include litter removal and repairs due to accidents. Road Ranger service is not currently provided on the 3-mile portion that opened in 2016.
5.3 SUNPASS®
SunPass® technology is used exclusively on Wekiva Parkway (see Appendix A for current lane configurations). Under the current toll rate structure, SunPass® customers pay less than non SunPass® customers (TOLL-BY-PLATE®). Table 5.5 shows transactions by payment method on Wekiva Parkway for FY 2018. SunPass® accounted for 86 percent of the total transactions in FY 2018. TOLL-BY-PLATE® transactions constituted the remaining 14 percent.
Table 5.4 - Wekiva parkway Operating and Routine Maintenance
Expenses FY 2018
Type of ExpenseBudget ($000)
Actual ($000)
Over/ (Under) ($000)
Operating $266 $350 $84
Routine Maintenance 181 181 0
Total $447 $531 $84
Source: FDOT Office of the Comptroller, Turnpike Enterprise Finance Office and the FY 2017 Enterprise Toll Operations Traffic Engineer’s Annual Report.
Table 5.5 - wekiva parkway Transactions by Payment Method
FY 2018
Month
TransactionsPercent
SunPass®SunPass®Non-
SunPass® TotalJuly 2017 58,253 11,526 69,779 83.5%
August 68,547 11,411 79,958 85.7
September 56,838 12,026 68,864 82.5
October 67,365 10,849 78,214 86.1
November 65,389 10,523 75,912 86.1
December 65,713 10,722 76,435 86.0
January 2018 69,383 10,019 79,402 87.4
February 72,389 10,386 82,775 87.5
March 72,463 11,362 83,825 86.4
April 112,190 15,270 127,460 88.0
May 120,097 17,386 137,483 87.4
June 121,397 17,574 138,971 87.4
Total 950,024 149,054 1,099,078
Percentage 86.4% 13.6% 100.0%
Source: Turnpike Enterprise Finance Office.
Table 5.6 - wekiva parkway Gross Toll Revenue by
Payment Method FY 2018
Month
Gross Toll RevenuePercent
SunPass®SunPass®Non-
SunPass® TotalJuly 2017 $48,695 $8,240 $56,935 85.5%
August 58,623 8,101 66,724 87.9
September 25,278 3,623 28,901 87.5
October 56,518 7,457 63,975 88.3
November 55,486 7,274 62,760 88.4
December 55,901 7,474 63,375 88.2
January 2018 59,176 6,672 65,848 89.9
February 64,599 6,312 70,911 91.1
March 62,605 5,890 68,495 91.4
April 99,683 6,124 105,807 94.2
May 107,097 10,123 117,220 91.4
June (1) 106,006 769 106,775 99.3
Total $799,667 $78,059 $877,726
Percentage 91.1% 8.9% 100.0%
Source: FDOT Office of the Comptroller (Annual Toll Revenue) and Turnpike Enterprise Finance Office(1) TOLL-BY-PLATE invoices temporarily delayed due to implementation of Centralized Customer Service Center.

54 FY 2018 Annual Report
ENTERPRISE TOLL OPERATIONS
Florida Department of Transportation
Wekiva Parkway
approximately $800 thousand, representing 91 percent of the total revenue in FY 2018. TOLL-BY-PLATE® constituted the remaining 9 percent of revenue.
5.4 FORECASTSWekiva Parkway traffic and revenue forecasts, as provided by the Office of Toll Finance, for FY 2019 through FY 2029 are shown in Appendix D. Projected operating and maintenance expenses during this forecast period are shown in Table 5.7. The operating expenses for FY 2019 presented in this table represent the budgeted amount for that fiscal year (see Appendix C for a detailed description of the FY 2019 operating expense budget).
Given that the Parkway is a new facility, periodic maintenance is not yet a budgeted cost. Such costs, however, will be programmed when a need is determined.
Table 5.7 - Wekiva parkway Projected Operating and Maintenance
Expenses FY 2019 through FY 2029
FiscalYear
Operating Expense ($000)
Routine Maintenance
Expense($000)
Total Operating & Routine
Maintenance Expenses
($000)2019 $277 $12 $289
2020 284 16 300
2021 291 10 301
2022 298 10 308
2023 305 10 315
2024 313 10 323
2025 321 11 332
2026 329 11 340
2027 337 11 348
2028 345 11 356
2029 354 12 366
Note: Operating expenses are based on the budget developed by Turnpike Enterprise Finance Office for FY 2019 and inflated at 2.5 percent annually.