department of real estate & planning
TRANSCRIPT

Business SchoolDepartment of Real Estate & Planning
Working Papers in Real Estate & Planning 01/08
The copyright of each Working Paper remains with the author.
If you wish to quote from or cite any Paper please contact the appropriate author.
In some cases a more recent version of the paper may have been published elsewhere.

UNLISTED PROPERTY FUNDS AND THE EMERGING PROPERTY MARKETS
Andrew Baum, PhD
Chairman, Property Funds Research, 6 St Giles Court, Southampton Street, Reading, United Kingdom
Professor of Land Management, Department of Real Estate and Planning, University
of Reading Business School, Whiteknights, Reading RG6 6AW, United Kingdom
e-mail: [email protected] fax: 00 44 1491 871682
Key words: unlisted property funds, developing and emerging markets Note: This is a draft working paper which describes ongoing research work to be updated in future publications. In this draft working paper the author uses the term ‘we’ to denote the research team at Property Funds Research, whose significant contribution to this work is hereby acknowledged.

Baum Unlisted funds and developing markets
2
1. Introduction 1.1 Context High quality real estate is a fundamental necessity for a developed economy. It provides life-enhancing residential security and with it the potential for domestic saving through owner occupation of capital-preserving assets; it produces industrial and office space for the production and processing of output; and it delivers shopping and leisure facilities for the promotion of domestic consumption and tourism. While conformity of high quality design and construction may damage valued cultural differentiation, it also breaks down barriers between different lifestyles and introduces the possibility of cross-border trade, bringing with it expertise, skills and economic growth. The production of high quality real estate needs to be financed through large scale equity and debt capital. This requires the presence of an international banking system, but also the entrepreneurship represented by equity capital or foreign direct investment (FDI). For example, Lapoza (2006) traces the essential role real estate development plays in the development of emerging economies. He finds that foreign real estate capital was a major source of financing domestic property market office construction in Central Europe after the fall of the Berlin Wall in 1989. By analyzing the correlation of FDI flows to annual construction rates of office buildings, he seeks to explain the location of new or refurbished office buildings in the central business district (CBD) or in non-CBD locations and to test whether there is a positive correlation relationship of FDI flows and new office construction or refurbishment. The results point to the important link between incoming FDI and office construction in domestic city centres. FDI is greatly supported by a global boom in international institutional investing. An increased investor appetite for global investment in equities and bonds, and later property, has generated a structural market shift in cross-border investing observable since the mid 1990s. In the context of this paper, the change has had two main impacts: first, international property investment has boomed; second, indirect property investment (investing through securities and funds) has become commonplace. Recently both trends have been observable in most European countries with established pension funds.
The recent boom in cross border property investing has been significant. According to major brokerage houses, cross-border property investment has been growing much more quickly than domestic investment in the last five years. Running in parallel with this development has been a boom in listed real estate markets, especially in the Real Estate Investment Trust (REIT) format, and in the number and value of unlisted property funds. The growth of the listed REIT market is largely a matter of public record, but while investing in unlisted real estate vehicles has become an increasingly standard route to attaining international real estate exposure there is little available data describing this trend. The unlisted sector holds particular interest for this symposium. Rather than REITs or other forms of listed securities, which tend to focus on and be based in developed

Baum Unlisted funds and developing markets
3
markets, the unlisted fund has acted as an engine delivering capital from the developed world to developing and emerging property markets. 1.2 Objective This paper sets out to describe the changing nature of global property investment, to provide background information regarding the nature of unlisted property funds and their managers and investors, and especially the role played by unlisted property funds in facilitating cross-border investing. In particular, it focuses on the development of unlisted funds as intermediary structures carrying institutional capital from developed to developing markets. It presents the results of new research by UK research firm Property Funds Research (PFR) and the University of Reading which explores the extent to which this new vehicle has been effective in delivering capital to emerging markets. The research relates the number of funds targetting particular countries and to population and GDP per capita. It finds that there is a very strong relationship between the popularity of a country for investment through this vehicle format and these independent variables. More interesting, perhaps, is the identification of outlier countries where the amount of investment is significantly less - or greater - than that predicted by population and GDP per capita. In this research, we define the emerging markets as the regions outside Europe, Australasia and North America, and focus on the largest 55 countries in these regions by population. This produces a country cut-off of a minimum of roughly 20 million population and includes Asia, Latin America, Africa and the Middle East. 1.3 Limitations The paper has several limitations. We acknowledge the inadequacy of our definition of an emerging or developing market. For completeness and for the purposes of comparison, we have included all larger Asian markets, not including Australasia, despite the fact that Asia includes such highly mature markets as Japan, Hong Kong and Singapore. We have not reported the exposure of listed structures such as REITs or AIM property funds to the emerging markets. Data regarding this will be added in future work. Nonetheless, it must be said that the unlisted fund market is less constrained than the REIT market, as tax efficient unlisted fund structures can be established for investment in most markets, but a REIT market cannot exist – and capital cannot efficiently be invested – unless local REIT legislation has been passed. In early 2008, REIT markets in Asia and the emerging regions were limited to Mexico, Singapore, Malaysia, Hong Kong, Taiwan and Korea, although other markets were in the early stages of developing such structures. The data we use is taken from the PFR unlisted fund universe. This includes information on single region and funds investing in more than one region or country. We have reported the target exposure of an unlisted fund to a country by taking a simple unweighted division of its fund value (gross asset value, GAV) or estimated GAV (where no GAV figure is reported)) divided between the countries targeted by that fund. A comprehensive breakdown of the fund universe by specific geographic

Baum Unlisted funds and developing markets
4
allocations will require more maturity in the PFR dataset, especially in the emerging markets. Finally, we have not completed a full survey of the limits placed on external or foreign investment in developing economies, nor of the exchange controls which may inhibit cross-border investment into those countries. It is possible that these factors fully explain the outlier countries. This will be added in further work. As a partial proxy for this we have used the Jones Lang LaSalle Real Estate Transparency Index (JLL, 2006).

Baum Unlisted funds and developing markets
5
2. Background: the global market 2.1 The value of investable real estate The value of commercial property owned by institutional investors around the world has been estimated (by DTZ and RREEF, among others) to be around €11$16 trillion at the end of 2006. This is the investable stock, meaning stock that is of sufficient quality to become institutional investment product, and which therefore represents the potential for market growth if owner-occupation rates were to tend to zero. The value of commercial property owned by institutional investors around the world was estimated by Investment Property Databank (IPD) to be around €2.7 trillion at the end of 2006. This excludes owner-occupied property, suggesting that the IPD sample represents 25% of the investable stock and that the remaining 75% of that stock is owner-occupied. This is highly unlikely, as we suggest below. The IPD measure suggests that some relatively small countries offer sizeable commercial property markets. Australia, Switzerland and Sweden have much more established property markets than would be suggested by the proportion of global GDP that they represent. On the other hand, the size of the Italian and Spanish property markets is significantly lower than would be suggested by the share of GDP. This very substantial under-representation of property within the latter countries reflects the relative lack of transparency of these markets, and the generally low levels of information available by comparison to more mature examples, including the lack of penetration by firms such as IPD. In Asia and the emerging markets of the world, the data inconsistencies are even starker. For example, we do not know much about the size of the investable property markets in China, India and Pakistan, despite their huge populations and increasingly significant GDP. Implied owner-occupation ratios are defined as the total non-invested stock as a share of total stock. As a result, more developed markets with a higher degree of investor activity should show lower owner-occupation ratios than less developed markets. Implied owner-occupation is highest in Asia-Pacific countries, at around 76%, reflecting both the lack of professional investor markets and of a developed services sector, while the ratio is lowest in the USA at 53%. The implied owner occupation in Europe is at around 62%. Again, we suggest that this is much too high an estimate The €11 trillion investable stock of property can be broken down to the regional level and further disaggregated by ownership structure (see Table 1). PFR has made estimates of the gross asset values (GAVs) of stock held in both listed REITs and property companies and unlisted funds. Publicly available REIT and property company market capitalisation data has been used and grossed up as shown to reflect the use of debt in the capital structure of the typical listed company. Unlisted fund GAVs have been estimated by PFR using a combination of primary research at the individual fund level using the €1 trillion PFR fund universe (see Table 2) and extrapolation. The US and hence North American data is a minimum estimate, as PFR data is still being assembled for this region.

Baum Unlisted funds and developing markets
6
According to PFR estimates, the €11 trillion investable market splits as follows. €3 trillion or 28% of the total stock is held by listed and unlisted property vehicles, with 16% held in listed vehicles and 12% in unlisted funds. This is more than the IPD estimate of the entire value of commercial property owned by institutional investors around the world, and questions the IPD estimate, which probably excludes many fund-held properties. The remaining €8 trillion or 72% splits into directly held investment stock and owner-occupied property – which could therefore be much less than the 70-75% level implied in previous measures. The global market is split by GAV into 40% Europe, 38% North America, 17% Asia and 5% emerging markets (defined for this purpose to exclude China and include India). An estimated minimum global €1.3 trillion is invested in unlisted funds. Within this split, Europe is relatively fully supplied with unlisted product while Asia is under-supplied. Asia, on the other hand, has been well served by the listed sector. Table 1: the global property investment universe (€m) Europe Asia Emerging North America Total
Size of market 4,343,055 2,351,481 331,666 4,014,287 11,042,755Listed market size
450,092 618,383 135,599 524,895 1,714,618
Unlisted market size
500,562 179,458 123,334 498,991 (est) 1,302,347
Direct market size (residual)
3,392,400 1,553,638 72,729 3,004,755 8,023,524
Source: Property Funds Research, RREEF, AME Capital, December 2007 2.2 The global unlisted property market universe
PFR’s estimate of the size of this market is around €1.3 trillion, of which data is held on over €1 trillion (see Figure 1 and Table 2). Table 2 shows how the currently held PFR fund data is distributed by region. Table 2: PFR’s current vehicle universe
Regional focus Estimated GAV (€m) Number Europe (ex - UK) 360,954 805Global (pan-region) 300,223 276UK 165,997 389North America 160,582 289Asia 87,593 227Australasia 25,757 74Latin America 10,723 69Africa 3,724 17Middle East 1,099 14TOTAL 1,116,653 2,160 Source: Property Funds Research, May 2008

Baum Unlisted funds and developing markets
7
Figure 1: growth in the PFR database of unlisted indirect vehicles by GAV (€bn) Source: Property Funds Research, May 2008 The universe of unlisted property vehicles has grown dramatically over the last ten years with the most dramatic activity being in the last five. In Europe, the number of funds in the PFR Universe has grown on average by over 20% per annum over the past ten years. Over the same period GAV has grown by 10% annually. This explosive growth is demonstrated in Figure 2. The largest markets in PFR’s vehicle universe are those of Europe, the UK and North America (currently under-estimated, as suggested above). However, increasingly the focus has been turning to the emerging markets of Asia, the Middle East, Africa and Latin America. Recently, Asia in particular has begun to experience a similar boom, as shown in Figure 3. Figure 2: growth of the European (inc. UK) unlisted indirect market Source: Property Funds Research, May 2008
0
200
400
600
800
1000
1200
pre 19
9019
9019
9119
9219
9319
9419
9519
9619
9719
9819
9920
0020
0120
0220
0320
0420
0520
0620
0720
08
Latin America Global Middle East / Africa Europe UK North America
0
100
200
300
400
500
600
up to
1980
1982
1984
1986
1988
1990
1992
1994
1996
1998
2000
2002
2004
2006
2008
GAV €bn
0
200
400
600
800
1,000
1,200
1,400NumberGAV €bn Number

Baum Unlisted funds and developing markets
8
Figure 3: growth of the Asian unlisted indirect market Source: Property Funds Research , May 2008 Figure 4 shows that Europe was the most popular target location for funds launched in 2007 by both estimated GAV and number. North American funds were second most popular in terms of estimated GAV, while global funds surpassed North American funds by number. Asian funds are becoming increasingly popular with 44 being launched in that year. Figure 4: total number of vehicles launched in 2007 by location and value Source: Property Funds Research, May 2008 2.3 Fund styles Funds are differentiated by risk types. The vehicles included in PFR’s universe are classified as being one of three styles; core, value-added and opportunity. Core funds are low risk funds with no or low gearing, while opportunity funds are higher risk, higher target return funds with high levels of gearing. Core-plus is sometimes
01020
30405060
7080
upto
1997
1998
1999
2000
2001
2002
2003
2004
2005
2006
2007
2008
GAV €bn
0
50
100
150
200
250Number
05
101520253035404550
Europe
North Ameri
caGlob
alAsia UK
Austra
lasia
Africa
Latin
Americ
a
Middle
East
GAV €bn
020406080100120140160
NumberEstimated GAV (€bn) Number

Baum Unlisted funds and developing markets
9
used as a fourth category, so that fund styles may be described as shown in Figure 5. Figure 5: unlisted fund risk styles
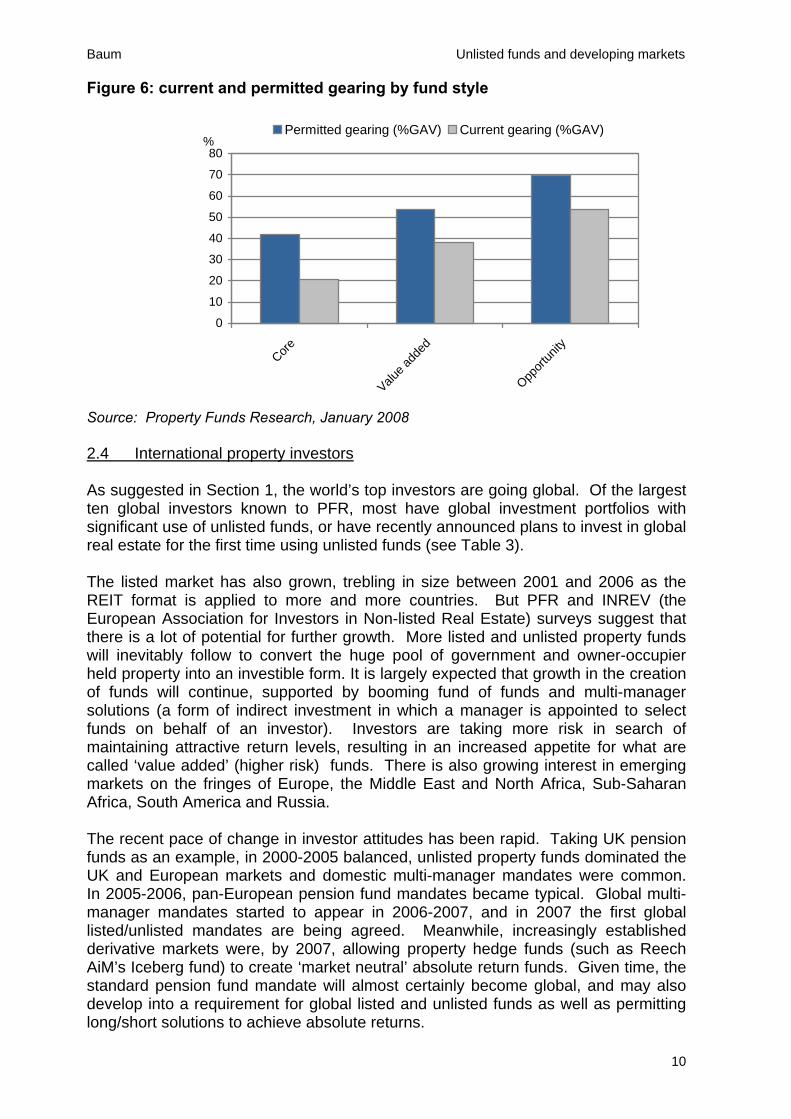
Source: CBRE Investors, January 2008 Until the end of the 1990s European value-added and opportunity funds were barely in existence. At the beginning of the 1990s core funds accounted for 97% of the market by GAV. This compares to just over 60% at January 2008. Opportunity funds experienced rapid growth between 2000 and 2003 but value-added funds then emerged as the style of choice. The majority of funds launched since 2005 have been value-added. Core funds tend to have been the style of choice for the more developed markets of Europe, North America and Australasia, while opportunistic funds are a significant fund type in most developing markets (with Africa currently dominated by the developed South African market). PFR also records permitted gearing based on the level of debt in a vehicle as a percentage of GAV. Funds have permitted gearing levels ranging up to 85%, although typical gearing levels are far more conservative than this. Figure 6 illustrates that all vehicle styles carry a lower level of debt than is permitted. Actual gearing levels average 25% for core funds, just below 40% for value-added funds, and just below 55% for opportunity funds. Permitted gearing levels are around 40%, 55% and 70% respectively. Vehicles in PFR’s universe have a variety of investment restrictions aimed at limiting the risk of a particular portfolio of investments. Diversified funds may be permitted to invest between 30% and 50% of GAV in a particular sector. Pan-European funds may have prescribed limits on the countries in which they can invest, which may be anywhere between 30% and 50% of GAV in each country. Development is limited to anywhere between 10% and 30% of GAV. There is likely to be some kind of investment restriction based on the amount invested in any single asset, typically in the region of 15% of GAV. Similarly, income restrictions are likely to be placed on a fund. Income derived from a single tenant/company is typically limited to around 15% of GAV.
Core Fully leased
Return: 6-8% Leverage: 0-50%
Open-ended
Core-plusIncome producing
with active management
Return: 8-11% Leverage: 50-60% Semi open-ended and closed-ended
Value-addedRepositioning
Moderate
Return: 11-15% Leverage: 50-75%
Closed-ended
Opportunistic Distressed sellers
Development, significant
redevelopment, financial engineering,
Return: 15%+ Leverage: 65%+ Closed-ended
Risk
Return
Baum Unlisted funds and developing markets
10
Figure 6: current and permitted gearing by fund style Source: Property Funds Research, January 2008 2.4 International property investors As suggested in Section 1, the world’s top investors are going global. Of the largest ten global investors known to PFR, most have global investment portfolios with significant use of unlisted funds, or have recently announced plans to invest in global real estate for the first time using unlisted funds (see Table 3). The listed market has also grown, trebling in size between 2001 and 2006 as the REIT format is applied to more and more countries. But PFR and INREV (the European Association for Investors in Non-listed Real Estate) surveys suggest that there is a lot of potential for further growth. More listed and unlisted property funds will inevitably follow to convert the huge pool of government and owner-occupier held property into an investible form. It is largely expected that growth in the creation of funds will continue, supported by booming fund of funds and multi-manager solutions (a form of indirect investment in which a manager is appointed to select funds on behalf of an investor). Investors are taking more risk in search of maintaining attractive return levels, resulting in an increased appetite for what are called ‘value added’ (higher risk) funds. There is also growing interest in emerging markets on the fringes of Europe, the Middle East and North Africa, Sub-Saharan Africa, South America and Russia. The recent pace of change in investor attitudes has been rapid. Taking UK pension funds as an example, in 2000-2005 balanced, unlisted property funds dominated the UK and European markets and domestic multi-manager mandates were common. In 2005-2006, pan-European pension fund mandates became typical. Global multi-manager mandates started to appear in 2006-2007, and in 2007 the first global listed/unlisted mandates are being agreed. Meanwhile, increasingly established derivative markets were, by 2007, allowing property hedge funds (such as Reech AiM’s Iceberg fund) to create ‘market neutral’ absolute return funds. Given time, the standard pension fund mandate will almost certainly become global, and may also develop into a requirement for global listed and unlisted funds as well as permitting long/short solutions to achieve absolute returns.
0
10
20
30
40
50
60
70
80
Core
Value a
dded
Opport
unity
%Permitted gearing (%GAV) Current gearing (%GAV)

Baum Unlisted funds and developing markets
11
Table 3: the largest global investors Capital source Capital type Domicile Total value
of fund (€m) Fund invests in property
Abu Dhabi Investment Authority Government Fund UAE 665,407 Yes (global)
Japanese Government Pension Investment Fund
Government Fund Japan 569,600 No
TIAA-CREF Pension Fund US 302,740 Yes (global)
Norwegian Government Pension Fund
Government Fund Norway 272,831 Considering
global Government of Singapore Investment Corporation (GIC)
Government Fund Singapore 229,334 Yes (global)
Caisse des Depots et Consignations
Government Fund France 221,000 Yes
Algemeen Burgerlijk Stichting Pensioenfonds Pension Fund Netherlands 218,300 Yes (global)
SAFE – State Administration of Foreign Exchange
Government Fund China 213,555 Not known
Saudi Arabian Monetary Agency Foreign Holdings
Government Fund Saudi Arabia 208,688 Not known
California Public Employees Retirement System Pension Fund US 195,308 Yes (global)
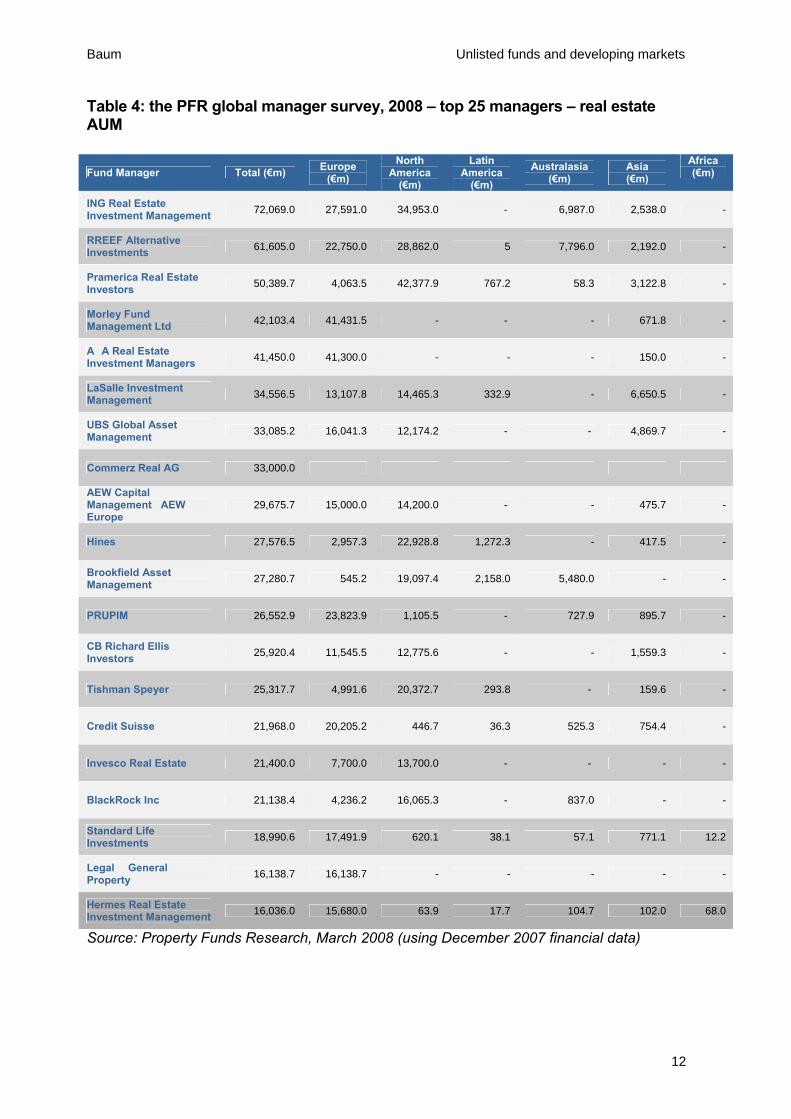
Source: Property Funds Research, May 2008 2.5 Global fund managers Table 4 shows the top 25 global managers of unlisted property funds and the value of the assets held in those funds in Europe, North America, Latin America, Australasia and Asia. The top two are European in origin; the next two are originally US-based; and in total there are 13 Europeans, 10 North Americans and 2 Australians. Significantly, there are no large Asian-based managers. Most of these are institutional fund managers owned by bank or insurance businesses, but many of the risk takers are property companies. In Asia, this is likely to be where the next phase of growth will come from. Several global exemplars and models exist of property companies moving into fund management. Popular motivations may be to add high quality earnings to volatile development profits to create value through diversifying a mix of risk styles; to maintain employment for a large asset management team when the core business is challenged by low share prices; to add some new expertise motivated by a more direct interest in new business; or to disinvest from large assets while maintaining an interest in ownership, fee flow and a form of control. Hines is an excellent case study of a pioneer in this field (see Appendix).
Baum Unlisted funds and developing markets
12
Table 4: the PFR global manager survey, 2008 – top 25 managers – real estate AUM
Fund Manager Total (€m) Europe (€m)
North America
(€m)
Latin America
(€m)
Australasia (€m)
Asia (€m)
Africa (€m)
ING Real Estate Investment Management 72,069.0 27,591.0 34,953.0 - 6,987.0 2,538.0 -
RREEF Alternative Investments 61,605.0 22,750.0 28,862.0 5 7,796.0 2,192.0 -
Pramerica Real Estate Investors * 50,389.7 4,063.5 42,377.9 767.2 58.3 3,122.8 -
Morley Fund Management Ltd 42,103.4 41,431.5 - - - 671.8 -
AXA Real Estate Investment Managers 41,450.0 41,300.0 - - - 150.0 -
LaSalle Investment Management 34,556.5 13,107.8 14,465.3 332.9 - 6,650.5 -
UBS Global Asset Management 33,085.2 16,041.3 12,174.2 - - 4,869.7 -
Commerz Real AG ** 33,000.0
AEW Capital Management / AEW Europe
29,675.7 15,000.0 14,200.0 - - 475.7 -
Hines 27,576.5 2,957.3 22,928.8 1,272.3 - 417.5 -
Brookfield Asset Management 27,280.7 545.2 19,097.4 2,158.0 5,480.0 - -
PRUPIM 26,552.9 23,823.9 1,105.5 - 727.9 895.7 -
CB Richard Ellis Investors 25,920.4 11,545.5 12,775.6 - - 1,559.3 -
Tishman Speyer 25,317.7 4,991.6 20,372.7 293.8 - 159.6 -
Credit Suisse 21,968.0 20,205.2 446.7 36.3 525.3 754.4 -
Invesco Real Estate ^ 21,400.0 7,700.0 13,700.0 - - - -
BlackRock Inc 21,138.4 4,236.2 16,065.3 - 837.0 - -
Standard Life Investments 18,990.6 17,491.9 620.1 38.1 57.1 771.1 12.2
Legal & General Property 16,138.7 16,138.7 - - - - -
Hermes Real Estate Investment Management 16,036.0 15,680.0 63.9 17.7 104.7 102.0 68.0
Source: Property Funds Research, March 2008 (using December 2007 financial data)

Baum Unlisted funds and developing markets
13
3. The emerging and developing markets – are unlisted funds investing? 3.1 Introduction In this research, we define the emerging markets as the regions outside Europe, Australasia and North America, and focus on the largest countries in these regions by population. The regions of interest are therefore Asia, Africa, the Middle East and Latin America. The relevant countries are shown in Table 5. 3.2 The data and research method 41 of the world’s largest 55 countries by population are located outside Europe, Australasia and North America. Asia includes China and India, which are the world’s largest countries by population size. Africa splits into two broad zones. Activity in North Africa, connected with the Middle East through religion and proximity, is often driven by the emerging financial centres of Dubai and Abu Dhabi. Sub-Saharan Africa, on the other hand, is led by the mature financial markets of South Africa. Latin America includes the powerful BRIC (Brazil, Russia, India, China) economy of Brazil as its core market. It is to be expected that there is some link between the size of a country and its attraction to an investor or investment manager. Interest in China and India, the world’s largest countries, is huge. However, in terms of GDP per capita they remain well behind the developed countries (the USA, the world’s third largest country by population, has a GDP per capita of $45,793, 19 times that of China and 47 times that of India: see Table 5) so that in terms of total economic output they are not yet the world’s largest economies. (There is nonetheless little doubt that within 25 years they will be). It is a combination of population and GDP per capita that will define the gross demand for property and the ability to pay rent to occupy it; and there should therefore be a strong link between the interest in a country defined by the number of funds targeting investment in that market, the population of the country and the GDP per capita. We set out in this paper to explore that link further by relating the dependent variable – the number of funds targetting a country – and the independent variables of population size and GDP per capita. The data we use is taken from the PFR unlisted fund universe, which includes information on single region and funds investing in more than one region or country. In addition to the number of funds targeting a country, we have also reported the aggregate exposure of unlisted funds to a single country by taking a simple unweighted division of the fund value (gross asset value, GAV) or estimated GAV (where no GAV figure is reported)) divided between the countries targeted by that fund. This is a crude way to differentiate between the impact of larger and smaller funds. Table 5 shows the value for each country of the two independent variables, population size and GDP per capita.

Baum Unlisted funds and developing markets
14
Table 5: emerging market and Asian countries by population and GDP per capita ($) Country Population Rank by population GDP per capita Rank by GDP per capitaChina 1,315,844,000 1 2,458 105India 1,103,371,000 2 965 134Indonesia 222,781,000 4 1,748 114Brazil 186,405,000 5 6,679 61Pakistan 157,935,000 6 645 149Bangladesh 141,822,000 8 469 159Nigeria 131,530,000 9 938 136Japan 128,085,000 10 34,104 23Mexico 107,029,000 11 8,154 56Vietnam 84,238,000 12 779 140Philippines 83,054,000 13 1,582 117Ethiopia 77,431,000 15 221 180Egypt 74,033,000 16 1,592 116Iran 69,515,000 18 4,252 80Thailand 64,233,000 19 3,470 90Congo 57,549,000 23 1,802 113Myanmar 50,519,000 24 289 172South Korea 47,817,000 25 20,020 34South Africa 47,432,000 26 6,239 65Colombia 45,600,000 28 3,869 83Argentina 38,747,000 30 6,094 69Tanzania 38,329,000 32 358 167Sudan 36,233,000 33 1,262 126Kenya 34,256,000 34 799 139Algeria 32,854,000 35 3,777 86Morocco 31,478,000 37 2,155 107Afghanistan 29,863,000 38 311 170Uganda 28,816,000 39 368 156Iraq 28,807,000 40 2,016 109Peru 27,968,000 41 3,540 89Nepal 27,133,000 42 333 168Venezuela 26,749,000 43 8,719 55Uzbekistan 26,593,000 44 726 143Malaysia 25,347,000 45 6,648 62Saudi Arabia 24,573,000 46 13,568 42Taiwan 22,894,384 47 16,431 37Ghana 22,113,000 49 649 148Yemen 20,975,000 51 1,023 131Sri Lanka 20,743,000 52 1,232 127Mozambique 19,792,000 54 389 163Syria 19,043,000 55 1,516 119 Source: Wikipedia, PFR, March 2008

Baum Unlisted funds and developing markets
15
Table 6 shows the most and least popular countries defined by the number of funds targetting investment and by target GAV. The investors in these funds are broadly distributed but are concentrated in the non-developing and non-Asian markets, primarily the USA, Australia, Canada, the UK and the Netherlands. Table 6: emerging market and Asian countries by funds targeting investment Country Funds targeting GAV (€m) Japan 137 95,675China 89 30,512India 74 21,644South Korea 44 11,736Mexico 39 11,263Brazil 38 8,269Malaysia 26 4,305South Africa 16 5,188Thailand 14 1,703Taiwan 9 924Vietnam 9 1,438Philippines 8 2,527Argentina 7 343Indonesia 4 482Saudi Arabia 3 296Colombia 2 23Kenya 2 46Tanzania 2 46Congo 1 14Egypt 1 175Morocco 1 460Nigeria 1 17Sudan 1 60Uganda 1 33Afghanistan 0 0Algeria 0 0Bangladesh 0 0Ethiopia 0 0Ghana 0 0Iran 0 0Iraq 0 0Mozambique 0 0Myanmar 0 0Nepal 0 0Pakistan 0 0Peru 0 0Sri Lanka 0 0Syria 0 0Uzbekistan 0 0Venezuela 0 0Yemen 0 0 Source: PFR, March 2008 Table 7 ranks the markets by population, and also shows GDP per capita, funds targeting and target GAV for each country.

Baum Unlisted funds and developing markets
16
Table 7: emerging market and Asian countries by population and GDP per capita rank and funds targeting investment (ranked by population) Country Rank by population GDP per capita Funds targeting GAV (€m) China 1 2,458 89 30,512India 2 965 74 21,644Indonesia 3 1,748 4 482Brazil 4 6,679 38 8,269Pakistan 5 645 0 0Bangladesh 6 469 0 0Nigeria 7 938 1 17Japan 8 34,104 137 95,675Mexico 9 8,154 39 11,263Vietnam 10 779 9 1,438Philippines 11 1,582 8 2,526Ethiopia 12 221 0 0Egypt 13 1,592 1 175Iran 14 4,252 0 0Thailand 15 3,470 14 1,703Congo 16 1,802 1 14Myanmar 17 289 0 0South Korea 18 20,020 44 11,736South Africa 19 6,239 16 5,188Colombia 20 3,869 2 23Argentina 21 6,094 7 343Tanzania 22 358 2 46Sudan 23 1,262 1 60Kenya 24 799 2 46Algeria 25 3,777 0 0Morocco 26 2,155 1 460Afghanistan 27 311 0 0Uganda 28 368 1 33Iraq 29 2,016 0 0Peru 30 3,540 0 0Nepal 31 333 0 0Venezuela 32 8,719 0 0Uzbekistan 33 726 0 0Malaysia 34 6,648 26 4,305Saudi Arabia 35 13,568 3 296Taiwan 36 16,431 9 924Ghana 37 649 0 0Yemen 38 1,023 0 0Sri Lanka 39 1,232 0 0Mozambique 40 389 0 0Syria 41 1,516 0 0 Source: Wikipedia, PFR, March 2008

Baum Unlisted funds and developing markets
17
3.3 Results GDP per capita and population have been used as independent variables to explain the number of funds targetting an emerging country and the GAV. Both appear to be correlated with each measure of investment: see Table 8. Table 8: regression results by GDP per capita (1) Variables Correlation coefficientPopulation and funds targetting 60.20% Population and GAV 35.52% GDP and funds targeting 65.04% GDP and GAV 72.72% Using the number of funds targetting as the dependent variable, Table 9 shows that GDP per capita is a reasonably good explanatory variable, with a correlation coefficient of 65%, an adjusted R-squared of 41% and a t-ratio of around 5.45, indicating significance at greater than the 95% level. Table 9: regression results by GDP per capita Multiple R 0.650Adjusted R Square 0.408Standard Error 21.65Observations 41
Table 10 shows that population is a similarly good explanatory variable, with a correlation coefficient of 60%, an adjusted R-squared of 35% and a t-ratio of over 4.7, again indicating significance at greater than the 95% level. Table 10: regression results by population (1) Multiple R 0.602Adjusted R Square 0.346Standard Error 22.76Observations 41Intercept coefficient 5.2X Variable coefficient 6.61E-08Intercept t-ratio 1.329X Variable t-ratio 4.708 It is of course possible to combine these variables in one equation by running a multiple regression equation. Details of the equation are shown in Table 11. This equation explains 92% of the variation in the number of funds targetting any country. The two independent variables are highly significant. We also used GAV as the dependent variable in a multiple regression equation relating population and GDP per capita to popularity. The results shown in Table 12
Intercept coefficient 1.15X Variable coefficient 0.0028Intercept t-ratio 0.283X Variable t-ratio 5.348

Baum Unlisted funds and developing markets
18
were again powerful, but inferior to those presented in Table 11, probably indicating the imperfection of our GAV measure. Table 11: multiple regression results (funds targetting) Variable Coefficient Std. Error t-StatisticC -7.86 2.343755 -3.35393GDP 0.002976 7.16E-09 9.898102POPULATION 7.09E08 0.000281 10.59639R-squared 0.9158 Adjusted R-squared 0.8303 Table 12 multiple regression results (GAV) Variable Coefficient Std. Error t-StatisticC -5729 1823.138 -3.14245GDP 2.4856E-05 5.57E-06 4.460107POPULATION 1.8194 0.218433 8.329088R-squared 0.8311 Adjusted R-squared 0.6745 3.4 Market transparency We have not completed a full survey of the limits placed on external or foreign investment in these economies, nor of the exchange controls which may inhibit cross-border investment into those countries. We may also hypothesise about political risk, currency risk and other related issues. In 2006, Jones Lang LaSalle published its latest Real Estate Transparency Index, first published in 1999, which has been widely used and quoted. The Jones Lang LaSalle Real Estate Transparency Index may be useful as a partial proxy for these problems. This survey-based measure uses judgements about the following:
• availability of investment performance indexes • market fundamentals data • listed vehicle financial disclosure and governance • regulatory and legal factors and • professional and ethical standards
to arrive at a single index measure whose lowest value of 1.15, indicating transparency, was awarded to Australia and the USA, and whose highest value was 5. We used the JLL Transparency Index scores across the full range of 41 countries, applying a score of 5 to any not surveyed. The TI score was correlated negatively and significantly with both the number of funds (correlation 61.2% and a t of over 3.6) and target GAV (correlation 47.1% and a t of over 3.3). We also related GAV to the main independent variables. This was also strongly correlated with the explanatory variables, stronger than number of funds. Results are shown in Table 13. We also added the JLL index to the other independent variables and marginally improved explanatory power but at the cost of dropping the significance of the index values below that required at the 95% probability level.

Baum Unlisted funds and developing markets
19
Table 13: JLL transparency index correlations Variables Correlation coefficientJLL TI and funds targeting -61.21% JLL TI and GAV -46.96% 3.5 Outliers The outliers are defined as countries whose observed investment does not fit well with predicted investment using population and GDP per capita as drivers. In these tables, the predicted number of funds targetting the country is compared with the observed number. The results are shown in Table 14 (those with fewer observed than predicted) and Table 15 (those with more observed than predicted). These are termed the outlier countries. Table 14: countries with more funds targetting than predicted Country Funds Predicted Error Japan 137 103 34Mexico 39 24 15Brazil 38 25 13Malaysia 26 14 12Vietnam 9 0 9Thailand 14 7 7Philippines 8 3 5Kenya 2 0 2Tanzania 2 0 2Syria 0 -2 2South Africa 16 14 2Sudan 1 0 1Uganda 1 0 1India 74 73 1Morocco 1 1 0 Table 15: countries with fewer funds targetting than predicted
Country Funds Predicted Error Taiwan 9 43 -34Saudi Arabia 3 34 -31Venezuela 0 20 -20South Korea 44 55 -11Iran 0 10 -10Indonesia 4 13 -9Argentina 7 13 -6Algeria 0 6 -6Pakistan 0 5 -5Colombia 2 7 -5Peru 0 5 -5China 89 93 -4Bangladesh 0 4 -4Nigeria 1 4 -3Egypt 1 2 -1Congo 1 2 -1

Baum Unlisted funds and developing markets
20
The countries receiving significantly more investment than that predicted by the equation are Japan, Mexico, Brazil, Malaysia, Vietnam and Thailand. The outlier countries receiving significantly less investment than that predicted by the equation are Taiwan, Saudi Arabia, Venezuela, South Korea, Indonesia and Iran. The countries receiving significantly more investment than that predicted by the equation have average JLL TI indicators of 3.09. The countries receiving significantly less investment than that predicted by the equation have average TI indicators of 4.07.

Baum Unlisted funds and developing markets
21
4. Conclusions An increased investor appetite for global investment has generated a structural market shift observable since the mid 1990s. International or cross-border property investment has boomed, and indirect property investment (investing through securities and funds) has become commonplace.
The boom in the number and value of listed property funds is largely a matter of public record, but for unlisted real estate vehicles, an increasingly standard route to attaining international real estate exposure, there is little available data. In addition, the unlisted sector holds particular interest as it has been the main engine delivering capital to developing and emerging property markets This paper set out to describe the changing nature of global property investment, and in particular the role played by unlisted property funds in facilitating cross-border investing. It focussed on the development of unlisted funds in general, and in particular their role as intermediary structures carrying capital from developed to developing markets. We defined the developing or emerging markets as the regions outside Europe, Australasia and North America, and focussed on the largest 55 countries in these regions by population. The investors in the funds we identified as targeting emerging markets are concentrated in the non-developing and non-Asian markets. We found that both GDP per capita and population explain the number of unlisted funds targetting emerging markets. Transparency, as described by the JLL Transparency Index, also appears to have some explanatory power. There are several interesting outliers, meaning countries whose observed investment does not fit well with predicted investment. Countries with high population and /or GDP per capita and low investment include Taiwan, Saudi Arabia, Venezuela, South Korea, Indonesia and Iran. This list includes some of the world’s most populous countries. Countries receiving stronger investment than expected include Mexico, Brazil, Malaysia, Vietnam and Thailand. The dominance of an active REIT market would explain a shortage of unlisted fund investment in these markets, but there is no REIT market in any of these states. It is suggested, therefore, that these markets suffer from a clear lack of Western capital as well as a low GDP per capita – and these facts may be connected. It may be that political risk explains this shortage of investment, but it may also be suggested - as a value judgement - that the avoidance by international property investors of large parts of the globe is not healthy in promoting economic development and a global mutuality of interest. High quality real estate is a fundamental necessity for a developed economy. Whether the under-invested markets can command their share of capital in future is unclear and depends on a variety of factors outside the scope of this paper. Nonetheless, the promotion of a mutuality of economic interest is in the best interests of everyone, and it is our view that unlisted property funds have the potential to play a significant part in this process. Continued research will be essential in the drive towards the transparency necessary to attract both entrepreneurial and risk-averse institutional investment.

Baum Unlisted funds and developing markets
22
References Baum, A (2006): Real estate investment through indirect vehicles: an initial view of risk and return characteristics, in Bone Winkel et al, Stand und Entwicklungs – tendenzen der Immobilienokonomire, Germany, Rudolf Muller Baum, A and Struempell, P (2006): Managing specific risk in property portfolios, Pacific Rim Real Estate Society Conference, Auckland, January CBRE Investors (2008): The Case for a Global Unconstrained Property Strategy, London, CBRE Investors INREV (2004-8): various (www.inrev.org) Jones Lang LaSalle (2006): Real Estate Transparency Index, London, JLL. Laposa, S and Lizieri, C (2005): Real Estate Capital Flows and Transitional Economies, paper presented to the American Real Estate Society Conference, Santa Fe, NM Laposa, Steven P. (2007): The foreign direct investment property model: explaining foreign property demand and foreign property capital flows in transitional economies, PhD thesis, University of Reading, UK (R10036) Pension Consulting Alliance (2001): Real Estate Opportunity Funds, the Numbers Behind the Story, April Property Funds Research (2006-8): various (www.propertyfundsresearch.com) RREEF (2007): Global Real Estate Insights, London, RREEF