department of port of karumba long-term seagrass … of karumba long-term seagrass monitoring –...
TRANSCRIPT

Dep
artm
ent o
f Em
ploy
men
t, Ec
onom
ic D
evel
opm
ent a
nd In
nova
tion
Port of Karumba Long-TermSeagrass Monitoring
October 2010
Skye McKennaMichael Rasheed

Port of Karumba Long-Term Seagrass Monitoring -
October 2010
McKenna, S.A and Rasheed, M.A.
Marine Ecology Group Northern Fisheries Centre
Fisheries Queensland
PO Box 5396 Cairns QLD 4870

Information should be cited as: McKenna, S.A. & Rasheed, M.A. (2011) Port of Karumba Long-term Seagrass Monitoring, October 2010. DEEDI Publication, Fisheries Queensland, Cairns, 25pp. For further information contact: Marine Ecology Group Fisheries Queensland, Northern Fisheries Centre PO Box 5396 Cairns QLD 4870 © The State of Queensland, Department of Employment, Economic Development and Innovation, 2011. Except as permitted by the Copyright Act 1968, no part of the work may in any form or by any electronic, mechanical, photocopying, recording, or any other means be reproduced, stored in a retrieval system or be broadcast or transmitted without the prior written permission of the Department of Employment, Economic Development and Innovation. The information contained herein is subject to change without notice. The copyright owner shall not be liable for technical or other errors or omissions contained herein. The reader/user accepts all risks and responsibility for losses, damages, costs and other consequences resulting directly or indirectly from using this information. Enquiries about reproduction, including downloading or printing the web version, should be directed to [email protected] or telephone +61 7 3225 1398. ACKNOWLEDGEMENTS This project was funded by Far North Queensland Port Corporation Ltd and Fisheries Queensland through the Department of Employment, Economic Development and Innovation (DEEDI). We wish to thank the many Fisheries Queensland staff for their invaluable assistance in the field throughout the 17 years of data collection.

Port of Karumba Long-term Seagrass Monitoring – October 2010
TABLE OF CONTENTS EXECUTIVE SUMMARY................................................................................................................................... 1 INTRODUCTION ............................................................................................................................................... 2 METHODS......................................................................................................................................................... 3 RESULTS .......................................................................................................................................................... 6
SEAGRASS SPECIES DISTRIBUTION AND ABUNDANCE .......................................................................................... 6 COMPARISON WITH PREVIOUS MONITORING SURVEYS ...................................................................................... 10 PORT OF KARUMBA CLIMATE ANALYSIS............................................................................................................ 13
DISCUSSION .................................................................................................................................................. 18 SEAGRASS DISTRIBUTION AND ABUNDANCE .................................................................................................... 18 SEAGRASS RESILIENCE AND ECOSYSTEM CONSEQUENCES OF CHANGE ............................................................. 19 IMPLICATIONS FOR PORT MANAGEMENT AND FUTURE MONITORING.................................................................... 19
REFERENCES ................................................................................................................................................ 20

Port of Karumba Long-term Seagrass Monitoring – October 2010 1
EXECUTIVE SUMMARY A network of long-term seagrass monitoring sites has been established at various port locations throughout Queensland to assist Fisheries Queensland and port managers in planning and management to ensure port activities are having a minimal impact on the marine environment and fish habitats, such as seagrass habitats. Seagrass habitats provide important ecological functions in the coastal zone including provision of primary productivity in the marine environment and nursery habitat for key fisheries species. The wide distribution of seagrasses in Queensland, and their capacity to show measurable responses to changes in water quality make them ideal candidates for monitoring the health of the marine environments. This report details the results of the October 2010 monitoring program in the Port of Karumba. Seagrass meadows in the Port of Karumba were found in 2010 to be in a healthy and productive state with dugong feeding trails seen in 57% of the sites that had seagrass. Although meadow area declined in 2010, the meadow remains spatially expansive and dense, with biomass and area values above the 17 year averages. The variability in biomass and distribution seen in the Karumba monitoring meadow throughout 17 years of monitoring have been linked to river flow, air temperature and long-term tidal exposure cycles (Rasheed and Unsworth 2011). Above-ground biomass had a positive correlation with river flow, while air temperature was a negative correlate with biomass. Meadow area was observed to have a positive correlation with the number of hours of daylight tidal exposure (Rasheed and Unsworth 2011). Results of the 2010 survey indicate that the marine environment of the port was in a healthy condition and that anthropogenic activities including dredging and other port and urban activities are unlikely to have had a significant impact on seagrasses in Karumba over the previous 12 months. Although currently in a healthy and robust state, natural conditions have the capacity to reduce seagrass resilience, to the point where they may become vulnerable to impacts such as dredging. This monitoring program provides the tools to assess the vulnerability of seagrass and take appropriate actions if required.

Port of Karumba Long-term Seagrass Monitoring – October 2010 2
INTRODUCTION Maintenance dredging of the Karumba port entrance and the Norman River channel is required to allow the passage of ships associated with the Century Mine Export Facility (Lead and Zinc) and for live cattle export. Dredging has the potential to pose a high level of environmental risk to the marine habitats of the area, particularly to seagrass meadows (Erftemeijer and Lewis 2006). The Far North Queensland Ports Corporation Limited (FNQPCL), trading as Ports North (PN) is responsible for dredging in the port and for managing and monitoring Karumba’s port environment. The importance of seagrasses as structural components of coastal and marine ecosystems is well recognised. Seagrasses support fisheries production and provide a range of other critically important and economically valuable ecosystem services such as coastal protection, nutrient cycling and particle trapping (Costanza et al. 1997; Hemminga & Duarte 2000). With globally developing carbon markets, the role that seagrasses play in sequestering carbon is also becoming more widely recognised (Kennedy & Bjork 2009). Seagrass habitats are also known to show measurable response to changes in water quality making seagrass meadows ideal sentinels of environmental change (Dennison et al. 1993; Orth et al. 2006). PN recognises seagrass meadows as an important component of Karumba’s marine ecology and have continued the long-term seagrass monitoring program initially established by Ports Corporation Queensland (PCQ) in 1994, who managed the port until 2008. The long-term monitoring program was established to ensure the protection of seagrass meadows in the Port of Karumba and to assess the marine environmental health of the port. The use of a coastal seagrass monitoring program such as the one at the Port of Karumba is important for assessing the impacts of the port, allowing stakeholders and regulators to clearly understand the causes of any change in the marine environment. This allows for the separation of natural from anthropogenic influences. Long-term monitoring also provides evidence for a much more statistically powerful separation of these factors. The initial six year (1994-2000) seagrass monitoring program was commissioned by PCQ as part of a wider range of environmental studies to assess and monitor the impacts of dredging and other port developments (Rasheed et al. 2001). Following this, a long-term seagrass monitoring (LTSM) strategy for the Port of Karumba was developed and is conducted by the Marine Ecology Group (MEG) through the Department of Employment, Economic Development and Innovation (DEEDI). This report presents the results of the seagrass monitoring survey conducted in October 2010. The objectives of the program were to:
1. Map the distribution of the monitoring meadow on Alligator Bank between the Norman and Bynoe Rivers;
2. Monitor the seagrass species composition and abundance within the monitoring meadow; 3. Assess changes in seagrass meadows and compare results with previous monitoring
surveys and other monitoring programs established throughout the state; 4. Incorporate changes suggested by industry peers into current monitoring protocols for
effective future long-term monitoring. Results of the seagrass monitoring program are used by PN to help identify possible detrimental effects of port operations and developments (e.g. dredging) on seagrasses and assist in formulating management measures for the port. They provide a direct indicator of the health of the marine environment of the port. The seagrass monitoring program at the Port of Karumba also forms part of Fisheries Queensland’s network of long-term monitoring sites for important fish habitats and contributes to a Queensland statewide assessment of seagrasses.

Port of Karumba Long-term Seagrass Monitoring – October 2010 3
METHODS Surveys of the Port of Karumba seagrass monitoring area were conducted on the 30th and 31st October 2010. In 2009, data from the Karumba long-term monitoring program was submitted for academic publication (at the journal Marine Ecology Progress Series) resulting in extensive peer-review by globally recognised seagrass experts. This is the first such occasion that the Karumba monitoring program has undergone such thorough academic review. A key recommendation of the peer review process was to remove the separation of the “core” and “fringing” meadows, merging them as one. It was agreed in 2009 that future monitoring at Karumba follow this recommendation. In this report we have amalgamated all the data from 1994 to 2010 into one monitoring meadow and conducted a complete re-analysis of the data, removing any concerns about the relative interactions between the two meadows. A complete background site description and detailed methodology of the monitoring program are presented in the report “Port of Karumba Seagrass Monitoring Baseline Surveys” (Rasheed et al. 1996) and the detailed report of 2001 (Rasheed et al. 2001). The boundary of the seagrass meadow was mapped from aerial (helicopter) surveys conducted at low tide when the seagrass meadows were exposed. Waypoints (i.e. sites) were recorded around the edge of the meadow using a global positioning system (GPS) and were digitised on to a Geographic Information System (GIS) basemap. The GIS basemap was constructed from a 1:25000 vertical aerial photograph rectified and projected to Geodetic Datum of Australia (GDA 94) coordinates. Seagrass meadow characteristics were collected at seagrass habitat characterisation sites scattered randomly within the meadow. The number of sites placed in the meadow was based on a power analysis conducted in 2009 using data collected in 2008 (Unsworth et al. 2009), this was a revision of an earlier analysis conducted in 2001 (Rasheed et al. 2001). Seagrass habitat characteristics including seagrass species composition, above-ground biomass, percent algae cover, sediment type and GPS fixes - were recorded at each sampling site from a helicopter hovering within a metre of the ground when meadows were exposed at low tide. Above-ground seagrass biomass was determined at each of the sampling sites using a modified “visual estimates of biomass” technique as described by (Mellors 1991). This modified methodology has been utilised in surveys throughout Queensland and published in peer reviewed literature (Rasheed et al. 2008; Rasheed & Unsworth 2011). Briefly, an observer ranks above-ground seagrass biomass within three random placements of a 0.25m2 quadrat at each site. Measurements are later calibrated for each observer to biomass from quadrats harvested and dried in the lab to determine mean above-ground biomass in g DW m-2 at each site. The relative proportion of each seagrass species within each survey quadrat was also recorded. Sampling of the seagrass seed bank (i.e. seeds stored in the sediments) and other seagrass reproductive features was also undertaken for the monitoring meadow. A Van Veen sediment grab (0.0625m-2) was used to collect samples at sites randomly scattered throughout the meadow. The collected sediment/seed samples were sorted by passing the sample through a 1mm sieve. Any seagrass seeds in the 1mm fraction were identified and counted for each site. The 1mm mesh size on the sieve was small enough to retain seeds of Halodule uninervis and fruits of Halophila ovalis. Seeds of Halophila ovalis were not measured because their small size allows them to pass through the sieve mesh.

Port of Karumba Long-term Seagrass Monitoring – October 2010 4
Habitat mapping and Geographic Information System Spatial data from the field surveys were incorporated into the FNQPCL/DEEDI Karumba Geographic Information System (GIS). Three GIS layers were created: Site information - site data containing above ground biomass (for each species), sediment type, time, GPS fixes (±1.5m) and sampling technique. Seagrass meadow biomass and community types - area data for seagrass meadows with summary information on meadow characteristics. Seagrass community types were determined according to species composition from nomenclature developed for seagrass meadows of the Queensland region (Table 1). Abundance categories (light, moderate, dense) were assigned to community types according to above ground biomass of the dominant species (Table 2). Seagrass landscape category – area data showing the seagrass landscape category determined for each meadow
Table 1. Nomenclature for community types in the Port of Karumba.
Community type Species composition
Species A Species A is 90-100% of composition
Species A with Species B Species A is 60-90% of composition
Species A with Species B/Species C Species A is 50% of composition
Species A/Species B Species A is 40-60% of composition
Isolated seagrass patches The majority of area within the meadows consisted of unvegetated sediment interspersed with isolated patches of seagrass Aggregated seagrass patches Meadows are comprised of numerous seagrass patches but still feature substantial gaps of unvegetated sediment within the meadow boundaries Continuous seagrass cover The majority of area within the meadows comprised of continuous seagrass cover interspersed with a few gaps of unvegetated sediment.

Port of Karumba Long-term Seagrass Monitoring – October 2010 5
Table 2. Density categories and mean above ground biomass ranges for each species used in determining seagrass community density in the Port of Karumba.
Mean above ground biomass (g DW m-2) Density
Halodule uninervis (narrow) Halophila ovalis
Light < 1 < 1
Moderate 1 - 4 1 - 5
Dense > 4 > 5
The seagrass meadow was assigned a mapping precision estimate (in meters) based on mapping methodology utilised for that meadow (Table 3). Mapping precision was assumed to be ±5m for the monitoring meadow due to the error associated with the GPS fixes for survey sites. The mapping precision estimate was used to calculate a range of meadow area for the monitoring meadow and was expressed as a meadow reliability estimate (R) in hectares. Additional sources of mapping error associated with digitising and rectifying aerial photographs onto base maps were embedded within the meadow reliability estimates. Table 3. Mapping precision and methodology for seagrass meadows.
Mapping precision Mapping methodology
± 5m
All meadow boundaries mapped in detail by GPS using aerial helicopter survey;
Intertidal meadows completely exposed or visible at low tide;
Relatively high density of mapping and survey sites;
Recent aerial photography aided in mapping.

Port of Karumba Long-term Seagrass Monitoring – October 2010 6
RESULTS Seagrass species distribution and abundance 1,283 ± 14.5 ha of seagrass habitat was mapped in the Alligator Bank monitoring meadow in October 2010 (Map 1, Figure 1B). 102 habitat characterisation sites were randomly sampled within the seagrass meadow, 92% of which contained seagrass. Two species of seagrass were found within the Alligator Banks monitoring meadow: Family Cymodoceaceae Halodule uninervis (Forsk.) Aschers. in Boissier Family Hydrocharitaceae Halophila ovalis (R. Br.) Hook.ƒ.
Plate 1. Seagrass species found in Karumba: (A) Halodule uninervis (narrow leaf form); (B)
Halophila ovalis.
Halodule uninervis (narrow leaf form) was the dominant species in the monitoring meadow while low levels of Halophila ovalis was also found (Figure 2). The above-ground biomass of seagrass in the meadow was classified as dense (Table 2) and contained areas within the meadow that had isolated patches, aggregated patches and a continuous cover of seagrass. The monitoring meadow had a mean biomass of 7.74 ± 0.75 g DW m-2 (Figure 1A). Seed sampling was conducted at 15 sites on Alligator Bank (Map 2). Halodule uninervis seeds and pieces of seed pericarp (outer casing of seeds) were found scattered throughout the meadow (Map 2). Mean Halodule uninervis seed density for the meadow was 23.47 ± 6.4 seeds m-2 and the density of pericarp pieces was 57.1 ± 9.5 pieces m-2. Halophila ovalis fruits were also found throughout the meadow with mean fruit density of 21.7 ± 10.8 fruits m-2 (Figure 3).
(A) (B)

Port of Karumba Long-term Seagrass Monitoring – October 2010 7
Map 1. Seagrass monitoring meadows and location of seagrass habitat characterisation sites in the Port of Karumba, October 2010.
Source:McKenna, S.A and Rasheed, M.A. (2011)
Port of Karumba Long Term Seagrass Monitoring, October 2010. DEEDI Publication (DEEDI, Cairns) pp 22.
© The State of Queensland through the Department of Emplyment Economic Development and Innovation
Funded by Ports Corporation Queensland Limited and the Department of Emplyment Economic Development and Innovation
Produced by the Marine Ecology Group, Queensland Department of Emplyment Economic Development and Innovation,
Northern Fisheries Centre, Cairns, 2011.
!(!(!(!(
!(
!(
!(
!(
!(
!(
!(
!(
!(
!(
!(
!(
!(
!(
!(!(
!(!(
!(
!(!(
!(
!(
!(
!(
!(
!(
!(
!(!(
!(
!(
!(
!(
!(
!(
!(
!(
!(
!(
!(
!(
!(
!(!(
!(!(
!(
!(
!(
!(
!(
!(
!(
!(
!(
!(
!(
!(
!(
!(
!(
!(!(
!(
!(!(
!(!(
!(
!(!(
!(
!(
!(
!(
!(
!(
!(
!(
!(!(
!(
!(!(
!(
!(
!(
!(
!(
!(
!(
!(
!(
!(
!(
!(
!(
140°51'0"E140°46'30"E140°42'0"E
17°28'30"S
±
Alligator Bank
NormanRiver
Bynoe River
0 1 2
Kilometers
LegendHabitat characterisation sites
!( Sites without seagrass!( Sites with seagrass
Monitoring meadow 2010
NB: 2010 is the first year that the core and fringing monitoring meadows were surveyed and combined as one monitoring meadow

Port of Karumba Long-term Seagrass Monitoring – October 2010 8
Figure 1. Mean (A) above ground biomass (g DW m-2) of monitoring meadow (+ SE) and (B)
meadow area (± Reliability) for each October seagrass survey of Karumba (1994 to 2010). Red dotted line is the 17 year average values (1994 to 2010).
0
2
4
6
8
10
12
14
16
Oct
-94
Oct
-95
Oct
-96
Oct
-97
Oct
-98
Oct
-99
Oct
-00
Oct
-01
Oct
-02
Oct
-03
Oct
-04
Oct
-05
Oct
-06
Oct
-07
Oct
-08
Oct
-09
Oct
-10
Bio
mas
s (g
DW
m-2
)
A
17 yr average
800
900
1000
1100
1200
1300
1400
1500
1600
1700
1800
Oct
-94
Oct
-95
Oct
-96
Oct
-97
Oct
-98
Oct
-99
Oct
-00
Oct
-01
Oct
-02
Oct
-03
Oct
-04
Oct
-05
Oct
-06
Oct
-07
Oct
-08
Oct
-09
Oct
-10
Are
a (H
a)
B
17 yr average

Port of Karumba Long-term Seagrass Monitoring – October 2010 9
!(!(
!(!(
!(
!(
!(
!(
!(
[[
[
[
[
[
140°46'30"E
17°28'30"S
Map 2. Density of Halodule uninervis seeds, broken pericarp pieces and Halophila ovalis fruits on Alligator Bank in the Port of Karumba, October 2010.
!(!(!(
!(!(
!(
!(
!(
!(
!( !(
!(!(
[[
!(!(
!(
!(
[
[[
[[
[[
[[
[
[
Norman River
Bynoe River
Alligator Bank
±Source:McKenna, S.A. and Rasheed, M.A. (2011) Port of Karumba Long Term Seagrass Monitoring, October 2010. DEEDI Publication (DEEDI, Cairns) pp22.
© The State of Queensland through the Department of Emplyment Economic Development and InnovationFunded by Ports Corporation Queensland Limited and the Department of Employment Economic Development and Innovation
Produced by the Marine Ecology Group, Queensland Department of Employment Economic Development and Innovation,Northern Fisheries Centre, Cairns, 2011.
Density of Halophila ovalis fruits (m-2)
Density of Halodule uninervis seeds (m-2)
Density of pericarp seed pieces (m-2)
0 1 2
Kilometers
[ 0
!( 1 - 20
!( 21 - 50
!( 51 - 100
[ 0
!( 1 - 50
!( 51 - 100
!( 101 - 150
[ 0
!( 1 - 50
!( 51 - 100
!( 101 - 150
Dense Halodule uninervis

Port of Karumba Long-term Seagrass Monitoring – October 2010 10
Figure 2. Percent composition of above ground biomass for seagrass species within the monitoring meadow in from 1994 to 2010.
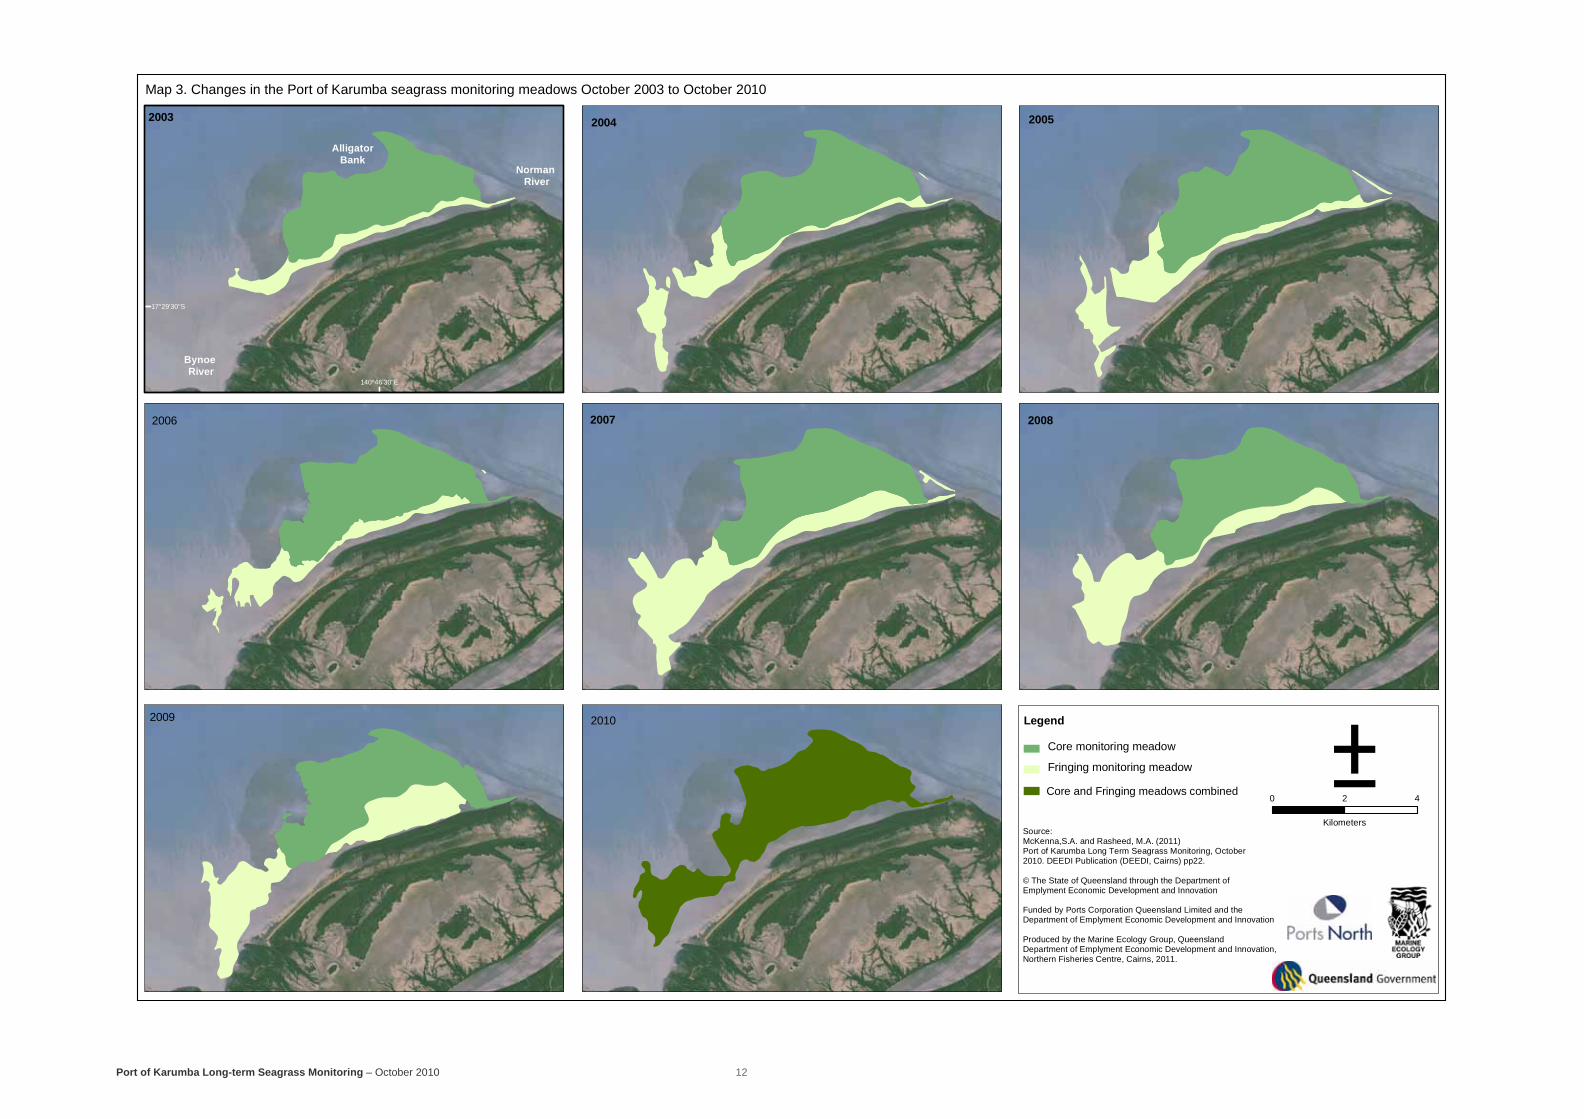
Comparison with previous monitoring surveys The Karumba seagrass monitoring meadow has been variable in distribution and biomass between monitoring surveys for the last 17 years. Seagrass biomass in the meadow has been significantly different between years and has ranged from 0.87 ± 0.1 g DW m-2 in 2002 to a peak in 2006 of 13.62 ± 1.10 g DW m-2 (Figure 1A, Rasheed and Unsworth 2011). For the last three years (2008-2010) meadow density has remained relatively high in Karumba and has been well above the 17 year average of 6.12 ± 0.75 g DW m-2 (Figure 1A). The mean biomass of seagrass recorded in 2010 (7.74 ± 0.75 g DW m-2) was the 4th highest value recorded since commencement of monitoring (Figure 1A). Halodule uninervis has been the dominant species in the meadow throughout the life of the monitoring program and contributes on average 88% of the species composition of the meadow (Figure 2). The total distribution of the meadow on Alligator Bank had a declining trend from 1994 to 1999 when meadow area reached a minimum (Figure 1A). Meadow area since 1999 has generally increased reaching a peak distribution of 1,649 ± 30.5 ha in 2007 (Figure 1A). Meadow area remained well above the 17 year average (1,267 ± 19 ha) in 2008 and 2009 then declined by 18% in 2010 to 1,283 ± 14.5 ha. This decrease in 2010 reflects the contraction of the meadow at the Bynoe River end and contraction in the centre of the meadow where the bulk of the “Core” and “Fringing” meadows met. Despite this decrease in area in 2010, values still remain well within the ranges previously recorded for meadow area. The reproductive capacity of the meadow (measured by seed and flower/fruit density) in 2010 remained broadly within the range of previous years assessments (Figure 3A & B). Changes in the mean density of seeds (although variable) between years is difficult to assess, as within year variability is very high, however mean seed density has decreased for the last two years (2009 & 2010) from the peak reached in 2008 (54.4 seeds m-2), but remains higher than the low levels recorded in 2004 (Figure 3A). Fruits of Halophila ovalis was at their lowest occurrence in 2010 (21.7 m-2) compared to all previous years but again have high within year error (Figure 3B).
0%
10%
20%
30%
40%
50%
60%
70%
80%
90%
100%
1994 1995 1996 1997 1998 1999 2000 2001 2002 2003 2004 2005 2006 2007 2008 2009 2010% S
peci
es c
ompo
sitio
n of
abo
ve-g
roun
d se
agra
ss b
iom
ass

Port of Karumba Long-term Seagrass Monitoring – October 2010 11
Figure 3. (A) Mean (± SE, n=15) density of Halodule uninervis seeds & pericarp pieces, and (B)
Halophila ovalis fruits sampled within the monitoring meadow (2000-2010).
0
20
40
60
80
100
120
140
160
180
2003 2004 2005 2006 2007 2008 2009 2010
Peric
arps
(no.
m-2
)
0
20
40
60
80
Seeds (no.m-2)
Pericarps/Seed piecesHalodule uninervis seeds
0
20
40
60
80
100
120
140
160
180
2003 2004 2005 2006 2007 2008 2009 2010
Frui
ts (
no.m
-2)
Halophila ovalis fruits
Port of Karumba Long-term Seagrass Monitoring – October 2010 12
Source:McKenna,S.A. and Rasheed, M.A. (2011) Port of Karumba Long Term Seagrass Monitoring, October 2010. DEEDI Publication (DEEDI, Cairns) pp22.
© The State of Queensland through the Department of Emplyment Economic Development and Innovation
Funded by Ports Corporation Queensland Limited and the Department of Emplyment Economic Development and Innovation
Produced by the Marine Ecology Group, Queensland Department of Emplyment Economic Development and Innovation,Northern Fisheries Centre, Cairns, 2011.
140°46'30"E
17°29'30"S
AlligatorBank
2003
Bynoe River
Norman River
2009 2010
2006
2004 2005
2007 2008
±0 2 4
Kilometers
Legend
Core monitoring meadow
Fringing monitoring meadow
Core and Fringing meadows combined
Map 3. Changes in the Port of Karumba seagrass monitoring meadows October 2003 to October 2010

Port of Karumba Long-term Seagrass Monitoring – October 2010 13
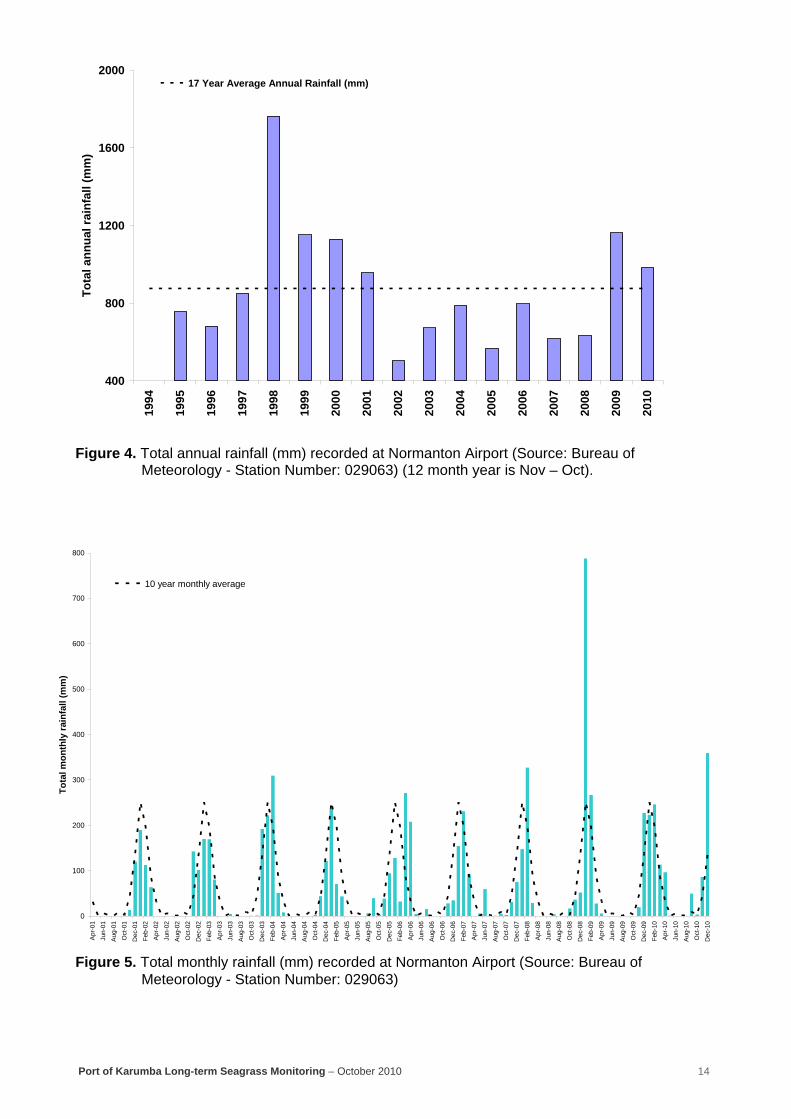
Port of Karumba climate analysis Total rainfall in Normanton in the 12 months leading up to the 2009 and 2010 surveys was well above average (Figure 4). Rainfall was also above average in August and September 2010; three and one months prior to the 2010 survey (Figure 5). The flow of the Norman River in 2010 (4,317,659.9 ML) was the third highest recorded since monitoring began in 1994 (Figure 6). Most of the catchment and river flow occurred between January and April 2010 with no flow values recorded from May to October 2010 (Figure 6 inset). The flow values for 2009 and 2010 coincide with the extensive flooding that occurred within the region during those years (Figure 7). The high rainfall and river flow levels seen in 2009 and 2010 has followed 7 years of records that were mostly below average. The annual mean daily maximum temperatures recorded at Normanton between 2008 and 2010 have also been above the 17 year average (Figure 8). This followed below average temperatures recorded in 2006 and 2007 (Figure 8). Similar to temperature, solar exposure has been above average since 2007. Higher values of solar exposure occurred mainly in the earlier part of the 12 months leading up to the October 2010 survey, while October also had above average levels of solar exposure (Figure 10). In contrast, annual daytime tidal exposure has been below the 17 year average for the last nine years (Figure 11). The Alligator Bank seagrass meadow was exposed for longer periods from May to September 2010 (Figure 11 inset).
Port of Karumba Long-term Seagrass Monitoring – October 2010 14
Figure 4. Total annual rainfall (mm) recorded at Normanton Airport (Source: Bureau of
Meteorology - Station Number: 029063) (12 month year is Nov – Oct).
Figure 5. Total monthly rainfall (mm) recorded at Normanton Airport (Source: Bureau of Meteorology - Station Number: 029063)
400
800
1200
1600
2000
1994
1995
1996
1997
1998
1999
2000
2001
2002
2003
2004
2005
2006
2007
2008
2009
2010
Tota
l ann
ual r
ainf
all (
mm
)17 Year Average Annual Rainfall (mm)
0
100
200
300
400
500
600
700
800
Apr
-01
Jun-
01A
ug-0
1O
ct-0
1D
ec-0
1Fe
b-02
Apr
-02
Jun-
02A
ug-0
2O
ct-0
2D
ec-0
2Fe
b-03
Apr
-03
Jun-
03A
ug-0
3O
ct-0
3D
ec-0
3Fe
b-04
Apr
-04
Jun-
04A
ug-0
4O
ct-0
4D
ec-0
4Fe
b-05
Apr
-05
Jun-
05A
ug-0
5O
ct-0
5D
ec-0
5Fe
b-06
Apr
-06
Jun-
06A
ug-0
6O
ct-0
6D
ec-0
6Fe
b-07
Apr
-07
Jun-
07A
ug-0
7O
ct-0
7D
ec-0
7Fe
b-08
Apr
-08
Jun-
08A
ug-0
8O
ct-0
8D
ec-0
8Fe
b-09
Apr
-09
Jun-
09A
ug-0
9O
ct-0
9D
ec-0
9Fe
b-10
Apr
-10
Jun-
10A
ug-1
0O
ct-1
0D
ec-1
0
Tota
l mon
thly
rain
fall
(mm
)
10 year monthly average

Port of Karumba Long-term Seagrass Monitoring – October 2010 15
Figure 6. Annual water flow (megalitres) for the Norman River recorded at Glenore Weir (Station
916001B) (12 month year is Nov – Oct). Source: Queensland Department of Environment and Resource Management, 2011.
Figure 7. Annual highest flood peaks on the Norman River since 1974. Graph taken directly from
www.bom.gov.au
0
1000000
2000000
3000000
4000000
5000000
6000000
7000000
8000000
9000000
1994
1995
1996
1997
1998
1999
2000
2001
2002
2003
2004
2005
2006
2007
2008
2009
2010
Tota
l ann
ual r
iver
flow
(ML) 0
200000
400000
600000
800000
1000000
1200000
1400000
1600000
1800000
Nov
-09
Dec
-09
Jan-
10
Feb-
10
Mar
-10
Apr-
10
May
-10
Jun-
10
Jul-1
0
Aug-
10
Sep-
10
Oct
-10
Mon
thly
Riv
er F
low
(ML)
2010 River Flow

Port of Karumba Long-term Seagrass Monitoring – October 2010 16
Figure 8. Mean annual daily air temperature (°C) at Normanton Airport (12 month year is Nov –
Oct) (Source: Bureau of Meteorology - Station Number: 029063)
Figure 9. Mean annual daily global solar exposure (MJ m-2) at Normanton Airport (12 month year is Nov – Oct) (Source: Bureau of Meteorology - Station Number: 029063)
31.5
32.5
33.5
34.5
1994
1995
1996
1997
1998
1999
2000
2001
2002
2003
2004
2005
2006
2007
2008
2009
2010
Mea
n an
nual
dai
ly m
axim
um a
ir te
mpe
ratu
re (C
) 17 Year Average
20.00
20.50
21.00
21.50
22.00
22.50
23.00
1994 1995 1996 1997 1998 1999 2000 2001 2002 2003 2004 2005 2006 2007 2008 2009 2010
Ann
ual M
ean
daily
glo
bal s
olar
exp
osur
e (M
J m
-2)
21 Year Average

Port of Karumba Long-term Seagrass Monitoring – October 2010 17
Figure 10. Mean monthly daily global solar exposure (MJ m-2) at Normanton Airport (Source:
Bureau of Meteorology - Station Number: 029063)
Figure 11. Total annual daytime exposure (hrs)* of seagrass meadows on Alligator Bank, (12
month year is Nov – Oct) (note – data missing between November 2000 and June 2001). Inset: Total monthly tidal exposure November 2009 – October 2010 * Assumes intertidal banks become exposed at a tide height of 0.9m above Lowest Astronomical Tide.
0
5
10
15
20
25
30
35
Nov-09 Dec-09 Jan-10 Feb-10 Mar-10 Apr-10 May-10 Jun-10 Jul-10 Aug-10 Sep-10 Oct-10
Mon
thly
mea
n da
ily g
loba
l sol
ar e
xpos
ure
(MJ
m-2
)12 Monthly Average
0
200
400
600
800
1000
1994
1995
1996
1997
1998
1999
2000
2001
2002
2003
2004
2005
2006
2007
2008
2009
2010
Tota
l ann
ual t
idal
exp
osur
e (h
rs)
0
10
20
30
40
50
60
70
80
90
Nov-09 Dec-09 Jan-10 Feb-10 Mar-10 Apr-10 May-10 Jun-10 Jul-10 Aug-10 Sep-10 Oct-10
Tota
l mon
thly
hou
rs o
f exp
osur
e (<
0.9m
)
17 year average 2010 Exposure

Port of Karumba Long-term Seagrass Monitoring – October 2010 18
DISCUSSION Seagrass Distribution and Abundance Seagrass meadows in the Port of Karumba were found in 2010 to be in a healthy and productive state with dugong feeding trails seen in 57% of the sites that had seagrass. Although meadow area declined in 2010, the meadow remains spatially expansive and dense, with biomass and area values above the 17 year averages. Seagrass meadows can be highly dynamic and variable with changes in biomass and distribution commonly varying up to a factor of four (Mellors et al. 1993, McKenzie 1994, Lanyon and Marsh 1995). The publication produced from 16 years of monitoring in Karumba found that variability in biomass and distribution within the Alligator Bank monitoring meadow correlated with climate (river flow and temperature) and long-term tidal exposure cycles (Rasheed and Unsworth 2011). Above-ground biomass had a positive correlation with river flow, while air temperature was a negative correlate with biomass. Meadow area was observed to have a positive correlation with the number of hours of daylight tidal exposure (Rasheed and Unsworth 2011). These outcomes were also able to be applied to the 2010 results. 2009 and 2010 were years marked by high rainfall and flooding, which resulted in some of the largest flows of the Norman river during the 17 years of the monitoring program. Despite the heavy flooding in 2009 and 2010, the seagrasses in Karumba remained in a healthy and above average condition. These results fit with the positive correlation between biomass and river flow reported in Rasheed and Unsworth (2011). Although high short-term rainfall and flooding can cause burial, large freshwater pulses, periods of high turbidity and associated light reduction which can all negatively affect seagrasses (Campbell et al. 2006; Waycott et al. 2007; Cardoso et al. 2008; Chartrand et al. 2010), river flows are important in supplying nutrients into coastal seagrass meadows (Short 1987; Udy et al. 1999). Most of the rainfall and river flow in 2009 and 2010 occurred in the earlier part of the year. It is therefore possible that the flooding may have led to a short term decline in seagrasses earlier in the year and that they were able to recover by the November (2009) and October (2010) surveys. No post flood surveys were conducted to confirm any loss post flooding. Meadow distribution in Karumba was found to have a positive correlation with the number of hours of daylight tidal exposure (Rasheed Unsworth 2011). This relationship may explain the decrease in area of the Halodule uninervis dominated meadow seen in 2010 compared to 2009, where area reduction coincided with a decrease in tidal exposure (of 75 hours) compared to 2009. The positive correlation between exposure and area was unexpected given the potential for exposure to result in thermal stress and desiccation (Bjork et al. 1999; Campbell et al. 2006). This result contrasts those found for Enhalus acoroides in Weipa, where low daytime tidal exposure in the month prior to monitoring events was highly correlated with increases in biomass in these meadows (Rasheed et al. In Prep). The positive correlation in Karumba may relate to low light availability in the marine environment. Light availability is a primary factor of seagrass physiology and productivity (Ralph et al. 2007). Seagrasses in Karumba are likely to be growing at or near their photosynthetic compensation point (Falkowski and Raven 1997; Chartrand et al. 2010) and are reliant on a narrow window of opportunity around low tide for effective photosynthesis (Pollard and Greenway 1993). Low amounts of hours of exposure would have substantially reduced the effective window of opportunity for seagrass growth and the pooling of water at low tide on Alligator Bank may offer protection to seagrasses from exposure stress. The above average biomass and distribution seen in the Karumba monitoring meadow was consistent with changes seen in the Port of Weipa and Torres Strait (McCormack et al 2011, Fisheries Queensland). In contrast, seagrasses on the east coast of Queensland have suffered widespread losses throughout 2010. Seagrasses in the Torres Strait and the Gulf of Carpentaria seem to have been less affected by La Nina events that have caused major impacts in the state in

Port of Karumba Long-term Seagrass Monitoring – October 2010 19
2010. These conditions have likely contributed to major declines seen on the east coast through significant flooding and storm events.
Seagrass resilience and ecosystem consequences of change Reproductive structures of Halophila ovalis and seeds of Halodule uninervis were observed in the monitoring meadow in 2010. The presence of seeds and reproductive structures indicate that the meadow has some capacity to remain resilient to future disturbances and climatic variability (Rasheed 2004; Bell et al. 2008). Although seeds occurred in the sediment, observed densities are multiple orders of magnitude lower than at other locations in Queensland (McKenzie and Unsworth 2009). Some Halodule uninervis meadows in Queensland have recorded very high seed densities (commonly average >2000 per m2) (Inglis 2000; McKenzie and Unsworth 2009). In contrast, seed density was much higher in Karumba than at Abbot Pt where extensive seed sampling was conducted seasonally for 13 months in a Halodule uninervis dominated meadow. Within the 13 month study reproductive structures were only found on one occasion and seed density was only 1.33 ± 0.43 seeds per m2. These differences throughout the state emphasise the need to understand local differences in meadow characteristics to understand resilience and capacity for recovery. The results of meadow change seen in 2009 and 2010 are not likely to have resulted in major change in habitat structure for faunal communities. Changes in seagrass biomass and distribution, and hence habitat structure do effect its capacity to support fauna (Unsworth et al. 2007), however seagrass in Karumba remains spatially expansive and dense. Seagrasses at Karumba provide a food source for dugong utilising the region and a high value as fisheries nursery habitat. There is evidence that declines in commercial catches of barramundi and grey mackerel in Karumba have coincided with declines in seagrass abundance in the past (Gribble et al. 2005), but the minor changes observed in 2009 and 2010 relative to 2008 are unlikely to have resulted in such changes.
Implications for port management and future monitoring Results of the 2010 survey indicate that the marine environment of the port was in a healthy condition and that anthropogenic activities including dredging and other port and urban activities are unlikely to have had a significant impact on seagrasses in Karumba over the previous 12 months. Although currently un-impacted by anthropogenic stress however, the marine environment of the port continues to be at risk from the shipping activities at the port. Dredging and shipping activities have commonly been observed in many locations to damage seagrass (Erftemeijer and Lewis 2006) and natural conditions have the capacity to reduce the resilience of seagrasses to the point they become vulnerable to impacts they have previously been able to resist. The use of a seagrass monitoring program in Karumba continues to provide an excellent indicator of environmental change, enabling natural environmental change to be separated from any potential anthropogenic impacts. Understanding natural cycles of change in Karumba seagrasses is also important as natural events have the capacity to reduce the resilience of seagrasses in the region to current human activities such as port dredging programs. To better understand some of the changes occurring at the meadow rather than regional level there are some enhancements that could be applied to the existing monitoring program, for example, deploying and using in situ light and temperature loggers. Light and temperature are two of the major factors that have been linked to changes in seagrasses. The use of light and temperature data loggers within monitoring meadows at other monitoring locations has enabled an evaluation of changes occurring at the meadow scale (Chartrand et al. 2010). This provides direct information on what conditions seagrasses are experiencing rather than inferring them from regional climate information. Where installed, these loggers have shown that meadows of similar species composition and location may experience different physical conditions and different outcomes in density and distribution over time (Chartrand et al. 2010).

Port of Karumba Long-term Seagrass Monitoring – October 2010 20
REFERENCES Bell, SS, Fonseca, MS & Kenworthy, WJ 2008, 'Dynamics of a subtropical seagrass landscape:
links between disturbance and mobile seed banks'. Landscape Ecology, 23, pp. 67-74. Bjork, M, Uka, J, Weil, A, & Beer, S 1999, 'Photosynthetic tolerances to desiccation of tropical
intertidal seagrasses', Marine Ecology Progress Series, vol.191, pp. 121-126. Campbell, SJ, McKenzie, LJ & Kerville, SP 2006, 'Photosynthetic responses of seven tropical
seagrasses to elevated seawater temperature' Journal of Experimental Marine Biology and Ecology, vol. 330, pp. 455-468.
Cardoso, PG, Raffaelli, D & Pardal, MA 2008, 'The impact of extreme weather events on the seagrass Zostera noltii and related Hydrobia ulvae population', Marine Pollution Bulletin, vol. 56, pp. 483–492.
Chartrand, K, McKenna, SA, Petrou, K, Jimenez-Denness, IM, Franklin, J, Sankey, TL, Hedge, SA, Rasheed, MA & Ralph, PJ 2010, 'Port Curtis Benthic Primary Producer Habitat Assessment and Health Studies Update: Interim Report December 2010' DEEDI Publication. Fisheries Queensland, Cairns, 128pp.
Costanza, R, d'Arge R, de Groot, R & Farber, S. 1997, 'The value of the world's ecosystem services and natural capital. Nature', vol. 387, pp. 253-260.
Dennison, WC, Orth, RJ, Moore, KA, Stevenson, JC, Carter, V, Kollar, S, Bergstron, PW, & Batiuk, RA 1993, 'Assessing water quality with subnersed aquatic vegetation: Habitat requirements as barometers of Chesapeake Bay health', BioScience, vol. 43, pp. 86-94.
Erftemeijer, PLA & Lewis, RRR 2006, 'Environmental impacts of dredging on seagrasses: A review. Marine Pollution Bulletin', vol. 52, pp. 1553-1572.
Falkowski, PG & Raven, JA 1997, Aquatic photosynthesis, Blackwell Science, Malden, MA. Gribble, NA, Rasheed, M & Balston, J 2005, Drought impacts on Marine Ecosystems of the
southern Gulf of Carpentaria. ASFB National Conference. Hemminga, MA & Duarte, CM 2000, Seagrass ecology, Cambridge University Press, Cambridge. Inglis, GJ 2000, 'Varitation in the recruitment behaviour of seagrass seeds: implications for
population dynamics and resouce management. Pacific Conservation Biology,' vol. 5, pp. 251-259.
Kennedy, K & Bjork, M 2009, 'The management of natural coastal carbon sinks'. IUCN, Gland, pp. 23-29.
Lanyon, JM & Marsh, H 1995, 'Temporal changes in the abundance of some tropical intertidal seagrasses in North Queensland', Aquatic Botany, vol. 49, pp. 217-237.
McCormack, CV, Rasheed, MA & Unsworth, RKF 2011, 'Port of Weipa Long-term Seagrass Monitoring September 2010', DEEDI Publication, Fisheries Queensland, Cairns, 25pp.
McKenzie, LJ 1994, 'Seasonal changes in biomass and shoot characteristics of a Zostera capricorn Aschers. dominant meadow in Cairns Harbour, northern Queensland', Marine and Freshwater Research, vol. 45, pp. 1337-1352.
McKenzie, LJ & Unsworth, RKF 2009, 'Great Barrier Reef Water Quality Protection Plan (Reef Rescue) - Marine Monitoring Program: Intertidal Seagrass. Final Report for the Sampling Period 1st September 2008 - 31st May 2009', Fisheries Queensland, Cairns, pp. 127.
Mellors, JE 1991, 'An evaluation of a rapid visual technique for estimating seagrass biomass. Aquatic Botany, vol. 42, pp. 67-73.
Mellors, JE, Marsh, H & Coles, RG 1993, 'Intra-annual changes in seagrass standing crop, Green Island, northern Queensland', Marine and Freshwater Research, vol. 44, pp. 33-42.
Pollard, PC & Greenway, M 1993, 'Photosynthetic characteristics of seagrasses (Cymodocea serrulata, Thalassia hemprichii and Zostera capricorni) in a low-light environment, with a comparison of leaf-marking and lucunal-gas measurements of productivity', Australian Journal of Marine and Freshwater Research, 44, vol. pp. 127-140.
Ralph, PJ, Durako, MJ, Enriquez, S, Collier, CJ & Doblin, MA 2007, 'Impact of light limitations on seagrasses', Journal of Experimental Marine Biology and Ecology, vol. 350, pp. 176-193.
Rasheed, MA 2004, 'Recovery and succession in a multi-species tropical seagrass meadow following experimental disturbance: the role of sexual and asexual reproduction', Journal of Experimental Marine Biology and Ecology, vol. 310, pp. 13 - 45.
Rasheed, MA, Chartrand, KM, Unsworth, RKF & others (In Prep) 'Variable tidal exposure explains the long-term decline of an Enhalus acoroides dominated intertidal seagrass meadow in tropical North-East Australia'.

Port of Karumba Long-term Seagrass Monitoring – October 2010 21
Rasheed, MA, Dew, KR, McKenzie, LJ, Coles, RG, Kerville, S & Campbell, SJ 2008, 'Productivity, carbon assimilation and intra-annual change in tropical reef platform seagrass communities of the Torres Strait, north-eastern Australia', Continental Shelf Research, vol. 28, pp. 2292- 2303.
Rasheed, MA, Lee Long, WJ, McKenzie, LJ, Roder, CA, Roelofs, AJ & Coles, RG 1996, 'Port of Karumba Seagrass Monitoring, Baseline Surveys - Dry season (October) 1994 and Wet season (March) 1995', Ports Corporation of Queensland, Brisbane.
Rasheed, MA, Roelofs, AJ, Thomas, R & Coles, RG 2001, 'Port of Karumba Seagrass Monitoring - First 6 Years;, EcoPorts Monograph Series, Ports Corporation of Queensland, Brisbane, 20, pp. 38.
Rasheed, MA & Unsworth, RKF 2011, 'Long-term climate-associated dynamics of a tropical seagrass meadow: implications for the future', Marine Ecology Progress Series, vol. 422, pp. 93-103.
Short, FT 1987, 'Effects of sediment nutrients on seagrasses: literature review and mesocosm experiment', Aquatic Botany, vol. 27, pp. 41-57.
Udy, JW, Dennison, WC, Lee Long, WJ & McKenzie, LJ 1999, 'Responses of seagrass to nutrients in the Great Barrier Reef, Australia', Marine Ecology Progress Series, vol. 185, pp. 257-271.
Unsworth, RKF, De Grave, S, Jompa, J, Smith, DJ & Bell, JJ 2007, 'Faunal relationships with seagrass habitat structure: a case study using shrimp from the Indo-Pacific', Marine and Freshwater Research, vol. 58, pp. 1008-1018.
Unsworth, RKF, McKenna, SA & Rasheed, MA 2009, 'Port of Karumba Long-term Seagrass Monitoring, October 2008', DPI&F Publication PR09-4227 (DPI&F, Northern Fisheries Centre, Cairns) 25 pp.
Waycott, M, Collier, C, McMahon, K, Ralph, PJ, McKenzie, LJ, Udy, JW & Grech, A 2007, 'Vulnerability of seagrasses in the Great Barrier Reef to climated change'. In: Johnson J.E., Marshall, R.A. (eds) Climated change and the Great Barrier Reef: a vulnerability assessment. Great Barrier Reef Marine Park Authority, Townsville, 193-236.