department of of chemical engineering of of chemical engineering ... plate and frame filter press...
TRANSCRIPT

DEPARTMENT
OF
OF CHEMICAL ENGINEERING
SRM UNIVERSITY,KATTANKULATHUR
KANCHEEPURAM DISTRICT, TAMILNADU – 603203
15CH211L MECHANICAL OPERATIONS AND FLUID
MECHANICS LAB II
NAME :
REG.NO :
1
SRM UNIVERSITY
(Under Section 3 of UGC Act,1956)
SRM Nagar,KATTANKULATHUR – 603203
KANCHEEPURAM DISTRICT
BONAFIDE CERTIFICATE
Register No: ______________________________________
Certified to be the bonafide record of work done by___________________________
of _________________________________ B.Tech Degree course in the practical
_______________________________________ in SRM University,Kattankulathur
during the academic year ____________________
Lab Incharge
Date: Head of the Department
Submitted for University examination held in ________________________________ SRM
University, at Kattankulathur.
Date Examiner I Examiner II

2
Name: Branch:
Class: Reg.No:
INDEX Exp
.No
Date Title of Experiment Page Date of
submission
Remarks
1
2
3
4
5
6
7
8
9
10
11
12
1
Ex.No. Date:
PLATE AND FRAME FILTER PRESS
AIM:
To determine the specific cake resistance and filter medium resistance for the
filtration of CaCO3 slurry in a Plate and Frame Filter press.
DESCRIPTION:
The setup consists of a plate and frame type filter press. It has seven plates and six
frames. Filter cloth is fixed between the plate and the frame. It has a tank that has a provision
to feed the slurry. Filtrate is collected in a tray. Filtration is carried out at constant pressure.
THEROY:
Filter press is a discontinuous press consists of a set of plates designed to provide a
series of compartments in which solids may collect. The plates are covered with a filter
medium. Slurry is admitted into each compartment under pressure. Liquor passes through the
septum and out through a discharge pipe leaving a cake of wet solids behind. Filtration is
continued until liquor no longer flows out or the filtration pressure suddenly rises. This
occurs when the frame is full of solid and nor more slurry can enter. The press is then said to
be jammed. Wash liquid is then admitted to remove soluble impurities from the solids after
which the cake is blown with steam or air to displace as much residual liquid as possible. The
press is then opened and the cake of solids removed from the septum. Thorough washing in a
filter press may take several hours.
PROCEDURE:
About 10 lit of 5% of CaCO3 slurry was prepared.
The feed solution was poured into the supply tank and stirred continuously.
The plates and frames were fixed properly by applying pressure through the lead
screw.
The compressor was switched on and the pressure was adjusted to say 0.8 bar.
The feed valve was opened.
Filtrate was collected in the collector tray.
The volume of filtrate flowing out in a given time was measured.
The experiment was stopped when no more filtrate is collected.
A sample of wet cake was taken and transferred to a weighed watch glass.
The weight of the wet cake was noted.
The watch glass with the cake was kept in the oven and dried and weighed again to
get the weight of the dry cake.

2
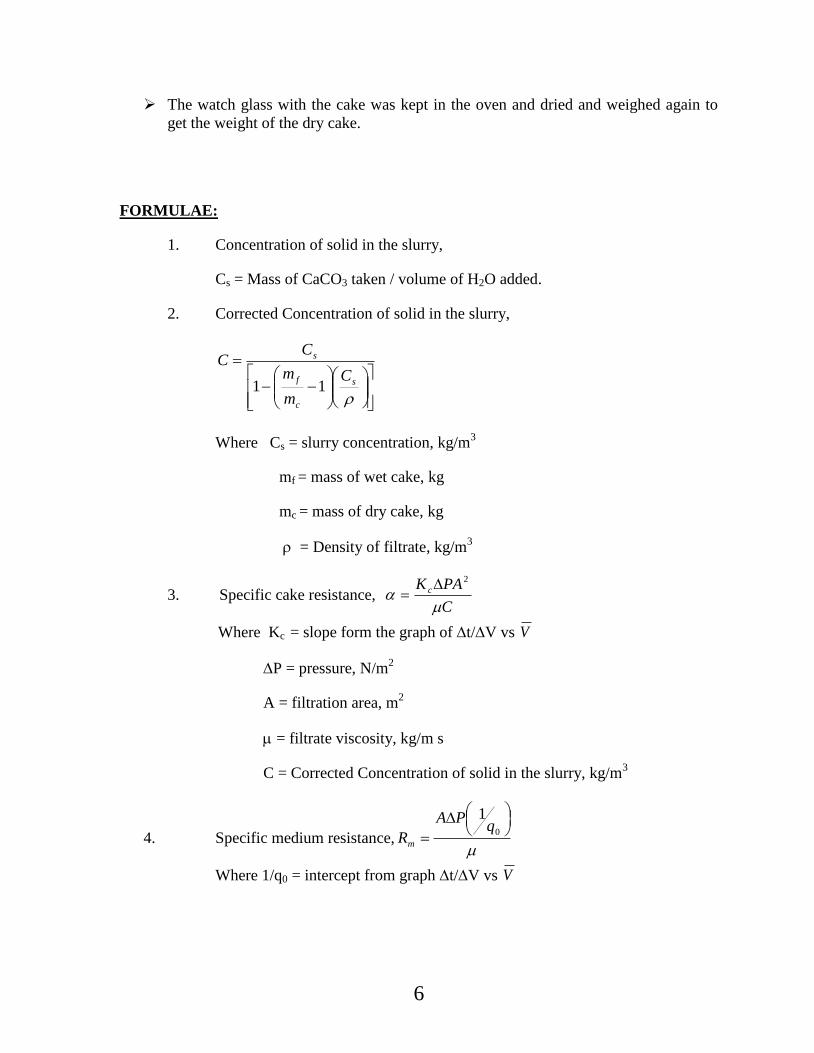
FORMULAE:
1. Concentration of solid in the slurry,
addedOHofVolume
takenCaCOofmassCs
2
3 , kg/m
3
2. Corrected Concentration of solid in the slurry,
s
c
f
s
C
m
m
CC
11
, kg/m3
Where Cs = slurry concentration, kg/m3
mf = mass of wet cake, kg
mc = mass of dry cake, kg
= Density of filtrate, kg/m3
3. Specific cake resistance, C
gPAK cc
2 , m/kg
Where Kc = slope form the graph of t/V vs V
P = pressure, N/m2
gc = Newton‟s law proportionality constant, kg m / N s2
A = filtration area, m2
= filtrate viscosity, kg/m s
C = Corrected Concentration of solid in the slurry, kg/m3
4. Filter medium resistance,
0
1q
PgA
Rc
m , m-1
Where 1/q0 = intercept from graph t/V vs V

3
TABLE 1:
S.No
Filtrate
volume,
V
(m3)
Time, t
(sec)
t
(sec)
V
(m3)
V =(V1+V2)/2
(m3)
t/V
(sec/m3)
4
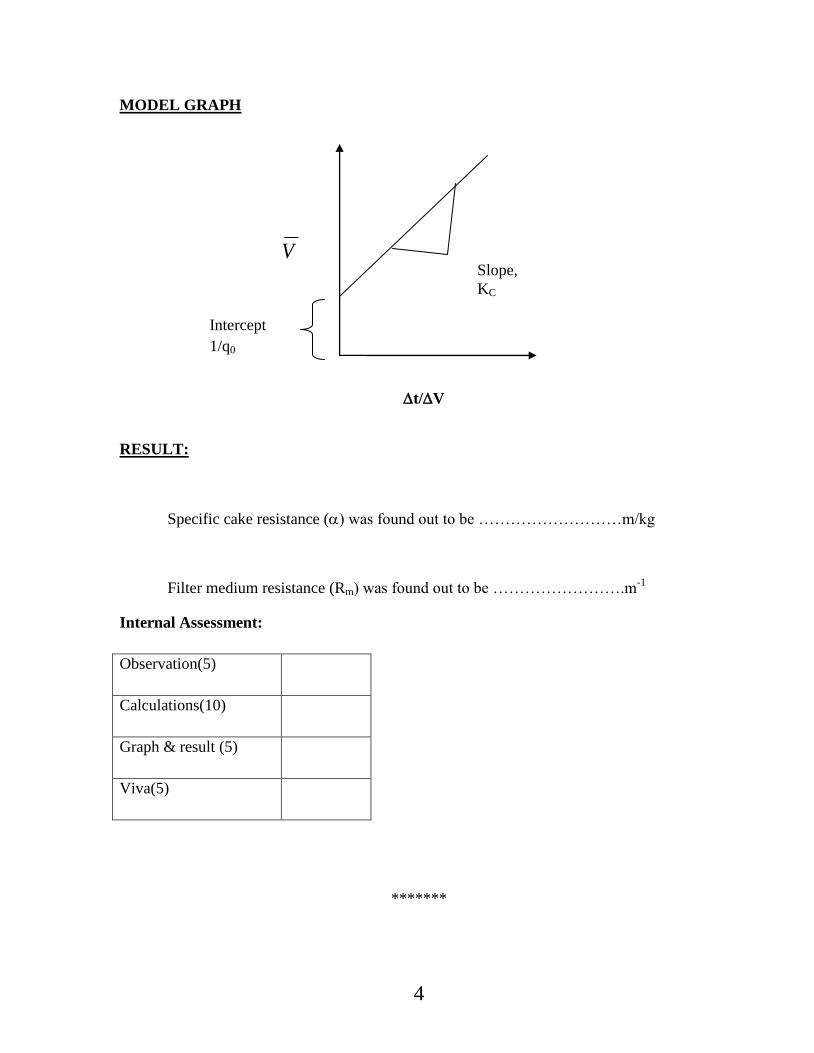
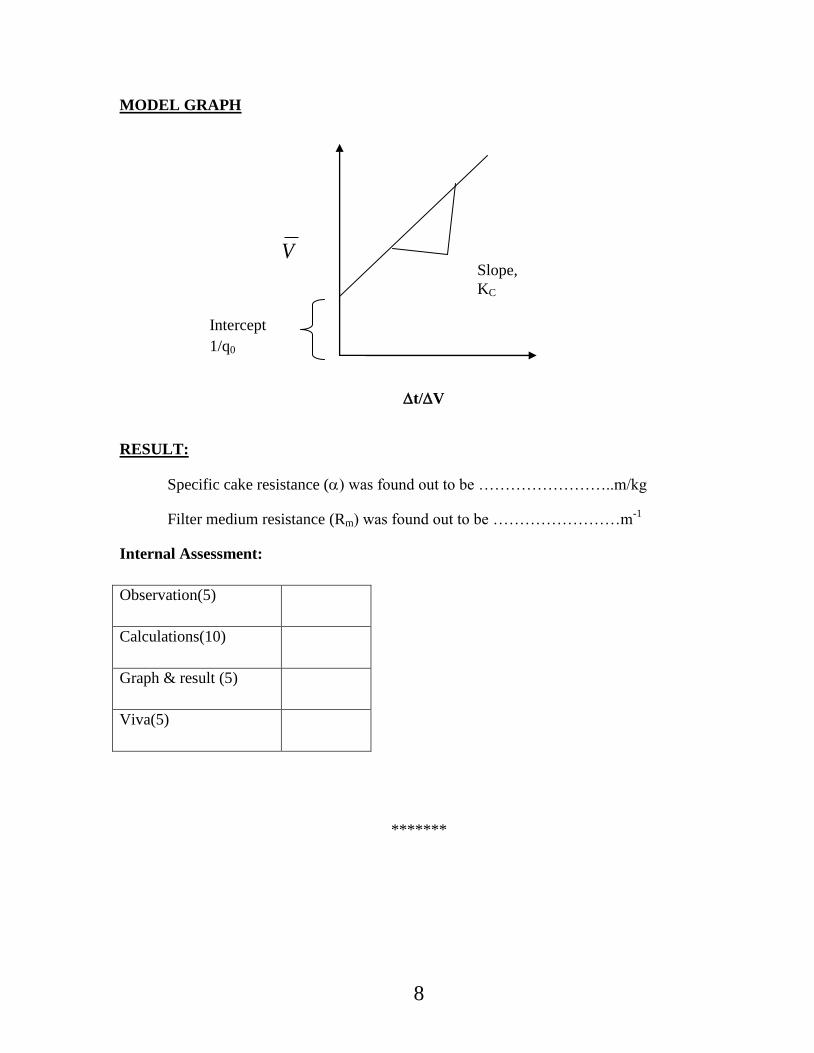
t/V
V Slope,
KC
MODEL GRAPH
RESULT:
Specific cake resistance () was found out to be ………………………m/kg
Filter medium resistance (Rm) was found out to be …………………….m-1
Internal Assessment:
Observation(5)
Calculations(10)
Graph & result (5)
Viva(5)
*******
Intercept
1/q0

5
Ex.No. Date:
VACUUM LEAF FILTER
AIM:
To determine the specific cake resistance and filter medium resistance for the
filtration of CaCO3 slurry using leaf filter.
DESCRIPTION:
The unit has a stainless steel slurry tank agitated with a variable speed impeller
adjusted by a regulator. It has a stainless steel filter leaf covered with a filter cloth. On the
retaining grid from the filter leaf, a tube is connected to a stainless steel filtrate collection
column. The filtrate collection column is provided with a level gauge Vacuum regulator,
Vacuum gauge and filtrate outlet valve. All the units are mounted on the structural frame
work. Other apparatus needed are watch glass, balance and stop watch.
THEORY:
The filter press is not so economical for handling large quantities of sludge or for
efficient washing with a small amount of wash water, because of channeling that always
takes place in a washing press. For filtering under pressures than are possible in a plate and
frame press, to economize on labor or where more efficient washing of the cake is necessary,
a shell and leaf filter is used. In the horizontal tank design, a set of vertical leaves is held on a
retractable rack. Feed enters the side of the tank. During operation, the leaves are inside the
closed tank. Filtrate passes through the leaves into a discharge. It is used for filtrations
involving filter aids.
The core of the leaf is a piece of heavy coarse mesh double crimped wire screen after
followed by a finer screen. But it is still coarse to act as a filter medium. So a leaf filter is
called a leaf cloth. It is costly and complicated.
PROCEDURE:
3% CaCO3 slurry was prepared and taken in a slurry tank.
The stirrer was kept at a suitable speed and the slurry was stirred well.
All valves from the filtrate collection column were closed.
Vacuum pump was switched on.
The time was noted for every 1cm increase in level of filtrate in the level gauge.
The vacuum gauge reading was noted.
The experiment was stopped when no more filtrate is collected.
A sample of wet cake was taken and transferred to a weighed watch glass.
The weight of the wet cake was noted.
6
The watch glass with the cake was kept in the oven and dried and weighed again to
get the weight of the dry cake.
FORMULAE:
1. Concentration of solid in the slurry,
Cs = Mass of CaCO3 taken / volume of H2O added.
2. Corrected Concentration of solid in the slurry,
s
c
f
s
C
m
m
CC
11
Where Cs = slurry concentration, kg/m3
mf = mass of wet cake, kg
mc = mass of dry cake, kg
= Density of filtrate, kg/m3
3. Specific cake resistance, C
PAK c
2
Where Kc = slope form the graph of t/V vs V
P = pressure, N/m2
A = filtration area, m2
= filtrate viscosity, kg/m s
C = Corrected Concentration of solid in the slurry, kg/m3
4. Specific medium resistance,
0
1q
PA
Rm
Where 1/q0 = intercept from graph t/V vs V

7
TABLE 1:
S.No
Filtrate
level,h
(m)
Time, t
(sec)
Filtrate
volume, V
(m3)
V
(m3)
t
(sec)
V =(V1+V2)/2
(m3)
t/V
(sec/m3)
8
t/V
V Slope,
KC
MODEL GRAPH
RESULT:
Specific cake resistance () was found out to be ……………………..m/kg
Filter medium resistance (Rm) was found out to be ……………………m-1
Internal Assessment:
Observation(5)
Calculations(10)
Graph & result (5)
Viva(5)
*******
Intercept
1/q0
9
Ex.No. Date:
AIR ELUTRIATOR
AIM:
To determine the average size of the particles in the given mixture by conducting an
experiment in an air elutriator.
THEORY:
Elutriator is a vertical tube through which the fluid passes upwardly at a specific
velocity and the feed mixture containing solid particles of different sizes and density is kept
inside the feed cup. Particles whose free settling is more than the upward velocity of fluid
settle down and are collected as the underflow from the bottom of the chamber, whereas
particles whose free settling velocity is less than the upward velocity of fluid are carried over
by the ascending fluid and are collected in the overflow from the top of the column. By using
a number of elutriation columns of increasing cross sectional area in series, several fractions
of solids can be sorted.
PROCEDURE:
About 2.5 gm of sample was weighed and placed in the feed bottle.
Weight of all the sample bottles was noted.
Connect the sample bottle to the elutriator outlet and allow the air to elutriate at low
velocity so that the difference in the manometer fluid becomes 0.5 cm for about 10
min.
The sample bottle with sample was weighed and the actual weight of sample collected
was calculated.
The above procedure was repeated for different air flow rates such that the difference
in the manometer fluid is 1cm, 1.5cm, 2cm and 2.5cm respectively.

TABLE 1:
S.
No
Manometer Reading Weight of
empty
bottle
(g)
Weight of
bottle +
sample
(g)
Weight
of
sample
(g)
Weight
fraction,
xi
Mass
flowrate,
m
(kg/s)
Volumetric
flowrate,q
(m3/s)
Settling
velocity
(m/s)
Average
particle
size,
piD
(mm)
xi / piD
(mm-1
)
LHS
(m)
RHS
(m)
H
(m)
1
2
3
4
5
pi
i
D
x=
10

SPECIFICATIONS:
Diameter of elutriation tank =30mm
Diameter of Orifice =5mm
FORMULAE :
1. Pressure difference = P =H g (A-B), kg/m s2
Where,
H = Manometer reading =LHS – RHS, (m)
A = Density of manometer fluid (water), kg/m3
B = Density of the air, kg/m3
g = Acceleration due to gravity, m/s
2
2. Mass flow rate of air, m = Bo PAxYx 261.0 , kg/s
Where,
Y = expansion factor
Ao = orifice area, m2
3. Volumetric flow rate of air, q = m / B, m3/s
4. Terminal settling velocity, Vt = q / A, m/s
Where,
A = cross sectional area of the column, m2
5. Particle size, Dp = Bp
t
g
V
18
where, p = density of the particle, kg/m3
= Viscosity of air, kg/ m s
11

12
6. Average particle size =
pi
i
D
x
1
RESULT:
The average size of the particle is found to be ………………. m.
Internal Assessment:
Observation(5)
Calculations(10)
Graph & result (5)
Viva(5)
*********

13
Ex.No: Date:
CYCLONE SEPARATOR
AIM :
To study the performance of a given cyclone separator
THEORY:
A given particle in a given fluid settles under gravitational force at a fixed maximum
rate. To increase the settling rate the force of gravity acting on the particle may be replaced
by a much stronger centrifugal force. Centrifugal separators have replaced gravity separators
to a considerable extent in production operations because of their greater effectiveness with
fine drops and particles and their much smaller size for a given capacity. Most centrifugal
separators for removing particles from gaseous streams contain no moving parts. It consists
of a vertical cylinder with a conical bottom, a tangential inlet near the top, and an outlet for
dust at the bottom of the cone. The outlet pipe is extended into the cylinder to prevent short
circuiting of air from inlet to outlet. The feed enters the cyclone tangentially near the top and
is given a spinning motion as it enters the cylindrical chamber. The centrifugal force
developed in the vortex tends to move the particle radially towards the wall, and the particles
reach the wall slide down into the cone and are collected. The classified air leaves the
cyclone through a pipe extended down into the cyclone and passes through blower deliver
side fitted with fine screen cloth bag to avoid dust expansion.
PROCEDURE:
Prepare feed stock of cement dust of fine sand or fly ash with constant average particle
size. (Size: 50m, 40 m,20m,10m).
Prepare about 200g each.
Run the cyclone with pure air at fixed velocity by adjusting the blower value.
Measure the pressure drop,P across the cyclone inlet and outlet in terms of inches of
water.
Now feed the dust particles of one particle size(say 50m) 200g (Wi) at constant rate.
Collect the solid at the solid outlet of the cyclone.
Measure the weight of the collected particles(Wic) and the pressure drop.
Calculate the collection efficiency
Repeat the procedure for all sizes of solid particles.

14
Table
Particle size,
m
Wi,
g
Wic,
g
P,
N/m2
CALCULATIONS:
Collection efficiency = (Wic/Wi) *100
Pressure difference = P =H g (A-B), N/m2
Where, H = Manometer reading =LHS – RHS, (m)
A = Density of manometer fluid (water), kg/m3
B = Density of the air, kg/m3
g = Acceleration due to gravity, m/s
2
15
RESULT:
The performance study was done and collection efficiency was calculated.
Internal Assessment:
Observation(5)
Calculations(10)
Graph & result (5)
Viva(5)
*******

16
Ex.No: Date:
PERFORMANCE EVALUATION OF SCREW CONVEYOR
AIM
To determine conveyance efficiency of the screw conveyor
THEORY
Screw conveyor having helical screws mounted on a shaft is used to convey the
material horizontally and can work upto a slope of 15°. The material held between two
screws (pitch) will be conveyed while in rotation due to helical path taken by the screw.
PROCEDURE
The feed hopper is loaded with grains and the screw conveyor is made to run idle for
5 minutes. The diameter of screw, pitch of the screw, length of the conveyor is measured by
using a measuring tape. The speed (rpm) of the shaft is measured by tachometer. The feed
hopper is opened and material is allowed to convey by the screw. Time taken for collection
known volume of grain is noted at the other end.
FORMULAE
Quantity of material held in one pitch = 6
22
104
wPdD
, kg
Quantity of material conveyed in one hour
(Theoretical capacity,Tc)= 60104 6
22 xNxw
PdD
,kg/h
Actual capacity (Ac) = Wg/t , kg/h
Conveying efficiency of the screw conveyor = )(
)(
c
c
TcapacitylTheoretica
AcapacityActual
where,
D = Diameter of screw in cm
d = Diameter of shaft in cm
P = Pitch of the screw in cm
N = Speed of rotation in rpm

17
ω = Bulk density of grain in kg/m3
OBSERVATIONS
Diameter of the screw (D) = ……………….cm
Diameter of the shaft (d) = ……………….cm
Speed of the screw (N) = ……………….rpm
Pitch of the screw (P) = ……………….cm
Bulk density of the grain (ω) = ……………….kg/m3
Quantity of the grain collected (Wg) = ……………….kg
Time taken(T) = ……………….h
18
RESULT
The conveyance efficiency of the screw conveyor is ----------------------------
Internal Assessment:
Observation(5)
Calculations(10)
Graph & result (5)
Viva(5)
*********

19
Ex.No. Date:
DROP WEIGHT CRUSHER
AIM:
To determine the constants in the following laws of crushing
(a) Rittinger‟s law
(b) Kick‟s law
(c) Bond‟s law
THEORY:
Crushing is a comminution process. During size reduction, feed particles are strained
and distorted to produce a new surface. Since a unit area of solid has a definite amount of
surface energy, the creation of the new surface requires work, which is supplied by the
release of energy of stress when the particles break. The cost of power is a major expense in
crushing. Various theories have been proposed to determine power requirement for size
reduction. Some of the most important of them are Rittinger‟s law,Kick‟s law and Bond‟s
law.
Rittinger’s law: “The work required in crushing a particular feed is proportional to the new
surface created”.
Kick’s law: “The energy required to reduce the size of a feed is proportional to the reduction
ratio”.
Bond’s law: “The energy required to reduce the size of a material from a very large size to a
particular size is proportional to the square root of the surface to volume ratio of the
product”.
PROCEDURE:
The sample of required size was prepared by using proper sieves.
100g of the sample was taken in a cup, covered with a lid and kept at the bottom of
the drop weight crusher.
A 1kg weight was placed at the top of a cylinder and held by a holder handle.
The handle was forced downwards thus releasing the weight to fall on the lid of the
cup kept at the bottom.
The weight was dropped for 20 times.
After 20 drops, the product was taken out and sieved using set of sieves arranged
properly.
The mass of the sample collected on each screen was measured and the readings were
tabulated.
20
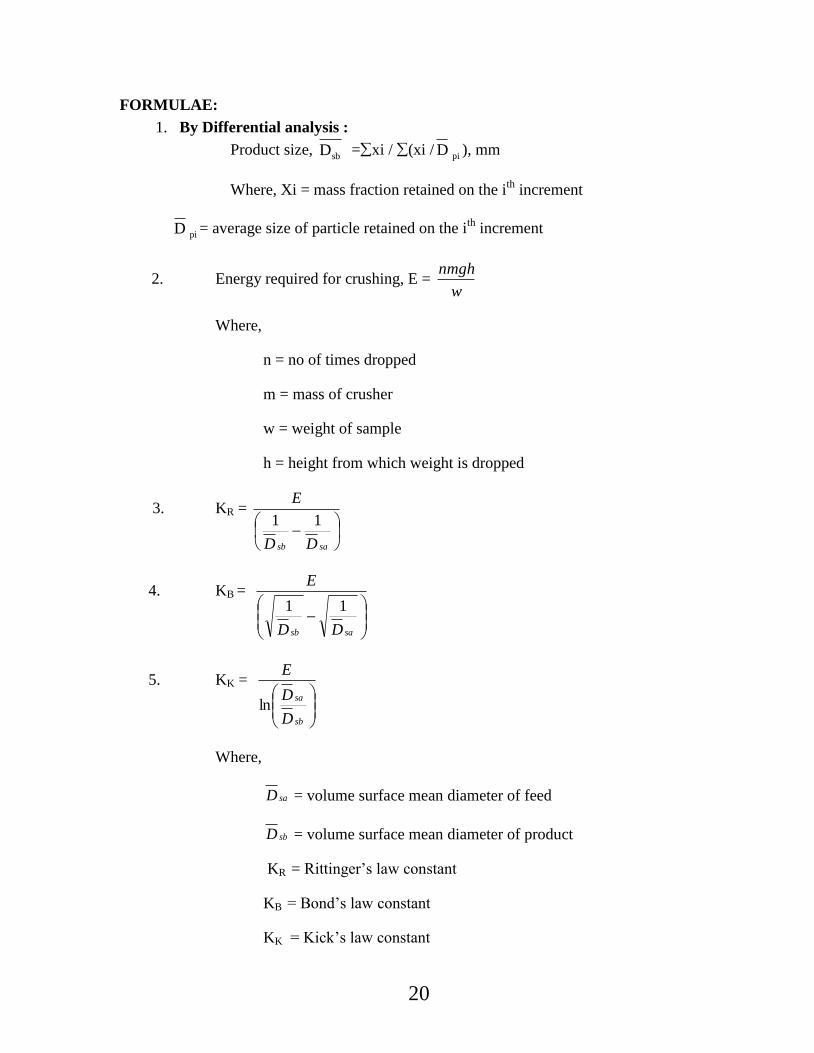
FORMULAE:
1. By Differential analysis :
Product size, sbD =xi / (xi /
piD ), mm
Where, Xi = mass fraction retained on the ith
increment
piD = average size of particle retained on the i
th increment
2. Energy required for crushing, E = w
nmgh
Where,
n = no of times dropped
m = mass of crusher
w = weight of sample
h = height from which weight is dropped
3. KR =
sasb DD
E
11
4. KB =
sasb DD
E
11
5. KK =
sb
sa
D
D
E
ln
Where,
saD = volume surface mean diameter of feed
sbD = volume surface mean diameter of product
KR = Rittinger‟s law constant
KB = Bond‟s law constant
KK = Kick‟s law constant
21
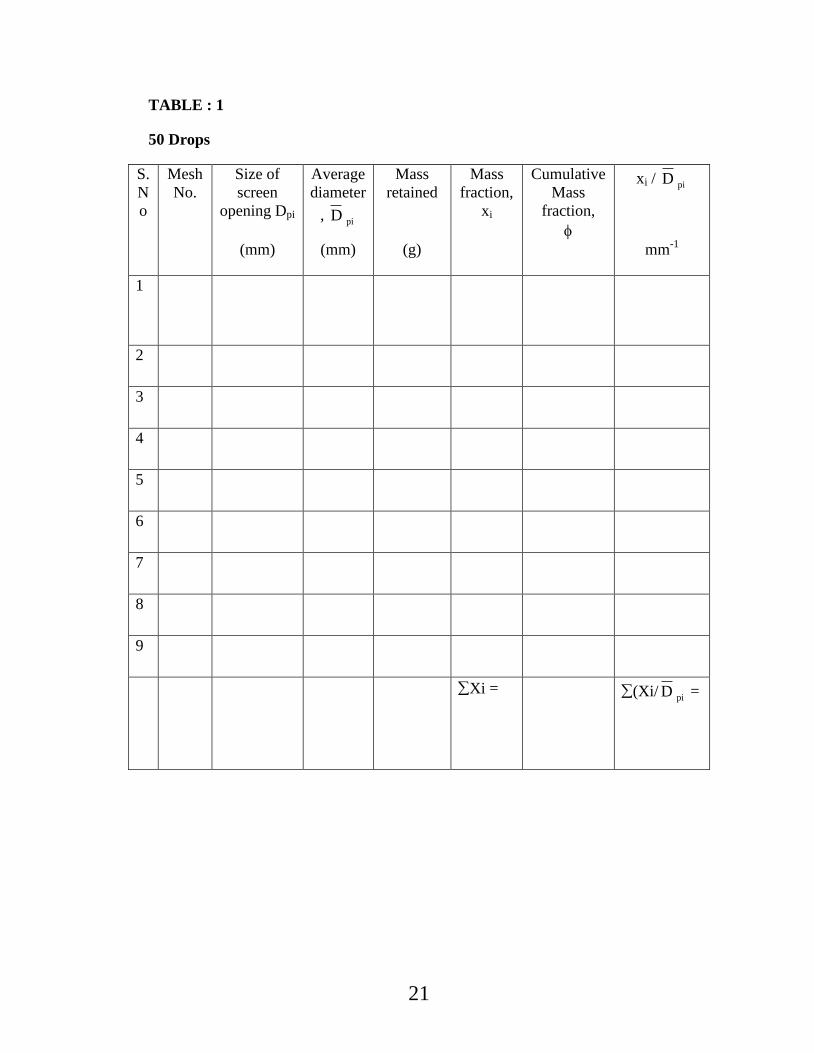
TABLE : 1
50 Drops
S.
N
o
Mesh
No.
Size of
screen
opening Dpi
Average
diameter
, piD
Mass
retained
Mass
fraction,
xi
Cumulative
Mass
fraction,
xi / piD
(mm) (mm) (g) mm-1
1
2
3
4
5
6
7
8
9
Xi = (Xi/ piD =

22
TABLE : 2
100 drops :
S.
N
o
Mesh
No.
Size of
screen
opening Dpi
Average
diameter
, piD
Mass
retained
Mass
fraction,
xi
Cumulative
Mass
fraction,
xi / piD
(mm) (mm) (g) mm-1
1
2
3
4
5
6
7
8
9
Xi = (Xi/ piD =
23
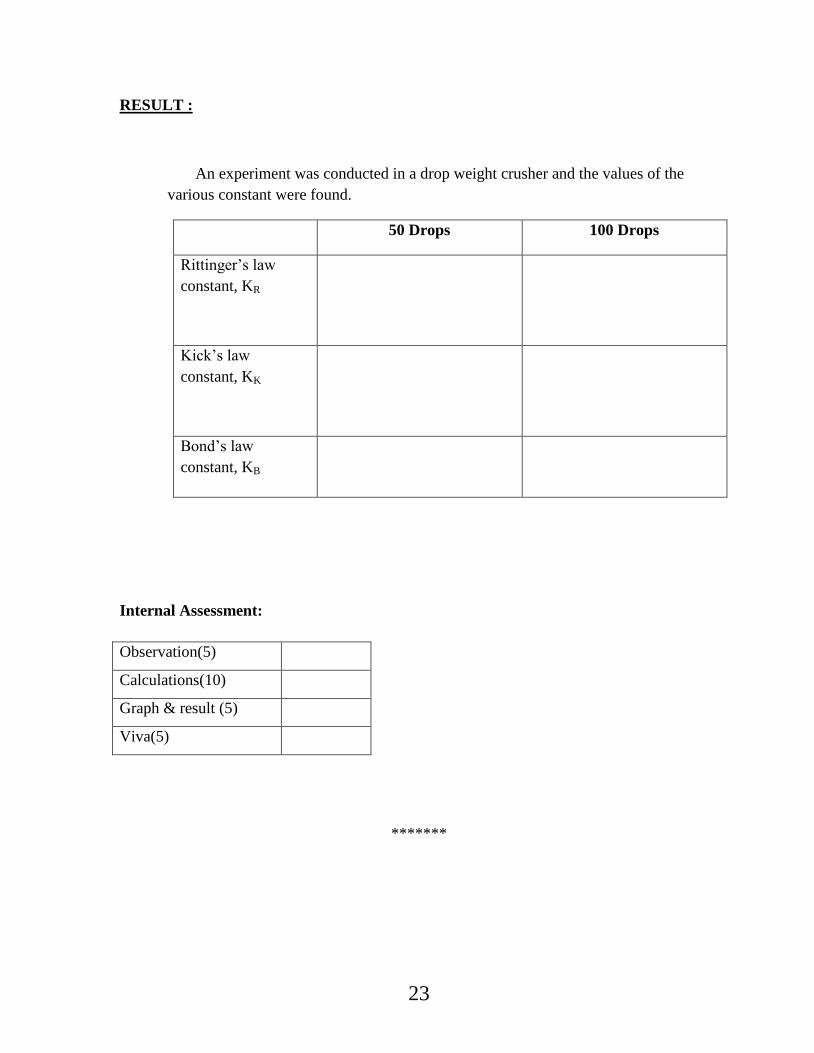
RESULT :
An experiment was conducted in a drop weight crusher and the values of the
various constant were found.
50 Drops 100 Drops
Rittinger‟s law
constant, KR
Kick‟s law
constant, KK
Bond‟s law
constant, KB
Internal Assessment:
Observation(5)
Calculations(10)
Graph & result (5)
Viva(5)
*******
24
Ex. No. Date:
PERFORMANCE CHARACTERISTICS STUDY IN SINGLE STAGE
CENTRIFUGAL PUMP
AIM
To study the characteristics of centrifugal pump at constant speed.
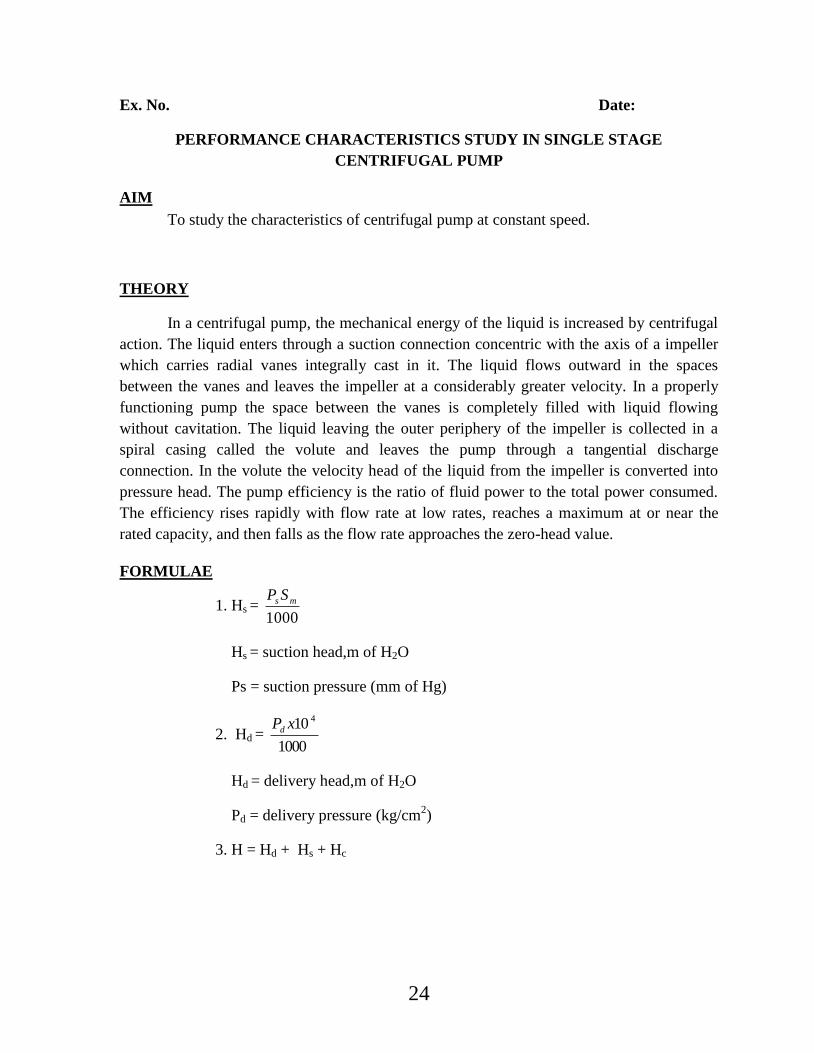
THEORY
In a centrifugal pump, the mechanical energy of the liquid is increased by centrifugal
action. The liquid enters through a suction connection concentric with the axis of a impeller
which carries radial vanes integrally cast in it. The liquid flows outward in the spaces
between the vanes and leaves the impeller at a considerably greater velocity. In a properly
functioning pump the space between the vanes is completely filled with liquid flowing
without cavitation. The liquid leaving the outer periphery of the impeller is collected in a
spiral casing called the volute and leaves the pump through a tangential discharge
connection. In the volute the velocity head of the liquid from the impeller is converted into
pressure head. The pump efficiency is the ratio of fluid power to the total power consumed.
The efficiency rises rapidly with flow rate at low rates, reaches a maximum at or near the
rated capacity, and then falls as the flow rate approaches the zero-head value.
FORMULAE
1. Hs = 1000
ms SP
Hs = suction head,m of H2O
Ps = suction pressure (mm of Hg)
2. Hd = 1000
10 4xPd
Hd = delivery head,m of H2O
Pd = delivery pressure (kg/cm2)
3. H = Hd + Hs + Hc

25
t
LBH
takentime
collected water of volume Q discharge, 4.Actual act
where L = Length of the collection tank,m
B = breadth of the collection tank,m
H = Rise of water in the collection tank,m
t = Time taken for the rise of water,s
5. Output power, Op = 1000
QH
OH of mhead, total
/m Discharge,
2
3
H
sQ
g
6. Input power, Ip = 2
3600
tE
N
c
N = no.of rotations
Ec = energy meter reading rev/kWh
t2 = time for N rotations
7. Overall efficiency, o = P
P
I
O
8. Ns = 4/3
nH
QN
Ns = speed,rpm
N = speed of impeller,rpm
n = no.of stages

26
PROCEDURE
Note the length, breadth, energy meter constant and speed of impeller.
Switch on the motor of the pump
For any desired opening, note the reading.
Close the outlet of tank and note the time taken for 100cm rise of water. Then open
the outlet valve.
Note the time taken for 5 revolutions of energy meter.
Vary the flowrate by keeping delivery valve at different positions.
Repeat the same procedure for 5 different flowrates
Plot H vs Q, Ip vs Q and vs Q.
Characteristic curves of Centrifugal pump:
(a) Head Capacity (b) Power (c) Efficiency

TABLE
Suction
pressure,Ps
(mm Hg)
Discharge
pressure,
Pd
(kgf / cm2)
Time
for
20cm
rise,t
(s)
Time for
5
revolutio
n
(s)
Suction
head,
Hs
(m of
H2O)
Discharg
e head,
Hd
(m of
H2O)
Total
head,
H
(m of
H2O)
Discharge,
(m3/s)
Output
power,
(kW)
Input
power,
(kW)
Overall
efficiency
27

RESULT:
1. Maximum overall efficiency, max = ……………………..
2. Maximum discharge Q max = …………………….,
3. Total Head at max = ……………………..
4. Input power at max = …………………….
5. Critical speed,Ns = ……………………
Internal Assessment:
Observation(5)
Calculations(10)
Graph & result (5)
Viva(5)
*******
28

29
Exp. No. : Date :
PERFORMANCE CHARACTERISTICS STUDY IN RECIPROCATING
PUMP
AIM
To study the performance test of reciprocating pump and its characteristic
curves.
THEORY
Reciprocating pump is a positive displacement pump, which causes a fluid to
move by trapping a fixed amount of it then displacing that trapped volume into the
discharge pipe. The fluid enters the pumping chamber via an inlet valve and its
pushed via an outlet valve by the action of piston or diaphragm. They are single
acting, independent suction and discharge strokes or double acting; suction and
discharge in both directions. Reciprocating pumps are self priming and are suitable
for very high heads at low flows. They deliver reliable discharge flows and is often
for metering duties because of constancy of flow rate. The flow rate is changed
only by adjusting the rpm of the driver. These pumps deliver a highly pulsed flow.
If a smooth flow is required then the discharge flow system has to include
additional features such as accumulators. An automatic relief valve set at a safe
pressure is used on the discharge side of all positive displacement pumps.
PROCEDURE
1. Check the pressure gauges. Make sure both of them show atmospheric pressure.
2. Measure the dimensions of collecting tank.
3. Open the delivery valve fully. Never close this valve below a critical level to
reduce the
Flow rate. The fluid has no place to go and something will break.
4. Start the pump
5. Throttle the gate valve to get the required head.
6. Note down the suction pressure and delivery pressure readings, time taken for n-
(5) revolutions of the energy meter(t) sec, time taken for rise of 10 cm of water
rise in the collecting tank(t) sec.
7. Observe and tabulate for 5 set of readings.

Formulae Used
1. Actual Discharge : Qa =(A× h)/(t)
2. Input Power : Pi = (3600 ×Nr×1000)/(Nc×T)
3. Output power : Po = w× Qa×H
4. Efficiency : η=Po/Pi
where
Qa - Actual discharge, m3/s
A - Area of the tank in m of water, m2
h - Height of water rise for the given time„t‟ in m of water,
t - Time taken for rise of water Pi
- Input power, W
Nr - Number of revolution of energy meter, rpm
Nc - Energy meter constant
T - Time for revolution of energy meter disc
Po - Output power, W
w - Specific weight of water
H - Total head including suction (HS) and delivery(HD),m
η - Efficiency, %
OBSERVATIONS
Length of the collection tank : m
Breadth of the collection tank : m
Height of the collection tank : m
Working fluid :
Area of collecting tank (Length×Breadth) : m2
30

31
Energy meter constant (Nc) : rev/kWh
1mm of Hg =13.6/1000 m of H2O
1kgf/cm2 =10.33 m of H2O

TABLE
S.No.
Suction Head
Delivery Head
Time take for Revolution in
energy meter
(T)
(s)
Total head
Time taken For rise of
water
(s)
Input Power
Pi
(kW)
Output Power
Po
(kW)
Flow rate
Q
(m3/s)
(m3/s)
Efficiency
η
HS
(mm of Hg)
Hs
(m of H2O)
HD
(kgf/cm2)
HD
(m of H2O)
HS+HD
(m of H2O)
1
2
3
4
5
Mean___________________
32

GRAPHS
1. Discharge vs Head
2. Discharge vs Output
3. Discharge vs Efficiency
RESULT
Thus the performance of reciprocating pump is studied and its characteristics curves were
drawn.
Internal Assessment:
Observation(5)
Calculations(10)
Graph & result (5)
Viva(5)
*******
33

34
Ex No. Date:
FLOW MEASUREMENT THROUGH V-NOTCH
AIM
To verify the equation Q=aHn for the given triangular notch and to determine the co-
efficient of discharge.
THEORY
The notch is one of the simplest devices for measuring the flow in open channels. It is
essentially a dam with a notched opening through which the liquid flows. The triangular
notch has a greater practical range of capacity than any other type for a given size. They are
commonly used to measure flow rates in rivers and other open channels. The water flows
over the vertical partition or obstruction of the weir. The depth of the liquid flowing over the
weir is a direct function of the rate of flow. Such devices are very useful for measuring the
flow rates of industrial effluents. Water from the supply line is led into three perforated
compartments which serve to distribute the water evenly and to cut down the balance near the
notch. The last section leads water into a short channel at the end of which a plate notched
out to „triangular‟ shape is bolted. Water which flows over the notch may be collected in a
hopper for direct weighing. The water level in the channel may be observed by using level
indicator. The formula used are
H 2g2
θtan
15
8Q i) 2
5
T
n
act H ii)Q a
Qact = actual discharge, (m3/s)
= angle of notch
H = head of water, (m)
QT = theoretical discharge, (m3/s)

35
PROCEDURE
Note the following system details:
i) Length and breadth of the collection tank
ii) Angle of notch
Switch on the motor of the supply pump.
Open the inlet valve and allow water into notch tank.
Maintain head of water equal to sill of notch.
Note initial head h0 ,from pointer scale of hook gauge.
Allow some additional water into notch tank and maintain constant head of
water above sill of notch.
Adjust screw of the pointer so that pointer head and water surface are kept at the
same level.
Note head of water h, from pointer scale.
Close the outlet valve collection tank and note the time taken for 10cm rise of
water in the piezometer.
FORMULAE
s,H'' ofheight aough water throf collectingfor taken timet
m tank,collecting ofHeight H
m tank,collecting ofBreadth B
m tank,collecting ofLength L
t
LBHQ rate, flow Volumetric i)
c
c
act
H 2g2
θtan
15
8Q i) 2
5
T
g = acceleration due to gravity
= angle of notch
H= head of water, (m)
T
act
dQ
QC discharge, ofefficient -Co iii)

36
iv) From the graph, Qact = a Hn
a = interception on y axis
n = slope of graph
H= head of water, (m)
SPECIFICATIONS
Size of pump = 32 x 25mm
Angle of notch = 45‟‟
Collecting tank size = 50 x 50 cm
MODEL GRAPH
log H
log
Qac
t
slope,n
Intercept,log a
37
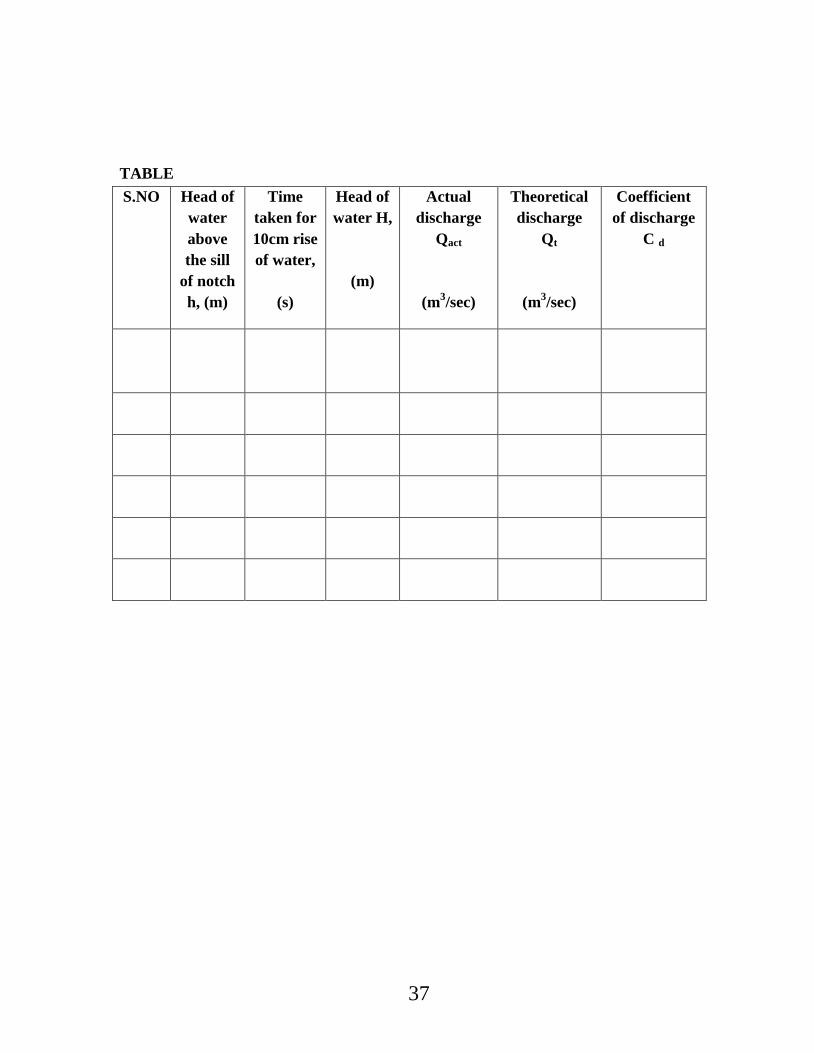
TABLE
S.NO Head of
water
above
the sill
of notch
h, (m)
Time
taken for
10cm rise
of water,
(s)
Head of
water H,
(m)
Actual
discharge
Qact
(m3/sec)
Theoretical
discharge
Qt
(m3/sec)
Coefficient
of discharge
C d

38
RESULT
1) The equation Qact=aHn for the given notch was verified.
2) The Cd for triangular notch was found to be -------------------------------
Internal Assessment:
Observation(5)
Calculations(10)
Graph & result (5)
Viva(5)
*******

39
Ex No. Date:
FLOW THROUGH FITTINGS AND VALVES – SUDDEN EXPANSION
AIM
To calculate the loss factor Ke for sudden expansion.
THEORY
Fluids are usually transported in pipe or tubing, which is circular in cross section
and available in widely varying sizes, wall thickness and materials of construction. The
methods used to join the pieces of pipe depend in part on the properties of the material but
primarily on the thickness of the wall. Thick walled tubular products are usually
connected by screwed fittings, by flanges or by welding. Pieces of thin walled tubing are
joined by soldering or by compression or flare fittings.
A typical processing plant contains thousands of valves of many different sizes
and shapes. Despite the variety in their design, however, all valves have a common
primary purpose; to slow down or stop the flow of a fluid.
Whenever the velocity of fluid is changed, either in direction or magnitude, by a
change in the direction or the size of conduit, friction is generated in addition to the skin
friction. Such friction includes form friction resulting from vortices that develop when the
normal stream lines are disturbed and when boundary layer separation occurs.
If the cross section of the conduit is suddenly enlarged, the fluid stream separates
from the wall and issues as a jet into the enlarged section. The jet then expands to fill the
entire cross section of the larger conduit. The space between the expanding jet and the
conduit wall is filled with fluid in vortex motion characteristic of boundary layer
separation, and considerable friction is generated within this space. The friction loss from
a sudden expansion of cross section is proportional to the velocity head of the fluid in the
small conduit and can be written
2
VK h
2
b
efe
PROCEDURE
Note the following system details:
iii) Length and breadth of the collection tank
iv) Diameter of the pipe
v) Diameter of the enlarged pipe
Switch on the motor of the pump and allow water to flow through the pipe.
Note the manometer reading.
Close the outlet valve of the collection tank.

40
Note the time taken for 10cm rise of water in the collection tank.
Repeat the same procedure for the different flow rates.
FORMULAE
Expansion loss:
f
fmf
F
2
b
a e
2
b
ef
ρ
ρρΔH h
S
Q V
S
S1K
2
VK h
e
μ
ρVD N (iv)
frictiontodueLossh
Ph (v)
levelmanometerinDifference
pressureinDropP
P (iv)
AQ V (iii)
mlevel,in water Rise -H
m tank,collection theofBreadth -B
m tank,collection theoflenght - L
t
LBHQ (ii)
kg/m mercury,ofdensityρ
kg/m water,ofDensity - ρ
m ,differencemanometer - ΔH
water)ofmeter in (drop, pressure ΔH
ΔHρ
ρρΔH i)
fa
Re
fe
c
fe
c
c
a
3
m
3
f
m
f
m
f
fmf
f
m
fmm
R
gR

41
Observation
TABLE
S.No.
Manometer Reading(m) Time for
10cm rise of
water
Qa
aV
NRe Drop in
pressure
Pc
Loss due to
friction hfe
2
aV /2
Left
Right
Difference (s) (m3/s) (m/s) (N/m
2) (J/kg) (m)

42
2
aV /2
hfe
Slope,
Ke
MODEL GRAPH
RESULT
The loss factor Ke for sudden expansion , Ke …………………..
Internal Assessment:
Observation(5)
Calculations(10)
Graph & result (5)
Viva(5)
*******

43
Ex No. Date:
PIPE FRICTION
AIM
To verify Reynold‟s number vs friction relation in a straight circular pipe
THEORY
The flow of fluid is important in many unit operations in chemical engineering. The
handling of liquid is much simpler, much cheaper and less troubles some than handling of
solids. Consequently the chemical engineering handles everything in the form of liquid
solution or suspensions wherever possible. One of the most widely used methods for
transporting fluids are pipes and the losses which arise due to friction etc. are important to
us. Any fluid flowing in contact with a solid surface suffers loss due to friction. For fluid
that flows through pipes, manometer is used for the measurement of pressure drop. A
globe valve is provided on the pipe line by means of which the flow rates of water into
the pipe can be controlled. Water, after flowing in the pipelines, can be collected for
known time interval and the flow rate calculated.
PROCEDURE
The arrangement of the pipe and the manometer connection are studied first. The
manometer is connected for the particular section under study. Air is vented out. The
suitable valves are gradually opened to let into the pipe. Initially the manometer level
must have been adjusted so that they are equal. When condition has become steady, the
flow rate is measured and the manometer readings are noted. The experiment is repeated
for different flow rates and different size of the pipes. Readings are tabulated and the
fanning‟s friction factor is determined using fanning‟s equation as shown below:
2g
V
D
L4fH.Δ
ρ
ρρΔH
2
m
f
fmf
Where ΔHf = Pressure drop
f = fanning‟s friction factor
L = Length of the pipe under observation
V = Average velocity of water in pipe
D = Diameter of the pipe used
44
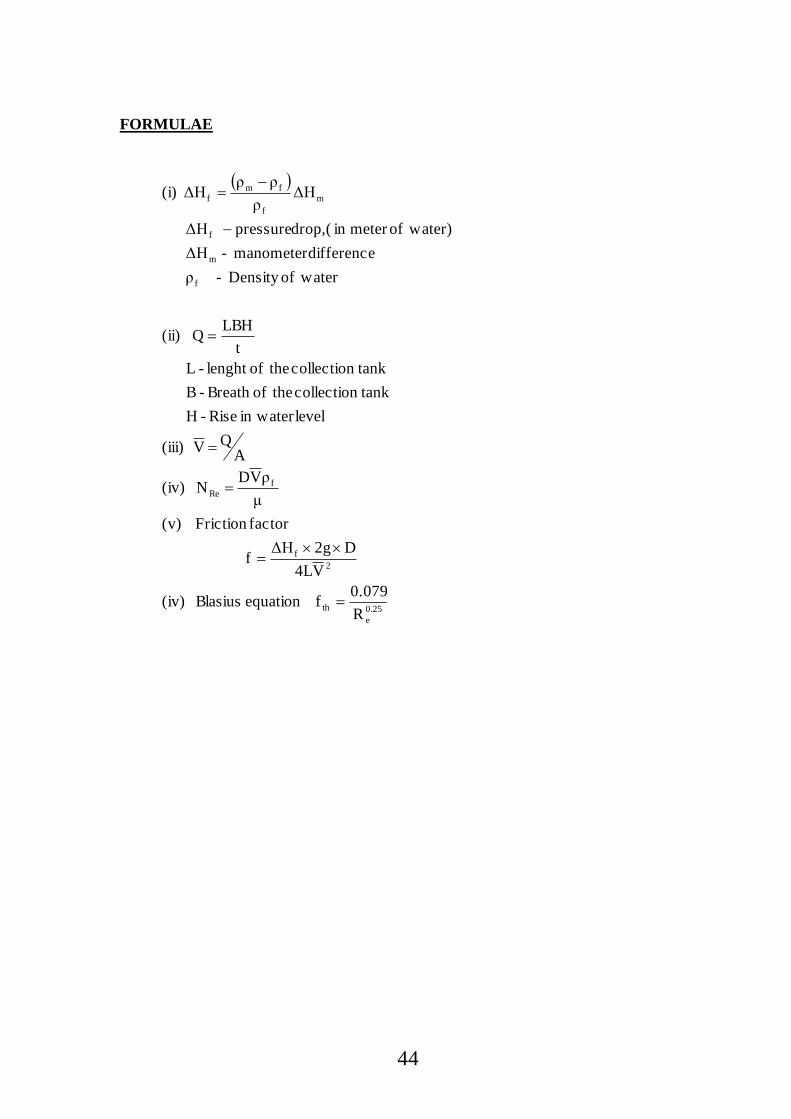
FORMULAE
R
0.079f equation Blasius (iv)
V4L
D2gΔHf
factorFriction (v)
μ
ρVD N (iv)
AQ V (iii)
levelin water Rise -H
tankcollection theofBreath -B
tankcollection theoflenght - L
t
LBHQ (ii)
waterofDensity - ρ
differencemanometer - ΔH
water)ofmeter in (drop, pressure ΔH
ΔHρ
ρρΔH (i)
0.25
e
th
2
f
fRe
f
m
f
m
f
fmf

45
OBSERVATIONS
Table
S.No. Manometer Reading(m) Time for
10cm rise of
water (s)
ΔHf
(m)
Q
(m3/s)
V
(m/s)
NRe f fth
Left Right Difference

MODEL GRAPH
RESULT
The graph between log f vs log NRe was drawn. The relation between Reynolds number
and friction factor was verified.
Internal Assessment:
Observation(5)
Calculations(10)
Graph & result (5)
Viva(5)
*******

47
Ex No. Date:
FLOW THROUGH PACKED BED
AIM
To find the friction factor and NRe,p for flow of water through a packed bed at different
flow rates.
THEORY
Packed bed column is a cylindrical column packed with certain packing material. The
packing can be randomly filled with small objects like Raschig rings or else it can be a
specifically designed structured packing . Several chemical engineering unit operations such
as absorption, adsorption, distillation and extraction are carried out in packed columns. These
packings enhance the surface area available for transfer operations. Packed columns are also
used for heterogeneous catalytic reactions. The packed bed configuration also facilitates the
intimate mixing of fluids with mismatched densities, largely due to increased surface area for
contact.
Flow through a packed bed can be regarded as fluid flow past some number of submerged
objects. When there is no flow through the packed bed, the net gravitational force (including
buoyancy) acts downward. When flow begins upward, friction forces act upward and
counterbalance the net gravitational force. The frictional force can be expressed in terms of a
friction factor. This leads to equations describing the flow of a fluid past a collection of
particles. From a fluid mechanical perspective, the most important issue is that of the
pressure drop required for the liquid or the gas to flow through the column at a specified flow
rate. The pressure losses accompanying the flow of fluids through packed columns are
caused by simultaneous kinetic and viscous energy losses. The essential factors determining
the energy loss, i.e. pressure drop, in packed beds are:
1. Rate of fluid flow
2. Viscosity and density of the fluid
3. Closeness and orientation of packing
4. Size shape and surface of the particles
39

48
In many technical applications, fluids flow through packed bed of solid particles. The smaller
the packing, the larger is the interfacial area for a given volume .In general, the greater the
transfer rate per unit height, the higher is the pressure drop. It is therefore necessary to
balance those factors against one another for a particular application. Channeling is less with
shaped packing. The pressure drop in a column results partly from skin friction and partly
from drag. For the flow of a single fluid through uniform granular solid particles, one can
correlate available data on friction factor Vs a modified Reynolds number.
For Low Reynolds Number {Rep<1}
Kozney – Carman equation:
02
2
22
)1(,
150V
DL
P
ps
For High Reynolds number {Rep>1000}
Burke-Plummer equation:
2
03
ps
V)(1
,DΦ
1.75ρ
L
ΔP
PROCEDURE
The motor is started and water is pumped into the arrangement. The bypass may be
used for better control of flow .
The rate of flow in the tower can be controlled by a valve in the inlet pipe.
The inlet valve is maintained in such a way that level of water in manometric tubes
are equal.
The water is allowed to flow through the packing in the tower. All the air pockets in
the tower and in the manometer are removed.
The distance between the pressure taps is noted as height of the tower(L).
The outlet valve is opened.
Time taken to collect the water is noted.
The flow rate is calculated from the volume of water collected.

49
For every setting of the outlet valve, the flow rate, pressure drop and friction factor
are calculated.
FORMULAE
equationcarmen kozeny
1
Dφ
150μ k 1,n If (iv)
V nlog k log
Vk L
ΔP (v)
)H()H( (vii)
ΔfV2L
gD)H(f (vi)
38f (v)
16
φ.
μ
VρDNnumber sReynold' Particle (iv)
Ld4
π
Volume Void Porasity, (iii)
d4
π
Q
A
QV Velocity (ii)
timetaken
collected water of volumeQ rate, flow Volumetric Actual (i)
3
2
2
P
2
s
o
n
0
expH2O
exp
thH2O
2
PexpH2O
exp
15.0
Re
sP
,Re
2
20
f
f
N
th
th
p
height Bed L
HgΔρρΔP drop Pressure (vii)
equationplummer burke 1
Dφ
1.75ρ k 2,n if
mfm
3
ps
Plot f vs NRe

50
TABLE 1
S.No Height,h1,
m
Height,h2,
m
Time
sec
Volume of water ,
m3
TABLE 2
S.No Volumetric
flow rate Q
(m3/s)
Velocity
(m/s)
NRe f th f exp (H H2O)th
(m)
51
RESULT
f vs NRe plot was made to verify the theoretical equation.
Internal Assessment:
Observation(5)
Calculations(10)
Graph & result (5)
Viva(5)
*******

52
Ex. No. Date:
FLOW THROUGH FLUIDIZED BED
AIM
i) To determine the minimum fluidization velocity V0m and compare with theoretical
value.
ii) To obtain and Vo plot.
THEORY
When a fluid passes upward through a bed of solids, at very low flow rates no relative
movement between the particles takes place, unless the initial orientation is unstable. If a
fluid passes through bed upward, the pressure drop will be the same as for downward flow at
low flow rates, but when the frictional drag on the particles becomes equal to their apparent
weight (actual weight less buoyancy) the particles become rearranged so that they offer less
resistance to the fluid flow and the bed begins to expand. This process continues as the
velocity is increased with the total frictional force equal to the weight of particles unless the
bed has assumed the loosest stable form of packing.
If the velocity is increased still further, the individual particles separate from one
another and become freely supported in the fluid and the bed is said to be „fluidized‟. Further
increase in velocity causes the particles to separate still further from one another and the
pressure difference remains approximately equal to the weight per unit area of the bed. Up to
this stage, the system behaves in a similar way, whether the fluid is a liquid or a gas, but at
high fluid velocities, when the expansion of bed is large, there is a fairly sharp distinction
between the behaviour in the two cases. With a liquid in the bed continues to expand as the
velocity is increased and it maintains its uniform character with the amount of turbulence and
the agitation of particles increasing progressively. This is known as particulate fluidization.
With a gas, however, uniform fluidization is obtained only at relatively low velocities and at
high velocities, two separate phase are formed. These are often referred to as lean and dense
phases and a condition of “aggregative fluidization” is produced.
PROCEDURE
Initial height of the bed is noted.

53
Water is allowed to pass through the bed by opening the inlet valve.
The bed height and Time taken for the collection of water are noted for each flow
rate.
The flow rate is decreased, to measure the final bed height. Now the final bed height
may be greater than the initial value of the fixed bed. Since the particles are not
tightly sealed now.
FORMULAE
1. Pressure drop
p= (ρm-ρf)gHm
where ρm=density of manometeric fluid,kg/m3
ρf=density of fluid, kg/m
3
Hm=height difference in manometer, m
2. Volumetric flow rate, Q= (volume of water collected)/ (time taken),m3/s
3. Velocity=
4
20D
Q
A
QV
, m/s
D = bed diameter,m
4. Reynolds number of particle NRep = f
fPVD
0
Where Dp = Diameter of particle,m
Vo = Velocity , m/s
f = density of fluid, kg/m3
f = viscosity of fluid, kg/m.s
5. mm
L
L 11
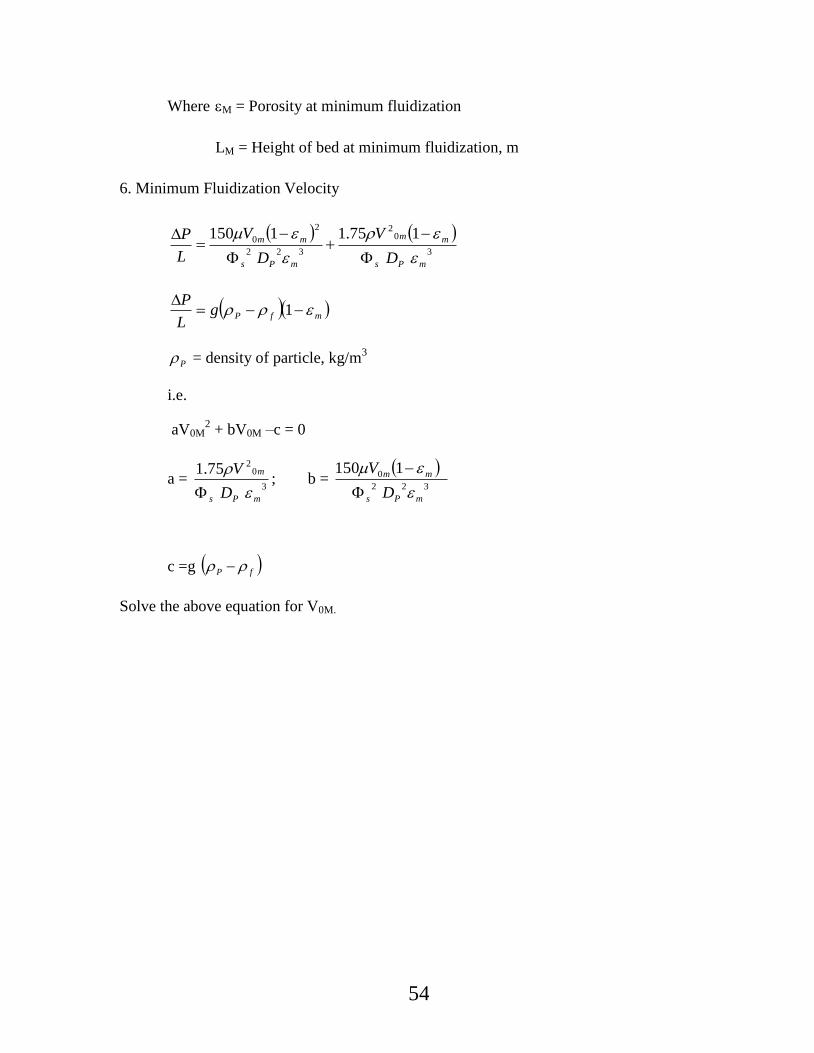
54
Where M = Porosity at minimum fluidization
LM = Height of bed at minimum fluidization, m
6. Minimum Fluidization Velocity
3
02
322
2
0 175.11150
mPs
mm
mPs
mm
D
V
D
V
L
P
mfPgL
P
1
P = density of particle, kg/m3
i.e.
aV0M2 + bV0M –c = 0
a = 3
0275.1
mPs
m
D
V
; b =
322
0 1150
mPs
mm
D
V
c =g fP
Solve the above equation for V0M.

55
GRAPH
TABLE 1
S. NO. Time
taken
(sec)
Bed height,
(m)
Time
taken
(sec)
Bed height,
(m)
Volume of water
(ml)
P

56
TABLE 2
S. No. Porosity, Volumetric Flow rate,
Qm3/s
Velocity,V0
(m/s)
NRep

57
RESULT
The experiment was conducted and P vs V and vs V graphs were plotted. The
minimum fluidization velocity was found to be
1. Theoretically __________ 2. From Graph __________
Internal Assessment:
Observation(5)
Calculations(10)
Graph & result (5)
Viva(5)
*******