department of nutrition, exercise and sports, university of … · department of nutrition,...
TRANSCRIPT

Overview of Milk, Western Diet and Obesity
Department of Nutrition, Exercise and Sports
9 October 2014 Dias 1
Arne AstrupHead, professor, MD, DMSc
Department of Nutrition, Exercise and Sports,University of Copenhagen

Siri-Tarino et al. 2010
Saturated fat for polyunsaturated fat and risk of CHD
1
1
1
1

Jakobsen et al. 2010

Different types of carbohydrates for saturated fat (per 5 E% increments)and risk of CHD
Jakobsen et al. 2010
Program
• Saturated fat and CVD risk• Observational studies• RCT – meta-analysis
09/10/20145

09/10/20146

09/10/20147

09/10/20148
Meta-analyses of RCT -

09/10/20149

09/10/201410

Program
• Dairy and body weight• Observational data• Randomized controlled trials
• Mechanims linking dairy to energy balance and body composition
• Dairy and type 2 diabetes and CVD
09/10/2014 12

Dairy and body weight
Institut for Human Ernæring, Frederiksberg Campus
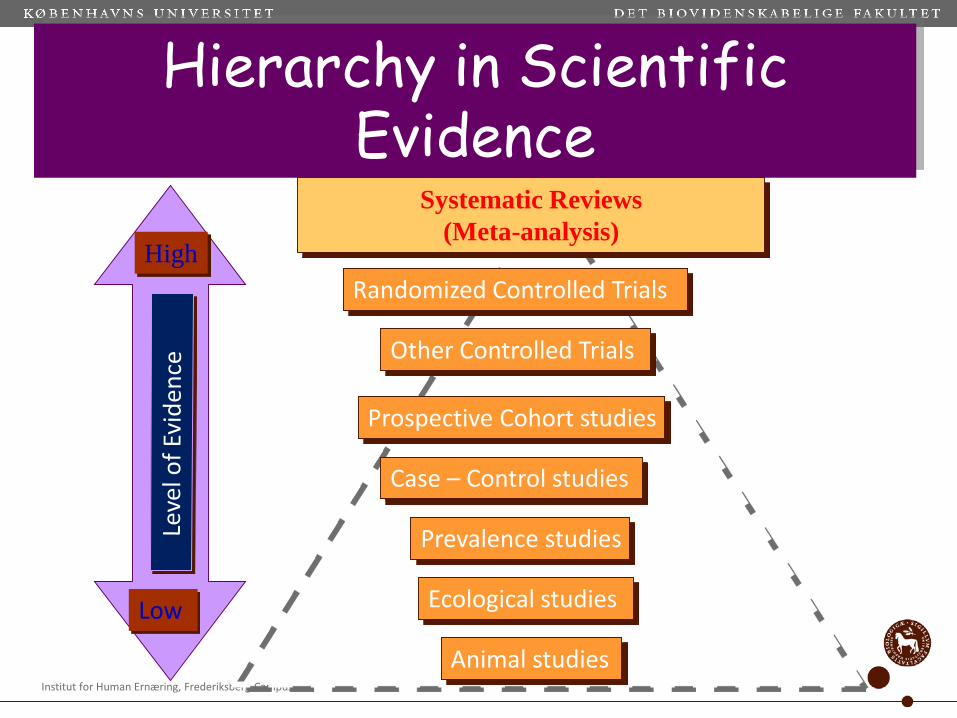
Systematic Reviews(Meta-analysis)
Randomized Controlled Trials
Other Controlled Trials
Prospective Cohort studies
Case – Control studies
High
Low
Hierarchy in Scientific Evidence
Prevalence studies
Ecological studies
Animal studies

Program
• Dairy and body weight• Observational data• Randomized controlled trials
• Mechanims linking dairy to energy balance and body composition
• Dairy and type 2 diabetes and CVD
09/10/2014 15

1609/10/2014
Program
• Dairy and body weight• Observational data• Randomized controlled trials
• Mechanims linking dairy to energy balance and body composition
• Dairy and type 2 diabetes and CVD
09/10/2014 17
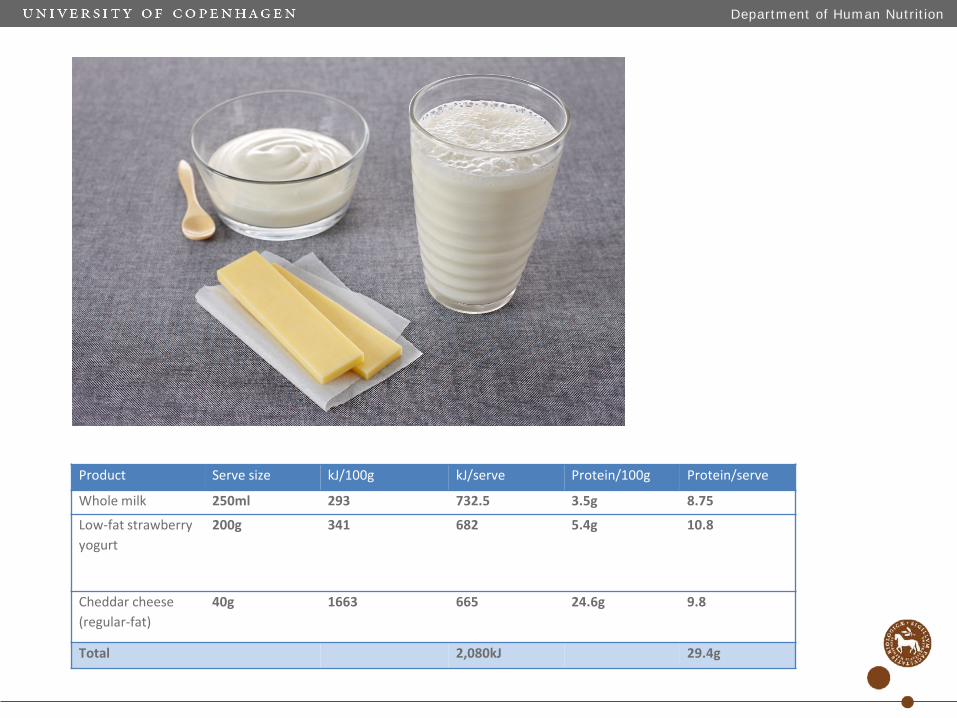
Product Serve size kJ/100g kJ/serve Protein/100g Protein/serve
Whole milk 250ml 293 732.5 3.5g 8.75
Low-fat strawberry yogurt
200g 341 682 5.4g 10.8
Cheddar cheese (regular-fat)
40g 1663 665 24.6g 9.8
Total 2,080kJ 29.4g
Department of Human Nutrition

www.diogenes-eu.org
The Diogenes project
A pan-European programme targeting the obesity problem
Contract no. FP6-2005-513946

Weight loss on 8 week LCD
www.diogenes-eu.org
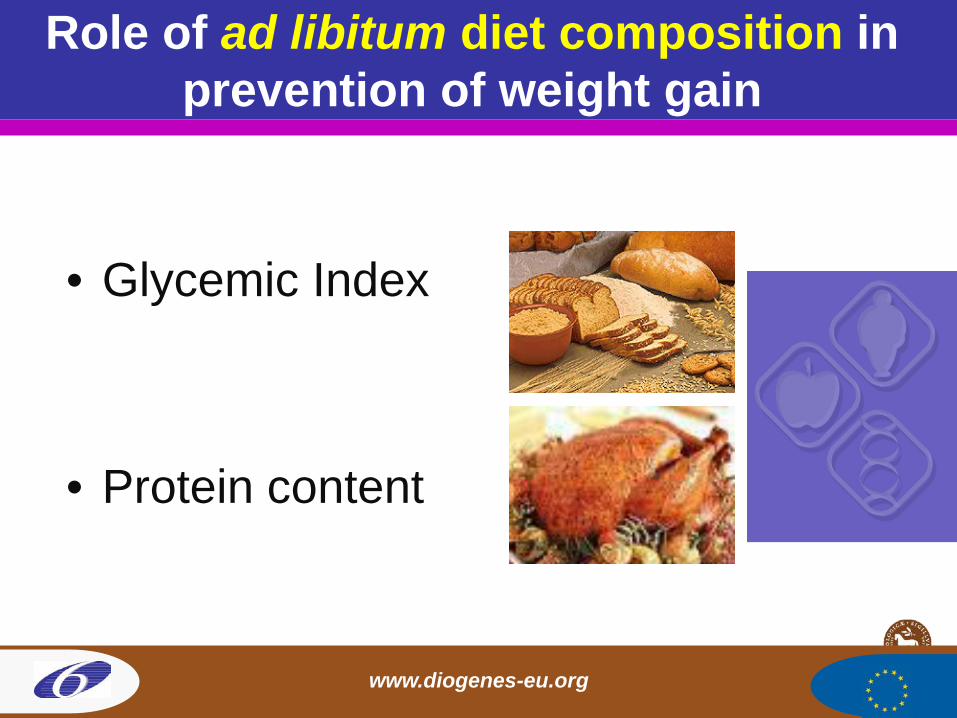
Role of ad libitum diet composition in prevention of weight gain
• Glycemic Index
• Protein content
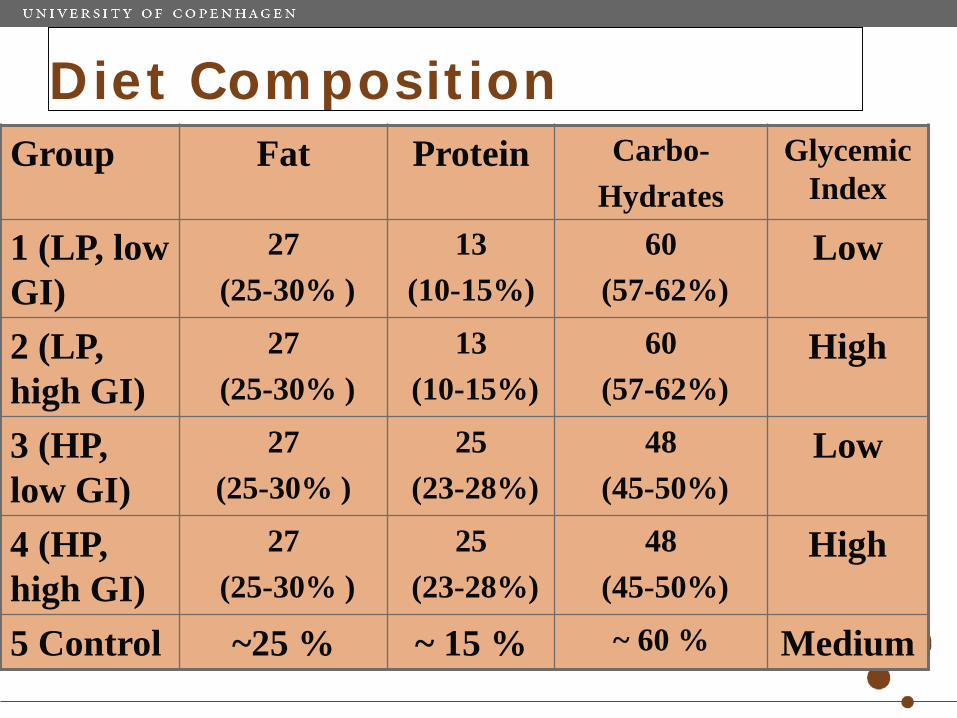
Diet CompositionGroup Fat Protein Carbo-
HydratesGlycemic
Index
1 (LP, low GI)
27(25-30% )
13 (10-15%)
60(57-62%)
Low
2 (LP, high GI)
27(25-30% )
13(10-15%)
60(57-62%)
High
3 (HP, low GI)
27 (25-30% )
25(23-28%)
48(45-50%)
Low
4 (HP, high GI)
27(25-30% )
25(23-28%)
48(45-50%)
High
5 Control ~25 % ~ 15 % ~ 60 % Medium
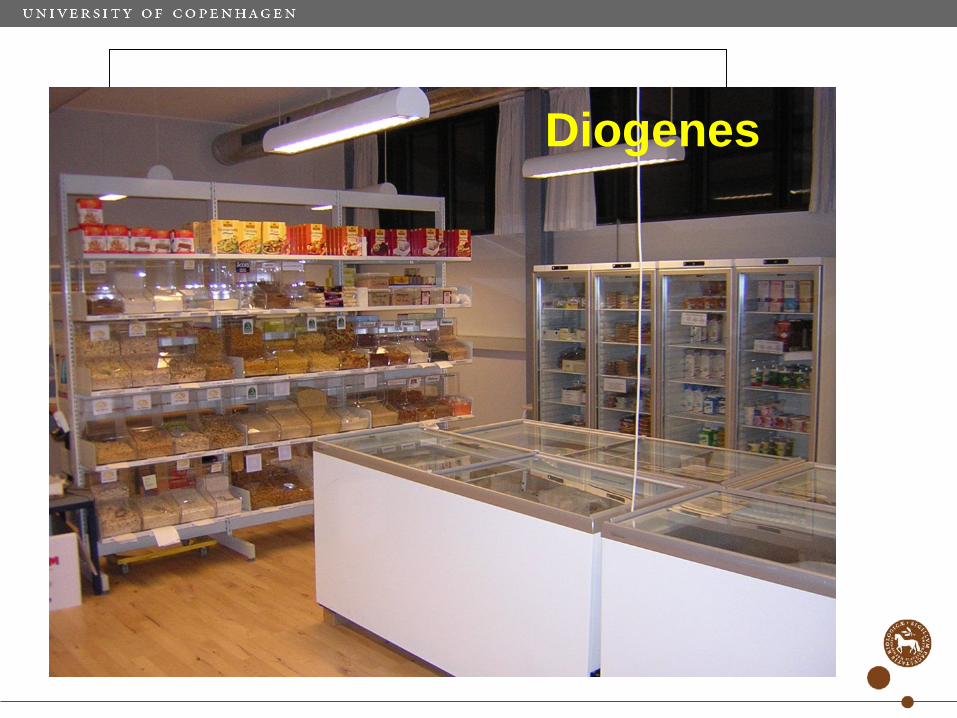
Diogenes

09-10-2014

Patient flow

Compliance to dietary protein intake as assessed by 24 hour urinary nitrogen excretion
FOOD Diaries: All 8 centres: 5.4 E% difference
Pre-LCD

Feb 16. 2009 / SfE Medlemsmøde, KU-LIFE
Completers at Week 26
Larsen TM et al NEJM 201009-10-2014

Major end-point: Drop-out rate
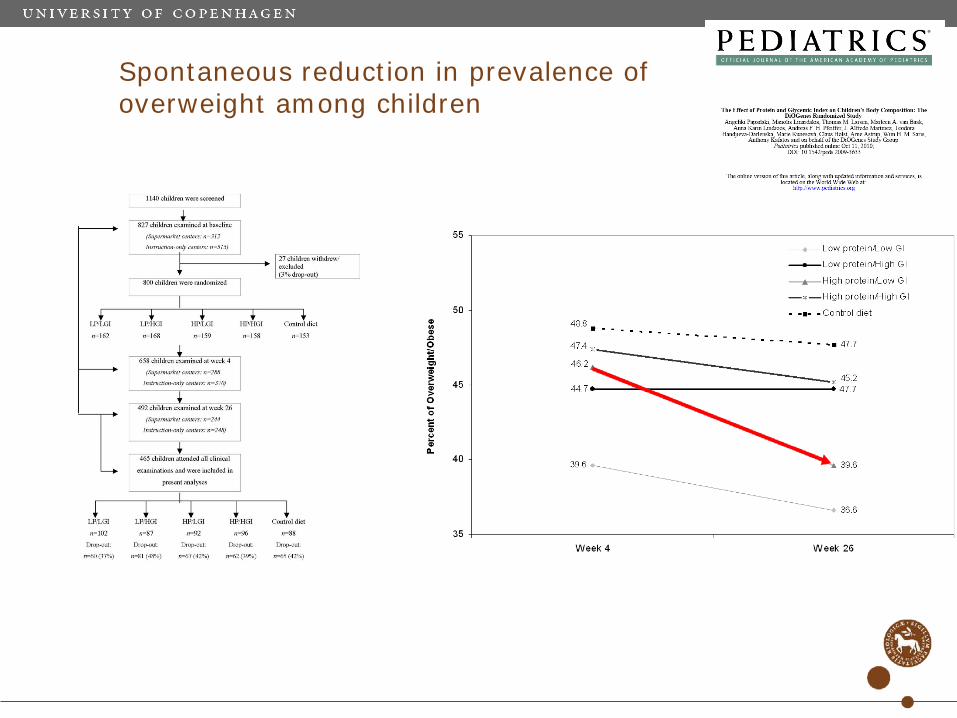
Spontaneous reduction in prevalence of overweight among children
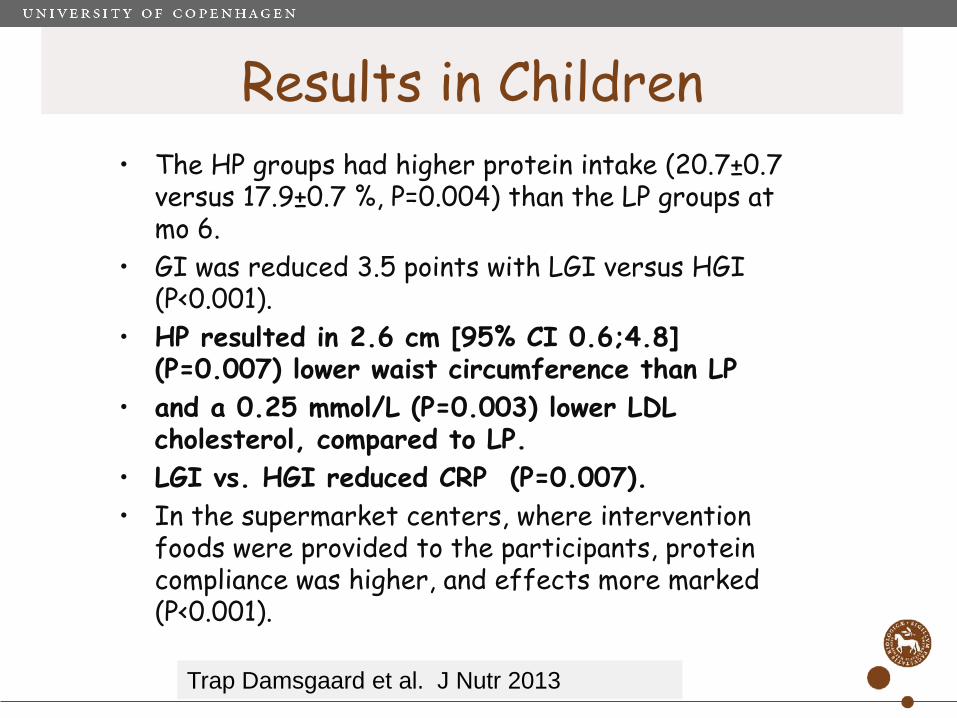
Results in Children• The HP groups had higher protein intake (20.7±0.7
versus 17.9±0.7 %, P=0.004) than the LP groups at mo 6.
• GI was reduced 3.5 points with LGI versus HGI (P<0.001).
• HP resulted in 2.6 cm [95% CI 0.6;4.8] (P=0.007) lower waist circumference than LP
• and a 0.25 mmol/L (P=0.003) lower LDL cholesterol, compared to LP.
• LGI vs. HGI reduced CRP (P=0.007).• In the supermarket centers, where intervention
foods were provided to the participants, protein compliance was higher, and effects more marked (P<0.001).
Trap Damsgaard et al. J Nutr 2013

Program
• Dairy and body weight• Observational data• Randomized controlled trials - drinks
• Mechanims linking dairy to energy balance and body composition
• Dairy and type 2 diabetes and CVD
09/10/2014 31


Program
• Dairy and body weight• Observational data• Randomized controlled trials
• Mechanims linking dairy to energy balance and body composition
• Dairy and type 2 diabetes and CVD
09/10/2014 33

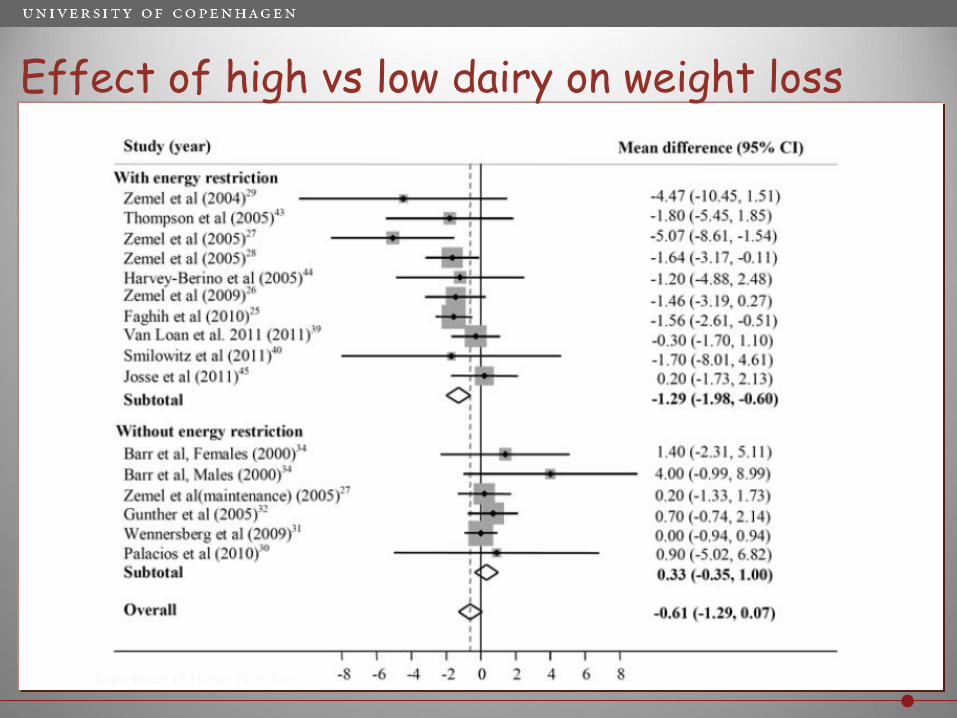
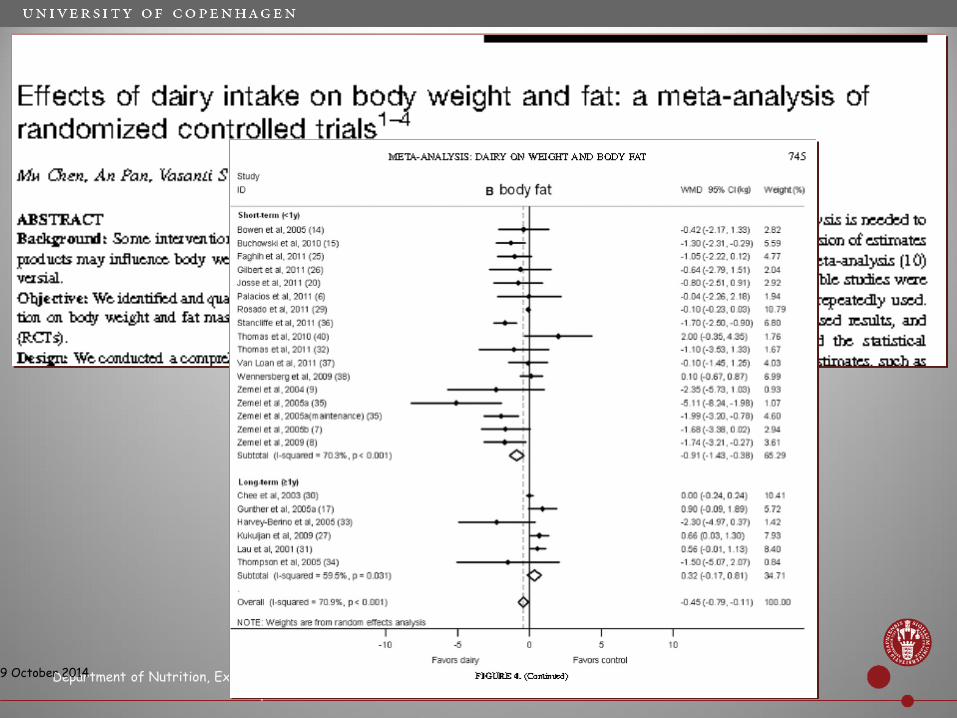
Effect of high vs low dairy on weight loss
Department of Human Nutrition

Effect of high vs low dairy on fat loss
Department of Human Nutrition
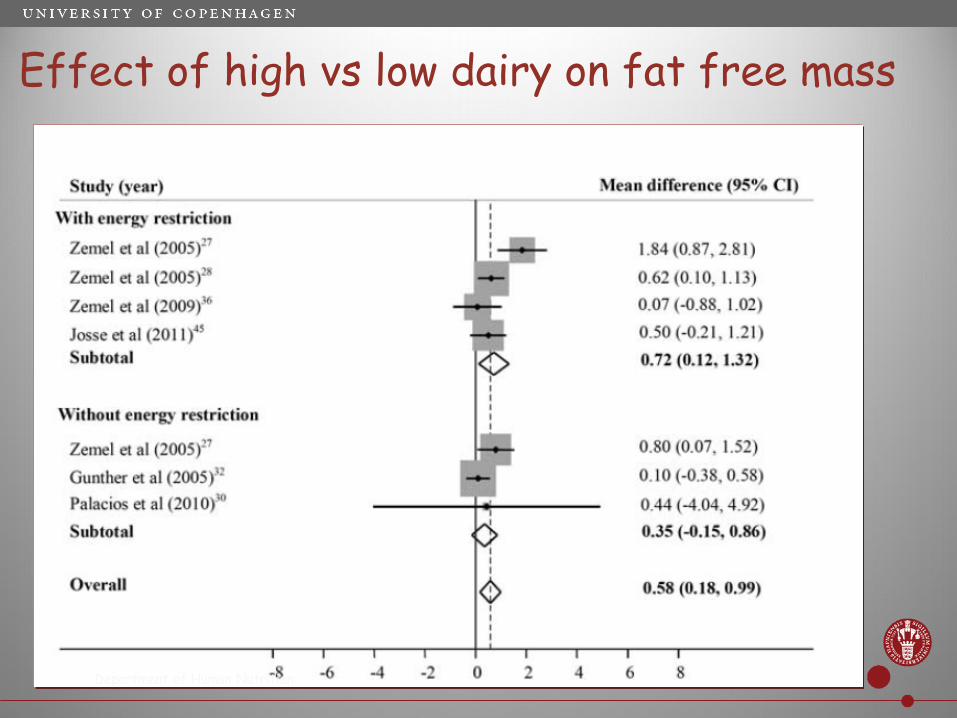
Effect of high vs low dairy on fat free mass
Department of Human Nutrition
Department of Nutrition, Exercise and Sports
9 October 2014 Dias 38

Program
• Dairy and body weight• Observational data• Randomized controlled trials
• Mechanims linking dairy to energy balance and body composition
• Dairy and type 2 diabetes and CVD
09/10/2014 39

Proposed Hierarchy of Satiety
Protein
Carbohydrate
Fat
HIGHGlycemic Index
Sucrose/Fructose
Low Glycemic IndexWhole grain
Fiber
leucine
FACULTY OF SCIENCEDepartment of Nutrition, Exercise and Sports
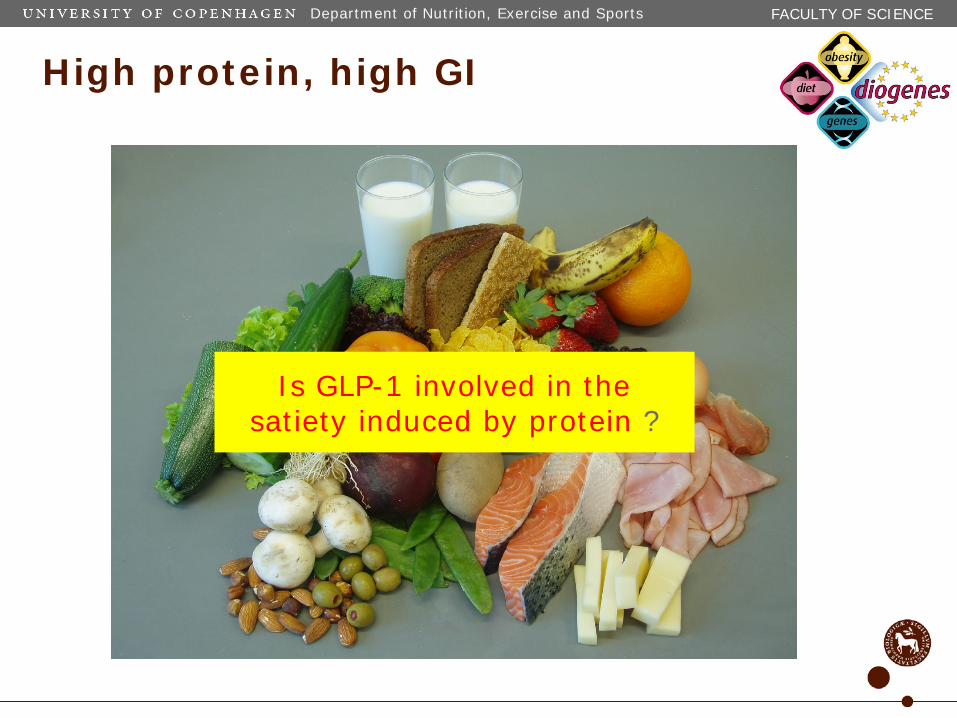
High protein, high GI
Is GLP-1 involved in the satiety induced by protein ?
FACULTY OF SCIENCEDepartment of Nutrition, Exercise and Sports
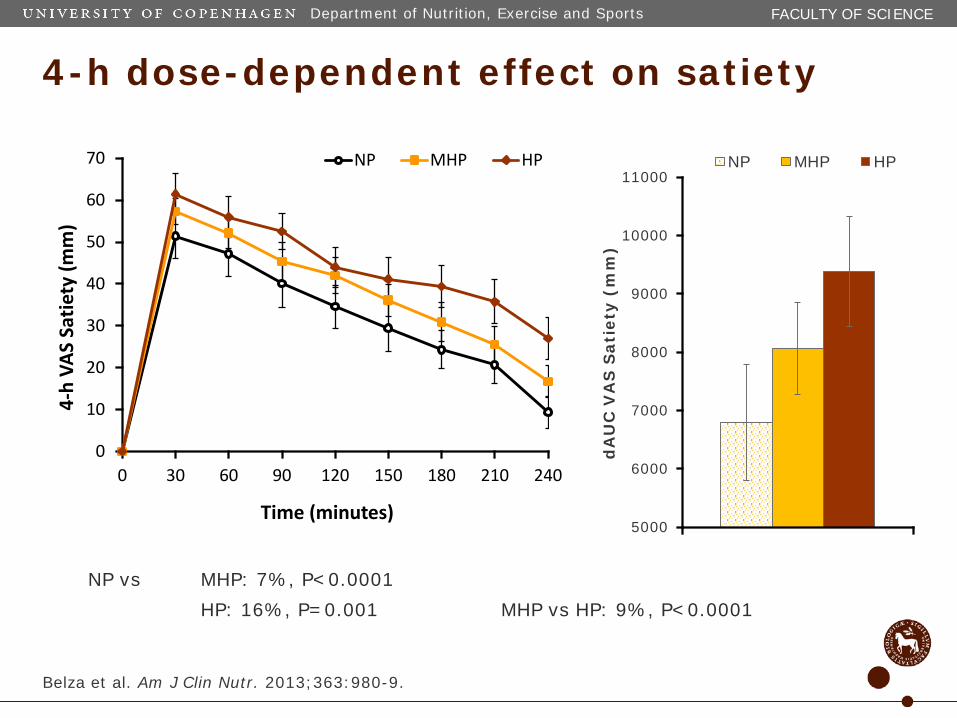
4-h dose-dependent effect on satiety
NP vs MHP: 7%, P<0.0001HP: 16%, P=0.001 MHP vs HP: 9%, P<0.0001
0
10
20
30
40
50
60
70
0 30 60 90 120 150 180 210 240
4-h
VAS
Satie
ty (m
m)
Time (minutes)
NP MHP HP
5000
6000
7000
8000
9000
10000
11000
dA
UC
VA
S S
atie
ty (
mm
)
NP MHP HP
Belza et al. Am J Clin Nutr. 2013;363:980-9.
FACULTY OF SCIENCEDepartment of Nutrition, Exercise and Sports
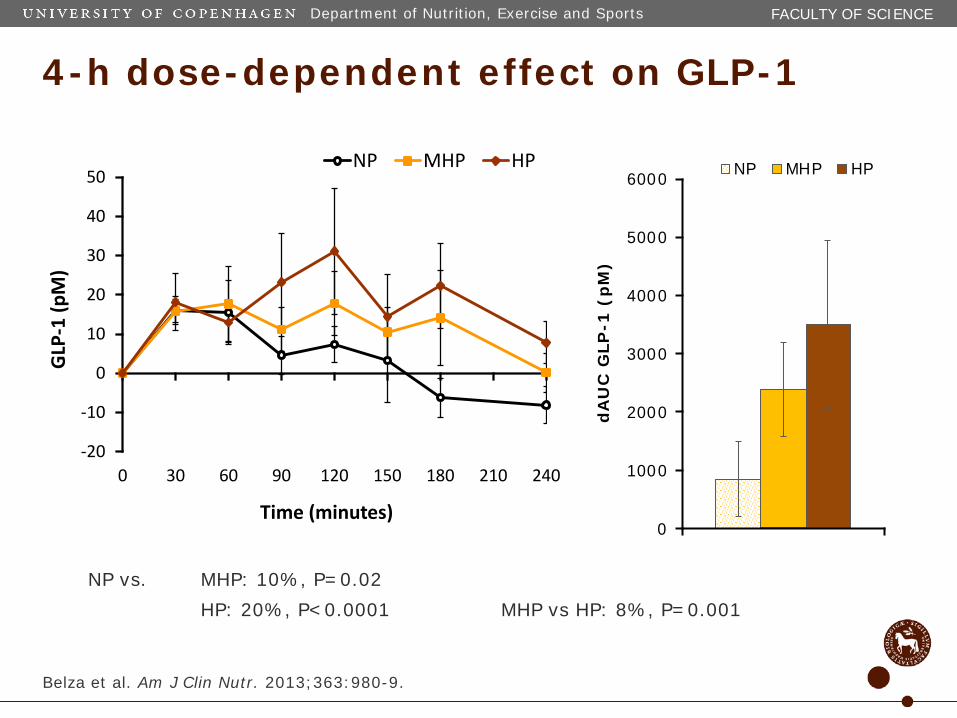
4-h dose-dependent effect on GLP-1
-20
-10
0
10
20
30
40
50
0 30 60 90 120 150 180 210 240
GLP
-1 (p
M)
Time (minutes)
NP MHP HP
0
1000
2000
3000
4000
5000
6000
dA
UC
GLP
-1 (
pM
)
NP MHP HP
NP vs. MHP: 10%, P=0.02HP: 20%, P<0.0001 MHP vs HP: 8%, P=0.001
Belza et al. Am J Clin Nutr. 2013;363:980-9.

Dairy Calcium reduces fat absorption
Change in chylomicron-TG
00,2
0,40,6
0,81
1,21,4
0 100 200 300 400 500
LCMCHC
n=13Lorenzen JK, Astrup A. Am. J. Clin. Nutr. (2007)
Department of Nutrition, Exercise and Sports
9 October 2014Dias 45
Department of Nutrition, Exercise and Sports
9 October 2014Dias 46
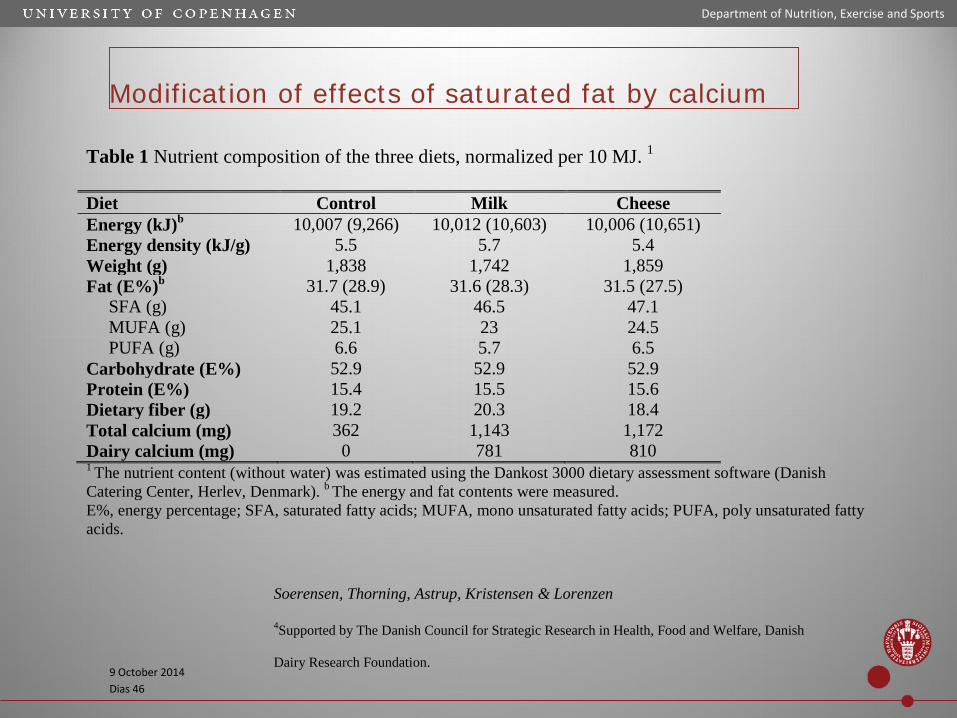
Table 1 Nutrient composition of the three diets, normalized per 10 MJ. 1
Diet Control Milk Cheese Energy (kJ)b 10,007 (9,266) 10,012 (10,603) 10,006 (10,651) Energy density (kJ/g) 5.5 5.7 5.4 Weight (g) 1,838 1,742 1,859 Fat (E%)b 31.7 (28.9) 31.6 (28.3) 31.5 (27.5) SFA (g) MUFA (g) PUFA (g)
45.1 25.1 6.6
46.5 23 5.7
47.1 24.5 6.5
Carbohydrate (E%) 52.9 52.9 52.9 Protein (E%) 15.4 15.5 15.6 Dietary fiber (g) 19.2 20.3 18.4 Total calcium (mg) Dairy calcium (mg)
362 0
1,143 781
1,172 810
1 The nutrient content (without water) was estimated using the Dankost 3000 dietary assessment software (Danish Catering Center, Herlev, Denmark). b The energy and fat contents were measured. E%, energy percentage; SFA, saturated fatty acids; MUFA, mono unsaturated fatty acids; PUFA, poly unsaturated fatty acids.
Modification of effects of saturated fat by calcium
4Supported by The Danish Council for Strategic Research in Health, Food and Welfare, Danish
Dairy Research Foundation.
Soerensen, Thorning, Astrup, Kristensen & Lorenzen
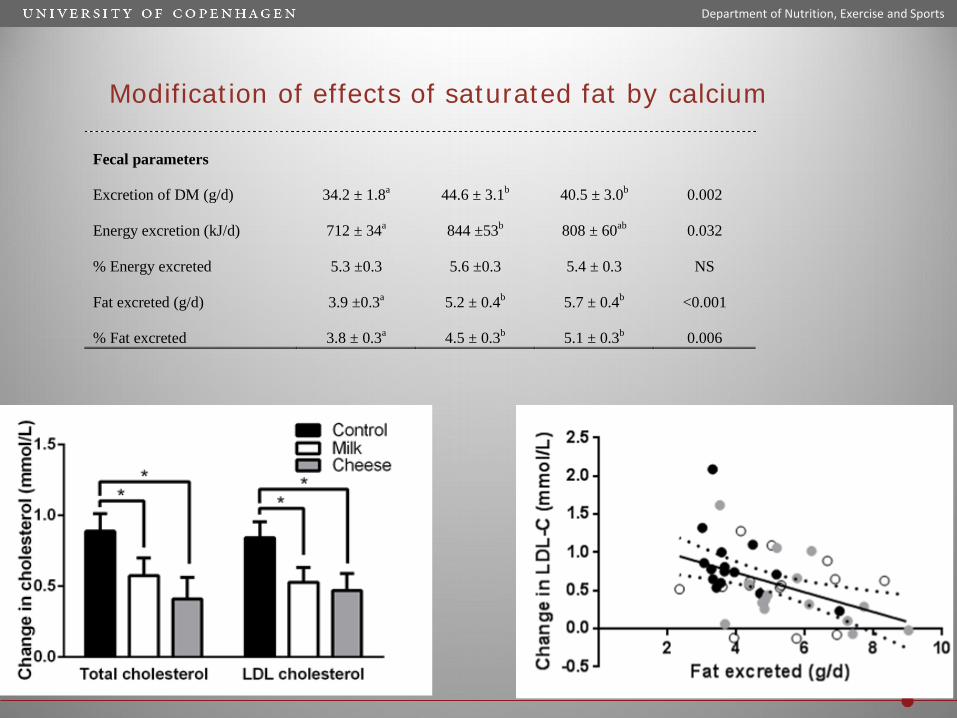
Modification of effects of saturated fat by calcium
Department of Nutrition, Exercise and Sports
9 October 2014Dias 47
Fecal parameters Excretion of DM (g/d) 34.2 ± 1.8a 44.6 ± 3.1b 40.5 ± 3.0b 0.002 Energy excretion (kJ/d) 712 ± 34a 844 ±53b 808 ± 60ab 0.032 % Energy excreted 5.3 ±0.3 5.6 ±0.3 5.4 ± 0.3 NS Fat excreted (g/d) 3.9 ±0.3a 5.2 ± 0.4b 5.7 ± 0.4b <0.001 % Fat excreted 3.8 ± 0.3a 4.5 ± 0.3b 5.1 ± 0.3b 0.006

Department of Nutrition, Exercise and Sports
9 October 2014Dias 48

Human Study
Department of Nutrition, Exercise and Sports
9 October 2014Dias 49

Department of Nutrition, Exercise and Sports
9 October 2014Dias 50

Cheese intake lowers diabetes risk

09/10/201452

Evidence based information ?

Conclusionso Intake of dairy is inversely associated with body fat in
observational studies, and there is no difference between highversus low-fat dairy
o Randomized controlled trials of dairy clearly show that dairyhelps to maintain a healthy body weight and a optimal bodycomposition i.e. preserving lean body mass and reducing fat mass.
o Milk possesses health benefits compared to sugar-rich soft drinks – both for weight control and diabetes risk.
o The beneficial effects of dairy on body weight and composition is linked to the high protein and calcium contents – but the foodmatrix possesses more magic
o The effect of dairy on body composition, and the positive effect of dairy fatty acid profile on T2D and CVD makes dairy an essentialpart of a healthy diet to prevent and treat obesity, sarcopenia, type 2 diabetes and cardiovascular disease.
Department of Nutrition, Exercise and Sports
9 October 2014Dias 54