department of medical sciences university of milan, italy endocrinology and diabetology unit...
TRANSCRIPT

Department of Medical SciencesUniversity of Milan, Italy
Endocrinology and Diabetology Unit Fondazione Policlinico IRCCS
Milan, Italy
Paolo Beck-Peccoz
TSH-secreting pituitary adenomas

0
50
100
150
200
PureTSH-omas
GH PRL FSH/LH
72.2%
16.0%10.4%
1.4%
Nu
mb
er o
f ca
ses
TSH-omas mixed tumorBeck-Peccoz et al., Endocrine Reviews 1996;17:610–638.
Classification of TSH-secreting pituitary tumors

Euthyroid
Thyroid
Peripheral
tissue
Pituitary
TSH
T3T4
Hypothalamus
TRH
RTH
Peripheral
tissue
Pituitary
TSH
T3T4
TRH
Hypothalamus
Thyroid
Hyperthyroid
Peripheral
tissue
Pituitary
TSH
T3T4
TRH
Hypothalamus
Thyroid
& TSH-oma


Positive MRI in RTH patients
9 out of 22 (40%) patients with RTH showed the presence of a pituitary lesion at MRI/CT scan
Pituitary incidentaloma diagnosed in 8 cases
Possible association between RTH and TSH-omawas suspected, but not yet proved, in only one 62-yr-old woman
Nevertheless, the prevalence of pituitary incidentaloma appears higher in RTH patients (40%) than in the general population (20-30%)

Central Hyperthyroidism: serum levels of TSH and FT4Central Hyperthyroidism: serum levels of TSH and FT4
TSH mU/LTSH mU/L
Ser
um
FT
4 p
mol
/LS
eru
m F
T4
pm
ol/L
0.10.1 11 10101818
2727
3636
4545
5454
6363
RTH (n=59)TSH-omas (n=13)

CIRCULATING FACTORS MAY INTERFERE WITH MEASUREMENT OF TSH OR TOTAL AND FREE THYROID HORMONES
OVERESTIMATION OF SERUM LEVELS
CENTRAL HYPERTHYROIDISM?
Heterophylic Ab directed against mouse -globulins: interference
with monoclonal Ab used in the IRMA Anti-TSH Ab or Ab cross-reacting
with TSH
Anti-T4 and/oranti-T3 Ab
Abnormal forms of albuminor transthyretin (FDH)

DIFFERENTIAL DIAGNOSIS BETWEENTSH-OMAS AND RTH
•Age (years) 11-84 0.1-80 NS•Sex (F/M ratio) 1.28 1.17 NS•TSH mU/L 2.7±0.6 2.2±0.3 NS•FT4 pmol/L 40.0±4.2 29.5±2.5 NS•FT3 pmol/L 14.5±1.4 11.7±1.0 NS•SHBG nmol/L 113.0±17.2 62.0±4.0 <0.0001•Familial cases 0% 81% <0.0001•Lesions at CT scan or MRI 98% 10% <0.0001•High -subunit levels 65% 2% <0.0001•High -subunit/TSH m.r. 81% 2% <0.0001•Abnormal TSH response to TRH test 83% 4% <0.0001•Abnormal TSH response to T3 suppression test 100% 100% NS
PARAMETER TSH-omas RTH P

TSH biological activity in various thyroid disorders
RTHTSHomas
0
1
2
3
4
5
Cir
cula
tin
g T
SH
B/I
Persani et al., J Clin Endocrinol Metab. 1994; 78:1034–1039.

Net increments after TRH injection in RTHNet increments after TRH injection in RTH
FT4FT400
55
1010
1515
2020
pm
ol/L
pm
ol/L
**
FT3FT300
2.52.5
55
7.57.5
1010
pm
ol/L
pm
ol/L
**
TSHTSH00
1010
2020
3030
mU
/Lm
U/L
ControlsControls
RTHRTH* * PP<0.01 <0.01 vsvs controlscontrols
Beck-Peccoz&Persani, Eur J Endocrinol, 1994; 131:331-340

DIFFERENTIAL DIAGNOSIS BETWEENTSH-OMAS AND RTH
•Age (years) 11-84 0.1-80 NS•Sex (F/M ratio) 1.28 1.17 NS•TSH mU/L 2.7±0.6 2.2±0.3 NS•FT4 pmol/L 40.0±4.2 29.5±2.5 NS•FT3 pmol/L 14.5±1.4 11.7±1.0 NS•SHBG nmol/L 113.0±17.2 62.0±4.0 <0.0001•Familial cases 0% 81% <0.0001•Lesions at CT scan or MRI 98% 10% <0.0001•High -subunit levels 65% 2% <0.0001•High -subunit/TSH m.r. 81% 2% <0.0001•Abnormal TSH response to TRH test 83% 4% <0.0001•Abnormal TSH response to T3 suppression test 100% 100% NS
PARAMETER TSH-omas RTH P


Acute somatostatin analog injectionAcute somatostatin analog injection
-50-50
-25-25
Var
iati
ons
(% o
f b
asal
val
ues
)V
aria
tion
s (%
of
bas
al v
alu
es)
+25+25
00
+50+50 TSHTSH FT4FT4 FT3FT3
RTHRTH
TSH-omasTSH-omas
Mannavola et al., Clin Endocrinol 2005; 62: 176-181

2-3 months somatostatin analog administration2-3 months somatostatin analog administration
-50-50
-25-25
Var
iati
ons
(% o
f b
asal
val
ues
)V
aria
tion
s (%
of
bas
al v
alu
es)
+25+25
00
+50+50TSHTSH FT4FT4 FT3FT3
RTHRTH TSH-omasTSH-omas
Mannavola et al., Clin Endocrinol 2005; 62: 176-181

In summary:
normalelevated SHBG and -sub
negativepositive Imaging
NO YESFamily members
YESNO
YESNO
YESNO
TRH test
T3-suppression test
TRH test post T3
TRNO Molecular study
FT3 & FT4 two step
or TSH Ultrasensitive methods
TSH-oma
RTH

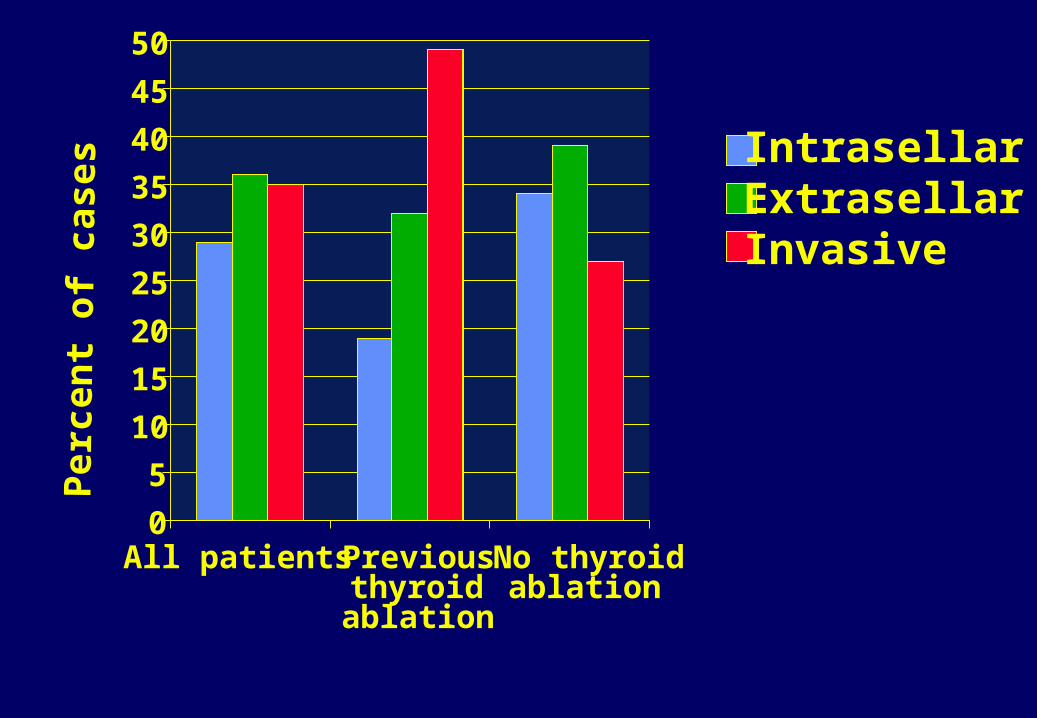
0
5
10
15
20
25
30
35
40
45
50
All patients Previousthyroidablation
No thyroidablation
Per
cen
t of
cas
es
IntrasellarExtrasellarInvasive

Different therapeutical approaches
• None• TH analogsTRIAC, DT4,
GC1 (binds wtTR>TR), HY1 (acts on TR mut
R320C)• Cardiac selective blockers• Inhibition of mutant gene
expression
• Neurosurgery
• Radiotherapy
• SRIH analogsOctreotideLanreotideSOM 230
RTH TSH-oma

Reduction of tumor mass
• complete 34% 29% 0%
• partial 34% 40% 51%
• absent 32% 31% 49%
Resolution of clinical symptoms
• yes 57% 62% 95%
• no 43% 38% 5%
Surgery Surgery +Rx SMS analogs (n=125) (n=57) (n=84)
TSH producing adenomas: results ofdifferent therapeutic approaches

0.1
1
10
1 2 3 4 5 6 7 8 9 10 11 12 13 14
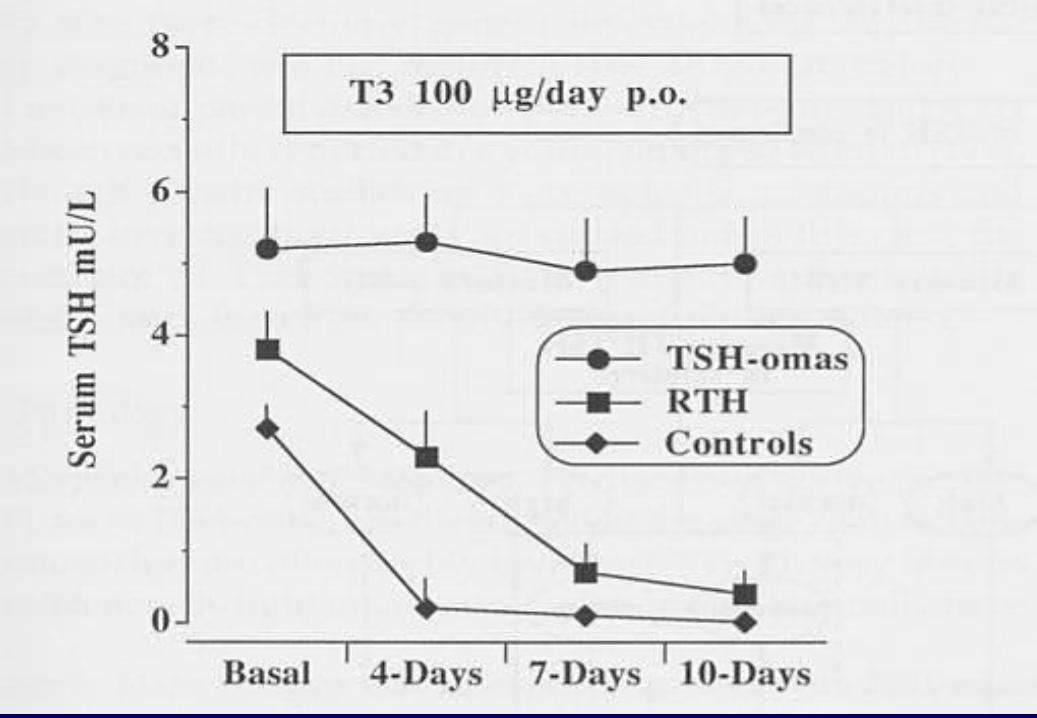
T3 suppression test
Baseline
T3 suppression test
Baseline
Patients withintact thyroid
Patients withthyroid ablation
Case #
Before neurosurgery After neurosurgery
Se
rum
TS
H m
U/L

Results of chronic somatostatin analog treatmentof TSH-secreting pituitary adenomas
TSH/-GSU reduction 92% Thyroid hormone normalization 95% Vision improvement 75% Tumor mass shrinkage 52% True resistance 4% Discontinuation due to side effects 10%

00
55
1010
1515
2020
2525
3030
3535
4040
00 22 44 66 1212 2424
TSHTSHa-GSUa-GSU
FT4FT4
FT3FT3GHGH
MonthsMonths
Hor
mon
e le
vels
Hor
mon
e le
vels
Hormone levels after somatostatin analog Hormone levels after somatostatin analog in one patient with mixed GH/TSH adenomain one patient with mixed GH/TSH adenoma
IGF-I normalizedafter 2 months

ACKNOWLEDGEMENTS
Luca Persani Deborah Mannavola
Irene CampiLaura Fugazzola Guia VannucchiMarco Bonomi Andrea LaniaSabrina CorbettaGiovanna MantovaniCarmela Asteria
Krishna ChatterjeeSamuel RefetoffAnna Spada