department of land information department of land ... · 220 st georges terrace ... • form...
TRANSCRIPT

20
04
/05
Annual Report
creativity
celebration
sustainability
community
excellence
growth & learning
Department of Land InformationDepartment of Land Information

Hon John Bowler MLA Minister for Local Government and Regional Development; Land Information; Goldfields-Esperance; Great Southern In accordance with Section 62 of the Financial Administration and Audit Act 1985, I hereby submit for your information and presentation to Parliament, the Annual Report of the Department of Land Information for the year ended 30 June 2005. The report has been prepared in accordance with the provisions of the Financial Administration and Audit Act 1985. Grahame Searle Chief Executive 31 August 2005

Department of Land Information Annual Report 2004/2005 2
This Annual Report for the Department of Land Information (DLI) is available at the Department of Land Information’s website at www.dli.wa.gov.au Strategic Planning Framework: Better Planning: Better Services, A Strategic Planning Framework for the Western Australian Public Sector Department of the Premier and Cabinet http://www.dpc.wa.gov.au/psmd/pubs/psrd/spfnov2.pdf Location: Metropolitan Offices Head Office Midland Square MIDLAND 6056 Postal Address: PO Box 2222 MIDLAND 6936 Telephone: (08) 9273 7373 Facsimile: (08) 9273 7666 TTY (telephone for people with hearing impairment): (08) 9273 7571 E-mail: [email protected] DLI website address: http://www.dli.wa.gov.au DLI’s gateway to land and property information: http//www.landgate.com.au. WALIS website address: http://www.walis.wa.gov.au WALIS e-mail: [email protected] Valuation Services 18 Mount Street PERTH 6000 Postal Address: PO Box 7201 Cloisters Square PERTH 6850 Telephone: (08) 94298400 Facsimile: (08) 94298500 E-mail: [email protected] Perth Branch Office Mount Newman House Cloisters Square 220 St Georges Terrace PERTH 6000

Department of Land Information Annual Report 2004/2005 3
Satellite Remote Sensing Services Leeuwin Centre for Earth Sensing Technologies 65 Brockway Road FLOREAT 6014 Telephone: (08) 9387 0330 Facsimile: (08) 9383 7142 E-mail: [email protected] Location: Regional Offices Bunbury Regional Office 61 Victoria Street BUNBURY 6230 Telephone: (08) 97910836 Facsimile: (08) 97910835 Valuation Services Bunbury Regional Office 61 Victoria Street BUNBURY 6230 Telephone: (08) 97210800 Facsimile: (08) 97214465 E-mail: [email protected] Valuation Services Albany District Office (Limited service to the public available) 58 Serpentine Road ALBANY 6330 Telephone: (08) 98414532 Facsimile: (08) 9841 2311 E-mail: [email protected]

Department of Land Information Annual Report 2004/2005 4
Contents About the Department of Land Information………………………………06 Better Planning: Better Services – WA Public Sector Strategic Planning Framework........................................................................................... 10 Year in Review Chief Executive’s foreword……………………………………………….. 11 Significant Issues and Trends………………………………………….. .. 14 Looking to the Future........................................................................... 14 Achievements 2004/2005 .................................................................... 16 Financial Overview .............................................................................. 22 Summary of Output Measures............................................................. 23 Review of Operations Organisational Overview ………………………………………………. ... 25 Corporate Executive Profiles……………………………………………. . 26 Corporate Governance ........................................................................ 28 People at DLI....................................................................................... 31 Customers, Stakeholders and Community Relations ……………….... 41 Products and Services (by outcomes) Land Information
Output Measures and Key Performance Indicators .................. 65 Valuation Services
Output Measures and Key Performance Indicators………… .... 73 Access to Government Geographic Information
Output Measures and Key Performance Indicators………….... 81 Appendices A Legislation administered ............................................................. 87 B DLI pricing policies ...................................................................... 89 C Electoral Act compliance............................................................. 90 D Wastepaper recycling.................................................................. 91 E Energy Smart Government Program........................................... 91 F Sponsorship report...................................................................... 92 G Recordkeeping Training .............................................................. 92 H Freedom of Information............................................................... 93 I Public Interest Disclosure............................................................ 95 J Corruption Prevention ................................................................. 96 K Sustainability ............................................................................... 96 L DLI and WALIS Publications Available ....................................... 97 Glossary of Land Terms……………………………………………… ... 105 Financial Statements (attached)

Department of Land Information Annual Report 2004/2005 5
About the Department of Land Information Western Australia’s Department of Land Information (DLI) has played a pivotal role in the social and economic development of Western Australia. Since its origin in 1829 as the Survey Office of the Swan River Colony, DLI has provided vital land and property information that has underpinned our State’s sustained growth and prosperity, and ensured the security of land ownership essential for stimulating capital investment. Today, the impact of land information is broad and far-reaching. It extends well beyond traditional valuation records and ownership titles, to encompass detailed social, environmental and economic data integrated with satellite imagery, aerial photography and digital mapping. What We Do • Our core business is land information. We are responsible for ensuring
the State’s land ownership records are up-to-date and easily accessible. • We collect geospatial data from ground surveys, aerial photography and
satellite imagery. This information is used to produce a wide range of digital and hard copy maps for many different purposes.
• We provide an effective and impartial valuation and property information
service. • We are a lead agency in the Western Australian Land Information System
(WALIS) – a consortium of State Government agencies that coordinates WA’s land information.
DLI’s Strategic Plan 2005 - 2010 Our Vision A future where the use of land information knows no bounds. Our Purpose Providing access to land information anywhere, anytime to promote a strong and sustainable Western Australia. Our Identity A leading information provider in the knowledge economy, known for: Integrity: of our information, infrastructure, relationships and people Ingenuity: in unlocking the accessibility, useability and application of land
information Excellence: in our own performance and our contribution to the outcomes of
others

Department of Land Information Annual Report 2004/2005 6
Corporate Conduct Our People – Great People with Great Values We are an organisation of people who act with honesty, integrity, respect, and openness. We work together as one team that reflects the diversity of the Western Australian community. We value:
• growth and learning; • excellence; • creativity; • celebration and recognition; and • sustainability and a sustaining work environment
Our Business Conduct – Integrity with Ingenuity In conducting our business, we will:
• use our ingenuity and passion to imagine what is possible; • work with customers and technology to know what is needed; • act with integrity to promise what is achievable; and • deliver what is promised
Our business decisions will specifically consider the:
• integrity of the Land Titles Register And Valuation Rolls; • needs of Government users of land information; and • development of the State’s spatial information industry
In support of this we will act in a business-like manner, work with others for mutual benefit and be a fair and responsible provider of information. Strategic Goals By 2010:
• our land information will be accessible online; • we will provide online access to Government information about rights,
restrictions and interests in land; • our people, systems and services will be a critical link in networked
Government; • we will be self-sustaining and deliver a financial return to the State; and • throughout the journey we will excel for our customers and contribute to
the community in which we live and work. Critical Success Factors
• Knowing our customers Being valued and relied upon for what we do and how we do it. Building sound and lasting relationship with customers by anticipating and meeting their core business needs for land information.

Department of Land Information Annual Report 2004/2005 7
• Having the right workforce Being an employer of choice and learning organisation which harnesses the knowledge of its people, develops the potential and talent of its workforce, and has the right number and mix of people who are aligned to business needs.
• Making the right land information available Ensuring that data underlying our land information systems and services is appropriate, readily available and digitally enabled.
• Having the right infrastructure Ensuring that our computer systems, software and technical capacity are stable and secure and meet current and future business needs.
• Being financially viable and sustainable Operating as a going concern in a manner that supports long term business prosperity. Delivering on revenue, efficiency and profit outcomes required for capital re-investment – while keeping costs down and being positioned to deliver a financial return to Government.
• Having the confidence of stakeholders and the community Ensuring a high standard of corporate and individual conduct that meets statutory requirements, honours our unique leadership role and responsibilities within the land information industry and Government, and delivers a sound corporate reputation.
• Having strong leadership and sound governance Ensuring that the business is overseen in a manner that maximises operational performance, makes the right choices for the future, establishes clear focus and accountabilities, manages risks effectively, and is aligned with Government policy.
Key Strategies
• Enhance the quality of our core datasets and enable integration in an online environment.
• Build relationships and systems to share land information, expertise and infrastructure within and across Government.
• Form alliances with industry and research institutions to develop new uses for land information and realise commercial opportunities.
• Work with our customers and stakeholders to know their business and improve their outcomes.
• Deliver registration and valuation services that meet statutory and user requirements and model best practice.
• Increase revenue and better manage costs to fund capital investment and improve services.
• Implement new governance arrangements to better manage risk, provide external oversights and strengthen commercial and strategic expertise.

Department of Land Information Annual Report 2004/2005 8
• Build a capable, enterprising and engaged workforce. • Seek and support corporate and individual opportunities to contribute to
the community. Our Customers As well as providing products and services for the entire community, DLI has also developed a relationship with the following customer groups:
• land developers; • financial institutions; • conveyancers and settlement agencies; • legal professionals; • local governments and other Government agencies; • mining and exploration industries; • pastoralists and farmers; • real estate agents, valuers and land economists; • state, commonwealth and global agencies; • surveyors, cartographers, spatial and GIS users; • tourism and recreation industries; and • educational groups and training specialists.

Department of Land Information Annual Report 2004/2005 9
Better Planning: Better Services – how DLI contributes to the Western Australian Public Sector Strategic Planning Framework As a State Government department, DLI is committed to the Strategic Planning Framework, which sets out the Government’s vision for Western Australia. The goals of ‘Economy’ and ‘Governance’ are closely aligned with the strategic outcomes of DLI.
• Economy: DLI’s core activities of titling and valuation activities underpin land and property markets and the State’s rating and taxing base. DLI’s land information activities underpin industry growth and e-commerce.
• Governance: Initiatives such as the Shared Land Information Platform (SLIP); DLI’s focus on technology and its new e-business direction; and its contribution to whole-of-Government savings are aligned with the ideals of Governance.
Vision …the best opportunities for current and future generations Western Australia will be a creative, sustainable and economically successful State that embraces its multicultural heritage and its rich natural resources. It will provide the best opportunities for current and future generations to live better, longer and healthier lives. Goals
• People and Communities To enhance the quality of life and wellbeing of all people throughout Western Australia • The Economy To develop a strong economy that delivers more jobs, more opportunities and greater wealth to Western Australians by creating the conditions required for investment and growth
• The Environment To ensure that Western Australia has an environment in which resources are managed, developed and used sustainably, biological diversity is preserved and habitats protected • The Regions To ensure that regional Western Australia is strong and vibrant • Governance To govern for all Western Australians in an open, effective and efficient manner that also ensures a sustainable future

Department of Land Information Annual Report 2004/2005 10
The Year in review – Chief Executive’s foreword As the Department of Land Information (DLI) draws closer to becoming a statutory authority, the department has devised and adopted a number of changes to its corporate framework during the past year. Of significance is DLI’s new Strategic Plan, which came into effect in 2005. The Strategic Plan aims to underpin DLI’s business, and confirms the strategic direction and principles that will guide the department’s operations for the next five years. The plan evolved from extensive consultation and planning, and began as a revision of the previous strategic plan ‘New Horizons’. Our department has changed considerably since ‘New Horizons’ was first implemented in 2000, and the new Plan ensures that our strategic direction is aligned with the advancements we see every day in technology and business. The new plan sets out our vision, mission, goals and what strategies we will use to achieve these. A large component of this is dedicated to our staff. Without the commitment of our team, and having the right workforce, we cannot gain the confidence of our stakeholders and community, and therefore achieve our business directives. The importance of staff is also reflected in DLI’s new Code of Conduct, which is integrated throughout the Strategic Plan. Similar to the plan itself, it was developed in a collaborative process through workshops and surveys. The new code identifies the values that we collectively hold as important, and sets out how these values translate into action. Each one of us is expected to reflect these values in our interactions with colleagues and customers. They apply to everything we do, ranging from the way we behave as individuals to important decision making processes within the department. They provide a foundation on which to base DLI’s future priorities. One of these values is community, and one of the ways in which we show this is through encouraging multi-directional communication and consultation. The Shared Land Information Platform, or SLIP, is a prime example of this. Driven by DLI, SLIP is a ground-breaking project which will revolutionise the way government land and property information is used and shared, and will provide business, industry and the community with many benefits.

Department of Land Information Annual Report 2004/2005 11
During this past year, the SLIP project was given the green light by State Cabinet and has achieved great milestones as it powers forward. As part of the implementation strategy, governance arrangements were formalised and an executive steering committee inaugurated. Governance arrangements have also included the development of a cross-government reporting framework and draft communications strategy. Business sponsors have also been appointed in each of the SLIP focus areas, along with steering committees; and project teams have begun working on SLIP’s design. I spoke about SLIP and DLI’s Landgate portal, which operates in a similar way, when I visited Brazil earlier this year as a guest of the Australia Festival. Organised by the Australian Trade Commission, the Festival is the largest Australian promotional event in Latin America. The theme was e-government, and I took the opportunity to promote the innovative work we are undertaking in this regard here in Western Australia. DLI has enjoyed strong connections with our overseas neighbours during 2004/2005, with DOLA International winning a contract to provide technical assistance to enable land titling offices to start up in three provinces in Vietnam. Won in partnership with Swedish firm Ramboll Natura AB, it is the sixth Vietnamese project that DLI has been involved with since 1993. DOLA International is also undertaking work in the Cocos and Christmas Islands, and recently hosted a study tour from the Samoan Ministry of Natural Resources, Environment and Meteorology so that they could learn more about our land registration and plan processes. On the home front, DLI continued to carry out its core business with dedication and commitment. For the past few years I have talked of record business levels, and it seems that this year is no different. The strength of Western Australia’s property market has again been proven with DLI recording its highest ever number of document lodgements during the past financial year. A total of 406,225 documents relating to the buying and selling of property passed through DLI, marking a 1.5 per cent increase on the previous record of 400,158 which was set in 2003/2004. A staggering $45.04 billion of mortgages were secured by the registration system representing a $5.1 billion increase on the previous year. And the number of land transfers was also up on last year by 3 per cent, with 107,465 being recorded, totalling $30.1 billion. The total number of lots created in 2004/2005 of 30,648 was also the second highest since the record of 30,718 was set in 1993/1994.

Department of Land Information Annual Report 2004/2005 12
Against this backdrop, many new projects were instigated at DLI. The Voice Over Internet Protocol (VOIP) project was one which was a huge undertaking. Replacing the analogue telephone lines with a digital network involved new software, new cabling, new phones and a whole new way of working. When it is completed, which is early next financial year, almost 1,000 phones will have been replaced across six different locations. Already the benefits have been felt, with improved customer service and more efficient ways of working being identified. The VOIP project means that DLI will be the first government agency in Western Australia to adopt IP technology for its entire business. DLI also welcomed a new Minister for Land Information, the Hon John Bowler MLA. I had the pleasure of taking Mr Bowler on a tour of our Midland and Floreat areas, and it was an excellent opportunity to put on show the diverse expertise and skills of this department. His visit provided a reminder of how many key areas of the State that DLI’s business impacts on. The Minister will be playing an important role as DLI draws closer to becoming a statutory authority. Drafting of the legislation has begun, and the 2005/2006 financial year will see the department putting solid mechanisms in place for changing the way it operates. I look forward to our future. GRAHAME SEARLE CHIEF EXECUTIVE

Department of Land Information Annual Report 2004/2005 13
Significant issues and trends • It is likely that the current high activity levels of the Western Australian
property market will continue, resulting in strong ongoing demand for land information, registration and valuation services.
• Land information is gaining recognition as a key element in Government
decision making, provision of Government services and the delivery of public policy, including sustainable development and emergency management.
• Cabinet has approved the drafting of a Bill to establish a land information
statutory authority with commercial powers, to deliver greater return to Government and the community on the State’s land information asset.
• Government, industry and the community expect more cost-effective
management and delivery of land information through on-line services. • There is heightened Government and community commitment to the
registration of natural resource interest, and the recording of Native Title. • Impartial and accurate valuation continues to underpin the revenue
collection of State and local governments. Greater attention to data quality and the verification of values will be required to avoid the level of dispute and litigation occurring in other states.
• Independent valuation and property advice is critical to transparency in
all Government property transactions, and compulsory acquisitions in particular.
• As the number of strata lots being created has significantly increased, the
need to amend and modernise the Strata Titles Act and its associated by-laws has become a priority.
Looking to the future Transition to a Statutory Authority The department is continuing to change in preparation for being re-established as a statutory authority. Cabinet approved the drafting of a Bill to re-establish the department as a land information statutory authority with commercial powers in October 2003. The authority will deliver a greater return to Government and the community on the State’s land information asset. The decision followed extensive community and stakeholder consultation, incorporating groups representing surveying, spatial, conveyancing and housing industries, Government agencies and staff.

Department of Land Information Annual Report 2004/2005 14
Drafting of legislation has begun and subject to Parliamentary priorities, it is anticipated that the land information statutory authority will be created in 2006. The implementation plan for the authority has been completed as much as is possible pending the drafting of legislation and is being revised under the new legislative timetable. Business Plan DLI is operating under a Business Plan for the statutory authority to the extent possible as a department. The Plan was prepared by officers of DLI, with assistance and guidance from the Department of Treasury and Finance, and sets out the services and financial projections to be delivered by the new statutory authority to 2010/2011. Outlook for 2005/2006 DLI will continue to change to improve its contribution to Western Australia’s economic growth, social advancement and protection of the natural environment, and to ensure that the State is well positioned to respond to the globalisation and digitalisation of information. DLI recognises that its land information increasingly needs to be online, integrated and on-time to meet the needs of Government, industry and the public. DLI is awaiting the drafting of a Bill to re-establish itself as a land information statutory authority. With an anticipated commencement date of 1 July 2006, the authority will continue to manage the State’s land titling and property valuation functions, as well as offering new online information and services for its Government and industry customers. This change in structure and focus will ensure that the department provides enduring value, through the alignment of structure, functions and funding with the State’s long-term land information needs. Underpinned by a new 2005/2010 Strategic Plan and partnerships with other Government agencies, the agency is ensuring that it meets these long-term goals. DLI’s Business Realignment program continues to implement a more business-like approach to planning and decision making by:
• improving efficiency, increasing revenue and controlling costs; • identifying opportunities to improve services; • making the most effective use of resources; and • better determining cost bases to underpin funding and pricing
decisions.

Department of Land Information Annual Report 2004/2005 15
Achievements 2004/2005 – Corporate Highlights Values and Behaviours – Code of Conduct In 2003, DLI instigated a review of the department’s first Code of Business Conduct which incorporated its Values. The review was driven by several key factors:
• the need to reflect the business direction of the agency as it progresses towards becoming a statutory authority;
• amalgamation with the former Valuer-General’s Office; and • to reflect studies identifying a strong relationship between values-based
business conduct and behaviours, and bottom-line performance. After a highly consultative process involving DLI staff, the six most important Values and the supporting Value Statements and Behaviours now form the agency’s new Code of Conduct, launched in September 2004. This new Code of Conduct guides staff in their behaviour as individuals, and the ideals are incorporated into key business and decision-making processes. The new Code provides a foundation on which to base DLI’s future priorities, decision making and workforce capabilities, and is reflected in decisions and behaviours both at corporate and individual levels. Shared Land Information Platform (SLIP) The implementation plan for the State’s Shared Land Information Platform (SLIP) was developed and endorsed by Government. SLIP involves the engagement of over 200 people across 20 Government agencies in order to deliver a $26 million cross-Government work program. As part of this work program, initial scoping and consultation across Government was undertaken to:
• develop a register of interests to facilitate a single access point for the discovery of key rights, obligations and restrictions that may affect the use and enjoyment of land in Western Australia;
• deliver mapping and data to regional groups and agencies to support monitoring and decision-making on conservation, land management and sustainable development;
• streamline the sub-division process; and • enhance information access and support tools to facilitate the provision
of real time spatial information for agencies involved in emergency management and recovery situations.
As part of the implementation strategy, governance arrangements were formalised and an executive steering committee inaugurated. The committee is comprised of executives from the SLIP lead agencies as well as the Office of e-Government, Department of Treasury and Finance and the WALIS office. Governance arrangements have also included the development of a cross-Government reporting framework and draft communications strategy.

Department of Land Information Annual Report 2004/2005 16
Governance arrangements have been instituted in each of the SLIP focus areas with the appointment of ‘business sponsors’ and the creation of focus area steering committees; project teams have been deployed and work has commenced on the design and analysis to facilitate its delivery. Clause 42 and 47 Zoning Certificates This service, which complements the existing Electronic Advice of Sale 2 (EAS2) system, now enables the provision of Clause 42 and Clause 47 zoning certificates online to customers. During an EAS2 transaction, customers can now easily purchase these certificates online, providing significant benefits to the conveyancing industry by reducing turnaround times and further streamlining the settlement process. Developed in conjunction with the Department of Planning and Infrastructure, this new service was introduced in December 2004 and currently over 80% of all requests are now processed through Landgate, DLI’s land information portal. Consultancy Services to Government
• Department of Sport and Recreation and the Department of Local Government and Regional Development
DLI provided consultancy advice for the development of a business case and prototype that aims to provide an improved facilities management system for the Departments of Sport and Recreation, and Local Government and Regional Development. This system will, for the first time, provide both departments with the ability to plan, maintain and execute sport and recreational facility management around the State, through the sharing of information and systems. • Department of Education and Training To more effectively maintain and manage the State’s school facilities, DLI assisted the Department of Education and Training (DET) to develop a business case and prototype of a GIS-based facilities management system. The DET’s portfolio consists of 820 schools and 91 TAFE colleges/annexes, and knowing their location and what was around them would provide a more effective and diligent management of resources. Effective use of geographic information was identified as being able to assist in carrying this out, and would no longer necessitate the use of hard copy maps and plans.
DLI Phone System A contract for the implementation of new voice management technology integrating DLI’s telephone and computer systems was initially implemented in May 2005. Its aim was to improve operating processes and provide more improved customer service levels.

Department of Land Information Annual Report 2004/2005 17
DLI successfully contracted to purchase Voice Over Internet Protocol (VOIP) technology to replace the aging PABX system, with the goal for full implementation being August 2005. A ‘state of the art’ voice handling system was identified as the technology most likely to provide the greatest returns on investment through:
• reducing capital infrastructure to support a single network; • consolidating support skills; • simplifying and reducing the costs of moves/adds/changes of
personnel; • providing easier integration and support for home office/teleworkers;
and • increasing returns through the linkage of all remote sites onto the head
office system through a converged wide area network. The first stages of the installation of the new technology have had an immediate positive effect on DLI’s customer service levels in the primary customer contact areas and for general system users. DLI staff will be provided with a range of tools to ensure customers are able to reach the person they are aiming to contact. Additionally the new system has enabled all DLI sites to be included in a single network with associated savings in call charges and flexibility. The new system has also enabled the creation of customer contact centres to be established in the primary customer facing areas. These centres have brought a significant reduction in customer wait times, and have seen call abandonment rates reduced to less than 2.5% in key response groups. Record Transactions Recorded The strength of Western Australia’s property market was proven with DLI recording its highest ever number of document lodgements for the 2004/2005 financial year. A total of 406,225 documents relating to the buying and selling of property passed through DLI, marking a 1.5% increase on the previous record of 400,158 which was set in 2003/2004. $45.04 billion of mortgages were secured by the registration system during 2004/2005, representing a $5.1 billion increase on the previous year. The number of land transfers also exceeded 2003/2004 by 3%, with 107,465 being recorded, totalling $30.1 billion. The total number of lots created in 2004/2005 of 30,648 was the second highest since the record of 30,718 was set in 1993/1994.

Department of Land Information Annual Report 2004/2005 18
Grant Awarded to Curtin University Curtin University’s Spatial Sciences Department was awarded a grant of $120,000 from DLI to fund research into new technology supporting the State’s geodetic network. The geodetic network is a system of control points enabling surveyors and others to accurately establish their position on the Earth’s surface. The award, a one-off grant, will be used to evaluate the benefits of establishing a network of Continuously Operating Reference Stations throughout Western Australia supporting the geodetic network and facilitating greater accuracy when using GPS receivers. Pilbara Rangelands Report A 600 page report produced by the Pilbara Ranges Project and issued jointly by DLI and the Department of Agriculture is set to help pastoralists and other key stakeholders in the Pilbara to manage their land as sustainably as possible. DLI staff surveyed and mapped an area of 181,000 square kilometres, while Department of Agriculture staff recorded vegetation and other land characteristics such as soil erosion. The report was published in two sections: the first focusing on natural resources, and the second on summarising existing pastoral leases and analysis of their capacity to carry stock. Firewatch Goes National Firewatch, which uses satellite imagery to provide online access to fire-related information, expanded nationally thanks to financial support from the Natural Disaster Mitigation Program. Originally created by DLI’s Satellite Remote Sensing Services in 1984, every two hours data beamed from satellites is captured, and every three hours the website is updated and unique mapping products made available for web download. Initially conceived as a reactive fire detection service, FireWatch has been comprehensively redeveloped since 2004 into the pro-active service on offer today. Additionally, the Firewatch website has been revamped to cater for data now coming from Alice Springs and Hobart. This new information is vital for long and short-term tactical planning, including deployment of fire fighting resources and evacuations. Constantly evolving to meet changing demands, Firewatch is an invaluable tool for those communities whose livelihoods depend upon efficient and pro-active land management.

Department of Land Information Annual Report 2004/2005 19
Surveying of Stubble Burning DLI received funding from the Australian Greenhouse Office to undertake a research project to validate satellite measurements of stubble burning undertaken by farmers. The survey will assist in determining the proportion of stubble burns that were or were not detected by Firewatch, and ultimately ensure improvements are made to the service. DLI Wins Contract in Vietnam In partnership with Swedish firm Ramboll Nature AB, DLI won the contract for a five year $11 million land administration and environmental project in Vietnam. The largest scale project that DLI has undertaken in Vietnam, it involves providing technical assistance to enable the establishment of land titling offices in three provinces around the country. Update completed of Property Street Address dataset The Property Street Address dataset, which lists every address in Western Australia, was reviewed and upgraded to increase data accuracy from 95% to 99%, and to capture missing addresses. It was completed in July 2004. Used by organisations such as Australia Post and emergency services, the dataset will now be checked on an annual basis to ensure a high level of data quality is maintained. New StreetSmart Maps DLI produced four new StreetSmart maps during the past year, covering a wide range of Western Australia and its resources:
• The Wineries Map The Wineries Map is the first map to provide a comprehensive guide to the State’s wineries. Featuring 322 wineries, it covers nine wine regions and includes information on their wine producing histories, details of dining and/or cellar door facilities, and the location of Visitors’ Centres.
The Wineries Map was produced in partnership with the Wine Industry Association of WA, the Department of Industry and Resources, and Tourism WA. • Pilbara and Gascoyne Touring Maps The Pilbara and Gascoyne Touring Maps, which have been revamped and updated, are guides to two areas of Western Australia that are major tourist destinations. The maps are the first to be produced to feature revised zones and boundaries of national parks including the Karinjini and Millstream-Chichester National Parks, and the Ningaloo Marine Park.

Department of Land Information Annual Report 2004/2005 20
Historical trails and sites, restricted areas, sanctuary zones and general places of interest are also detailed in the maps, along with protocol and safety advice tips relating to camping, general outback travel, cyclones, and mines.
• Perth and South-West Map. With an extensive coverage of the Perth metropolitan area, the revamped Perth and South-West map makes possible travel from the Pinnacles to Esperance using a single map. Comprehensively charting north to Jindalee and Butler, and south of Mandurah to Bouvard, the map also contains enlarged directories to the Perth and Fremantle CBDs, Rottnest Island and the South West of WA. The Perth and the South West map also includes the most up-to-date guide to Perth’s rail and ferry system, including the Mandurah rail line, along with information on significant tourist destinations.

Department of Land Information Annual Report 2004/2005 21
Financial overview
Operating Revenue In 2004/05 DLI's revenue exceeded the previous year by $8.7m (13.2%) mainly due to the property market continuing to operate at high levels, and due to the completion of the triennial Metropolitan Revaluation Program, which revalued over 600,000 Western Australian properties for use by the Water Corporation, local governments and FESA.
Cost of Services Servicing high activity levels as a consequence of the active property market also impacted cost of services, which were $5.8m (6.7%) greater than previous year. The increase was also due to higher depreciation and capital charges reflecting the Department's growing investment in information technology and e-business.
Capital Expenditure Capital expenditure during 2004/05 was $9.9m. The majority of the investment continued to be in the Department's e-business initiative and the business infrastructure required to support both this initiative and also existing business operations. This included the implementation of new voice management technology that integrates the Department's telephone and computer systems to support improved operating processes and quality seamless customer service.
Financial Summary
2005 2004 ($'000) ($'000)
Cost of Services Operating Expenses 92,546 86,761 Operating Revenue 74,737 65,996 Net Cost of Services 17,809 20,765 Statement of Financial Position
Total Assets 75,404 72,857 Total Liabilities 18,729 23,110 Total Equity (Net Assets) 56,675 49,747
Department of Land Information Annual Report 2004/2005 22
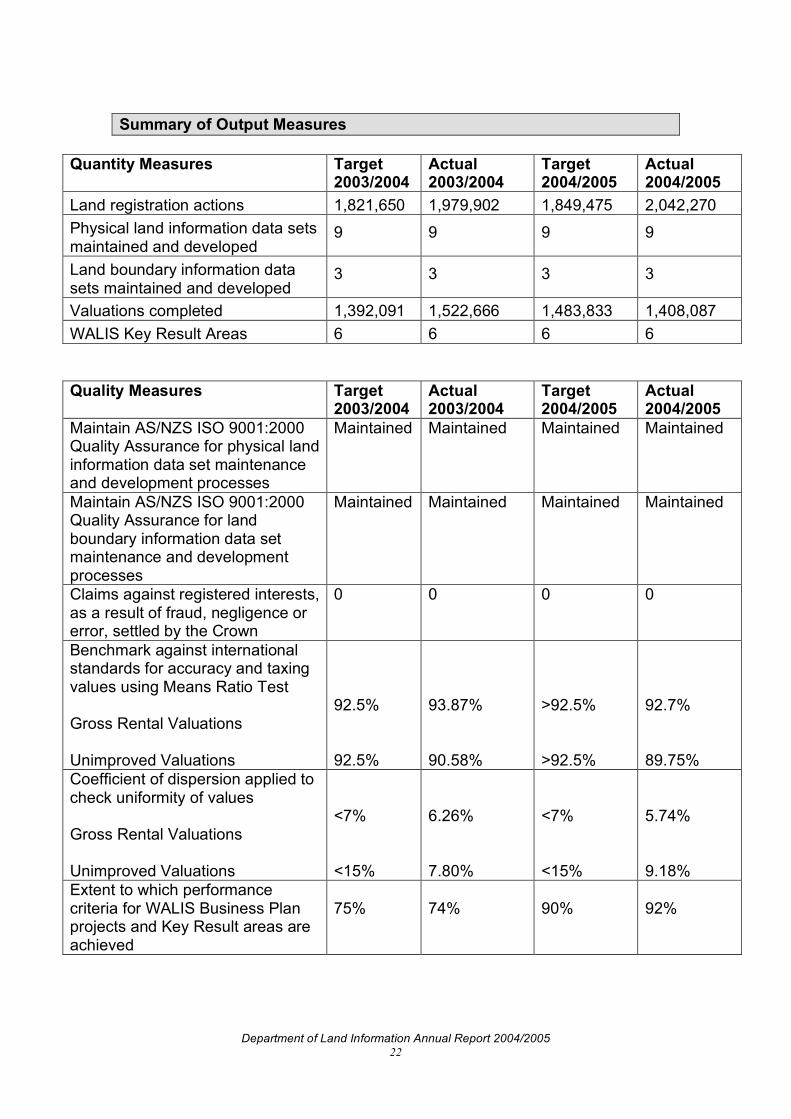
Summary of Output Measures
Quantity Measures Target 2003/2004
Actual 2003/2004
Target 2004/2005
Actual 2004/2005
Land registration actions 1,821,650 1,979,902 1,849,475 2,042,270 Physical land information data sets maintained and developed
9 9 9 9
Land boundary information data sets maintained and developed
3 3 3 3
Valuations completed 1,392,091 1,522,666 1,483,833 1,408,087 WALIS Key Result Areas 6 6 6 6
Quality Measures Target 2003/2004
Actual 2003/2004
Target 2004/2005
Actual 2004/2005
Maintain AS/NZS ISO 9001:2000 Quality Assurance for physical land information data set maintenance and development processes
Maintained Maintained Maintained Maintained
Maintain AS/NZS ISO 9001:2000 Quality Assurance for land boundary information data set maintenance and development processes
Maintained Maintained Maintained Maintained
Claims against registered interests, as a result of fraud, negligence or error, settled by the Crown
0 0 0 0
Benchmark against international standards for accuracy and taxing values using Means Ratio Test Gross Rental Valuations Unimproved Valuations
92.5% 92.5%
93.87% 90.58%
>92.5% >92.5%
92.7% 89.75%
Coefficient of dispersion applied to check uniformity of values Gross Rental Valuations Unimproved Valuations
<7% <15%
6.26% 7.80%
<7% <15%
5.74% 9.18%
Extent to which performance criteria for WALIS Business Plan projects and Key Result areas are achieved
75%
74%
90%
92%
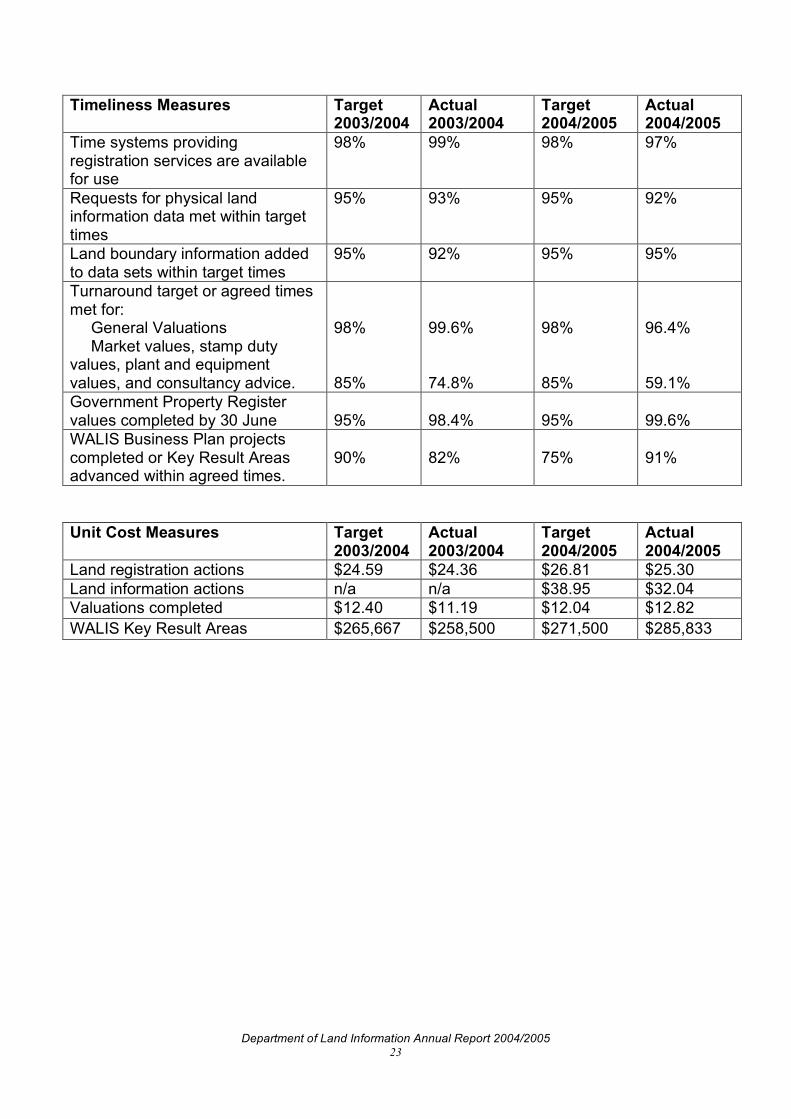
Department of Land Information Annual Report 2004/2005 23
Timeliness Measures Target 2003/2004
Actual 2003/2004
Target 2004/2005
Actual 2004/2005
Time systems providing registration services are available for use
98% 99% 98% 97%
Requests for physical land information data met within target times
95% 93% 95% 92%
Land boundary information added to data sets within target times
95% 92% 95% 95%
Turnaround target or agreed times met for: General Valuations Market values, stamp duty values, plant and equipment values, and consultancy advice.
98% 85%
99.6% 74.8%
98% 85%
96.4% 59.1%
Government Property Register values completed by 30 June
95%
98.4%
95%
99.6%
WALIS Business Plan projects completed or Key Result Areas advanced within agreed times.
90%
82%
75%
91%
Unit Cost Measures Target 2003/2004
Actual 2003/2004
Target 2004/2005
Actual 2004/2005
Land registration actions $24.59 $24.36 $26.81 $25.30 Land information actions n/a n/a $38.95 $32.04 Valuations completed $12.40 $11.19 $12.04 $12.82 WALIS Key Result Areas $265,667 $258,500 $271,500 $285,833

Department of Land Information Annual Report 2004/2005 24
DEPARTMENT OF LAND INFORMATION - Organisational Overview
Chief Executive Grahame Searle Responsible for the overall strategic and operational management of the Department of Land Information. Chairman of the WALIS Executive Policy Committee providing policy direction. This committee comprises CEOs of all agencies participating in WALIS.
Executive Director Information Services Gary Fenner Responsible for the maintenance of Registration, Valuation and Geographic services. To ensure that Government and community land information needs are met; ensuring that the land information base provides certainty of ownership and supports the State’s administrative, commercial and social systems. Holds the Statutory Position of Valuer General of Western Australia and is responsible for the general administration of the Valuation of Land Act 1978.
Director WALIS Office Dr Marnie Leybourne The Western Australian Land Information System (WALIS) coordinates the management and delivery of the State’s Government land information. The WALIS Office is responsible for marketing WALIS, providing strategic leadership, and managing stakeholder participation and WALIS projects. Reports to the Chairman of the WALIS Executive Policy Committee.
Executive Director Information Access Ian Hyde (July 2004 to February 2005) Giles Nunis (from March 2005) Responsible for Product and Service Delivery, Sales and Marketing, and Shared Land Services.
Executive Director Strategic Planning and Development Dr Heather Brown Tania Loosley-Smith (acted from 20 May 2005) Responsible for strategic policy and planning, including proposals for the future of DLI, organisational change management, strategic workforce planning, business realignment, and legislative review and corporate communications.
Executive Director Information Management Andrew Burke Responsible for strategic information management and planning through the collection, management and use of information resources. Responsible for the development and maintenance of the asset infrastructure and business software used to deliver services and information to DLI customers and stakeholders.
Executive Director Business Services Mark Woodcock Responsible for management of financial, workforce, legal, and infrastructure services to support DLI’s operations. Also responsible for outcome management, performance reporting and the enterprise business information system to drive improvements in business processes within the organisation.

Department of Land Information Annual Report 2004/2005 25
Corporate Executive Profiles Grahame Searle – Chief Executive Grahame Searle has qualifications in business. He has a strong background in information technology and, in particular, integrating computer systems for customer service delivery. Grahame has extensive experience in managing information technology projects for Victoria’s Land Registry; Museum of Victoria; the Registry of Deaths, Births and Marriages; and Survey and Mapping Victoria. In 1997, he held the position of Director of Victoria’s Title Registration Services, before joining DLI in 1998. For two years, he worked as Director Service Delivery, before acting as Chief Executive until being officially appointed in this role in June 2004. Mr Searle’s term of appointment is five years. Dr Heather Brown – Executive Director, Strategic Planning and Development (July 2004 - May 2005) Dr Heather Brown has a postgraduate qualification in psychology and over 20 years’ experience in the public sector in a range of agencies including the Health Department, the Department of Local Government, the Ministry of Fair Trading and the Disability Services Commission. Heather joined DLI in January 1998 as Director, Strategic Policy and Planning. Her responsibilities encompass strategic planning; corporate change management; leading the team responsible for the transition to a statutory authority with commercial powers; business realignment; corporate communications; and policy and legislative review. Tania Loosley-Smith – Acting Executive Director, Strategic Planning and Development (May 2005 - June 2005) Ian Hyde –Executive Director, Information Access (July 2004 – February 2005) Ian Hyde has qualifications in surveying and computing. He has been actively involved in land administration and information management for over 22 years in both the public and private sectors and was Coordinator of the WA Land Information System. Ian has extensive experience in land information management, negotiation, service delivery provision, strategic and business planning, strategic relationship management, policy development and management of multi-disciplinary teams and complex projects. Giles Nunis –Executive Director, Information Access (from March 2005) Giles Nunis has a Bachelor of Business Degree. He has substantial experience in managing complex IT projects and systems, across both the Government and private sectors. Giles was the Director Courts Development in the Department of Justice where he was responsible for a range of strategic business activities including state-wide customer services, technology, business planning, financial management and business performance. He later joined a technology consulting company as a Principal Consultant, which took him to the eastern states, where he worked on large technology projects in Sydney and Canberra before returning to Perth. Giles was appointed to DLI in March 2005.

Department of Land Information Annual Report 2004/2005 26
Mark Woodcock – Executive Director, Business Services Mark Woodcock has a BA honours degree in Economics. He has 25 years experience in various management roles including tertiary education, advertising and publishing, and more recently health care. He worked in the UK, Ireland, and the Middle East before migrating to Australia. He brings commercial and change management experience to DLI. Mark was appointed from the private sector to his current position in September 2000. Gary Fenner –Executive Director, Information Services Gary Fenner has tertiary qualifications in agriculture and valuation, and a Bachelor of Business degree. He has over 34 years experience in the property industry including the positions of Chief Valuer Country, Chief Valuer Metropolitan and has held the position of Valuer General for the last five years. Gary has been an elected board member of the Australian Property Institute (API) for the past eight years. He is also Chairman of the API’s Legislation Review Committee; a member of the Curtin University Advisory Committee for Property Studies and a member of the Property Education Foundation. Andrew Burke – Executive Director, Information Management Andrew Burke is an engineer with a varied background in both the public and private sectors including operational management, policy and planning roles. In 1990, Andrew led a taskforce to develop a strategy to integrate and improve access to the State’s land information. He was subsequently appointed Director, WA Land Information System in 1990. His next position was within DLI as Acting Director of Land Information and Administrative Services - a position he held until taking up his current role.
Department of Land Information Annual Report 2004/2005 27
Corporate Governance Contribution to Strategic Planning Framework Goal 5 - Governance An effective corporate governance framework optimises business performance by ensuring transparent and ethical management practices. DLI’s Code of Corporate Governance Practice and the Corporate Executive Charter provide a governance framework that facilitates a high standard of leadership and direction for the agency. The Corporate Executive and its sub-committees operate in a manner consistent with sound management practice, and ensure that the organisation implements Government policy with openness and integrity, in the best interests of its customers and stakeholders. DLI has controls in place for business planning, compliance reporting, risk management and monitoring of operational performance. The Corporate Executive The Chief Executive Officer has ultimate responsibility to the Minister for DLI’s performance and is supported by the Corporate Executive, DLI’s principal governing body. The Corporate Executive is responsible for:
• developing and monitoring corporate directions; • overseeing an effective control environment; • budgeting and planning; • monitoring operational management outcomes; and • achieving accountability and compliance with Government
requirements. Business Performance Committee The Business Performance Committee operates as a sub-committee of the Corporate Executive. The Business Performance Committee focuses on operational matters, maintaining performance and reporting to the Corporate Executive as required. It is the forum for dialogue and discussion, raising of concerns and developing solutions to ensure delivery of the department’s ongoing services and products. Membership comprises:
• Executive Director Business Services (Chair) • Executive Director Information Management • Executive Director Information Services • Executive Director Information Access

Department of Land Information Annual Report 2004/2005 28
Advisory groups to the Corporate Executive The Corporate Executive also receives advice from the following groups:
• The Diversity Management Committee – outlines responsibilities and prepares the DLI diversity plan.
• The Peak Joint Consultative Committee – gives feedback from staff on DLI policy and industrial relations matters.
• The Workforce Alignment Committee - advises on staffing and structural issues in relation to maintaining alignment with DLI’s strategic plan.
• The Customer Service Council – provides the customers’ perspectives on service delivery issues.
• The Tenders Committee - provides independent, impartial comment on contracting and procurement.
National Competition Policy All relevant DLI legislation has been reviewed in accordance with the Competition Principles Agreement 1995. Compliance guidelines have been developed, communicated to staff and made available on the intranet, for staff to follow with the objective that competition laws are adhered to within the agency. During 2004/2005 National Competition Policy compliance information has been further integrated into the department’s new project approval framework. Risk Management Risk management is central to good corporate governance and is directly linked to maintaining an effective control environment and ensuring achievement of DLI’s strategic goals. DLI’s Risk Management Policy confirms the agency’s commitment to embedding risk management into all aspects of the business and aims to improve business performance as well as meet our compliance requirements. Guidelines and an electronic risk register support the policy. The Corporate Executive receives quarterly risk management reports that provide an overview of DLI’s risk profile, the effectiveness of existing controls and progress on treatment plans. Performance Audit DLI maintains an internal audit function which provides assurance on a range of issues including internal control framework, risk minimisation; reliability of financial and management information; safeguarding of assets; legislative compliance; adherence to established policies and procedures and operational effectiveness, efficiency and economy. Performance Audit Branch provides the Chief Executive and Corporate Executive with independent assessments of the department’s internal control environment.

Department of Land Information Annual Report 2004/2005 29
During 2004/2005, the Performance Audit Branch's auditable activities were allocated to review the following:
• Application controls reviews for payroll, Valsys and accounts receivable; information security;
• Data integrity; business realignment, decommissioning of mainframe; e-lodgement; and
• Capital expenditure, GST processes, revenue collections, insurance, deposit and strata plans, credit cards and travel expenditure.
Western Australian Land Information System (WALIS) Office The Western Australian Land Information System (WALIS) is a complex partnership of diverse participants from 27 State Government agencies, local government and private sector organisations. It coordinates the management and delivery of geographic information held mostly by WA Government agencies. WALIS was created in 1981 to build networks of people and technology to share information and improve its usefulness and accessibility. WALIS is supported through the WALIS Office, situated within the DLI organisational structure. Acting WALIS Director, Dr Marnie Leybourne, reports directly to DLI’s Chief Executive Officer in his capacity as the head of WALIS. Coordination and operational activities of WALIS are managed through the WALIS Council, with strategic and policy issues run through a Core Management Group, comprising Director-level representatives from key State Government agencies that take a lead role in implementing components of the WALIS Strategy. The WALIS Advisory Committee comprises 12 representatives from industry and community organisations, on two-year appointments, with the mandate to advise Government on issues associated with geographical information. Key WALIS initiatives include the WALIS Forum, held approximately every 18 months, an ongoing series of seminars and coordination of the State Land Information Capture Program.

Department of Land Information Annual Report 2004/2005 30
People at DLI Contribution to the Strategic Planning Framework: Goal 1 – People and Communities Goal 2 – The Economy Goal 5 – Governance Code of Conduct In 2003, DLI instigated a review of the department’s first Code of Business Conduct which incorporated its Values. The review was driven by several key factors:
• the need to reflect the business direction of the agency as it progresses towards becoming a statutory authority;
• amalgamation with the former Valuer-General’s Office; and • to reflect studies identifying a strong relationship between values-based
business conduct and behaviours and bottom-line performance. This process was designed to be highly consultative and one which would invite all staff to participate. It was envisaged that this would provide staff with a set of values and behaviours that would facilitate cultural change to help achieve the department’s strategic goals. This process involved providing all staff with the opportunity to identify the corporate values and behaviours through the use of e-surveys and participation in one of the 41 workshops held throughout DLI. The values and behaviours identified as most important by staff were then compiled into a draft model. As a final stage to the review, another workshop was held to assess and ensure the Values and Behaviours were measurable at a corporate level and were an accurate reflection of the outcomes of the staff workshops. The six most important Values and the supporting Value Statements and Behaviours, as identified by DLI staff, now form the agency’s new Code of Conduct, launched in September 2004. DLI values:
• Growth & learning; • Excellence; • Creativity; • Community; • Celebration; and • Sustainability.
Department of Land Information Annual Report 2004/2005 31
This new Code of Conduct guides staff in their behaviour as individuals, and the ideals are incorporated into key business and decision-making processes, along with human resource systems and policies. This ranges from decisions made at the Corporate Executive level to performance management, recruitment and selection processes, and training and development programs. These include:
• incorporation into our Strategic Plan 2005-2010; • incorporation into our staff assessment tool “Perfect Balance”; and • inclusion in our new Induction Program via an interactive session on
how we are to ‘live-by’ and apply the Values and Behaviours in our workplace.
The new Code provides a foundation on which to base DLI’s future priorities, decision making and workforce capabilities. Each DLI staff member received a copy of the Code, and is expected to reflect these values and behaviours in interactions with colleagues and customers. A Code of Conduct photography competition conducted in December 2004. Staff were invited to submit photographs capturing the essence of each of the six Values. The winning entries were made into posters and displayed throughout the agency. Review of Valuation Services In conjunction with the business re-alignment review of Valuation Services, Strategic Human Resources conducted a review to investigate and report on the concerns of managers and staff regarding the short and long term issues around the attraction and retention of staff at Valuation Services Branch. The goal was to recommend best practice strategies to address these concerns. A highly consultative approach was taken, with Valuation Services staff being given the opportunity to participate in the review. Focus groups were formed for staff to provide input into the process. Gaining input from all key stakeholders was considered an important part of the review, together with discussing possible strategies and recommendations in response to issues raised. The outcome was a complete package providing Valuation Services with enhanced succession planning and attraction and retention opportunities via a range of recommendations, including:
• an improved career path for Valuers using Criteria Progression. The previous Criteria Progression Tool (CPT) has been expanded to provide a better structure for the career path of Valuers and to improve the accelerated progression process if an applicant has the skills, qualifications and experience necessary at a higher increment;
• the implementation of a range of initiatives designed to improve management capabilities eg. 360° feedback and inclusion of management training in the Criteria Progression Tool;

Department of Land Information Annual Report 2004/2005 32
• a proposed structure that better reflects the functions and work value of
the Branch that will be implemented in accordance with the DLI’s Workforce Alignment Guidelines;
• the provision of training opportunities for Valuation Services staff and managers to enhance their professional and technical skills through a range of initiatives including creating an e-learning training program for Valuation Services’ technical database, Valsys;
• a review of Valuation Services’ Job Rotation Policy that encourages Valuation Services managers to support and promote job rotation opportunities and to develop skills in the range of valuation disciplines;
• the promotion of the full range of flexible working conditions and policies that are available within DLI to all Valuation Services’ staff and managers to encourage their implementation where appropriate; and
• the introduction of a specialised induction training program as well as a full Valuation Services’ Training Plan for 2005/2006.
Innovative New Induction Program New DLI staff were given the opportunity to learn more about the department via a revamped induction program this year. The new program consisted of a half day interactive workshop, with an electronic package able to be accessed via the DLI intranet. The main drawbacks of the previous program included its length (up to two days) and the style of providing information to participants. To overcome these obstacles, an electronic package was created to enable new staff to learn about their new workplace at their own workstation. In all, this allows for less disruption in key customer areas of DLI. The interactive half day workshop was introduced this year to help employees gain a better understanding of the department’s functions as a whole and learn how their job contributes to the goals of DLI. The workshop also presented a forum in which new staff were able to learn about the Values and Behaviours expected in the DLI workplace, along with issues such as grievance management, IT usage, electronic records management and acceptance of gifts, benefits and hospitality. The program, which has been phased in over the last two years, became fully operational this year. Succession Planning An important component of the department’s Skills Acquisition Plan was introduced this year. Referred to as the “Binding” stage, this method is important for retaining the existing skills and knowledge of DLI’s workforce. DLI has been identified as an organisation with an ageing workforce, and succession planning assists in retaining skills where they are most needed. Initiatives designed to align DLI’s workforce with its current and future business needs, included:

Department of Land Information Annual Report 2004/2005 33
• the mentoring program (running in conjunction with the leadership and
graduate programs), • the creation of a wellness calendar to support staff; and • the major review of valuation services.
Other major succession planning initiatives include:
• Leadership Program DLI’s Leadership Program is an ongoing skills enhancement scheme, designed to foster competent and innovative leaders within the organisation.
The objectives of the program are to: • develop and excite talented people; • grow leaders (as opposed to managers); • provide a framework for succession planning through developing
generic business skills; • encourage cross agency team building and innovation; and • give new impetus to cultural change to help enable our strategic goals
to be accomplished.
The program is closely aligned with the agency’s Strategic Plan and is based on a Leadership Capability Framework that supports the development of competencies such as the ability to achieve results and fostering relationships.
• Graduate Program Seven of the initial eight graduates who commenced in the program in 2004, successfully completed the program this year. The eighth graduate obtained employment elsewhere in the public service. Three of the graduates were appointed to permanent positions, as per their employment contracts, with the remaining four securing continuing contracts with DLI.
The success of this program has been further highlighted by the increased interest shown by managers during the scoping phase for next year’s program.
• Choices and Change Program The innovative career transition initiative, Choices and Change Program, continued into 2004/2005. This year’s Program continued to focus on skilling staff for the new environment driven by DLI’s transition to a statutory authority. The program encouraged a self-directed approach to planning for the future and provided staff with tools to upgrade their skills.

Department of Land Information Annual Report 2004/2005 34
The Program delivered a range of training and development opportunities for staff, including:
• application writing and interview skills; • an emotional intelligence workshop; • recruitment and selection; • assertiveness training; and • training small groups.
To support the face-to-face programs and to provide flexibility and choice in training and development, a contract for the E-Learning platform ‘SkillSoft’ was secured for the next three years.
Providing the Right Work Environment All departmental policies have now been reviewed and aligned with the new Code and Values. A range of policies were also developed, reviewed and updated this year to provide choices for a healthy work/life balance for staff and to support them in the workplace. In line with the Public Sector General Agreement 2004, DLI’s policy on Personal Leave was initially developed as a pilot. Staff were invited to attend briefing sessions to be fully appraised of the intent and content of the policy, and were given the opportunity to have input into the final document. Other policies developed and/or reviewed this year included:
• Information Communication Technology (ICT Resources); • No Smoking Policy; • Contact Centre Draft Policy; • Leave Liability and Payout of Leave; • Grievance Management; • Purchased Leave; and • Payment of Professional Fees Policy.
Introduction of DLI’s New Phone System The Voice Over Internet Protocol (VOIP) project involved the introduction of a new telephony system to DLI. One of the major features of the new phone system was the marrying of voice communication with each staff member’s personal computer, and the capability to receive voice mail. The phones also supported specialised or advanced telephony features, enabling the department to customise and improve its call handling capabilities. This allowed DLI to introduce its first fully operational call contact centres.

Department of Land Information Annual Report 2004/2005 35
A comprehensive training program was coordinated by Strategic Human Resources to ensure the smooth implementation of this new phone system. Approximately 100 staff took part in the initial training, with the majority of participants being appointed ‘champions’. Champions agreed to be ambassadors for the new phone system and were the contact point for personnel during the implementation of the system. The training included a classroom component coupled with hands-on lessons. An actual working pilot contact centre was also established and tested with the champions prior to full implementation. Agency wide training was organised across DLI locations, and a range of reference materials were developed for staff including an e-learning program, instruction manuals and quick reference guides. The Peak Joint Consultative Committee (Peak JCC) The Peak JCC is a committee focused on communication between staff of all areas and is composed of both staff and management representatives. The Peak JCC has its own constitution which provides the terms under which it operates and guides the committee on meeting procedures, electoral procedures and issues suitable to present to the Peak JCC. The Peak JCC raises issues, investigates staff concerns, and provides and contributes to solutions and actions. Its main aim is to initiate quality programs for the advancement of staff welfare, and address employment issues. Over the past year, the Peak JCC has:
• continued to pursue the provision of parking for DLI staff with the City of Swan;
• contributed to the Agency Specific Agreement; and • led and contributed to staff consultation on a number of policies
affecting staff and the working environment. Discussions also commenced on aligning the Peak JCC with the JCC provisions in the Public Service General Agreement 2004. This will lead to the Peak JCC taking a different role on a joint committee comprising the Chief Executive (CE), CE nominated representatives and union representatives. This new approach will provide staff with more avenues to raise issues relevant to them, and will provide a way in which their feedback and comment can be addressed at a more senior level. Diversity and Wellness DLI has continued to strive to achieve equal employment opportunity through diversity in its workforce during 2004/2005. In ensuring work practices support equity and diversity, Strategic Human Resources has conducted a number of workshops aimed at developing and training staff in carrying out selection panel and convener duties during the recruitment process.

Department of Land Information Annual Report 2004/2005 36
A range of Grievance Management training sessions were also conducted, including general staff awareness sessions, Peer Support Officer training, management awareness sessions and a two day interactive workshop for managers. A total of around 650 staff, or approximately 75% of DLI’s workforce, attended these sessions. A comprehensive Diversity Survey was distributed to all DLI staff to update employee profiles on the Human Resource Information System, and to compile accurate information on the diversity of the department’s workforce. The results will be used to inform, develop and improve policies and programs relating to diversity governing the organisation. DLI also continued its commitment to attaining a diverse workforce by conducting a review of entry level recruitment practices to ensure the process encouraged the recruitment of people from diverse backgrounds. Employee Safety, Health and Wellness DLI’s strong commitment to the community led to the creation of a Wellness Calendar. This Calendar outlines a range of activities and charity causes that the agency contributes to, and participates in, including:
• National Families Week; • Harmony Week; • National Bandanna Day (Canteen); • Wear a Bear Day (PMH Foundation); and • ‘Casual Dress Fridays’, where the money was donated to a variety of
charity causes from the Tsunami Appeal to PAWS for a Cause. The Occupational Safety and Health Committee actively promoted employee safety and wellness including seminars and workshops on prevention of problems related to stress management, posture and general fitness. A program of training for first aid officers requiring new certificates and refresher courses was also implemented. The Committee also supported a workshop on managing stress as part of Worksafe Week, in which invitations were extended to Government and private sector organisations throughout the Midland community. Committee members also underwent training on new changes to Occupational Safety and Health legislation. Defibrillators were purchased for the Midland building and the office located at Mount Street, Perth, and associated training was provided to all first aid officers. Due to the high level of training and equipment at the Mount Street Office, it is now officially recognised as a “first responder site” in the St John’s Ambulance emergency system. Prior to the onset of winter, subsidised flu vaccinations were offered to all staff. Over 100 took advantage of the opportunity to be vaccinated in their workplace at either the Midland or Perth offices.

Department of Land Information Annual Report 2004/2005 37
Industrial Arrangements There has been no change in the industrial arrangements for DLI staff during the 2004/2005 financial year, with the majority of staff continuing to be employed under the Public Service General Agreement 2002. Negotiations for a replacement general agreement have taken place, with the Public Service General Agreement 2004 being lodged for registration. DLI, along with other agencies, was consulted by Government as part of the negotiation process. The DLI Agency-Specific Agreement has also continued to apply for hours of work arrangements. Following extensive consultation with staff regarding DLI's transition to a statutory authority, Strategic Human Resources undertook further discussions with the CPSU/CSA, and central Government agencies in order to finalise the staffing arrangements that will apply once DLI becomes a statutory authority. In October 2003, Cabinet endorsed the proposed staffing arrangements when it approved the drafting of a Bill to establish the statutory authority. This will include changes to the industrial arrangements for current staff. Staff appointed or promoted after the establishment of the statutory authority will be employed under the authority’s enabling legislation and will be covered by the Government Officers’ Salaries, Allowances and Conditions (GOSAC) Award and General Agreement. Existing staff will transition to the new authority as public servants for a period of 24 months at which point they will transfer to GOSAC. While these new arrangements will not result in a material change to current employment conditions, they will align the statutory authority's staffing arrangements with those of other commercially focused statutory authorities. DLI will continue to consult with staff on the impact of these arrangements as the transition to a statutory authority progresses. Employee Profile
2004/2005 % of employees
Business Services 5.90 Information Access 17.19 Information Management 14.58 Information Services 56.17 Office of Chief Executive 1.49 WA Land Information Systems 1.12 Strategic Planning and Development 3.55 DLI’s average FTE level for 2004/2005 was 803.05 full-time equivalent employees. During the year 204 vacant positions were filled on a permanent or fixed term basis.

Department of Land Information Annual Report 2004/2005 38
Workers’ Compensation Statistics for 2004/2005
2003/2004 2004/2005
Number of claims 8 10 *Lost time injury/disease frequency rate 40.09 61.4 Estimated cost of claims incurred per $100 wage roll
0.62 0.3674
Premium rate 0.38 0.39 *Lost time injury/disease frequency rate – the number of lost time injuries/diseases where one day or more was lost expressed per million hours worked in this financial year (calculated based on Risk Cover parameters). EAP usage rate
2003/2004 2004/2005
Employee Assistance Program Usage Rate 6.5%* 9.2%** * 6.5% is actual figure for 2003/2004. A projected figure of 5% was reported in last year’s
Annual Report. ** Projected annual rate.

Department of Land Information Annual Report 2004/2005 39
Public Sector Standards and Ethical Codes Compliance Statement My report in line with the Commissioner’s guidelines is as follows: In the administration of the Department I have complied with the Public Sector Standards in regards to: Recruitment, Selection and Appointment, Transfer, Secondment, Redeployment, Termination, Discipline, Grievance Resolution, the Western Australian Code of Ethics and our Code of Business Conduct. I have put in place sufficient internal controls and checks designed to ensure such compliance to satisfy myself that the above statement is correct. Breach of Standard Claims 2004/2005 One breach of standard claim was lodged during the year. Breach of Standards There were no breaches of Standards found. Investigations No investigations were undertaken during the year by the Office of Public Sector Standards Commissioner in accordance with Section 24 of the Act. Compliance Audits No compliance audit was undertaken during the year by the Office of the Public Sector Standards Commissioner. Grahame Searle Chief Executive

Department of Land Information Annual Report 2004/2005 40
Customers, stakeholders and community relations Strategic Planning Framework contribution: Goal 1 – People and Communities Goal 5 - Governance Customer Focus As a customer-focused organisation, the provision of quality customer service is integral to achieving DLI’s strategic vision for the future. DLI’s Customer Service Charter, Code of Business Conduct and Values, outline guidelines for customer services and ethical behaviour. Our commitment to our customers is that DLI will:
• Continuously improve the quality of our products and services to meet our customers needs;
• Ask our customers for ways to improve our products and services and act on their suggestions whenever possible;
• Develop and use the most appropriate technology to improve efficiency and to keep down the costs to our customers; and
• Communicate back to our customers the feedback we obtain from our customer surveys.
Surveying our Customers Throughout the year DLI has gathered information from our customers about current and proposed products and services through a market research program. DLI conducted several marketing and feedback surveys this year to determine customer awareness and satisfaction levels of DLI’s products and services. In August 2004 DLI conducted an extensive Customer Satisfaction Survey. The objectives of the survey were to measure and compare against the benchmark survey conducted in 2002 in the following areas:
• Overall perceptions of DLI’s service; • Customer satisfaction levels; and • Customer use of distribution channels and future preferences for DLI’s
delivery channels
In addition to the above, the survey also gathered information about:: • Perceptions of DLI in comparison with a range of other Government
organisations; and • Awareness of DLI’s moves towards becoming a statutory authority and
perceptions of this change.
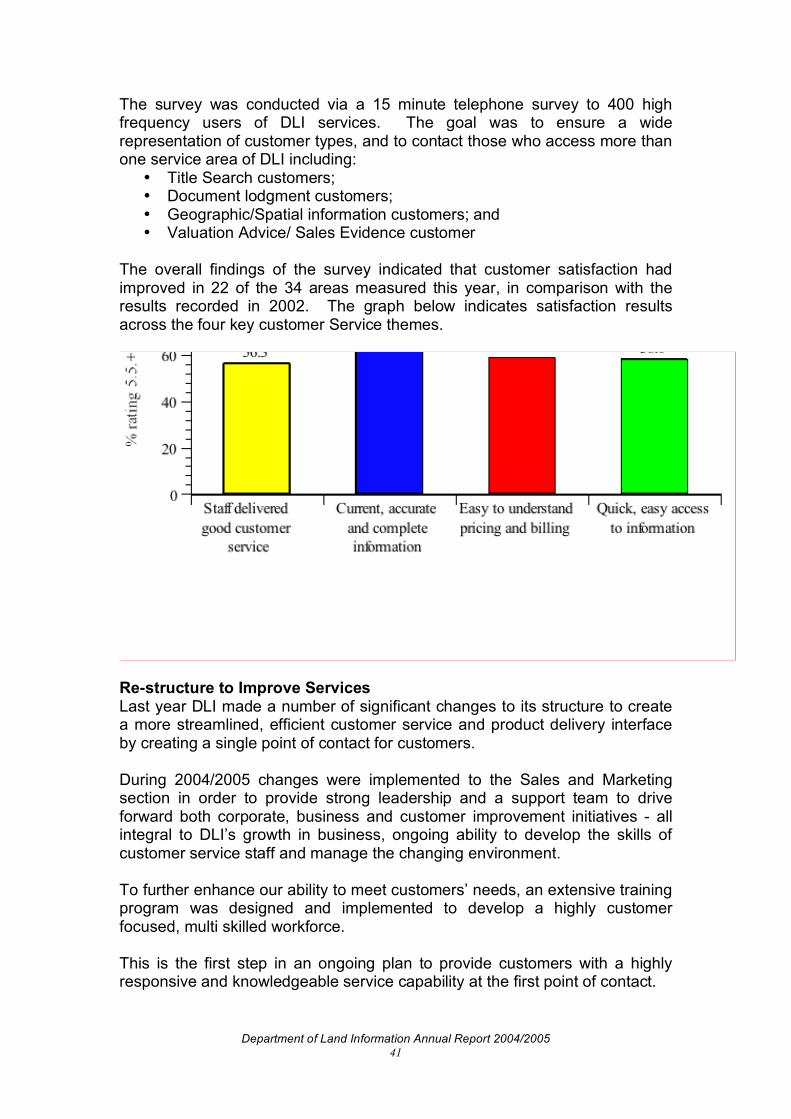
Department of Land Information Annual Report 2004/2005 41
The survey was conducted via a 15 minute telephone survey to 400 high frequency users of DLI services. The goal was to ensure a wide representation of customer types, and to contact those who access more than one service area of DLI including:
• Title Search customers; • Document lodgment customers; • Geographic/Spatial information customers; and • Valuation Advice/ Sales Evidence customer
The overall findings of the survey indicated that customer satisfaction had improved in 22 of the 34 areas measured this year, in comparison with the results recorded in 2002. The graph below indicates satisfaction results across the four key customer Service themes.
Re-structure to Improve Services Last year DLI made a number of significant changes to its structure to create a more streamlined, efficient customer service and product delivery interface by creating a single point of contact for customers. During 2004/2005 changes were implemented to the Sales and Marketing section in order to provide strong leadership and a support team to drive forward both corporate, business and customer improvement initiatives - all integral to DLI’s growth in business, ongoing ability to develop the skills of customer service staff and manage the changing environment. To further enhance our ability to meet customers’ needs, an extensive training program was designed and implemented to develop a highly customer focused, multi skilled workforce. This is the first step in an ongoing plan to provide customers with a highly responsive and knowledgeable service capability at the first point of contact.

Department of Land Information Annual Report 2004/2005 42
Since December 2004 to June 2005, Sales and Marketing recorded a significant increase in the number of calls handled at first contact. Plans are currently in place to further streamline our Customer Contact Centres. Reduction of call abandonment rates has been a major focus of our contact centre improvement initiatives since February 2005. Beginning with the appointment of a new Contact Centre Coordinator in January, measures were introduced to achieve incremental improvements in the service provided to DLI customers.
Sales & Marketing Queues
Call Abandonment Rates
March - June 2005
0
5
10
15
20
25
30
35
40
45
50
55
Week Ending 11/3/05 Week Ending 8/4/05 Week Ending 6/5/05 Week Ending 3/6/05 Week Ending 1/7/05
%
7333
7341
7555
CombinedIntroduction of
DLI's VOIP
telephone
system
As the above graph shows, abandoned calls were reduced from an unacceptably high rate of over 50% for our Tenure Information line to less than 25% of calls by May. Our Online Support line saw abandonment rates reduced from almost 35% to fewer than 15% in the same period. With the introduction of DLI's new Voice Over Internet Protocol telephone system from late April/early May 2005, these gains have continued. By the end of June 2005, abandonment rates on the major Sales and Marketing inbound lines were consistently reduced to below 5% – and it is anticipated that further improvements will occur over the coming months.
This reflects our commitment to improve the level of service provided to DLI customers.

Department of Land Information Annual Report 2004/2005 43
Customer Service Council DLI strives to improve its products and services through staff training, innovation, technological developments and consultation with customers. Reflecting its commitment to excellence in customer service DLI has, since 1995, convened a Customer Service Council. The Council meets quarterly and provides important input on a range of issues that affect customers and stakeholders. The objective of the Council is to provide DLI’s customer representatives with a forum for influencing DLI’s strategic direction, raising customer concerns, providing feedback on DLI’s activities, and to enhance the provision of a quality service that is subject to continuous improvement. The present committee members are:
Representative Department Grahame Searle Department of Land Information (DLI)I Andrew Burke DLI Gary Fenner DLI Giles Nunis DLI Dave Glasson DLI Rick Murphy DLI Dr Marnie Leybourne WALIS Kareena Ballard Real Estate Industry Dr Henry Esbenshade Landcare/Pastoralists/Farming John Sheridan Australian Property Institute Mara Karabanovs Conveyancing Industry Lionel Johnston Australian Institute of Conveyancing Colin Heath Land Advisory Committee David Clark Legal Industry Garry Spencer Australian Spatial Information Business
Association (ASIBA) Robin Piesse DLI
During the past year, the Council has helped fine-tune a number of DLI business practices and commented on a range of service delivery projects. The Council continues to provide feedback on DLI products and services and to bring member issues forward for consultative changes. This year DLI provided the Council with regular updates on the ongoing transition processes for DLI becoming a statutory authority, progress on the mainframe decommittal project and information on the Shared Land Information Platform (SLIP) initiative. Several presentations were also provided to the Council. These included:
• Launch of DLI Values – Meg Somers (Manager, Strategic Human Resources)
• SLIP (as presented at the WALIS Forum) – Andrew Burke (Executive Director, Information Management)
Department of Land Information Annual Report 2004/2005 44
• Results of the 2004 Customer Satisfaction Study – Dave Glasson,
Manager Sales and Marketing • Landgate: Land Enquiry System and Customer Remote Search
replacement – Tamara Rae and Kim Vagg (Project Leader, Land and Property Market section)
Major items raised during the year included:
• the ongoing increase in business activity across most areas of industry – land development , survey and conveyancing industry all experienced an increase in this area over the last 12 months; and
• the creation of a water registry. There were four new members appointed to the Council:
• Dave Glasson – DLI • Robin Piesse – DLI • Marnie Leybourne – WALIS • Giles Nunis – DLI
Recognition is paid to outgoing members of the Council:
• Ian Hyde - DLI • Chris Costley - DLI • Kelsie Donovan - DLI • Anne Arnold - the Mining and Exploration industry.
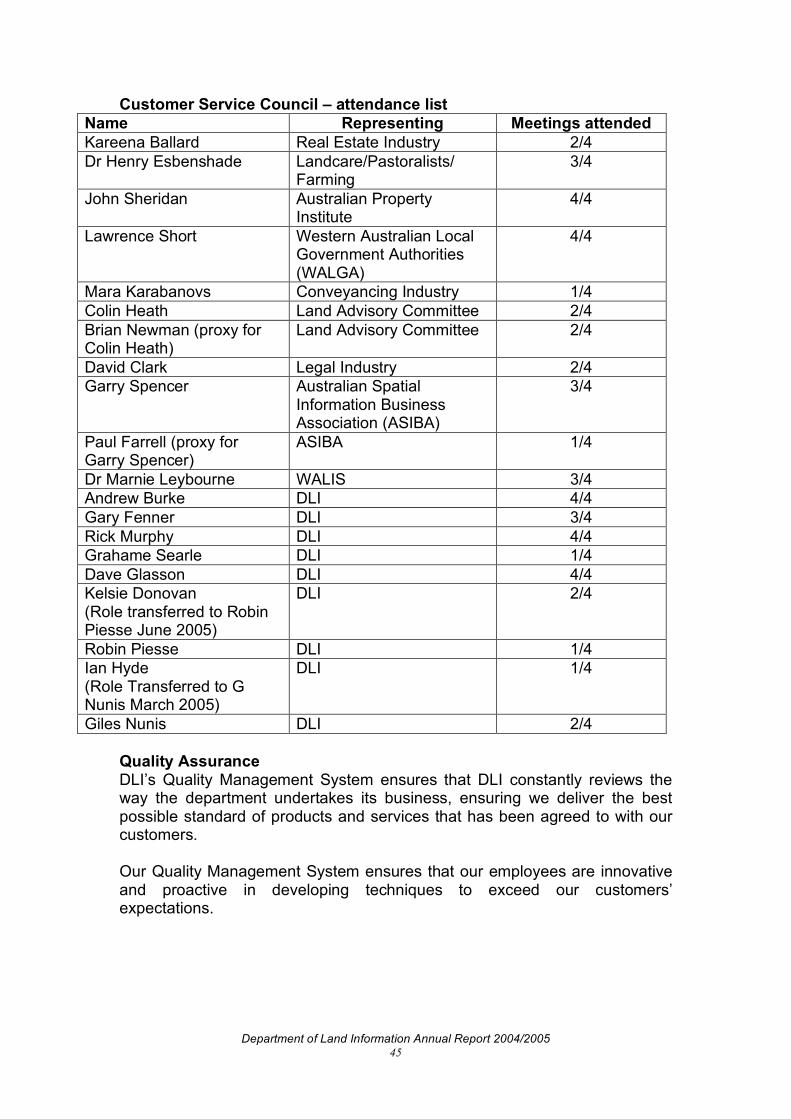
Department of Land Information Annual Report 2004/2005 45
Customer Service Council – attendance list Name Representing Meetings attended Kareena Ballard Real Estate Industry 2/4 Dr Henry Esbenshade Landcare/Pastoralists/
Farming 3/4
John Sheridan Australian Property Institute
4/4
Lawrence Short Western Australian Local Government Authorities (WALGA)
4/4
Mara Karabanovs Conveyancing Industry 1/4 Colin Heath Land Advisory Committee 2/4 Brian Newman (proxy for Colin Heath)
Land Advisory Committee 2/4
David Clark Legal Industry 2/4 Garry Spencer Australian Spatial
Information Business Association (ASIBA)
3/4
Paul Farrell (proxy for Garry Spencer)
ASIBA 1/4
Dr Marnie Leybourne WALIS 3/4 Andrew Burke DLI 4/4 Gary Fenner DLI 3/4 Rick Murphy DLI 4/4 Grahame Searle DLI 1/4 Dave Glasson DLI 4/4 Kelsie Donovan (Role transferred to Robin Piesse June 2005)
DLI
2/4
Robin Piesse DLI 1/4 Ian Hyde (Role Transferred to G Nunis March 2005)
DLI 1/4
Giles Nunis DLI 2/4 Quality Assurance DLI’s Quality Management System ensures that DLI constantly reviews the way the department undertakes its business, ensuring we deliver the best possible standard of products and services that has been agreed to with our customers. Our Quality Management System ensures that our employees are innovative and proactive in developing techniques to exceed our customers’ expectations.

Department of Land Information Annual Report 2004/2005 46
Currently, Information Access and Information Services Divisions have implemented and maintain a Quality Management System across some of their Branches which conform to the AS/NZS ISO9001:2000 standards. These are:
• Registration Services Branch – for the provision of land registration services. This includes the geodetic network, audit of freehold, strata sub divisional plans, the creation of new certificates of title from those plans, the registration of interests in freehold, provision of advice and maintaining and upgrading databases and facilities that supports those provisions.
• Geographic Services Branch – for the provision of geographic land
information including Aerial Photography, Geographic Names, Property Street Addresses, Topographic Data and Native Title Information.
• Sales and Marketing Branch - for the provision of online information
support, hard copy tenure, and mapping products and services in accordance with relevant legislation. This includes current and historical Land Tenure, Survey Information, Aerial Photography, Topographic and Thematic Mapping.
These branches are re-certified on a three year basis following external audits conducted by Benchmark Pty Ltd. Currently DLI has 49 certified and trained quality assurance internal auditors who conduct independent appraisals of work instructions throughout the year within their respective accredited branches. Management review meetings for each branch are held annually to discuss and resolve any issues raised during internal and external Quality Audit processes that are conducted throughout the year. The conscientious application by staff of the quality processes and procedures of our Quality Management System, and the ongoing improvement and maintenance of our Quality Management System ensures that we meet our clients’ expectations and our own highest possible standards of performance. The Quality Assurance team are reviewing the DLI’s current Quality Management System for a replacement system that is integrated with current applications within DLI. Customer Feedback DLI’s Customer Feedback System is documented under the Quality Management System and is certified by external auditors from Benchmark Pty Ltd to AS/NZS ISO 9001:2000. The Customer Feedback procedure has been written to be compliant to AS 4269 – 1995 Complaints Handling.

Department of Land Information Annual Report 2004/2005 47
This procedure is contained in an electronic database accessible to all DLI staff. The Manager, Sales Support, Sales and Marketing Branch has ownership of the procedure and is responsible for feedback monitoring and analysis. The aim is to create effective improvements to DLI’s Quality Management System in order to achieve increased customer satisfaction. The procedure also contains the following reference documents:
• complaints handling policy; • complaints management in DLI - guidelines for staff; and • protocol for telephone calls from customers that need to be referred to
other staff. The feedback procedure was externally audited in December 2004 by Benchmark Pty Ltd and was found to be compliant. Several suggestions were made during the audit including expanding feedback mechanisms and survey cycles, and strategies to manage this are currently being put in place. Customer Feedback is received in a number of different ways:
• telephone, including the DLI customer feedback line 1300 365 288, published in the Telstra white pages and answered by trained staff who are able to accept feedback and enter directly into the feedback database;
• customer feedback forms placed at counters; • customer surveys using the customer feedback forms; • fax and mail; • e-mail; • feedback buttons on DLI’s corporate, Landgate and Landonline web
sites in line with as 4269 – 1995 complaints handling protocols; • one-on-one meetings; and • an internal e-mail feedback form designed to easily capture internal
and external feedback. The graph below shows the levels of feedback received via each method:
Method of Receiving Feedback %
50%
7%4%
15%
8%0% 7% 1%
0%1%
0%
2%
1%
4%
Customer Survey Response
Fax
Fax Back Survey
Hotline
In Person
Internal Quick Email
Internet Feedback Line
LandonLine Feedback
Portal
RSB Survey
Telephone
Unknown Origin

Department of Land Information Annual Report 2004/2005 48
Selected staff are trained as Customer Liaison Officers (CLOs) to handle the co-ordination and data capture of customer feedback. The CLOs enter the feedback into an electronic database and assign responsibility for feedback to the relevant staff member via e-mail. Each CLO then monitors the feedback to ensure it is addressed within a reasonable timeframe. Feedback is allocated a priority of between three and 21 days for a response to be generated, depending upon its nature. This year DLI has investigated several options to improve its current Customer Feedback System. From these investigations recommendations to enhance DLI’s current system have been made and are scheduled for release in December 2005. Enhancements will include:
• improved reporting to gain a better understanding of our strengths and weaknesses; and
• increasing the effectiveness of actions taken to resolve customer issues and suggestions.
In 2004/2005, 425 entries were captured compared to 524 entries for the previous corresponding period. The decrease in responses entered into the system is due to several reasons. Limited solicited feedback was sought from our fax or email customer groups due to the running of the Customer Service Study research and changes to the DLI email system resulted in access limitations to CLOs. Overall, the responses received and recorded in the Customer Feedback Database indicates a 55% customer satisfaction. Although there was a decrease in the amount of feedback received, it was pleasing to note that DLI received a high level of praise in regards to the provision of quality service. This suggests that customers are generally well serviced, with 221 praises received in this area. The majority of complaints regarded quality of product, with 50 complaints received concerning this.
Total Feedback % (Praise)
76.6%
14.7%
3.5%
1.3%
0.0%
0.0%
3.9%
Sales & Marketing
Registration Services
Geographic Services
Satelite Remote Sensing
Valuation Services
Application Services
Product Services & Delivery

Department of Land Information Annual Report 2004/2005 49
Total Feedback % (Complaints)
82%
10%
4%
0%
0%
2%
2%
Sales & Marketing
Registration Services
Geographic Services
Valuation Services
Satelite Remote Sensing
Application Services
Product Services & Delivery
Total Feedback % (Suggestions)
80%
8%
2%
0%
4%
2% 4%
Sales & Marketing
Registration Services
Geographic Services
Satelite Remote Sensing
Application Services
Valuation Services
Product Services & Delivery
Annual Category Percentages for 04-05
55%29%
12%4%
Praise
Complaint
Suggestion
Enquiry

Department of Land Information Annual Report 2004/2005 50
Nature of Contact %
2%
3%
11%
0%
5%
8%
12%
54%
5%
Appropriateness/Accuracy
Cost
Enquiries
Privacy
Product Content
Product Unavailable
Quality of Product
Quality of Service
Timeliness
Customer Forums, Exhibitions Throughout the year, DLI participated in several forums, exhibitions and regional agricultural field days to raise awareness of its products and services. Static display and information booths featured DLI’s aerial photography, maps, satellite imagery and valuation services and gave many people the opportunity to discuss their requirements with DLI’s expert staff. These events included: Event Name Date Market
Easiforms launch Jun/Aug 204 conveyancing, legal and finance industries
WA on Show (Perth Convention Centre) August 2004 general public,
Government Australian Property Institute State Conference August 2004 valuers, analysts and
facilitators
Local Government Week August 2004 middle and upper management, councillors (local government)
Dowerin Field Days August 2004 farmers and agri-business Newdegate Machinery Field Day September 2004 agriculture
State Landcare Conference for Agriculture Sustainability
October 2004 agriculture
12th Australasian Remote Sensing and Photogrammetry Conference
October 2004 Government, agriculture, industry
Spring Home Show 04 October 2004 general public, building industry
Local Government Managers’ Association State Conference
October 2004
local government authority members, financial controllers, Chief Executives

Department of Land Information Annual Report 2004/2005 51
Event Name Date Market
International Map Traders Association October 2004
retailers, wholesalers, suppliers and related industries from Australia and Asia
WALIS Forum February 2005 State Government and private sector
International Women's Day March 2005 Midland business
community and DLI staff SLIP - Celebration March 2005 Government WA Caravan and Camping Show March 2005 general public
Satellite Remote Sensing Services Open Day May 2005 general public
Conferences/Seminars There was a high level of involvement by DLI staff in national committees and stakeholder conferences/seminars during 2004/2005. All DLI staff who attended national and international conferences were required by the Chief Executive to either prepare reports or give presentations on their experiences. These reports were placed on DLI’s intranet, for the information of all staff.
Meeting the Needs of All Our Customers DLI has a Disability Service Plan and a Languages Services Policy that promote inclusion of all its customers when considering improvements to services and products. Diversity outcomes for customers maintained or achieved this year are summarised below. Community Focus DLI prides itself on its relationship with the community and during the past year the agency conducted the following programs:
• International Women’s Day DLI celebrated its eighth International Women’s Day breakfast in March 2005. Partly sponsored by StateWest Credit Society, the breakfast presented the opportunity for DLI staff and Midland business people to socialise in an informal environment. Paralympian Priya Cooper appeared as the guest speaker, and provided a highly entertaining and inspiring presentation.
• Satellite Remote Sensing Services Open Day For the first time, DLI’s Satellite Remote Sensing Services section hosted an open day for the general public on May 14, 2005. Held at its Floreat office, over 100 people were taken on individual guided tours and were able to view first-hand the diverse work carried out by the section. A question and answer competition for children was also held. The day proved so popular that another has been planned for 2006.

Department of Land Information Annual Report 2004/2005 52
0.00
200.00
400.00
600.00
800.00
1000.00
1200.00
1400.00
1600.00
1800.00
2000.00
AM
OU
NT
RA
ISE
D
Nat
iona
l B
anda
nna
Day
(Ca
nte
en
)
Pin
k R
ibbo
n D
ay (
Can
cer
Co
un
cil)
Wea
r A
Bea
r D
ay (
PM
H
Fo
un
da
tion
)
Aus
tral
ia's
Big
gest
Mor
ning
Tea
(C
ance
r C
ounc
il)
PA
WS
for
a C
ause
(R
SP
CA
)
Go
Cas
ual f
or a
Cau
se
(Cer
ebal
Pal
sy A
ssoc
iatio
n)
Wis
h D
ay (
Mak
e-A
-Wis
h
Fo
un
da
tion
)
PM
H F
ound
atio
n
Koo
lkun
a E
aste
rn R
egio
n
Dom
estic
Vio
lenc
e N
etw
ork
Juve
nile
Dia
bete
s R
esea
rch
Fo
un
da
tion
TO
TA
L
MONEY RAISED FOR CHARITY
CHARITIES SUPPORTED THROUGH
MERCHANDISE SOLD
CHARITIES SUPPORTED THROUGH
CASUAL DRESS FRIDAYS
• Charity Support DLI staff continued to demonstrate their dedication and care to the community over the past year by digging deep in support of the charity causes and events that have been promoted within DLI.
Over the past year, a total of $1955.50 was raised altogether. The sale of bandannas for National Bandanna Day (Canteen) proved to be the most successful of the charity events, which was followed closely by the events associated with RSPCA and the PMH Foundation. DLI continued to participate in ‘Casual Dress Fridays’ each week, where a gold coin donation was given to various local and national charities.

Department of Land Information Annual Report 2004/2005 53
Disability Service Plan Outcome 1: Services are adapted to ensure they meet the needs of people with disabilities.
• Staff are encouraged to report any specific services and products that need to be adapted for people with disabilities. There were no reports for improvements this year.
• The Customer Feedback Database is monitored for suggestions on improving service delivery and products for people with disabilities. There were no suggestions recorded for improving services or products during 2004/2005.
• Occupational Safety and Health Committee (OS and H) representatives now audit each physical area of DLI at least three times annually. Staff have an opportunity to raise any access issues with the representatives or they can be pro-actively identified (by the representative) when doing audits. Any issue identified that cannot be remedied locally is referred to the OS and H Committee to address.
• The contents of our web pages and online services have been assessed against W3C Web Content Accessibility Guidelines and changed to meet those guidelines.
Outcome 2: Access to buildings and facilities is improved.
• A courtesy wheelchair is available to customers on request at the Information Desk in the Customer Service Hall at Midland.
• Emergency evacuation procedures were put in place for people with disabilities, in the event of lifts not working.
• Emergency Warning Intercommunication System strobe lights are installed in accessible toilets to alert people with hearing impairment of an emergency evacuation.
Outcome 3: Information and services provided in formats that meet communication needs of people with disabilities
• 2005 StreetSmart Street Directory depicts traffic lights that have some form of audible (clicking sound) or tactile (dimpled slab surface) pedestrian facility with a thick green circle. (It should be noted that these guides may not include all directions of crossings at the indicated set of traffic lights).
• Better hearing kits providing advice to staff on assisting customers with hearing impairment are located at public counters.
• Customers are made aware that information can be made available in alternative formats upon request where practical.
• DLI translator database on Lotus Notes also includes those that can communicate using Auslan (for hearing impaired).

Department of Land Information Annual Report 2004/2005 54
Outcome 4: Advice and services are delivered by staff who are aware of and understand the needs of people with disabilities
• DLI staff who are Auslan interpreters are now included on the DLI Telephone Directory.
• Induction Program – The new formal Induction Program has been upgraded to include reporting on Disability Services issues.
• Carriage and responsibility of the Disability Services Plan has now been officially allocated to the Diversity Management Committee.
Outcome 5: Opportunities are provided for people with disabilities to participate in public consultation, grievance mechanisms and decision-making processes
• Complaint and Customer Feedback mechanisms are available in appropriate formats for people with disabilities.
• Contact name, phone and fax number, web site address and telephone typewriter (TTY) number are included on all printed pamphlets and publications (including letterhead).
• DLI translator database on Lotus Notes also includes those that can communicate using Auslan (for hearing impaired).
Languages Services Policy Outcome: Language is not a barrier to service for customers with limited English fluency or hearing impairments
• Better Hearing Kits are available in customer service areas in metropolitan and regional offices.
• A Language Skills Register is maintained that lists staff who can speak, read or write in languages other than English, to assist customers in the first instance. Staff are available to assist in over 20 languages. This assistance does not replace access to the Commonwealth Translating and Interpreting Service.

Department of Land Information Annual Report 2004/2005 55

Department of Land Information Annual Report 2004/2005 56
Products and Services (by Outcomes) LAND INFORMATION Contribution to the Strategic Planning Framework: Goal 2 – The Economy Goal 4 – The Regions Goal 5 - Governance Desired Outcome The State’s administrative, commercial and social systems are supported by a land information base and certainty of ownership and other interests in land. Record Business Levels Registration Services Branch has delivered exceptional service to its customers in a record year of business for the Branch. The financial year of 2004/2005 saw 406,225 documents lodged. This was 6,067 more than the previous financial year and was the largest number of documents ever registered in the history of DLI. In addition, the total number of new lots created during 2004/2005 was 30,648 - the highest figure since 1994/95. The land value of these registered transfer documents was $30.1 billion. The amount of finance secured by these registered documents was $45 billion. All of these transactions are secured and registered under the State Guarantee of Title in accordance with the Transfer of Land Act 1893. QA Accreditation Registration Services Branch maintained their Quality Assurance certification to AS/NZS ISO 9001:2000 standard and is accredited for the provision of land registration services. This includes the audit of the geodetic network, freehold, Crown and strata sub-divisional plans; the creation of new certificates of title from those plans; the registration of interests in both freehold and Crown land; provision of advice; and maintaining and upgrading databases that support those processes. National Parks The Land Boundary Services, Statutory Spatial Section was involved in the preparation of Deposited Plans and technical descriptions which created 33 National Parks, 10 Conservation Reserves, 7 Nature Reserves and 6 “A” Class Reserves. These areas were declared by the Department of Conservation and Land Management by Reserve Bills No 63 of 2004, No 66 of 2004 and No 79 of 2004.

Department of Land Information Annual Report 2004/2005 57
National Standard created DLI contributed to the creation of a National Standard for the exchange of survey data at interstate and overseas meetings of the Intergovernmental Committee on Surveying and Mapping (ICSM). The final draft model of the National Standard for the exchange of survey data is scheduled for completion by July 2005. E-Surveys Release 2 The second phase of the E-Surveys project was introduced. This project involves the automatic update of Smartplan as land titles are created in the SmartRegister system for new sub-divisions. The anticipated savings of streamlining this process is estimated to total $250,000. The total processing time for surveys in Smartplan will be reduced by up to 10 days, and reduces the manual entering of data into Smartplan by 70 to 80%. Customers will benefit from more timely and accurate information being available. This project follows the initial E-lodgement of Surveys project, which allows surveyors to lodge deposited plans and fieldbooks electronically by email. Updates and Improvements Several Data Quality Improvement Projects were completed including spatial upgrade of the cadastre in numerous South West townsites. Following extensive industry consultation on the implementation of a standard plan process, a review of the current format and processes for strata/survey plans was completed. This standard plan process will facilitate the introduction of electronic strata plans. The implementation of electronic lodgements and introduction of standardised lodgement fees for plans comes into effect on 4 July 2005. Topographic Restructure Project Topographic data is an important dataset that is used by a diverse range of communities including Emergency Services, environmentalists, Government, landcare communities, the mining industry, planners, property developers, the utility industry etc. The topographic database provides important information relating to natural and man made features. Information systems that support decision making (Geographic Information Systems – GIS) require well structured spatial information. Since the Topographic Restructure Project began in November 2003, the base computer aided drafting (CAD) data has been undergoing significant restructuring in preparation for its loading into a new Topographic Database, in order for it to be used by GIS. During the restructuring the data is being cleansed of spatial and attribute anomalies. The best available data held by different Government agencies is also being integrated.

Department of Land Information Annual Report 2004/2005 58
Discussions with other agencies are progressing to formalise partnerships with a view to developing methodologies and data exchange protocols for the ongoing maintenance of the data. Development of the new Topographic Database, including editing and quality checking tools to manage and maintain the data, is continuing. Rangeland surveys The State Rangelands Survey program continued to provide valuable resource management information to the pastoral industry. The section maintains close support links to the Pastoral Lands Board (PLB) within the Department for Planning and Infrastructure, supplying field expertise, mapping services and articles for the PLB newsletter ‘Pastoral Lines’. The following projects made up the bulk of the work performed by the section throughout the last financial year:
• Lower Murchison – the formal report on the mapping of 13,000 square kilometres of country east of Kalbarri along the Murchison River, which was completed in 2003/2004, was in preparation. This survey completed a gap that existed between the rangeland resource surveys to the north and east, and the state soil survey program in the south.
• Pilbara - the printing of the Pilbara Ranges Survey technical report ‘An
Inventory And Condition Survey Of The Pilbara Region Of Western Australia’ and its sister report entitled ‘The Pastoral Resources And Their Management Of The Pilbara Region Of Western Australia’ was completed in 2004/2005. To complete this package, individual pastoral lease maps have been compiled and distributed with the reports to all stakeholders in the Pilbara. This combined 600 page report is the most comprehensive description of the natural systems of the Pilbara ever published. The first section focuses on the natural resources of the region: its vegetation, landscape, soil, history, climate, ecology, geomorphology and ground water availability; whilst the second part focuses on the condition of all those resources and has a more pastoral slant. Both are invaluable resources for those with interests in land use planning and sustainable development in the Pilbara rangelands
• Nullarbor – With the completion of the Pilbara project this survey has
been restarted and will proceed through to 2006. New and more efficient survey and mapping techniques are currently being tested in response to a recently negotiated agreement for DLI to complete its obligations to the rangeland survey program in 2008.
• Future projects - The survey program for the remainder of the state,
after the Nullarbor, comprises the Southern Goldfields centred around Kalgoorlie and extends eastward to meet the Nullarbor region. This would see the completion of the program of regional rangeland surveys across the entire pastoral area of Western Australia. The outcome of this is a state-wide and consistent, natural resource GIS that will be used for state and regional planning, and management for both the conservation and pastoral estate as countenanced in the Western Australian State Sustainability Strategy (2003).

Department of Land Information Annual Report 2004/2005 59
Community Titles Advisory Committee The Community Titles Advisory Committee was formed in late 1997 to meet the then Government’s commitment to the ongoing review of the Strata Titles Act. In early 2004 the Minister for Land Information approved the re-constitution of the Committee for a further two-year term from April 2004 to March 2006. The Committee continues to assist DLI with its current review of parts of the Strata Titles Act 1985. The objectives of the Community Titles Advisory Committee are to consider proposals for legislative change in relation to properties with separate lots and shared services. DLI provides administrative and operational support to the Committee. Non-Government members of the Committee are paid a sitting fee of $50 per meeting. During the financial year the Committee considered topics under review as part of the review project being conducted by DLI. Members of the Community Titles Advisory Committee liaised with the DLI officers undertaking the review to develop solutions to any problems identified. The Committee also developed an education booklet to inform the public on living in strata schemes. This booklet is likely to be published by DLI in 2005/2006. The Committee also reviewed the drafting instructions prepared by DLI for the following topics:
• mediation; • insurance; • termination of Schemes; • “Separation” of the Strata Titles Act (a better organisation of the layout
of the statute); and • minor amendments (small changes to improve the useability of the
statute by means of clarification, updating and cross-referencing). Other matters considered by the Committee during 2004/2005 were:
• the operation of the by-laws within the Strata Titles Act; • the certification of plans by surveyors; • proposed changes to the Strata Titles General Regulations; and • the strata plan processes and format.
These matters will require further consideration by the Committee in 2005/2006. Other topics to be considered by the Committee during 2005/2006 will be:
• the operation of section 43 of the Strata Titles Act and other connected information provisions such as Section 69;
• development issues for strata and survey-strata schemes; and • leasehold strata and strata of Crown land.

Department of Land Information Annual Report 2004/2005 60
The Committee Members July 2004 to June 2005 were: Name Representing Meetings
attended Ed McKinnon (Chair) Land Surveyor and Company Director 6/7 Paul Turner
Department for Planning and Infrastructure
7/7
Robert Kronberger Replaced by Clive Raymond
Office of the Strata Title Referee/Department of Justice
3/3
0/2 Terry McCarthy Western Australian Municipal
Association 4/7
Peter Verschuer/Kevin Kannis
Water Corporation 5/7
Peter Munday Real Estate Institute of Western Australia
7/7
Mara Karabanovs Australian Institute of Conveyancers 2/7
Frank Poeta Urban Development Institute of Australia 5/7
David Clark Law Society of Western Australia 3/7 David Hoops Spatial Sciences Institute 5/7 Jake Kneebone Strata Titles Institute of Western
Australia 6/7
Greg Vellacott Single-Tier 6/7 Frances Maber Multi-Tier 4/7 Ruth Geneff Multi-Tier 5/7 Charles Noble Replaced by Graham Marion
DLI 2/2
4/4 Bruce Roberts (Registrar of Titles) Deputised by Barry Cribb
DLI 4/6
1/1
Eric Horlin (Executive Officer)
DLI 7/7

Department of Land Information Annual Report 2004/2005 61
Geographic Names Committee The Geographic Names Committee is appointed by the Minister for Land Information to provide advice on the naming of townsites, suburbs, localities, roads and other features. It met four times in 2004/2005. Members and their attendance (including attendance by deputy) was: Name Representing Meetings
attended Gary Fenner (Chairman)
DLI 4/4
David Reynolds Main Roads Western Australian 4/4 Russell Burnett Urban Development Institute Of
Australia (WA Division) 4/4
Tony Caravella State Records Office 3/4 Douglas Brown Australia Post 4/4 Brian Williams Department of Industry and Resources 4/4 Representative Department of Indigenous Affairs 0/4 Janice Goodacre WA Local Government Association 1/4 Jo Harrison-Ward Fire and Emergency Services Authority 1/4 Brian Goodchild (Secretary)
DLI 4/4
In 2005 the Hon Alannah MacTiernan MLA, Minister for Planning and Infrastructure, delegated the naming responsibilities in the Land Administration Act 1997 to the Hon John Bowler MLA, Minister for Land Information. Minister Bowler has endorsed the Committee’s structure and guidelines, but has decided to increase community participation in the Committee by increasing the number of local government representatives from one to two. During the year the Committee completed the major task of defining the names and boundaries for localities and suburbs for all 144 local governments within the state. The remaining three local governments of Halls Creek, Quairading and Westonia were completed, and now the Committee’s only remaining work on the project will be fine tuning the boundaries and new suburbs in urban growth areas. There were only three minor boundary changes during the last year. Although the 1287 new road names approved in 2004/2005 is not as high as last year’s record of 1395, it is the second largest number on record, and reflects the continued high level of urban growth. The themes for new roads remain many and varied as developers strive to promote the unique characteristics of new developments. Themes include precious minerals and stones, golf courses, nautical, country lifestyle, inventors, rivers, sailing ships, parks and gardens and Australian pastoral. Four of the more unique are European artists in Tapping, livestock breeds in Eaton, lettuce varieties in Darch and a business theme in Wangara. The contribution of the late Professor Leslie Marchant to the state has been recognised in the naming of Point Marchant, located just west of Bunker Bay near Cape Naturaliste.

Department of Land Information Annual Report 2004/2005 62
Geographic Names Committee – Name Approvals
New Amended Deleted 2004/2005 (03/04) 2004/2005 (03/04) 2004/2005
(03/04) Roads 1287 (1395) 698 (553) Features 212 (234) 18 (16) 2 (6) Intergovernmental Committee on Surveying and Mapping (ICSM) ICSM is the Intergovernmental Committee on Surveying and Mapping and is comprised of senior representatives from all the Australian States, Territories, the Commonweatlh and New Zealand. ICSM’s role is to provide leadership, coordination and standards for surveying, mapping and charting and facilitate the assemblage and maintenance of national framework datasets. The Executive Director Information Services represents DLI in ICSM. In addition, DLI is represented in most of ICSM’s sub committees dealing with projects, research and issues relating to surveying and mapping. For 2004/2005, DLI was represented in the following committees: • Geodesy Technical Sub-committee • Geocentric Datum of Australia Implementation Working Group • Street Address Working Group • Permanent Committee on Cadastral Reform • Geographic Names in Australia (CGNA) Sub Committee • E-Plan Working Group • Permanent Committee on Tidal Interface/Intertidal Working Group • Permanent Committee on Tides and Mean Sea Level • Native Title Working Group • Permanent Committee on Topographic Information International Services – DOLA International DOLA International is the business name of the international consultancy arm of the Department of Land Information. DOLA International represents the Western Australian Government’s commitment to provide overseas countries with access to the State’s world class land administration, spatial and land information expertise. DOLA International's primary function is to manage, administer and support overseas projects and the personnel assigned to them as well as liaise with other firms and individuals associated with DLI on these projects. The benefits to Western Australia are:
• export income from the management of overseas projects, provision of technical assistance, and ultimately the use under licence of the department's land information systems;
• provide assistance to the Western Australian private business sector with seeding entry, or broadening exposure to overseas markets for their products and services as a consequence of the lead taken by the department in the implementation of overseas projects; and

Department of Land Information Annual Report 2004/2005 63
• the growth and extension of relationships with people associated most particularly in land related services in overseas countries, and the funding agencies around the world that support infrastructure development in developing countries.
In 2004/2005 DOLA International performed the following principal market activities:
• Sri Lanka: With SAGRIC International Pty Ltd, completed the Land Titling and Related Services Project.
• Mauritius: Completed pre-contract activities that resulted in the creation of a consultancy to assess the current land administration situation and identify potential institutional, legislative processes and policy reforms to the land management sector.
• Philippines: With Land Equity International Pty Ltd, began the process of undertaking the bridging component of the Philippines Australia Land Administration and Management Project, by way of providing an advisor on valuation simulation.
• Vietnam (2004 – 2009): Partnered with Rambol Natura AB to undertake the Swedish International Development Cooperation Agency (SIDA) Strengthening Environmental and Land Administration Project.
• Kiribati: Provided a consultant for the legislative and regulatory review for the World Bank Adaptation Program - Pilot Investment Phase (KAP II).
In addition to these activities a number of incoming group study tours were conducted. These comprised members of international governments, including Malaysia, Singapore and Samoa. The tours not only acted as marketing opportunities for DOLA International, but also allowed DLI staff to share their knowledge and expertise with overseas guests. This also resulted in DLI staff gaining a better understanding of the systems and procedures employed by other countries in their land administration efforts. During the year the department acknowledged the importance of DOLA International, particularly in regard to DLI’s sustainable contribution to Western Australia. The contribution can be noted through DOLA International providing access to global markets, ultimately resulting in opportunities for the distribution of the products and services offered by private enterprise; organisational learning; staff development, and importantly, the sale under licence of the department's world class land information systems. This acknowledgement was further represented by the appointment of a Director and Manager for DOLA International, and the improvement of links with the Executive by positioning the business unit within the Office of the Chief Executive.
AUDITOR GENERAL
4th Floor Dumas House 2 Havelock Street West Perth 6005 Western Australia Tel: 08 9222 7500 Fax: 08 9322 5664
INDEPENDENT AUDIT OPINION To the Parliament of Western Australia DEPARTMENT OF LAND INFORMATION PERFORMANCE INDICATORS FOR THE YEAR ENDED 30 JUNE 2005 Audit Opinion In my opinion, the key effectiveness and efficiency performance indicators of the Department of Land Information are relevant and appropriate to help users assess the Department’s performance and fairly represent the indicated performance for the year ended 30 June 2005. Scope The Chief Executive’s Role The Chief Executive is responsible for developing and maintaining proper records and systems for preparing performance indicators. The performance indicators consist of key indicators of effectiveness and efficiency. Summary of my Role As required by the Financial Administration and Audit Act 1985, I have independently audited the performance indicators to express an opinion on them. This was done by looking at a sample of the evidence. An audit does not guarantee that every amount and disclosure in the performance indicators is error free, nor does it examine all evidence and every transaction. However, my audit procedures should identify errors or omissions significant enough to adversely affect the decisions of users of the performance indicators.
D D R PEARSON AUDITOR GENERAL 16 September 2005

Department of Land Information Annual Report 2004/2005 64
Key Performance Indicators and Output Measures Service – Land Information Information about land and land ownership is collected, recorded and made available for use by Government, business and the community. Key Effectiveness Indicator (1 of 2) Extent to which the State Land Information Capture Program (SLICP) is completed according to target. Percentage of work program completed
Actual 2002-2003
Actual 2003-2004
Actual 2004-2005
Topographic Data Capture/Revision 87% 100% 100% Spatial Upgrade 96% 95% 100% Ortho-image/mosaic Production 100% 100% 100% Aerial Photography Capture 100% 100% 100% Property Street Addressing 100% 100% 100% Locality Boundary Capture 100% 63% 100% Digital Elevation Model Production 100% 100% 100% Aerotriangulation 100% 100% 100% Road Centreline Maintenance 100% 100% 90% Digital Aerial Photography 80% 100% 86% Overall Work Program Completion 96% 96% 98% Overall Work Program Completion Target 100% 100% 100%
Why is this a key indicator of our performance? The State Land Information Capture Program (SLICP) comprises components of a work program for producing up-to-date, accurate land information data sets to meet customer needs. It is negotiated with the independent Western Australian Land Information System (WALIS), a consortium of government agencies that use the land information. The extent to which the SLICP is delivered is an indicator of the currency of the data and therefore the effectiveness of DLI's land information base. How was the indicator derived? With a specific amount of money available in a year, the SLICP is a calculation of the amount of work able to be completed. The proposed program is then agreed with key WALIS agencies. The various components of the required work are recorded in a job tracking system, including the time taken and the direct cost involved. The percentage completed for each of the component programs is averaged to attain the percentage of overall program completion.

Department of Land Information Annual Report 2004/2005 65
What does this indicator show? Overall, 98% of the SLICP has been achieved. Of the ten discrete components of the 2004-2005 SLICP, only two have not achieved their individual targets. Comments on each component follow. Topographic Data Capture The Topographic Data Capture program achieved 100% of the target of 270 large-scale map tiles for the metropolitan area and selected country towns. The 2004-2005 program was completed under a one year contract with provision to extend for a further four years. Spatial Upgrade The Spatial Upgrade Program updates the spatial cadastral database for specific areas of the State each year, and the entire State will be upgraded over time. During 2004-2005, 100% of the planned work for the year was completed. At 30 June 2005, 74.3% of the entire State has been upgraded to survey accuracy. Ortho-image/Mosaic Production The Ortho-image/mosaic program revises and expands the existing geo-referenced image coverage of the State each year. During 2004-2005, there were 29,380 images rectified, which is 18% more than the estimated 25,000. Contributing to this was the increased availability of aerotriangulated images. Aerial Photography Capture The 2004-2005 Aerial Photography program of 127 SLICP projects was successfully completed. Additionally, 31 self-funded projects for other government agencies were completed. Overall, 37,322 of an estimated 38,730 frames of photography were captured. Property Street Addressing The Property Street Address program included rural and metropolitan/urban addressing. The program for 2004-2005 maintenance resulted in 45,236 new or amended addresses being included in the database, exceeding the target of 45,000. Locality Boundary Capture Locality boundaries have now been determined for all 144 of the State's local governments. During 2004-2005 the 43 remaining localities in the final five local governments were completed and amendments made to the boundaries of 33 localities. Digital Elevation Model Production Improved DEM pre-processing activity enabled the production of 21,599 Digital Elevation Models (DEMs) exceeding the 15,000 target by 44%. The continued refinement of processing software parameters and terrain type was also a factor.

Department of Land Information Annual Report 2004/2005 66
Aerotriangulation Adjustment Providing the fundamental spatial control link between aerial photography and ground survey coordinates, the aerotriangulation program supports and influences all other geo-referenced topographic and image data activities. Improving on last year’s performance, the 2004-2005 program achieved 28% more than the estimated 29,000 images due to the combined effects of low resolution images and digital image handling capability. Road Centreline Maintenance Validation, maintenance and revision of the Road Centreline database for metropolitan, outer metropolitan and regional areas in 2004-2005 achieved 18,023 road segment actions, reaching 90% of the 20,000 estimated. This is an acceptable outcome against the annual estimate of an activity that contains varying complexities of road centreline data and which is also impacted by the number of land subdivision surveys that may be lodged with the department. In future, this service will be absorbed into the recently approved Road Centreline Quality Improvements initiative. Digital Aerial Photography – Increase in State Coverage The annual program of digitising new aerial photography exceeded previous years. This supports the initiative for electronic access to land data and customised digital products. A proportion of this program provides digital images for areas of the State not previously available in digital form. Priorities for revision of existing areas impacted the amount of new cover achieved. The State’s digital coverage increased during 2004-2005 by 38 of an estimated 44 x 1:100,000 scale map sheet areas. This equates to 3.8% of the entire State and achieves a total of 41.04% digitised coverage.
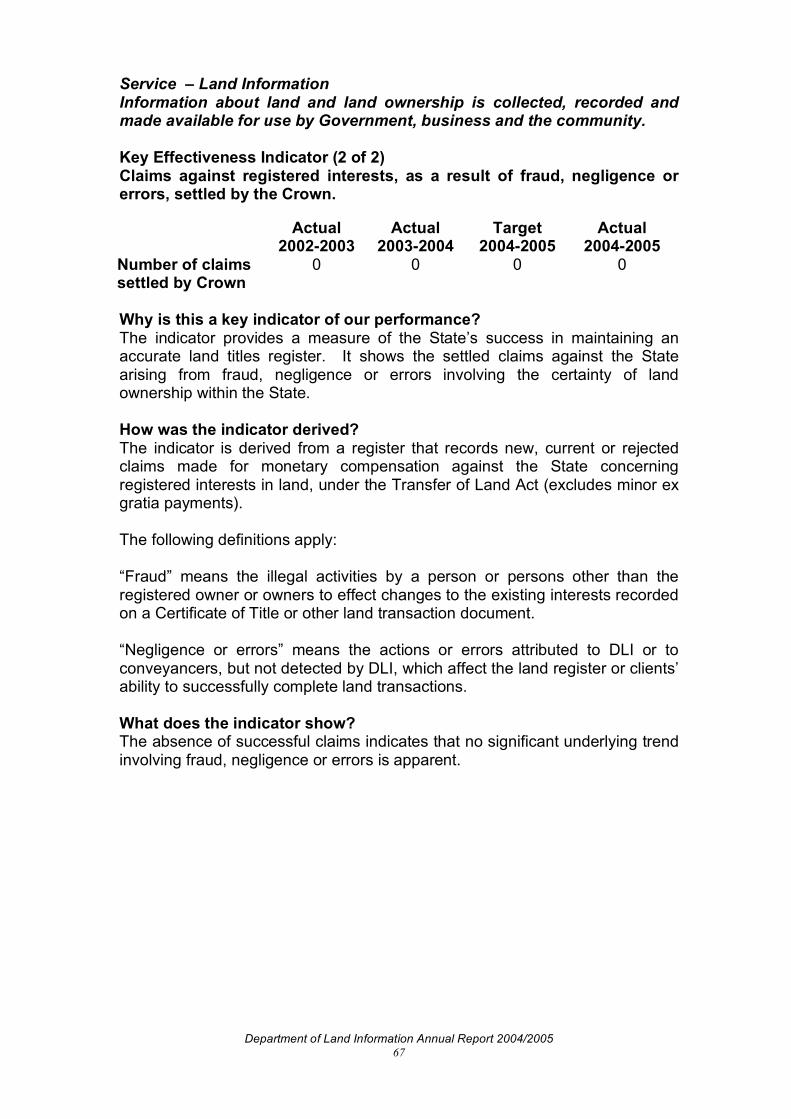
Department of Land Information Annual Report 2004/2005 67
Service – Land Information Information about land and land ownership is collected, recorded and made available for use by Government, business and the community. Key Effectiveness Indicator (2 of 2) Claims against registered interests, as a result of fraud, negligence or errors, settled by the Crown. Actual
2002-2003 Actual
2003-2004 Target
2004-2005 Actual
2004-2005 Number of claims settled by Crown
0 0 0 0
Why is this a key indicator of our performance? The indicator provides a measure of the State’s success in maintaining an accurate land titles register. It shows the settled claims against the State arising from fraud, negligence or errors involving the certainty of land ownership within the State. How was the indicator derived? The indicator is derived from a register that records new, current or rejected claims made for monetary compensation against the State concerning registered interests in land, under the Transfer of Land Act (excludes minor ex gratia payments). The following definitions apply: “Fraud” means the illegal activities by a person or persons other than the registered owner or owners to effect changes to the existing interests recorded on a Certificate of Title or other land transaction document. “Negligence or errors” means the actions or errors attributed to DLI or to conveyancers, but not detected by DLI, which affect the land register or clients’ ability to successfully complete land transactions. What does the indicator show? The absence of successful claims indicates that no significant underlying trend involving fraud, negligence or errors is apparent.
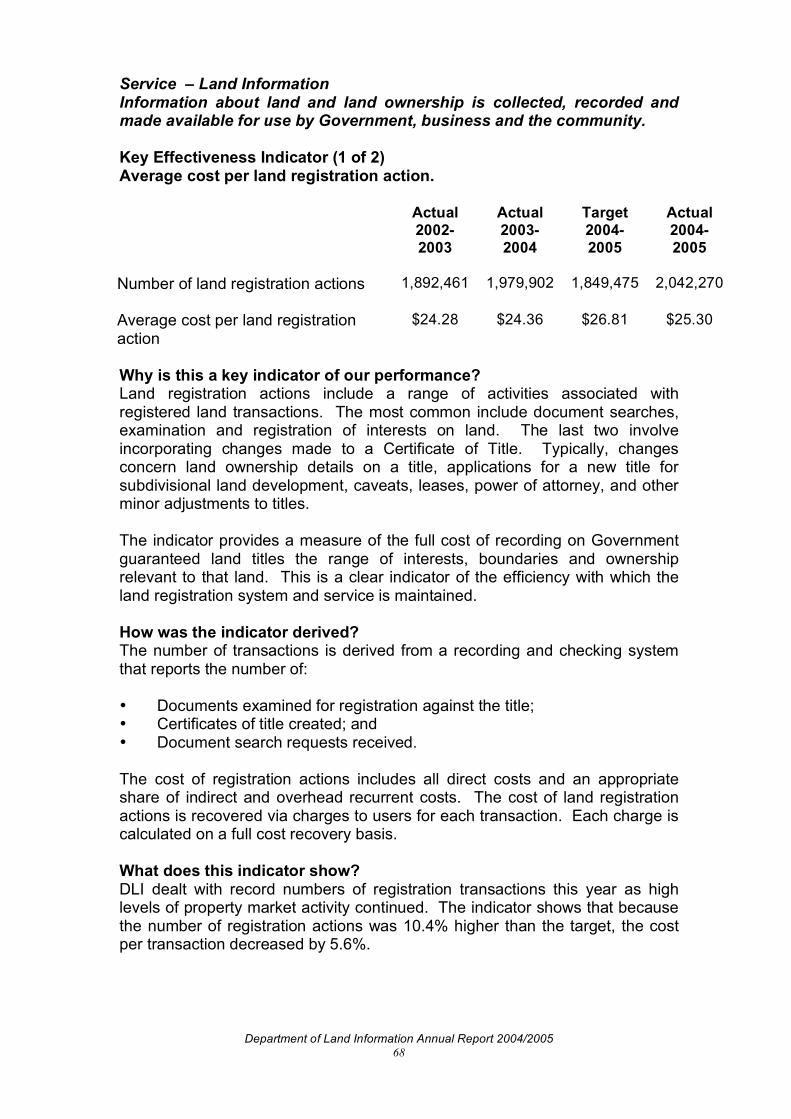
Department of Land Information Annual Report 2004/2005 68
Service – Land Information Information about land and land ownership is collected, recorded and made available for use by Government, business and the community. Key Effectiveness Indicator (1 of 2) Average cost per land registration action. Actual
2002-2003
Actual 2003-2004
Target 2004-2005
Actual 2004-2005
Number of land registration actions
1,892,461
1,979,902
1,849,475
2,042,270
Average cost per land registration action
$24.28
$24.36
$26.81
$25.30
Why is this a key indicator of our performance? Land registration actions include a range of activities associated with registered land transactions. The most common include document searches, examination and registration of interests on land. The last two involve incorporating changes made to a Certificate of Title. Typically, changes concern land ownership details on a title, applications for a new title for subdivisional land development, caveats, leases, power of attorney, and other minor adjustments to titles. The indicator provides a measure of the full cost of recording on Government guaranteed land titles the range of interests, boundaries and ownership relevant to that land. This is a clear indicator of the efficiency with which the land registration system and service is maintained. How was the indicator derived? The number of transactions is derived from a recording and checking system that reports the number of: • Documents examined for registration against the title; • Certificates of title created; and • Document search requests received. The cost of registration actions includes all direct costs and an appropriate share of indirect and overhead recurrent costs. The cost of land registration actions is recovered via charges to users for each transaction. Each charge is calculated on a full cost recovery basis. What does this indicator show? DLI dealt with record numbers of registration transactions this year as high levels of property market activity continued. The indicator shows that because the number of registration actions was 10.4% higher than the target, the cost per transaction decreased by 5.6%.

Department of Land Information Annual Report 2004/2005 69
Service – Land Information Information about land and land ownership is collected, recorded and made available for use by Government, business and the community. Key Effectiveness Indicator (2 of 2) Average cost per land information action. Actual
2002-2003 Actual
2003-2004 Target
2004-2005 Actual
2004-2005 Land Information Actions
n/a
n/a
520,118
658,733
Average cost per land information action
n/a
n/a
$38.95
$32.04
Why is this a key indicator of our performance? This is a new efficiency indicator introduced in 2004-2005. It replaces the following indicators: • Average cost per physical land information data set maintained and
developed • Average cost per land boundary information data set maintained and
developed Land information actions include a range of activities associated with the capture, production and maintenance of physical land and land boundary information in DLI’s datasets. These datasets include information about:: • Cadastre; • Geodetic marks; • Administrative boundaries; • Landscape relief (ie contours); • Cultural, or built environment, and natural features; • Air photography; • Satellite imagery; • Geographic Names; • Property Street Addresses; • Road Centreline (ie position of constructed roads); • Native Title Claims; and • Baselines/territorial sea limits The indicator provides a measure of the full cost of maintaining an up-to-date Government land information base and the costs involved represent a key indicator of efficiency.

Department of Land Information Annual Report 2004/2005 70
How was the indicator derived? The number of actions is derived from recording systems that report the number of: • Physical and land boundary information actions; • Photography and satellite image frames captured or value added; • Digital map data revisions. The cost of land information actions includes all direct costs and an appropriate share of indirect and overhead recurrent costs. What does this indicator show? As this is a new efficiency indicator introduced in 2004-05, comparison is not available. The number of actions achieved was 26.6% higher than the target, resulting in the average cost per transaction being 17.7% lower than anticipated. Continuing technology improvements; refinement of processes and additional resources dealing with land boundary information actions contributed to the significant variance from the target. The target estimated for this measure has been improved for 2005-2006.

Department of Land Information Annual Report 2004/2005 71
VALUATION SERVICES Contribution to the Strategic Planning Framework: Goal 2 – The Economy Goal 4 – The Regions Goal 5 - Governance Desired Outcome Independent valuations support Government’s collection of rates and taxes, and management of property assets. Western Australians rely on accurate valuations to provide a fair, impartial and equitable rating base. Under the authority provided in the Valuation of Land Act 1978, the Valuer General maintains valuation rolls for this purpose. In addition to determining rating and taxing values, the Valuer General provides an independent property valuation and consultancy service to Commonwealth and State agencies, as well as to all local governments. Valuations are made for various reasons including the disposal, acquisition or leasing of land; compensation; stamp duty assessment and financial asset management and reporting. Property Data Verification The quality of property data is fundamental to the integrity of Gross Rental Values and sales information. The number of local governments assisting the Valuer General in identifying changes to buildings has continued to increase, resulting in an improvement in data quality. In addition, the Valuer General has, through verification activities associated with the valuation program, improved existing property records. As part of the revaluation activity over the year, approximately 45,000 property records were checked and where required, updated. Government Property Register During the year, the valuation program of Government owned property was accelerated to achieve an earlier release of agency asset valuation reports. For the first time, agencies received their property and valuation reports for financial reporting before 30 June. A total of 127,744 valuations were produced and reported as at 30 June 2005. Several consulting projects were undertaken during the year, with the largest being the preparation of a valuation register of 2200 assets controlled by the Department of Conservation and Land Management. This project involved the location, inspection and valuation of property assets located throughout the State.
Department of Land Information Annual Report 2004/2005 72
Service Level Agreements (SLAs) The existing SLA with the Water Corporation concerns the provision of rating valuations. This SLA was renegotiated during the year after being extended statewide on 1 July 2004. The SLA with the Commonwealth Government for the provision of valuation services to the Indian Ocean Territories also continued. Both agreements continued to be highly successful. For inclusion in a whole-of-department SLA with the Office of State Revenue, the key requirements in providing unimproved values for land taxation, and the provision of valuations to support the assessment of stamp duty were formalised during 2004/2005. Metropolitan Branch - Rating and Taxing Values During the year, the Metropolitan Branch completed the triennial General Valuation based on Gross Rental Value and provided new valuation rolls to 30 metropolitan local governments, the Water Corporation and the Fire and Emergency Services Authority. The Office of State Revenue and metropolitan local governments using unimproved values also received valuation rolls following the statewide annual General Valuation. In total, 334,216 Gross Rental Values and 544,470 Unimproved Values were made. These are required to maintain the valuation base for the determination of rates and taxes within the Perth Metropolitan Region. Due to the continuing buoyancy of the property market, the number of interim valuations exceeded estimates by 8.5%. A total of 595 objections, appeals and queries against rating and taxing values were processed. This represented a 31% reduction in disputes over the previous year.
Other Valuations 6,617 values were made for purposes other than for rating and taxing.
Country Branch - Rating and Taxing Values The Country Branch completed General Valuations, based on gross rental value, of the following 26 local governments: Augusta – Margaret River; Boddington; Busselton; Broome; Chapman Valley; Cuballing; Cue; Dundas; Kalgoorlie-Boulder; Kojonup; Laverton; Leonora; Meekatharra; Menzies; Mount Magnet; Port Hedland; Ravensthorpe; Roebourne; Sandstone; Upper Gascoyne; Wagin; Wandering; Wickepin; Williams; Wiluna; and Yalgoo. Valuation rolls were provided to local governments, the Water Corporation and the Fire and Emergency Services Authority. The General Valuation based on unimproved value was also completed, resulting in 108 rural valuation rolls and 37 urban rolls being provided to individual local governments, in addition to the statewide roll provided to the Office of State Revenue.

Department of Land Information Annual Report 2004/2005 73
A total of 300,755 unimproved values and 82,920 gross rental values were made during the year for rating and taxing purposes throughout non-Perth metropolitan areas of Western Australia. The continuing buoyancy of the property market meant that the number of valuations exceeded estimates by 18.15%. Additionally, a total of 624 objections, appeals and queries against rating and taxing values were processed. This was a 4% increase in disputes over the previous year.
Other Valuations A total of 127,744 asset valuations for financial reporting and 5,089 valuations for other purposes were made.
Regulation and Valuation Research During the year, the team provided commentary as well as statistical summaries of property sales and price movements for inclusion in various major newspaper publications. It also provided key property valuation information to strengthen Western Australia’s claim to a fair allocation of Commonwealth Grants, along with again providing data to assist in the allocation of grants to local governments in the State.
Other Valuations Several consulting projects were undertaken during the year, with the largest being the valuation of 400 land parcels owned by LandCorp and situated throughout Western Australia.

Department of Land Information Annual Report 2004/2005 74
Key Performance Indicators and Output Measures Service – Valuation Services An impartial valuation and property information service. Key Effectiveness Indicator (1 of 2) International standards for accuracy and uniformity of rating and taxing values are met. Actual
2002-2003
Actual 2003-2004
Target 2004-2005
Actual 2004-2005
93.04%
93.87%
>92.5%
92.75%
Benchmark against international standards for accuracy using Means Ratio Test: Gross Rental Value Unimproved Value
91.76% 90.58% >92.5% 89.75%
5.69%
6.26%
<7.00%
5.74%
Coefficient of dispersion to check uniformity of values: Gross Rental Value Unimproved Value
5.17%
7.80%
<15.00%
9.18%
Why is this a key indicator of our performance? State and local governments rely on impartial, uniform and accurate property values as a base for levying rates and taxes. Therefore, measuring the uniformity and accuracy of valuations provides a useful indicator of our contribution to their effectiveness in meeting this outcome. How was this indicator derived? The uniformity and accuracy of Unimproved Values are checked against international ratio standards published by the International Association of Assessing Officers (IAAO) in their ‘Standard on Ratio Studies’. Coefficient Of Dispersion (COD) and the Means Ratio (MRT) tests are the key standards. These are used extensively in both Australia and New Zealand. Both were adopted as ideal indicators suited to Western Australia. Gross Rental Values are compared against our own standards developed in 1998 along similar lines to the IAAO land value standards. The MRT has been used by the Valuer General since 1995/96 and this report shows the outcomes for 2004/05 against the same for 2002/03 and 2003/04 for comparison purposes.

Department of Land Information Annual Report 2004/2005 75
It is noted that the alternative Median Value Price Ratio test will be adopted from 2005/06. While the two measures produce very similar results, the Median rather than the Mean is considered to be the superior measure. IAAO Standards state that “the overall level (MRT - accuracy) of appraisal for a jurisdiction.... for vacant land.... should be between 90 percent and 110 percent”, and that the “Coefficient Of Dispersion (COD) for vacant land should be 20 percent or less”. In larger urban jurisdictions dealing with uniform land releases and availability of sales, the COD should be <15%. For Unimproved Values the Valuer General of Western Australia has set an MRT standard of >92.5% and a COD of <15%. While there is currently no international standard for Gross Rental Values, the Valuer General has adopted the same accuracy and uniformity measures applying to Unimproved Values but with a tighter COD target of <7%. The quality of the outcome is reflected in the extent to which the results exceed the minimum targets. What does this indicator show? For Unimproved Values the outcomes show the following: The MRT shows 89.75% against a target of >92.5%. This outcome is similar to 2003/04 and slightly below the target figure. A contributing factor to this result was the rapidly escalating market that increased the difficulty in determining the level of assessment at the date of valuation. In these circumstances, the assessed values are more likely to be slightly below the market. The COD of 9.18%, while higher than the preceding years, is still well inside the international standard and again reflects the difficulties associated with assessing values in a rapidly changing market. For Gross Rental Values the outcomes show the following: The MRT shows 92.75% against a target of >92.5%. This outcome is similar to 2003/04 and slightly above the target figure. The COD of 5.74% is also an improvement on last year, consistent with the average result achieved over the past six years, and well inside the adopted standard. Taken together, the results of these tests show a satisfactory outcome.

Department of Land Information Annual Report 2004/2005 76
Service – Valuation Services An impartial valuation and property information service. Key Effectiveness Indicator (2 of 2) Adjustments to rating and taxing values as a result of Objections and Appeals as a percentage of total values in force. Actual
2003-2004 Target
2004-2005 Actual
2004-2005 Adjustments to rating and taxing values as a result of Objections and Appeals as a percentage of total values in force
0.033% <0.2% 0.02%
Why is this a key indicator of our performance? The percentage of values amended as a consequence of owners exercising their right to challenge values is a reasonable measure of the integrity and fairness of the values contained in Valuation Rolls. How was this indicator derived? The figure is derived by dividing the number of values that have been amended as a result of an objection or appeal by the total number of rating and taxing values in force. What does this indicator show? At 30 June 2005, there were 1,737,083 values in force in Western Australia and during the 2004-2005 financial year, only 319 of these were amended as a result of formal objections and appeals lodged with the Valuer General. This indicates that less than one in every 5,400 values is amended after formal review. Apart from the effectiveness of the valuation process in WA, these types of results also show the stability of and acceptance of the valuation base by rate and taxpayers.

Department of Land Information Annual Report 2004/2005 77
Service – Valuation Services An impartial valuation and property information service. Key Effectiveness Indicator Average cost per valuation. Actual
2002-2003 Actual
2003-2004 Target
2004-2005 Actual
2004-2005 Number of valuations completed
1,145,529 1,522,666 1,483,833 1,408,087
Average cost per valuation $14.94 $11.19 $12.04 $12.82 Why is this a key indicator of our performance? The number of valuations made and the average cost per valuation provide a reliable measure of overall performance against forecast targets and previous years’ outcomes. Some variation does occur from year to year due to the cyclical nature of the Gross Rental Valuation Program, with 2004-2005 being the second of two years’ higher mass appraisal activity in the metropolitan area, resulting in lower costs per value than the third year of a cycle (2002-2003). How was this indicator derived? Cost per value refers to the total cost per value of unimproved and gross rental values including general valuations, interim valuations, objections, appeals and queries made during the financial year, and other valuations including all plant and equipment, stamp duty, market, and asset valuations, and property related valuation consultancy services. The total cost includes all direct costs and an appropriate share of indirect and overhead recurrent costs. What does this indicator show? The average cost per valuation of $12.82 is 6.5% higher than the target and is due to the overall lesser than expected number of values being completed. This outcome needs to be considered in conjunction with the 2003/04 results due to the fact that there was a major two-year valuation programme that impacted on both years. A greater proportion of the total number of values was actually completed in 2003/04, resulting in less than the expected number of values being completed in 2004/2005. Taking this into account the 5.1% variance in the number of values completed from the target is as expected.

Department of Land Information Annual Report 2004/2005 78
ACCESS TO GOVERNMENT GEOGRAPHIC INFORMATION Contribution to the Strategic Planning Framework: Goal 2 – The Economy Goal 4 – The Regions Goal 5 – Governance Desired Outcome Coordinated access to WA Land Information System (WALIS) community members’ geographic information supports the management and development of the State. The importance of land information in decision making in almost every aspect of the State’s economy and lifestyle is increasingly being recognised. Access to high quality spatial information is facilitated and coordinated by the WALIS Office for the benefit of all Western Australians. The primary aim of WALIS is to build networks of people and technology to share information and improve its usefulness and accessibility. Sharing information reduces costs, avoids duplication and helps build a consistent view of land and geographic information. This helps Government and business deliver better products and services and individuals make better decisions about their future. WALIS facilitates WA Government input into national policy activities focused on the use of spatial information for natural resource management strategies, counter terrorism and emergency management activities. Knowledge Exchange The WALIS Forum is the largest geographic information conference in Australia. The 2005 conference was held at the new Perth Convention Centre and had a record attendance with 473 participants over the two days. In addition to a plenary session that included as keynote speakers a former Young Australian of the Year in Science and Technology, the acting Director General from UK Ordinance Survey and the Chief Executive from Geoscience Australia, there were three themed breakout sessions. One of these was called ‘WALIS 101’, aimed at providing an introduction to WALIS and geographical information for those new to the industry. One session in the ‘WALIS 101’ stream at the Forum was termed “The Wonderful World of WALIS Data”, which gave an overview of the range of datasets available through WALIS member agencies. This session has since been replicated in a local government-specific workshop in Perth, with a further three similar workshops planned for early in the 2005/2006 financial year, including two in regional locations. WALIS also held a range of other workshops and seminars during the 2004/2005 year including a workshop on the spatial datasets associated with the Cities Project Perth - a partnership project involving a range of WA State Government agencies and the Federal Government aiming to undertake a natural hazard risk assessment of Perth.

Department of Land Information Annual Report 2004/2005 79
Policy and Strategic Planning WALIS Strategy 2004/2007 was finalised and lead agencies for each of the components of the strategy were identified. During 2004 Acil Tasman undertook a study on the value of WALIS to the Western Australian community. The annual value of WALIS was quantified at around $15 million per year. In December 2004, work began on revising the WALIS Custodianship Policy and the working group created for this purpose completed a final draft policy in time for presentation to WALIS Forum in February. Data Management Guidelines that underpin the policy were also completed and endorsed for use by member agencies in May 2005. The WALIS Office works closely with ANZLIC – the Spatial Information Council - with the Chief Executive of DLI representing Western Australia on ANZLIC. In April 2005, the WALIS Office took on the role of project manager for the development of a new ANZLIC Metadata Profile to comply with ISO Standard 19115, and a metadata tool that, when completed, will be freely available over the Internet. Data Quality, Infrastructure and Access WALIS continues to facilitate the improvement of access to Government land information and in doing so, has undertaken an intensive review of the State Land Information Capture Program (SLICP). The SLICP ensures that the State has a comprehensive archive of aerial photography across Western Australia. In March 2005, WALIS released a data pricing and access questionnaire, which was open until mid-June. The results from the questionnaire will be used by the WALIS Advisory Committee to make recommendations to Government about data access and availability, data quality and the pricing of data. Interragator and WA Atlas Interragator is a comprehensive index to over 12,000 records of Western Australia’s geographic information held by public and private sector organisations. Access to and ease of use of Interragator is constantly being improved. The WA Atlas continues to provide a general reference map tool for the public. The Atlas allows users to access a range of data layers and generate their own maps. The Atlas program has been improved to ensure more rapid and accurate updates of datasets can be made in the future.

_________________________________________
1 WALIS Forum attendance is included in this assessment. The Forum occurs each 18 months and may not therefore occur in some financial years. 2 The baseline developed in 2003-04 was based on data collected over a two-month period, and may not have reflected a full 12-month cycle. The data collected during the 2004-05 year will assist in refining the baseline.
Department of Land Information Annual Report 2004/2005 80
Key Performance Indicators and Output Measures Service – Access to Government Geographic Information Land or geographic information from WALIS community members (WCM) is managed in a coordinated way so that data held by WCM can be integrated and readily accessed to meet government, business and community needs. Key Effectiveness Indicator Useability of WALIS spatial information is determined by user awareness, acceptance and reuse: Awareness
Percentage increase in first time participants at WALIS functions1 Percentage increase in repeat participants at WALIS functions1
Acceptance
Percentage increase in number of first time customers accessing spatial information from WALIS community members2
Reuse
Percentage increase in number of return customers accessing spatial information from WALIS community members2
Actual 2003-2004
32%
5%
n/a
n/a
Target 2004-2005
5%
5%
2%
2%
Actual 2004-2005
26%
32%
0%
0%
Why is this a key indicator of our performance? The Western Australian Land Information System (WALIS) is an alliance of State Government agencies, local government and private organisations that share and make available land-related information to the private sector and the community. The role of the WALIS Office is to facilitate and coordinate this access to high quality spatial information. Effective access can be demonstrated by the useability of spatial information, and this is reflected by user awareness, acceptance and reuse.

Department of Land Information Annual Report 2004/2005 81
How was the indicator derived? Awareness is measured in terms of the number of first time and repeat participants recorded at WALIS educational and information functions, including the WALIS Forum that is held once every 18 months. The WALIS Office maintains contact information about participants and is able to report on the number who attend for the first time and the number who have attended previously. Acceptance and Reuse is measured in terms of the number of new and existing customers of WALIS spatial data and information custodians. Each year, on randomly selected days, selected WALIS agencies collect and report the number of new and existing customers who access spatial information. This data is then collated by the WALIS Office to determine the annual average percentages for new and repeat customers. At this stage, the provision of spatial information via the Internet is not a component of the reporting by WALIS agencies. What does the indicator show? Awareness The higher than expected increase in both first time and repeat participants to WALIS functions during 2004-2005 can be attributed to the successful two-day WALIS Forum, which is held every second year and targets a broad industry and government audience. The high number of first time and repeat participants at the Forum has skewed the percentage increase for the year. Acceptance and Reuse The baseline data that was established during 2003-04 was based on data collected over a two-month period and did not reflect the extent to which data is sought by customers over the whole year. In addition, many of the 12 days randomly selected over the course of 2004-05 were either Mondays or Fridays, which tend to have lower numbers of requests for data than other weekdays. Therefore, no increase in acceptance or reuse was reported. However, the data collected during 2004-05 will be used to reset the baseline, for a more accurate reflection next year.

Department of Land Information Annual Report 2004/2005 82
Service – Access to Government Geographic Information Land or geographic information from WALIS community members (WCM) is managed in a coordinated way so that data held by WCM can be integrated and readily accessed to meet government, business and community needs. Key Effectiveness Indicator Average cost per Key Result Area. Actual
2003-2004 Target
2004-2005 Actual
2004-2005 Number of Key Result Areas 6 6 6
Average cost per Key Result Area $258,500 $271,500 $285,833 Why is this a key indicator of our performance? The WALIS Office is responsible for managing and coordinating the achievement of the Annual Business Plan, which aims to meet the priorities and objectives set out in the WALIS Strategy 2004-2007. In 2004-2005 the Business Plan comprised six Key Result Areas. Therefore the average cost of delivering the six Key Result Areas is a useful measure of efficiency. How was the indicator derived? The six Key Result Areas are contained in the Annual Business Plan. The total cost of projects reflects the entire cost of the WALIS Office, and includes all direct costs and an appropriate share of indirect and overhead recurrent costs. What does the indicator show? For 2004-2005, the average cost per Key Result Area was $285,833 which is 5.3% more than the target for the year, however, still well within the acceptable annual variance range. The average cost increase was due to advance spending in preparation for WALIS Forum 2006.

Department of Land Information Annual Report 2004/2005 83
Certification of the Key Performance Indicators I hereby certify that the performance indicators are based on proper records, are relevant and appropriate for assisting users to assess the Department of Land Information’s performance, and fairly represent the performance of the Department of Land Information for the financial year ended 30 June 2005. Grahame Searle CHIEF EXECUTIVE (Accountable Officer) 15 August 2005 Certification of Financial Statements The accompanying financial statements of the Department of Land Information have been prepared in compliance with the provisions of the Financial Administration and Audit Act 1985, from proper accounts and records to present fairly the financial transactions for the financial year ended 30 June 2005, and the financial position as at 30 June 2005. At the date of signing, we are not aware of any circumstances which would render any particulars included in the financial statements misleading or inaccurate. Grahame Searle Murray Smith CHIEF EXECUTIVE MANAGER FINANCIAL
SERVICES (Accountable Officer) (Principal Accounting Officer) 15 August 2005 15 August 2005
Department of Land Information Annual Report 2004/2005 84
Appendices Appendix A Legislation administered DLI is responsible for the administration of numerous Acts of Parliament relating to land. Those most directly affecting the Department’s daily business activities are: Transfer of Land Act 1893 – establishes the Torrens System of registering freehold tenure, transactions and interests over land. Registration of Deeds Act 1856 – outlines a system of registering conveyances, wills and other deeds affecting land for which no Certificate of Title has been issued. Valuation of Land Act 1978 – established a central valuation authority to record, coordinate and carry out values on property for all rating and taxing purposes within the State and to undertake other valuation consultancy for Government. Strata Titles Act 1985 – facilitates the subdivision of land into spaces for home units, and for the management of strata schemes. Licensed Surveyors Act 1909 and Regulations – outlines the rules and guidelines for the conduct of authorised surveys. Standard Survey Marks Act 1924 – outlines rules and guidelines for provision of survey marks.

Department of Land Information Annual Report 2004/2005 85
Legislation affecting Departmental activities In carrying out its business activities, DLI is affected by more than 100 different Acts administered by other departments or agencies. Some of the most significant of these are: Evidence Act 1906 Land Administration Act 1997 Freedom of Information Act 1992 Land Tax Assessment Act 1976 Library Board of Western Australia Act 1951-1983 Local Government Act 1995 Native Title (State Provisions) Act 1999 Native Title Act (Commonwealth) 1993 State Trading Concerns Act 1916 Stamp Act 1921 In the performance of its obligations as a Government department, DLI complies with the following Acts: Anti-Corruption Commission Act 1988-1994 Disability Services Act 1984 Electoral Act 1907 Equal Opportunity Act 1984 Financial Administration and Audit Act 1985 Government Employees Superannuation Act 1987 Industrial Relations Act 1979 Minimum Conditions of Employment Act 1993 Occupational Safety and Health Act 1984 Public Sector Management Act 1994 Salaries and Allowances Act 1994 State Supply Commission Act 1991 State Records Act 2000 Workers’ Compensation and Rehabilitation Act 1981 Workplace Agreements Act 1993

Department of Land Information Annual Report 2004/2005 86
Appendix B DLI Pricing Policies
Under Treasurer’s Instruction 903, section 4(x), DLI is required to advise of the policies underlying the pricing of its goods and services. The fees and charges DLI applies to its products and services are determined by: (a) the application of the principle of recovering the full or partial cost of the
product or service (which is determined by whether it is categorised as a ‘State good’ or not); or
(b) the maintenance of parity pricing with similar products in the market place; or
(c) as determined by the suppliers, where DLI acts as the agent. For the three major categories of products and services provided by DLI, the following apply:
• Land registration services – the basis for determining the cost of the service is in accordance with the concepts set out in “Costing and Pricing Government Outputs – Guidelines for Use by Agencies” produced by the Department of Treasury and Finance.
• The current list of fees for land registration products and services were implemented on 7 July 2003. The various regulations detailing the fee structure were published in a special Government Gazette on 30 June 2003.
• Mapping products and services – the prices for these are determined by applying the principles that are set out in the previous paragraphs. Prices currently applying to mapping products and services are available from DLI Midland.
• Valuation services are priced in accordance with the Valuation of Land Act and full cost recovery principles.
DLI has reviewed the pricing of fundamental land information data sets under the State Trading Concerns Act and the WALIS Data Transfer and Pricing Policy.

Department of Land Information Annual Report 2004/2005 87
Appendix C Expenditure specified under the Electoral Act 1907 In accordance with Section 175ZE of the Electoral Act 1907, DLI incurred the following expenditure in:
• Advertising agencies; • Market research organisations; • Polling organisations; • Direct mail organisations; and • Media advertising organisations.
In relation to particular classes of expenditure, DLI reports the following: Advertising Agencies - Nil Market research organisations Research Solutions $73,106.47 Polling Organisations – Nil Direct Mail Organisations - Disco Direct Mailing Services
$1,590
Lasermail $2,786.39 Northside Distributors $2,089.56 TOTAL $6,465.95 Media advertising organisations Markeforce Productions $34,019.14 Britel Enterprises $302.73 Cambridge Media $310.00 Seek Ltd $270.00 Sensis Pty Ltd $2,640.00 Miscelleneous $1,819.84 TOTAL $39,361.71 The total amount paid by DLI for expenditure specified in the Act during 2004/2005 was $118,934.13.

Department of Land Information Annual Report 2004/2005 88
Appendix D Wastepaper Recycling (contributes to Goal 3 of the Strategic Planning Framework – The Environment) DLI collected 19,945 kg of waste paper in 2004/2005. Appendix E Energy Smart Government Program (contributes to Goal 3 of the Strategic Planning Framework – The Environment) In accordance with the Energy Smart Government policy DLI has committed to achieve a 12% reduction in non-transport related energy use by 2006/07 with a 8% reduction targeted for 2004/2005. Energy Smart Government program
Baseline Data
2004/2005 Actuals
Variation %
Energy Consumption (GJ) 24,780 17,542 29.21
Energy Cost ($) 725,352 595,254 17.94
Greenhouse Gas Emissions (tonnes of CO2)
6,334 4,435 29.98
Performance indicators ♦ MJ/sqm ♦ MJ/FTE
1,205 30,936
739 19,690
38.68 36.36
The first full 12 months of the Performance Improvement Measures of the Energy Performance Contract at the DLI Midland building came into effect for 2004/2005, and its achievements are reflected in the above results. Staff education and awareness initiatives on energy saving also continued, with the new induction process containing a component on DLI’s commitment to energy saving. As a result, the participation of staff in energy reduction initiatives was noted to increase. The Department of Land Information has now completed a full 12 months of the performance improvement measures within the Energy Performance Contract at the DLI Midland building during the 2004/2005 financial year and the achievements are reflected in the above results. The Department also undertook the following initiatives:
• Purchasing of Multi Functional Devices to lower the number of printers and facsimile machines within the building;
• Purchasing energy efficient computer hardware and software; and

Department of Land Information Annual Report 2004/2005 89
• Reiterating to staff via the Intranet the savings achievable by turning off computers, screens, facsimiles, printers prior to departing each evening.
The Department is now entering into the implementation of Stage 2 of the Performance Improvement Measures (PIM’s) within the Energy Performance Contract. Further savings during the 2005/06 financial year from the new PIM’s have been guaranteed within the contractual arrangements. Appendix F Sponsorship Report (contributes to Goal 5 of the Strategic Planning Framework – Governance) DLI’s Sponsorship Policy and guidelines for giving and accepting sponsorships were endorsed in April 1998. In accordance with the policy, the following details are reported: DLI Sponsorship Received
Organisation Purpose Total Statewest Credit Society International Women’s Day
function $1,500
Statewest Credit Society DLI Fun Run $400 TOTAL $1,900
DLI Sponsorship Given
Organisation Purpose Total Property Education Foundation
Education $750
Australian Property Institute
General sponsor $5,000
Spatial Sciences Institute National Summit $3,000 TOTAL $8,750

Department of Land Information Annual Report 2004/2005 90
Appendix G Recordkeeping Plans (contributes to Goal 5 of the Strategic Planning Framework – Governance) The Department of Land Information’s Recordkeeping Plan 2004, required under s19 of the State Records Act 2000, was approved for a period of five years by the State Records Commission on 7 October 2004. The following information is provided as required by State Records Commission Standard 2. The efficiency and effectiveness of current recordkeeping systems were evaluated during the development of the Recordkeeping Plan 2004. A re-evaluation is planned during the implementation of an electronic document and records management system. In accordance with the Plan, online recordkeeping training was introduced in May 2005 for all employees. The training provided employees with awareness of recordkeeping principles and issues and supported compliance with the Plan. All staff have enrolled in the training with more than 25% having successfully completed the course. A review of the effectiveness of the online training is planned during the second year of its implementation. As part of the department’s induction program, new employees are enrolled in the training and required to complete the course within two months of appointment. The training refers to the department’s recordkeeping policies that describe employees’ recordkeeping responsibilities. Training in the use of the records management system itself is also provided to all employees. Appendix H Freedom of Information (contributes to Goal 5 of the Strategic Planning Framework – Governance) Information Statement A legal right of access is provided to documents held by all State and Local Government agencies by the Western Australian Freedom of Information Act 1992. Freedom of Information (FOI) Applications for 2004/2005 Three valid applications were received seeking access to non-personal information. Statistics about those applications are provided in the Information Commissioner’s Annual Report at www.foi.wa.gov.au .

Department of Land Information Annual Report 2004/2005 91
Information Enquiries Requests for access to documents should be made, in the first instant, to the Customer Service Officers at the department’s public counter. Often material may be made available without the need to formalise a request under Freedom of Information. A formal FOI application is required to access documents that are not available as part of the normal course of business. Receipt of FOI Applications FOI applications, payments, correspondence and general enquiries should be directed to: DLI FOI Coordinator, Head Office PO Box 2222, Midland WA 6936; Telephone (08) 9273 7565 Facsimile (08) 9273 7666. FOI application forms are available from the department’s website at http://www.dli.wa.gov.au/ or from the FOI Coordinator. Fees and Charges The rate of fees and charges are set under the FOI Act.
• Application fee for non-personal information is $30.00. • There are no fees for applications for personal information about the
applicant. • Charges for dealing with the application are set at a standard rate of
$30.00 per hour, or pro rata for a part of an hour. • Charges for supervising inspection of documents are set at a standard
rate of $30.00 per hour, or pro rata for a part of an hour. • Charges for photocopying are $30.00 per hour for staff time and 20c per
copy. • Charges for time taken by staff transcribing information from a tape or
other device are set at a standard rate of $30.00 per hour, or pro rata for a part of an hour.
• Charges for duplicating a tape, film or computer information will be the actual cost.
• Charges for delivery, packaging and postage will be the actual cost. Processing Applications Processing of FOI applications is coordinated centrally while initial decision making is generally decentralised to the managers responsible for the issue in question, due to their knowledge of current action.

Department of Land Information Annual Report 2004/2005 92
Notice of Decision Applicants are provided with written notice of the department’s decision including the following information:
• date of the decision; • name and designation of the decision-maker; • reasons for deleting any matter; • reasons for deferring access; • arrangements for giving access; • reasons for refusing access to any matter; • the amount and basis for any charges levied; and • the rights of review and procedures to be followed.
Review Rights If the applicant or third party is aggrieved with a decision made by the department, they have the right to submit a written request for a review of that decision. This must be done within 30 days after being given notice of the decision. The review will be conducted by a person other than the person who made the original decision, is not subordinate to that person, and is usually a member of the Legal Services branch. The department must respond with a written notice of decision within 15 days. There is no lodgement fee payable for internal reviews. If the applicant or third party is still aggrieved, they may lodge a written complaint to the Office of the Information Commissioner within 60 days following the internal review decision (30 days for third parties). The Commissioner’s decision is final unless an appeal is made to the Supreme Court on a question of law. Amendment of Personal Information Personal information held on the public registers maintained by the department in accordance with statutes, such as Land Title Registers maintained under the Transfer of Land Act, may be amended in accordance with procedures set out in the legislation. Other personal information held on departmental records may be amended by application to the FOI Coordinator. This provision exists to ensure the department does not unfairly harm the person referred to, misrepresents facts about them or does not give a misleading impression. Applicants must provide details and, if necessary, documentation in support of their claim to amend inaccurate, incomplete, out of date or misleading information.

Department of Land Information Annual Report 2004/2005 93
Appendix I Public Interest Disclosures (contributes to Goal 5 of the Strategic Planning Framework – Governance) DLI has published its Public Interest Disclosure Policy, along with procedures and guidelines, on the internal staff intranet system. This also provides commonly asked questions and answers for the information of staff. The Manager of Strategic Human Resources is available to answer questions for staff on the policy. The Manager of Legal Services Branch has been appointed as DLI’s Public Interest Disclosure Officer.

Department of Land Information Annual Report 2004/2005 94
Appendix J Corruption Prevention (contributes to Goal 5 of the Strategic Planning Framework – Governance) In 2004/2005, DLI increased its focus on managing the risk of corruption and misconduct within the agency. The following measures were taken to reduce the risk of corruption and misconduct:
• A staff awareness program was run including sessions led by the Chief Executive and an in-house seminar run by the Corruption and Crime Commission;
• Information regarding corruption and misconduct prevention was disseminated to staff via the intranet and the DLI Bulletin (internal newsletter);
• A number of new security features were developed for Certificates of Title to reduce the risk of fraud;
• Steps were taken towards ensuring that when DLI staff move to different locations, they do not accumulate security accesses that they no longer need or have authority for; and
• The DLI Procurement process was upgraded though DLI’s Enterprise Business Information System (EBIS). The new requisition-based procurement process ensures a more reliable level of compliance to DLI procurement policy.
In addition to the above, DLI already had a number of mitigation strategies in place, such as:
• A Gifts and Hospitality register, which requires the disclosure of the acceptance or refusal of gifts, benefits or hospitality over the value of $30; and
• The DLI Staff Induction process, which includes the provision of codes and policies relevant to the appropriate conduct and behaviour required within the agency.
DLI is currently in the process of reviewing, identifying and assessing organisational risks relating to corruption and misconduct.
Department of Land Information Annual Report 2004/2005 95
Appendix K Sustainability (contributes to Goal 5 of the Strategic Planning Framework – Governance) A qualitative summary of how DLI is addressing the targets and priority areas set in its Sustainability Action Plan. DLI took major strides forward in its goal of supporting the sustainable economic, social and environmental management and development of the State. The agency’s commitment to these goals has been incorporated into the new DLI Strategic Plan for 2005/2010, the 2005/2006 Corporate Balanced Scorecard and the draft Bill for the Land Information Statutory Authority. In addition to these high-level achievements, there have been a number of other achievements, on both Corporate and Operational levels, such as: • Meaningful and effective public engagement was facilitated by the
continued consultation with key stakeholders regarding the establishment of the statutory authority and other issues that may have a significant impact such as:
• SLIP; • Landgate; • Geodetic network review; • Developments in emergency management; and • E-Government initiatives generally.
• The milestones for the Shared Land Information Platform (SLIP), a project that will enable sharing of spatial information and infrastructure between agencies, were met as per the SLIP Implementation Plan.
• Procedures are in place to meet Government policy requirements for purchases below and in excess of $20k. Environmental impact issues and Waste 2020 objectives are being included in the contract specifications and selection criteria of at least 80% of all appropriate Tender documentation and Evaluation and Selection Reports.
• DLI’s plan to reduce annual energy costs through its Energy Performance Contract exceeded targets. Three new performance measures developed in 2004/2005 will realise even further savings in 05/06.
• A water audit utilising DLI Performance Improvement Measures was conducted and completed for the DLI Midland Office.

Department of Land Information Annual Report 2004/2005 96
Appendix L DLI and WALIS Publications Available 2004-2005 DLI and WALIS publications may be available in one or more of the following formats: • Hard copy • Electronic copy on the DLI website • Digital copy (CD-Rom) List of DLI publications on website: Titles How to change details on a title Registration Forms Registration fees Notices to Surveyors Customer Information Bulletins CRS User Manual - An Easy Guide To Searching and Ordering CRS User Manual - Full version Land Titles Registration Practice for WA Survey and Plan Practice Manual Report to the Competition Policy Unit, Legislative Review of the Licensed Surveyors Act 1909 Title searching General Search Order Form For Searching Account customers (CAS): CAS Conditions of Use and Application Form CRS Conditions of Use and Application Form Request for Dealing Search Item Unknown Order Form Check Search Order Form General Order Form Survey Order Form Manual Request for Paper Title Request for Status Report Request for Certified Copies Item Known Order Form Field Book Order Form Strata Strata Titles Manual Strata Titles information booklet (A Guide to Strata Titles) Mapping and imagery Using maps of Western Australia - a DLI produced map use booklet

Department of Land Information Annual Report 2004/2005 97
Corporate LandMarks - a magazine for customers and staff Land Matters - a newsletter for Government digital data customers Business Activity Profiles General conditions of contract Annual reports Aerial Photography Brochure (124kb - PDF format) Valuation Service Brochure (887kb - PDF format) Freedom of Information - Application (pdf) Freedom of Information - Information Statement (pdf) New Horizons - Strategic Plan 2002-2005 Providing Access to Land Information (pdf) Government Land & Property eBusiness Solutions (pdf) Media releases List of Total Publications A Guide to Strata Titles Adding a Spouse to Your Land Title – A Guide to Preparing the Documents, March 2002 Application and Transfer of Land by Personal Representative – A Guide to Preparing the Documents, March 2002 Business Activity Profile Central Map Agency, Historical Plans, Exploration Plans, Early Crown Survey Maps, French Exploration Charts Central Map Agency, Catalogue of Products and Services Changing Name on Certificates of Title due to Marriage – A Guide to Preparing the Documents, March 2002 Changing Names and Addresses on Certificates of Title – A Guide to Preparing the Documents, May 2000 Changing your Birth Name on Certificates of Title, October 2001 Conveyancing Support Service Customer Information Bulletin Customer Accounting System (CAS) — Conditions of Use, November, 1993 Customer Product Guides Customer Remote Searching System – Conditions of Use, November 1993

Department of Land Information Annual Report 2004/2005 98
Customer Remote Search System – A Better Way to Access land information, January 2002 Customer Remote Search Internet Guide Customer Remote Search Users’ Manual Customer Service Bulletin – New Access Arrangements and Prices for Spatial Cadastral Information and Tenure Information DLI Annual Reports DLI Bulletin, fortnightly staff information bulletin DLI Products and Services Guide DOLA Information Statement (revised May 2000) DLI International – Partnering Development of Sustainable Land Administration Systems Draft Data Standards for Some WALIS Data Sets (For Comment), October 1998 EAS2 Users’ Manual Emergency Services Directory – Perth North Region Emergency Services Directory – Avon Region Emergency Services Directory – Peel West Region Fieldbook Presentation of Subdivisions By Early Issue of Title Procedures – Examples of Preferred Practice Geographic Name Approvals in Western Australia, two issues GDA 94 Brochure Government Land Administration in WA, April 2001 Helpful Hints on Strata Development, August 1995, (Revised) How to Complete an Historical Search, February, 1995 How to Prepare an Application for New Title to Replace One Lost or Destroyed, October 2002 How to Register a Notification of Change of By-Laws on Strata Plans
Department of Land Information Annual Report 2004/2005 99
How to Register Exemptions from Certain Provisions from Strata Plans Comprising Three to Five Lots Land Enquiry Centre, Materialise Hardcopy (Report/Plot) Products Land Enquiry Centre, Microfiche Products Land for Sale or Lease LandMarks magazine Land Monitor—Monitoring for Management Land Development Process Using Early Issue Procedure Land Lingo—A Glossary of Definitions and Terms Used in Land Administration, 3rd Edition, June 1997 Land Matters Land Titles Registration Practice Manual, Edition 7, February 2001 Land Titles Survey and Plan Practice Manual Maps and Their Uses Booklet Mapping Matters Native Title in Western Australia, 1995 New Horizons Strategic Plan 2000-2005, March 2000 PanAIRama CDs
Principles, Policies and Procedures Geographic Names Committee, February, 1994 Products and Services Catalogue Registrar’s Practice Note, one revision Remote Sensing Services, AGIMAGE On-farm Use of Satellite Data Remote Sensing Services, Monitoring and Managing — The Fight Against Fire Using the NOAA-AVHRR Satellite Remote Sensing Services, Vegetation Watch Project — Questions and Answers Remote Sensing Services, Services and Products from Earth Observation by Satellite

Department of Land Information Annual Report 2004/2005 100
Remote Searching — DOLA Technology Helping You, December, 1993 Report on Damage Caused by the Flood of the Ashburton River in February 1997 Searching for Land Information Simple Transfer of Land – A Guide to Preparing the Documents, October 2002 SmartRegister Project Brochures
Guidelines to Using SmartRegister The Future is SmartRegister Changes to Customer Remote Search and Search Transmission Centre Title Ordering
State Maps 1:25,000 Topographic 1:50,000 Topographic/Cadastral 1:1,000,000 Road Maps 1: 3,000,000 Road Maps
StreetSmart® City and Town Series Maps
Albany Avon Arc Broome and Kununurra Bunbury Busselton and Dunsborough Collie Carnarvon Esperance Geraldton Kalgoorlie/Boulder Karratha and Dampier Mandurah Margaret River and Augusta
StreetSmart Street Directory StreetSmart Street Express StreetSmart Touring Maps
Pilbara South west corner Southern Forests Batavia Coast Gascoyne Coast Greater South West Kimberley Lower Great Southern Goldfields-Esperance Mid west

Department of Land Information Annual Report 2004/2005 101
StreetSmart MetroMaps, 18 in series StreetSmart Metro Local Government Authority and Locality Boundaries StreetSmart City to Bush Series Maps StreetSmart Metro Arterial Roads StreetSmart Perth CBD StreetSmart Fremantle CBD StreetSmart Mandurah CBD StreetSmart Perth Inner Metro StreetSmart Various Town Maps StreetSmart Eastern Stirlings Maps StreetSmart LAS Regional Boundary Maps StreetSmart Local Government Authority Maps with Street Addresses StreetSmart Discover Western Australia Wineries Western Australia map Strata Titles Manual (1999) Survey Marks in Pastoral Areas Survivorship Application Upon Death of a Joint Tenant – A Guide to Preparing the Documents, October 2002 Transfer of Land following Divorce, a guide to preparing the documents, March 2002 Transverse Mercator Project Grids 1995 WASTAC Annual Reports Welcome to Your New Address Your Guide to Lodging a Caveat under Section 137, May 1997 (Revised)

Department of Land Information Annual Report 2004/2005 102
List of WALIS Publications Data management guidelines Guidelines for the WALIS Pricing and Transfer Policy Information About Your Corner of the World Interragator, CD-Rom, 1997, 1998, 1999, 2001 Proceedings of WALIS Forum – 1994 –2000, 2002, 2003, 2005 Value of the Western Australian Land Information System WA Atlas Flyer and Postcard WALIS News Issues 1 – 24 WALIS Pricing and Transfer Policy for Land and Geographic Information held by Western Australian State Government agencies WALIS Strategic Directions, 1998-2000, 2000-2001 WALIS Strategy 2004-07
Department of Land Information Annual Report 2004/2005 103
Glossary of Land Terms Cadastral data or information – usually refers to survey data relating to land boundaries Crown estate – (also called Government land) any parcel of Western Australian land not held in freehold, including reserved and leased land and to three nautical miles from shore. Crown land – (also called Government land) all land in Western Australia not held in freehold, including coastal waters and the seabed. Geocentric Datum – a reference surface which has as its origin the Earth’s centre of mass. Geodetic – related to the measurement of large portions of the Earth’s surface that takes into account the curvature, shape and dimensions of the earth. Geospatial data – land measurements derived from the geodetic control that defines the earth’s surface GIS - Geographic Information System Gross Rental Value (GRV) – Under the Valuation of Land Act, GRV means the gross annual rental that the land might reasonably be expected to realise if let on a tenancy from year to year upon condition that the landlord were liable for all rates, taxes and other charges thereon and the insurance and other outgoings necessary to maintain the value of the land. Spatial data – (see also cadastral data and geospatial data) data related to the measurement of land, often refers to land boundary measurements held as cadastral data Tenure – the manner of holding land, for example freehold or leasehold. Unimproved Value (UV) – A UV is a vacant land value applied to all land in Western Australia. In urban areas it is the site value, and in rural areas it is on the assumption that the land is in its virgin state or a percentage of the improved land value excluding buildings.

AUDITOR GENERAL
4th Floor Dumas House 2 Havelock Street West Perth 6005 Western Australia Tel: 08 9222 7500 Fax: 08 9322 5664
INDEPENDENT AUDIT OPINION To the Parliament of Western Australia DEPARTMENT OF LAND INFORMATION FINANCIAL STATEMENTS FOR THE YEAR ENDED 30 JUNE 2005 Audit Opinion In my opinion,
(i) the controls exercised by the Department of Land Information provide reasonable assurance that the receipt and expenditure of moneys, the acquisition and disposal of property, and the incurring of liabilities have been in accordance with legislative provisions; and
(ii) the financial statements are based on proper accounts and present fairly in accordance with applicable Accounting Standards and other mandatory professional reporting requirements in Australia and the Treasurer’s Instructions, the financial position of the Department at 30 June 2005 and its financial performance and cash flows for the year ended on that date.
Scope The Chief Executive’s Role The Chief Executive is responsible for keeping proper accounts and maintaining adequate systems of internal control, preparing the financial statements, and complying with the Financial Administration and Audit Act 1985 (the Act) and other relevant written law. The financial statements consist of the Statement of Financial Performance, Statement of Financial Position, Statement of Cash Flows, Schedule of Expenses and Revenues by Service, Summary of Consolidated Fund Appropriations and Revenue Estimates, and the Notes to the Financial Statements. Summary of my Role As required by the Act, I have independently audited the accounts and financial statements to express an opinion on the controls and financial statements. This was done by looking at a sample of the evidence. An audit does not guarantee that every amount and disclosure in the financial statements is error free. The term “reasonable assurance” recognises that an audit does not examine all evidence and every transaction. However, my audit procedures should identify errors or omissions significant enough to adversely affect the decisions of users of the financial statements.
D D R PEARSON AUDITOR GENERAL 16 September 2005
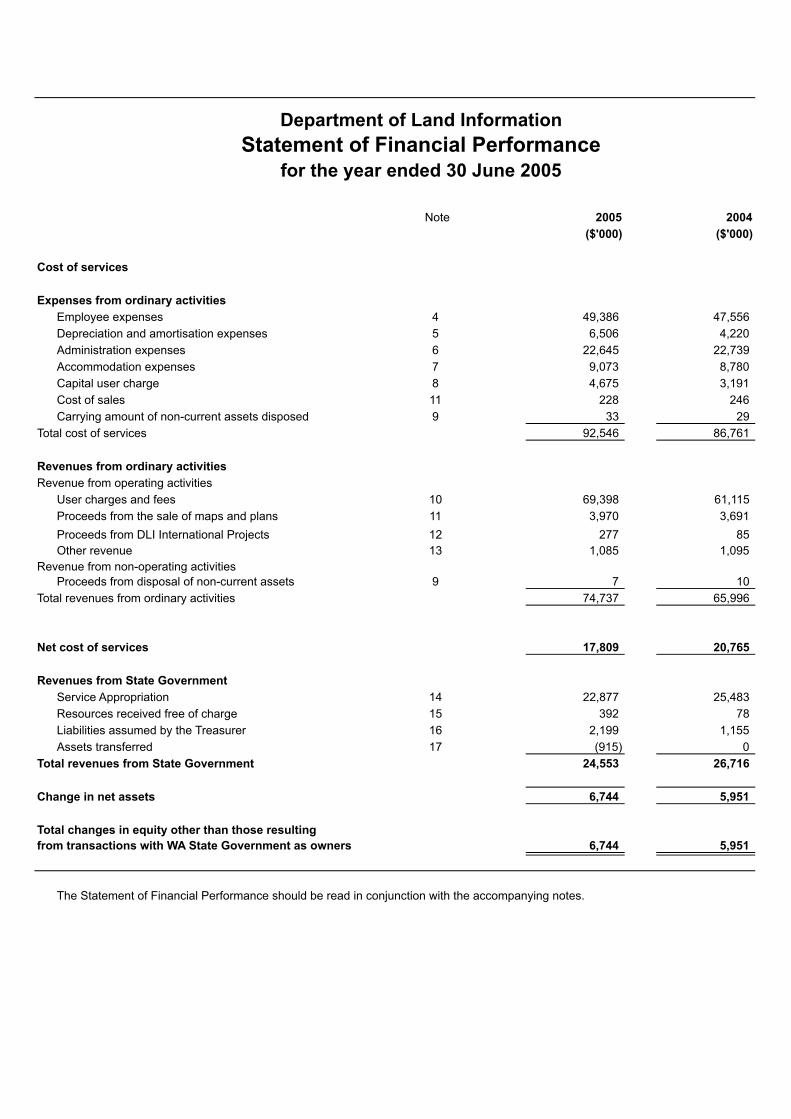
Department of Land InformationStatement of Financial Performance
for the year ended 30 June 2005
Note 2005 2004($'000) ($'000)
Cost of services
Expenses from ordinary activitiesEmployee expenses 4 49,386 47,556 Depreciation and amortisation expenses 5 6,506 4,220 Administration expenses 6 22,645 22,739 Accommodation expenses 7 9,073 8,780 Capital user charge 8 4,675 3,191 Cost of sales 11 228 246 Carrying amount of non-current assets disposed 9 33 29
Total cost of services 92,546 86,761
Revenues from ordinary activitiesRevenue from operating activities
User charges and fees 10 69,398 61,115 Proceeds from the sale of maps and plans 11 3,970 3,691 Proceeds from DLI International Projects 12 277 85 Other revenue 13 1,085 1,095
Revenue from non-operating activitiesProceeds from disposal of non-current assets 9 7 10
Total revenues from ordinary activities 74,737 65,996
Net cost of services 17,809 20,765
Revenues from State GovernmentService Appropriation 14 22,877 25,483 Resources received free of charge 15 392 78 Liabilities assumed by the Treasurer 16 2,199 1,155 Assets transferred 17 (915) 0
Total revenues from State Government 24,553 26,716
Change in net assets 6,744 5,951
Total changes in equity other than those resultingfrom transactions with WA State Government as owners 6,744 5,951
The Statement of Financial Performance should be read in conjunction with the accompanying notes.

Note 2005 2004($'000) ($'000)
Current assetsCash assets 18 14,054 23,935 Restricted cash assets 19 14 1,913 Inventories - maps 188 221 Receivables 20 15,011 6,166 Amounts receivable for services 21 1,481 1,573 Prepayments 22 761 984 Accrued revenue 23 1,816 3,361
Total current assets 33,325 38,153
Non-current assetsAmounts receivable for services 21 13,229 9,524 Equipment, software and furniture 24(a) 28,850 25,180
Total non-current assets 42,079 34,704
Total assets 75,404 72,857
Current liabilitiesPayables 25 718 338 Repayable grant 26 148 103 Provisions 27 7,412 6,828 Other liabilities 28 5,008 10,962
Total current liabilities 13,286 18,231
Non-current liabilitiesRepayable grant 26 333 309 Provisions 27 5,110 4,570
Total non-current liabilities 5,443 4,879
Total liabilities 18,729 23,110
Equity 29Accumulated surplus 40,303 33,559 Contributed equity 184 0 Asset revaluation reserve 16,188 16,188
Total equity 56,675 49,747
Total liabilities and equity 75,404 72,857
The Statement of Financial Position should be read in conjunction with the accompanying notes.
Department of Land InformationStatement of Financial Position
as at 30 June 2005

Note 2005 2004($'000) ($'000)Inflows Inflows
(Outflows) (Outflows)
Cash flows from State GovernmentService appropriations 17,691 20,723 Capital contributions 184 9,471 Distribution to owner 0 (2,422)Assets transferred (915) 0 Holding Account drawdowns 1,573 1,915
Net cash provided by State Government 18,533 29,687
Utilised as follows:
Cash flows from operating activitiesPayments
Employee costs (43,407) (40,970)Superannuation (4,149) (4,093)Administration (24,160) (19,780)Accommodation (9,030) (8,755)Capital user charge (4,675) (3,191)GST payments on purchases (4,460) (3,536)GST payments to taxation authority 0 (166)
ReceiptsUser charges and fees 62,858 59,636 GST receipts on sales 631 1,050 GST receipts from taxation authority 3,286 2,834 Other receipts 6,064 4,509
Net cash provided by (used in) operating activities 30(b) (17,042) (12,462)
Cash flows from investing activitiesProceeds from sale of non-current physical assets 7 10 Purchase of non-current physical assets (13,347) (8,513)
Net cash provided by (used in) investing activities (13,340) (8,503)
Cash flows from financing activitiesRepayable grant received 172 465 Repayable grant paid (103) (103)
Net cash provided by (used in) financing activities 69 362
Net increase/(decrease) in cash held (11,780) 9,084
Cash assets at the beginning of the financial year 25,848 16,764
Cash assets at the end of the financial year 30(a) 14,068 25,848
The Statement of Cash Flows should be read in conjunction with the accompanying notes.
Department of Land InformationStatement of Cash Flows
for the year ended 30 June 2005

2005 2004 2005 2004 2005 2004 2005 2004$'000 $'000 $'000 $'000 $'000 $'000 $'000 $'000
Cost of ServicesExpenses from ordinary activities
Employee expenses 35,470 34,125 13,231 12,735 685 696 49,386 47,556Depreciation and amortisation expense 5,686 3,433 789 751 31 36 6,506 4,220Administration expenses 20,168 20,194 1,617 1,821 860 724 22,645 22,739Accommodation expenses 7,381 7,407 1,584 1,298 108 75 9,073 8,780Capital user charge 3,812 2,730 832 441 31 20 4,675 3,191Cost of sales 228 246 0 0 0 0 228 246Carrying cost of non-current assets disposed 33 29 0 0 0 0 33 29
Total cost of services 72,778 68,164 18,053 17,046 1,715 1,551 92,546 86,761
Revenues from ordinary activitiesRevenues from operating activities
User charges and fees 57,101 53,788 12,297 7,327 0 0 69,398 61,115Proceeds from the sale of maps and plans 3,615 3,343 354 321 1 27 3,970 3,691Proceeds from DLI International Projects 277 10 0 75 0 0 277 85Other revenues 1,012 1,020 0 2 73 73 1,085 1,095
Revenues from non-operating activitiesProceeds from the disposal of non-current assets 7 10 0 0 0 0 7 10
Total revenues from ordinary activities 62,012 58,171 12,651 7,725 74 100 74,737 65,996
Net cost of services 10,766 9,993 5,402 9,321 1,641 1,451 17,809 20,765
Revenues from State GovernmentService appropriation 13,826 12,294 7,430 11,741 1,621 1,448 22,877 25,483Resources received free of charge 369 56 16 22 7 0 392 78Liabilities assumed by the Treasurer 1,553 992 633 160 13 3 2,199 1,155Assets transferred (915) 0 0 0 0 0 (915) 0
Total revenues from State Government 14,833 13,342 8,079 11,923 1,641 1,451 24,553 26,716
Change in net assets 4,067 3,349 2,677 2,602 0 0 6,744 5,951
Total changes in equity other than thoseresulting from transactions with WA State Government as owners 4,067 3,349 2,677 2,602 0 0 6,744 5,951
The Schedule of Expenses and Revenues by Service should be read in conjunction with the accompanying notes.
Department of Land InformationSchedule of Expenses and Revenues by Service
Total
for the year ended 30 June 2005
Valuation ServicesService Land Information Geographic InformationAccess to Government

2005 2005 2005 2004Estimate Actual Variance Actual Actual Variance($'000) ($'000) ($'000) ($'000) ($'000) ($'000)
DELIVERY OF SERVICES
Item 112 Net amount appropriated to deliver services 24,508 22,767 (1,741) 22,767 36,538 (13,771)
Section 25 transfer of appropriation 0 (282) (282) (282) (11,368) 11,086
Amount Authorised by Other Statutes - Salaries and Allowances Act 1975 297 392 95 392 313 79
Total appropriations provided to deliver services 24,805 22,877 (1,928) 22,877 25,483 (2,606)
CAPITAL
Item 166 Capital Contribution 278 184 (94) 184 9,579 (9,395)Section 25 transfer of appropriation 0 0 0 0 (108) 108
Total Capital Contributions 278 184 (94) 184 9,471 (9,287)
GRAND TOTAL OF APPROPRIATIONS 25,083 23,061 (2,022) 23,061 34,954 (11,893)
Details of Expenses by ServiceLand Information 69,848 72,778 2,930 72,778 68,164 4,614 Valuation Services 17,870 18,053 183 18,053 17,046 1,007 Access to Government land or geographic information 1,629 1,715 86 1,715 1,551 164 Total Cost of Services 89,347 92,546 3,199 92,546 86,761 5,785 Less total revenues from ordinary activities (63,137) (74,737) (11,600) (74,737) (65,996) (8,741)Net Cost of Services 26,210 17,809 (8,401) 17,809 20,765 (2,956)Adjustments (1,405) 5,068 6,473 5,068 4,718 350
Total appropriations provided to deliver services 24,805 22,877 (1,928) 22,877 25,483 (2,606)
Capital Expenditure Purchase of non-current physical assets 7,066 9,917 2,851 9,917 8,432 1,485 Transfer of leave entitlements 0 0 0 0 1,480 (1,480)Adjustments for other funding sources (6,788) (9,733) (2,945) (9,733) (441) (9,292)Capital Contribution (appropriation) 278 184 (94) 184 9,471 (9,287)
Explanations of variations between the current year actual results and estimates and variations from previous year actualsare set out in Note 42
Department of Land InformationSummary of Consolidated Fund Appropriations and Revenue Estimates
for the year ended 30 June 2005

1. Departmental mission and funding
The Department's mission is to contribute to the sustainable growth and prosperity of Western Australia through innovative land services, a world class land and property information infrastructure, and an impartial valuation service.
The Department is predominantly funded by revenue retained in accordance with a determination by the Treasurer under Section 23A of the Financial Administration and Audit Act and by annual Parliamentary appropriation from the Consolidated Fund.
The services provided by the Department are on a fee-for-service basis. The fees are charged on a full cost recovery basis. The financial statements encompass all funds through which the Department controls resources to carry on its functions.
In the process of reporting on the Department as a single entity, all intra-entity transactions and balances have been eliminated.
2. Significant accounting policies
The following accounting policies have been adopted in the preparation of the financial statements. Unless otherwise stated, these policies are consistent with those adopted in the previous year.
General statement
The financial statements constitute a general purpose financial report which has been prepared in accordance with Australian Accounting Standards, Statements of Accounting Concepts and other authoritative pronouncements of the Australian Accounting Standards Board, and Urgent Issues Group (UIG) Consensus Views as applied by the Treasurer's Instructions. Several of these are modified by the Treasurer'sInstructions to vary the application, disclosure, format and wording. The Financial Administration and Audit Act and the Treasurer's Instructions are legislative provisions governing the preparation of financial statements and take precedence over Australian Accounting Standards, Statements of Accounting Concepts and other authoritative pronouncements of the Australian Accounting Standards Board, andUIG Consensus Views. The modifications are intended to fulfil the requirements of general application to the public sector, together with the need for greater disclosure and also to satisfy accountability requirements.
If any such modification has a material or significant financial effect upon the reported results, details of that modification and where practicable, the resulting financial effect are disclosed in individual notes to these financial statements.
Basis of accounting
The financial statements have been prepared in accordance with Australian Accounting Standard AAS 29 "Financial Reporting byGovernment Departments".
The statements have been prepared on the accrual basis of accounting using the historical cost convention.
(a) Reporting Entity
The financial statements comprise the Department. There are no related bodies.
(b) Service appropriations
Service Appropriations are recognised as revenues in the period in which the Department gains control of the appropriated funds. The Department gains control of appropriated funds at the time those funds are deposited into the Department's bank account or credited to the holding account held at the Department of Treasury and Finance. (Refer to Note 14 for further commentary on service appropriations).
(c) Contributed equity
Under UIG 38 "Contributions by Owners Made to Wholly-Owned Public Sector Entities" transfers in the nature of equity contributions mustbe designated by the Government (owners) as contributions by owners (at the time of, or prior to transfer) before such transfers can be recognised as equity contributions in the financial statements. Capital contributions (appropriations) have been designated as contributions by owners and have been credited directly to Contributed Equity in the Statement of Financial Position. Non reciprocal transfers of net assets after 1 July 2002 have also been designated as contributions by (or distributions to) owners and taken directly to Contributed Equity, except where the transfer is solely cash and is unrelated to a transfer of function or other assets and liabilities. All other transfers have been recognised in the Statement of Financial Performance (See Note 17 with respect to transfers of cash).
(d) Net appropriation determination
Pursuant to section 23A of the Financial Administration and Audit Act, the net appropriation determination by the Treasurer allows the Department to retain all recurrent Departmental revenue and Commonwealth Specific Purpose Grants and apply them to the Department's services as specified in the 2004-05 Budget Statements. In accordance with the determination, the Department retained $74.737m as at 30 June 2005 ($65.996m in 2004).
(e) Grants and other contributions
Grants, donations, gifts and other non-reciprocal contributions are recognised as revenue when the Department obtains control over the assets comprising the contributions. Control is normally obtained upon their receipt.
Contributions are recognised at their fair value. Contributions of services are only recognised when a fair value can be reliably determined and the services would be purchased if not donated.
DEPARTMENT OF LAND INFORMATIONNotes to the Financial StatementsFor the Year Ended 30 June 2005
DEPARTMENT OF LAND INFORMATIONNotes to the Financial StatementsFor the Year Ended 30 June 2005
(f) Revenue recognition
Revenue from the sale of goods and disposal of other assets and the rendering of services, is recognised when the Department has passed control of the goods or other assets or delivery of the service to the customer.
(g) Acquisitions of assets
The cost method of accounting is used for all acquisitions of assets. Cost is measured as the fair value of the assets given up or liabilities undertaken at the date of acquisition plus incidental costs directly attributable to the acquisition.
Assets acquired at no cost or for nominal consideration, are initially recognised at their fair value at the date of acquisition.
Assets costing less than $1,000 are expensed in the year of acquisition (other than where they form part of a group of similar items which are significant in total).
(h) Depreciation and amortisation of non-current assets
All non-current assets having a limited useful life are systematically depreciated over their useful lives in a manner which reflects the consumption of their future economic benefits.
Depreciation and amortisation are calculated on the straight line basis, using rates which are reviewed annually or as set in the terms of the contract. Expected useful lives for each class of depreciable asset are:
Furniture 11 yearsOffice equipment (including leasehold improvements) 8 - 15 yearsComputer equipment 3 - 5 yearsService delivery software and project costs 1 - 8 years
(i) Employee Benefits
Annual leave
This benefit is recognised at the reporting date in respect to employees’ services up to that date and is measured at the nominal amounts expected to be paid when the liabilities are settled.
Long service leave
The liability for long service leave expected to be settled within 12 months of the reporting date is recognised in the provisions for employee benefits and is measured at the nominal amounts expected to be paid when the liability is settled. The liability for long service leave expected to be settled more than 12 months from the reporting date is recognised in the provisions for employee benefits and is measured at the present value of expected future payments to be made in respect of services provided by employees up to the reporting date.Consideration is given, when assessing expected future payments, to expected future wage and salary levels including relevant on costs, experience of employee departures and periods of service. Expected future payments are discounted using market yields at the reportingdate on national government bonds with terms to maturity and currency that match, as closely as possible, the estimated future cash outflows.
Superannuation
Staff may contribute to the Pension Scheme, a defined benefits pension scheme now closed to new members, or to the Gold State Superannuation Scheme, a defined benefit lump sum scheme now also closed to new members. All staff who do not contribute to either of these schemes become non-contributory members of the West State Superannuation Scheme, an accumulation fund. The Department contributes to this accumulation fund in compliance with the Commonwealth Government's Superannuation Guarantee (Administration) Act 1992. All of these schemes are administered by the Government Employees Superannuation Board (GESB).
The superannuation expense comprises the following elements:
(i) change in the unfunded employer's liability in respect of current employees who are members of the Pension Scheme and current employees who accrued a benefit on transfer from that Scheme to the Gold State Superannuation Scheme; and
(ii) employer contributions paid to the Gold State Superannuation Scheme and the West State Superannuation Scheme.
The superannuation expense does not include payment of pensions to retirees, as this does not constitute part of the cost of services provided by the Department in the current year.
A revenue "Liabilities assumed by the Treasurer" equivalent to (i) is recognised under Revenues from State Government in the Statement of Financial Performance as the unfunded liability is assumed by the Treasurer. The GESB makes the benefit payments and is recouped by the Treasurer.
The Department is funded for employer contributions in respect of the Gold State Superannuation Scheme and the West State Superannuation Scheme. These contributions were paid to the GESB during the year. The GESB subsequently paid the employer contributions in respect of the Gold State Superannuation Scheme to the Consolidated Fund.
The liabilities for superannuation charges under the Gold State Superannuation Scheme and the West State Superannuation Scheme are extinguished by payment of the employer contributions to the GESB.
Employee Benefit on-costs
Employee benefit on-costs are recognised and included in employee benefit liabilities and costs when the employee benefits to which they relate are recognised as liabilities and expenses (See notes 4 and 27).

DEPARTMENT OF LAND INFORMATIONNotes to the Financial StatementsFor the Year Ended 30 June 2005
(j) Leases
The Department has entered into a number of operating lease arrangements for buildings, office equipment and vehicles where the lessors effectively retain all of the risks and benefits incidental to ownership of the items held under the operating leases. Equal instalments of the lease payments are charged to the Statement of Financial Performance over the lease term as this is representative of the pattern of benefits to be derived from the leased property.
(k) Cash
For the purpose of the Statement of Cash Flows, cash includes cash assets and restricted cash assets. These include short-term deposits that are readily convertible to cash on hand and are subject to insignificant risk of changes in value.
(l) Receivables
Receivables are recognised at the amounts receivable as they are due for settlement no more than 30 days from the date of recognition.
Collectability of receivables is reviewed on an ongoing basis. Debts which are known to be uncollectable are written off. A provision for doubtful debts is raised where some doubt as to collection exist.
(m) Accrued salaries
The accrued salaries suspense account (refer Note 19) consists of amounts paid annually into a suspense account over a period of 10 financial years to largely meet the additional cash outflow in each eleventh year when 27 pay days occur in that year instead of the normal 26.No interest is received on this account.
Accrued salaries (refer Note 28) represent the amount due to staff but unpaid at the end of the financial year, as the end of the last pay period for that financial year does not coincide with the end of the financial year. Accrued salaries are settled within a few days of the financial year end. The Department considers the carrying amount of accrued salaries to be equivalent to the net fair value.
(n) Payables
Payables are recognised when the Department becomes obliged to make future payments as a result of a purchase of assets or services. Payables are generally settled within 30 days.
(o) Resources received free of charge or for nominal value
Resources received free of charge or for nominal value which can be reliably measured are recognised as revenues and as assets or expenses as appropriate at fair value.
(p) Foreign currency translation
Transactions denominated in a foreign currency are translated at the rates in existence at the dates of the transactions.
(q) Inventories
Inventories are valued at the lower of cost and net realisable value. Costs are assigned by the method most appropriate to each particular class of inventory, with the majority being valued at average cost.
(r) Comparative figures
Comparative figures are, where appropriate, reclassified so as to be comparable with the figures presented in the current financial year.
(s) Rounding of amounts
Amounts in the financial statements have been rounded to the nearest thousand dollars, or in certain cases, to the nearest dollar.

DEPARTMENT OF LAND INFORMATIONNotes to the Financial StatementsFor the Year Ended 30 June 2005
3. Services of the Department
Information about the Department's services and the expenses and revenues which are reliably attributable to those services is set out in the Schedule of Expenses and Revenues by Service.
The three services of the Department and their objectives as at 30 June 2005 were:
Service 1: Land InformationInformation about land and land ownership is collected, recorded and made available for use by Government,business and the community.
Service 2: Valuation ServicesAn impartial valuation and property information service.
Service 3: Access to Government Geographic InformationLand or geographic information from Western Australian Land Information System (WALIS) community members is managed in a coordinated way so that data held by the WALIS community members can be integrated and readily accessed to meet Government, business and community needs.
2005 2004($'000) ($'000)
4. Employee expensesWages and Salaries 37,968 37,004 Superannuation 6,353 5,192 Annual Leave 3,558 3,589 Long Service Leave 1,507 1,771
49,386 47,556
5. Depreciation and amortisation expenseEquipment 109 129 Computer Equipment 1,611 1,072 Furniture 6 164 Service Delivery Software and Project Costs 4,713 2,808 Leasehold Improvements 67 47
6,506 4,220
6. Administration expensesServices and contracts 17,022 17,671 Grants & Subsidies 160 128 Other staffing costs 479 404 Communications 769 778 Consumables 462 477 Insurance 522 424 Resources received free of charge 392 78 Doubtful Debts 0 79 Travel 498 398 Advertising 87 143 Other administration expenses 2,254 2,159
22,645 22,739
7. Accommodation expensesAccommodation 8,587 8,382 Electricity, gas and water 486 398
9,073 8,780
8. Capital user charge 4,675 3,191 A capital user charge rate of 8% has been set by the Government and represents the opportunity cost of capital invested in the net assets of the Department used in the provision of services. The charge is calculated on the net assets adjusted to take account of exempt assets. Payments are made to the Department of Treasury and Finance on a quarterly basis.
9. Net gain/(loss) on disposal of non-current assetsFurniture, Office and Computer EquipmentCapital Cost 1,775 1,657 Accumulated Depreciation (1,742) (1,628)Carrying Amount of Non Current Assets 33 29 less: Proceeds 7 10 Net gain/(loss) on disposal (26) (19)

DEPARTMENT OF LAND INFORMATIONNotes to the Financial StatementsFor the Year Ended 30 June 2005
2005 2004($'000) ($'000)
10. User charges and feesLand Titles Management Search 17,641 17,620 Transfer 14,072 12,787 Mortgage 9,194 9,033 Discharge 8,661 8,480 Other (Plan Lodgements, Caveats, Applications etc..) 7,531 5,868
57,099 53,788
Valuation Services 12,299 7,327
Total user charges and fees 69,398 61,115
11. Proceeds from the sale of maps and plansProceeds from sale 3,970 3,691 Cost of sale (228) (246)Net proceeds 3,742 3,445
12. Proceeds from DLI International ProjectsProceeds
Vietnam 201 0 Philippines 75 0 Samoa 1 0 Sri Lanka 0 69 Malaysia Study Tour 0 16
277 85 The revenue attributed to Vietnam is in accord with a consortium agreement between DLI and RambollNatura to provide services to the Strengthening Environmental Management and Land Administration in Vietnamproject. This project is in the inception phase. The Swedish International Development Cooperation Agency is providing support for this project. The revenue derived from the Philippines is for the provision of technical assistance (statutory valuation) for the Philippines Australia Land Administration Management Program, a project supported by AusAID and the World Bank.
13. Other revenue from ordinary activities
Land Claims Mapping Unit 389 360 Recovery of costs 40 220 Indian Ocean Territories 13 60 Government Vehicle Scheme 38 33 Other Services 605 422 Total other revenue from ordinary activities 1,085 1,095
14. Service AppropriationsAppropriation revenue received during the year 22,877 25,483
Service appropriations are accrual amounts, reflecting the full cost of services delivered. The appropriation revenue comprises a cash component and a receivable (asset). The receivable (holding account) comprises an allocation for depreciation expense for the year.
15. Resources received free of chargeAdministration expenses 392 78
Resources received free of charge have been determined on the basis of the following estimates provided by agencies:
Department of Treasury and Finance 279 0 Department of Justice 113 78
392 78
Where assets or services have been received free of charge or for nominal consideration, the Department recognises revenues equivalent to the fair value of the assets and/or the fair value of those services that can be reliably determined and which would have been purchased if not donated, and those fair values shall be recognised as assets or expenses, as applicable.

DEPARTMENT OF LAND INFORMATIONNotes to the Financial StatementsFor the Year Ended 30 June 2005
2005 2004($'000) ($'000)
16. Liabilities Assumed by the Treasurer
Superannuation 2,199 1,155 The assumption of the superannuation liability by the Treasurer is only a notional revenue to offset the notional superannuation expense reported in respect of current employees who are members of the pension scheme and current employees who have a transfer benefit entitlement under the Gold State Superannuation Scheme.(Refer Note 2(i) )
17. Assets transferred 915 0
In 2004-05 $915,000 was transferred to the following agencies in accordance with the funding arrangementsapproved by Government for the Shared Land Information Platform (SLIP) initiative:
Department of Agriculture 399 0 Department for Planning and Infrastructure 516 0
915 0 Although non reciprocal in nature, the cash transfers were not related to a transfer of function or to the transfer of other assets and liabilities and, therefore, have been recognised in the Statement of Financial Performance in accordance with Treasurer's Instruction 955(4). (Refer Note 2(c))
18. Cash assetsCash on hand 62 62 Operating bank account 13,992 23,873
14,054 23,935
The decrease in cash was due to the Department's significant capital works program and the settling of the prior year's accrued expenses.
19. Restricted cash assetsCurrentSurvey lodgement fees (i) 14 163 Accrued salaries suspense (ii) 0 1,518 Other suspense accounts (iii) 0 232
14 1,913
(i) Subdivision fees collected on behalf of Department for Planning and Infrastructure.(ii) Amount held in the suspense account is only used for the purpose of meeting the 27th pay in a
financial year that occurs every 11 years. As the 27th pay occurred in 2004-05, the account was fullydrawn leaving a nil balance at year end.
(iii) Funds received and awaiting distribution to appropriate accounts.
20. ReceivablesTrade Debtors 14,433 5,807 Goods and services tax 615 442 Less: Provision for doubtful debts (37) (83)
15,011 6,166
The significant increase in trade debtors from 2003-04 is largely due to the completion of the Valuer General'striennial Metropolitan Revaluation Program in 2004-05, resulting in invoices totalling approximately $9.5m being raised in June 2005. Collection is due in early part of 2005-06.
21. Amounts receivable for servicesCurrent 1,481 1,573 Non-current 13,229 9,524
14,710 11,097
This asset represents the non-cash component of service appropriations. It is restricted in that it can only be used for asset replacement. (Refer Note 14)
22. PrepaymentsData processing contracts 568 773 Other 193 211
761 984 23. Accrued Revenue
Valuation services 1,785 3,269 Other 31 92
1,816 3,361

DEPARTMENT OF LAND INFORMATIONNotes to the Financial StatementsFor the Year Ended 30 June 2005
2005 2004($'000) ($'000)
24. a) Equipment, software and furniture
EquipmentAt cost 2,162 2,247 Accumulated depreciation (1,642) (1,644)
520 603
Computer equipmentAt cost 10,394 11,530 Accumulated depreciation (8,118) (8,106)
2,276 3,424
Leasehold ImprovementsAt cost 1,049 590 Accumulated amortisation (162) (121)
887 469
Total equipment 3,683 4,496
FurnitureAt cost 1,858 1,868 Accumulated depreciation (1,829) (1,829)Total furniture 29 39
Service delivery software and project costsAt cost 40,553 31,420 Accumulated depreciation (24,710) (19,998)Written down value 15,843 11,422 Work in progress at cost 9,295 9,223 Total service delivery 25,138 20,645
Total equipment, software and furniture 28,850 25,180
b) Reconciliations
Reconciliations of the carrying amounts of equipment, software and furniture at the beginning and end of the current financial year are set out below.
Equipment Computer Leasehold FurnitureEquipment Improvements
($'000) ($'000) ($'000) ($'000)Carrying amount at June 30 2004 603 3,424 469 39Additions 48 474 222 0Transfers 0 0 263 0Disposals (22) (11) 0 0Depreciation (109) (1,611) (67) (6)Adjustments 0 0 0 (4)Carrying amount at June 30 2005 520 2,276 887 29
Service Delivery
(380)
9,223
Progress
0
20
0
9,295
2005 Software andProject Costs
9,829
00
($'000)11,422
9,114
Worksin
TOTAL
(364)15,843
0(9,377)
($'000)($'000)
28,850
25,18010,573
(33)(4,713) (6,506)
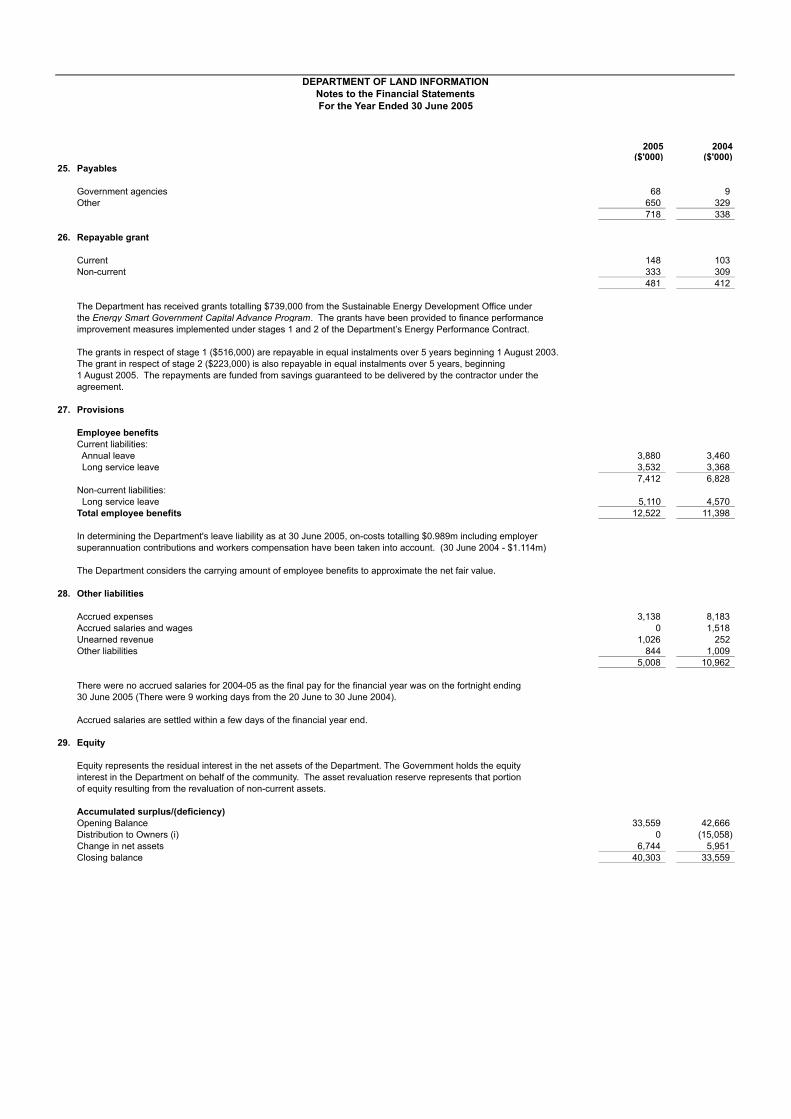
DEPARTMENT OF LAND INFORMATIONNotes to the Financial StatementsFor the Year Ended 30 June 2005
2005 2004($'000) ($'000)
25. Payables
Government agencies 68 9 Other 650 329
718 338
26. Repayable grant
Current 148 103 Non-current 333 309
481 412
The Department has received grants totalling $739,000 from the Sustainable Energy Development Office underthe Energy Smart Government Capital Advance Program. The grants have been provided to finance performanceimprovement measures implemented under stages 1 and 2 of the Department’s Energy Performance Contract.
The grants in respect of stage 1 ($516,000) are repayable in equal instalments over 5 years beginning 1 August 2003.The grant in respect of stage 2 ($223,000) is also repayable in equal instalments over 5 years, beginning 1 August 2005. The repayments are funded from savings guaranteed to be delivered by the contractor under the agreement.
27. Provisions
Employee benefitsCurrent liabilities: Annual leave 3,880 3,460 Long service leave 3,532 3,368
7,412 6,828 Non-current liabilities: Long service leave 5,110 4,570 Total employee benefits 12,522 11,398
In determining the Department's leave liability as at 30 June 2005, on-costs totalling $0.989m including employer superannuation contributions and workers compensation have been taken into account. (30 June 2004 - $1.114m)
The Department considers the carrying amount of employee benefits to approximate the net fair value.
28. Other liabilities
Accrued expenses 3,138 8,183 Accrued salaries and wages 0 1,518 Unearned revenue 1,026 252 Other liabilities 844 1,009
5,008 10,962
There were no accrued salaries for 2004-05 as the final pay for the financial year was on the fortnight ending 30 June 2005 (There were 9 working days from the 20 June to 30 June 2004).
Accrued salaries are settled within a few days of the financial year end.
29. Equity
Equity represents the residual interest in the net assets of the Department. The Government holds the equity interest in the Department on behalf of the community. The asset revaluation reserve represents that portion of equity resulting from the revaluation of non-current assets.
Accumulated surplus/(deficiency)Opening Balance 33,559 42,666 Distribution to Owners (i) 0 (15,058)Change in net assets 6,744 5,951 Closing balance 40,303 33,559

DEPARTMENT OF LAND INFORMATIONNotes to the Financial StatementsFor the Year Ended 30 June 2005
2005 2004($'000) ($'000)
Contributed equityOpening balance 0 13,464 Capital Contributions (ii) 184 9,471 Total Contribution by Owners 184 22,935
Distribution to Owners (i) 0 (22,935)
Closing balance 184 0
Asset revaluation reserve (iii)Opening Balance 16,188 16,188 Net revaluation increment/(decrement) 0 0 Closing balance 16,188 16,188
Total equity 56,675 49,747
(i) In 2003-04, there was a non reciprocal transfer of net assets to government as a result of the transfer of Crown Land Services to the Department for Planning and Infrastructure (designated as Distribution to Owners in Treasurer's Instruction 955) - totalling $37.993m ($15.058m + $22.935m = $37.993m).
(ii) Capital appropriations, termed Capital Contributions, have been designated as contributions by owners andare credited directly to equity in the Statement of Financial Position.
(iii) The asset revaluation reserve is used to record increments and decrements on the revaluation of non current assets.
30. Notes to the Statement of Cash Flows
(a) Reconciliation of cash
For the purpose of the Statement of Cash Flows, cash includes cash at bank, amounts in suspense and restricted cash. Cash at the end of the financial year as shown in the Statement of Cash Flows is reconciled to the related items in the Statement of Financial Position as follows:
Cash assets (Refer Note 18) 14,054 23,935 Restricted cash assets (Refer Note 19) 14 1,913
14,068 25,848
(b) Reconciliation of net cost of services to net cash flows provided by/(used in) operating activities
Reconciliation of net cost of services to net cash flow provide by /(used in) operating activities.
Net cash (used in) operating activities (Statement of Cash Flows) (17,042) (12,462)
Non-cash items:Depreciation expense (6,506) (4,220)Superannuation expense (2,199) (1,155)Resources received free of charge (392) (78)Doubtful debts expense 0 (79)Write-back of doubtful debts expense 46 0 Net loss on disposal of non-current assets (26) (19)Works in Progress expensed relating to prior years (350) 0
Increase/(decrease) in assets:Current inventories (33) (3)Current receivables 8,328 101 Prepayments (223) 157 Accrued revenue (1,545) 1,389
(Increase)/decrease in liabilities:Accounts payable (381) (291)Employee benefits (1,124) (797)Other liabilities 3,471 (3,461)
Net GST (receipts)/payments 543 (183)Change in GST in receivables/payables (376) 336
Net cost of services (Statement of Financial Performance) (17,809) (20,765)
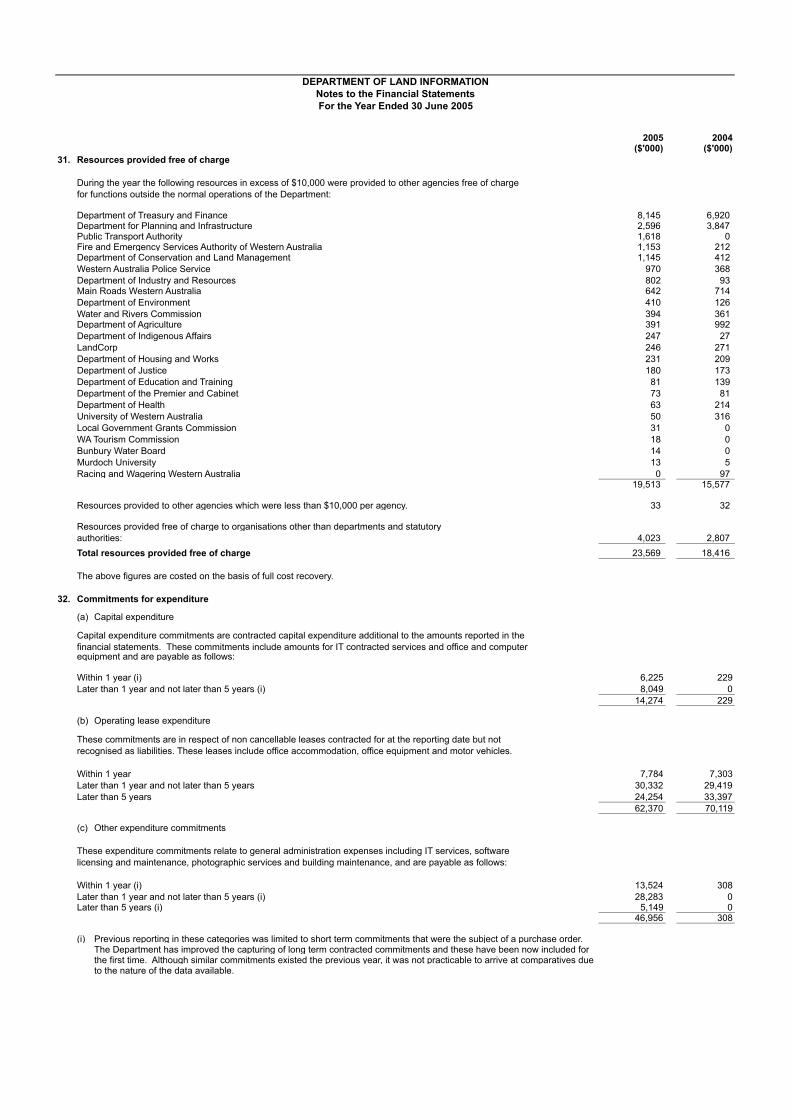
DEPARTMENT OF LAND INFORMATIONNotes to the Financial StatementsFor the Year Ended 30 June 2005
2005 2004($'000) ($'000)
31. Resources provided free of charge
During the year the following resources in excess of $10,000 were provided to other agencies free of charge for functions outside the normal operations of the Department:
Department of Treasury and Finance 8,145 6,920 Department for Planning and Infrastructure 2,596 3,847 Public Transport Authority 1,618 0 Fire and Emergency Services Authority of Western Australia 1,153 212 Department of Conservation and Land Management 1,145 412 Western Australia Police Service 970 368 Department of Industry and Resources 802 93 Main Roads Western Australia 642 714 Department of Environment 410 126 Water and Rivers Commission 394 361 Department of Agriculture 391 992 Department of Indigenous Affairs 247 27 LandCorp 246 271 Department of Housing and Works 231 209 Department of Justice 180 173 Department of Education and Training 81 139 Department of the Premier and Cabinet 73 81 Department of Health 63 214 University of Western Australia 50 316 Local Government Grants Commission 31 0 WA Tourism Commission 18 0 Bunbury Water Board 14 0 Murdoch University 13 5 Racing and Wagering Western Australia 0 97
19,513 15,577
Resources provided to other agencies which were less than $10,000 per agency. 33 32
Resources provided free of charge to organisations other than departments and statutoryauthorities: 4,023 2,807 Total resources provided free of charge 23,569 18,416
The above figures are costed on the basis of full cost recovery.
32. Commitments for expenditure
(a) Capital expenditure
Capital expenditure commitments are contracted capital expenditure additional to the amounts reported in the financial statements. These commitments include amounts for IT contracted services and office and computer equipment and are payable as follows:
Within 1 year (i) 6,225 229Later than 1 year and not later than 5 years (i) 8,049 0
14,274 229
(b) Operating lease expenditure
These commitments are in respect of non cancellable leases contracted for at the reporting date but not recognised as liabilities. These leases include office accommodation, office equipment and motor vehicles.
Within 1 year 7,784 7,303Later than 1 year and not later than 5 years 30,332 29,419Later than 5 years 24,254 33,397
62,370 70,119
(c) Other expenditure commitments
These expenditure commitments relate to general administration expenses including IT services, software licensing and maintenance, photographic services and building maintenance, and are payable as follows:
Within 1 year (i) 13,524 308Later than 1 year and not later than 5 years (i) 28,283 0Later than 5 years (i) 5,149 0
46,956 308
(i) Previous reporting in these categories was limited to short term commitments that were the subject of a purchase order. The Department has improved the capturing of long term contracted commitments and these have been now included forthe first time. Although similar commitments existed the previous year, it was not practicable to arrive at comparatives due to the nature of the data available.

DEPARTMENT OF LAND INFORMATIONNotes to the Financial StatementsFor the Year Ended 30 June 2005
2005 2004($'000) ($'000)
33. Remuneration of senior officers
RemunerationThe number of senior officers whose total of fees, salaries, superannuation and other benefits for the financial year, fall within the following bands are:
$ $ 2005 200410,001 - 20,000 1 130,001 - 40,000 1 090,001 - 100,000 0 1
100,001 - 110,000 1 0110,001 - 120,000 1 1120,001 - 130,000 1 3130,001 - 140,001 2 0140,001 - 150,000 0 1160,001 - 170,000 1 0180,001 - 190,000 0 1220,001 - 230,000 1 0
9 8The total remuneration of senior officers is: 1,046 932
The superannuation included here represents the superannuation expense incurred by the Department in respect of senior officers.
Two senior officers are members of the Pension Scheme in 2005 (two senior members in 2004).
34. Financial Instruments
(a) Interest rate risk exposure
The following table details the Department's exposure to interest rate risk as at the reporting date. The financial instruments listed are all non interest bearing.
Financial instruments
Financial assetsCash assets 14,054 Restricted cash assets 14 Receivables 15,011 Accrued Revenue 1,816
30,895
Financial liabilities Payables 718 Provisions 12,522 Repayable grant 481 Other liabilities 5,008
18,729
(b) Credit risk exposure
All financial assets are unsecured.
Amounts owing by other government agencies are not considered a credit risk. In respect of other financial assets, the carrying amounts represent the Department's maximum exposure to credit risk in relation to those assets.
(c) Net fair values
The carrying amount of financial assets and financial liabilities recorded in the financial statements are not materially different from their net fair values, determined in accordance with the accounting policies disclosed in Note 2 to the financial statements.
23,9351,913
23,11010,962
338
($'000)
3,361
2005Total
6,166
BearingNon Interest
BearingNon Interest
11,398
35,375
2004Total
($'000)
412
DEPARTMENT OF LAND INFORMATIONNotes to the Financial StatementsFor the Year Ended 30 June 2005
35. Contingent liabilities
In addition to the liabilities incorporated in the financial statements, the Department has the following contingent liabilities:(i) The Department has pending or potential litigation that may affect the financial position to the value of $1.054m. ($0.995m in 2003-04)(ii) There is a pending claim of copyright by Copyright Agency Limited (acting for surveyors) estimated at $50,000 ($50,000 in 2003-04) for
the paper copying of survey plans by the Department. This claim arises out of the proposed agreement between the State of Western Australia and Copyright Agency Limited in respect of the use of all copyright materials by the State of which survey planspotentially form a part. Due to the complexity of the issues involved and the dispute by the state in relation to some aspects ofliability copying survey plans, that part of the proposed agreement relating to survey plans has been removed from the agreementthat deals with copyright for the whole of the State and is the subject of further negotiations.
(iii) There is at present a claim in the Copyright Tribunal against the State of NSW for copies of digital plans and the use of those plansin the Digital Cadastral Database. This has potential to impact Western Australia but the precedent value and biding nature of a decision of the Copyright Tribunal is at issue. The financial impact of this claim is very uncertain as it may apply to Western Australia.The Department is currently seeking advice from the State Solicitor's Office as to litigating this claim.
36. Intellectual property
The Department's intellectual property consists of software, data, databases, administrative records, publications, products, trademarks and know-how in the categories listed below. At reporting date the intellectual property cannot be reliably measured, and accordingly has not been recognised as an asset in the financial statements:
1) Air PhotographyA collection of images of various parts of Western Australia. The collection dates from 1948 to the current time and has significant historical importance.
2) Spatial Cadastral DatabaseA single, seamless map of Western Australia covering property boundaries.
3) Geodetic Survey Marks DatabaseInformation that maintains a viable reference framework infrastructure for all survey, mapping and associated land informationpurposes in Western Australia.
4) GEONOMA DatabasePlace name information for Western Australia, including position, origin, meaning and classification of names.
5) Registered trademarks * SmartPlan * SmartRegister * Landgate * StreetSmart
6) Copyright, design, artwork and "know how" related to mapping products (digital and analogue) and publications (including internet design).
7) Tenure * Tenure Systems - systems containing descriptions of how land is held, eg freehold or reserve. * Title and Document Images - digital copies of titles and documents that are held in a central location.
8) Topographic DatabaseRepository of all geographic land information stored in terms of relief, cultural, road centreline, hydrography, property street address, geographic names, ortho-imagery, coastlines and points of interest.
9) Satellite Imagery Digital datasets of satellite acquired images maintained in a catalogue archive.
10) Land Claims DatabaseSpatial data recording external boundaries of native title claims, status and claimants.
11) Thematic DatabasesData fundamentally used in the preparation of thematic mapping products, eg StreetSmart Touring Maps, Street Directory and WA Travellers Atlas.
12) Land and Property Improvements DatabaseA repository that contains a description of the physical characteristics of land and improvements to land.
13) Land Valuations DatabaseA database of current and previous values determined by the Valuer General.
14) Property Sales and Rentals DatabaseA repository of historical sales and rental information integrated with land and property descriptions.
15) Computer Assisted Valuation MethodologyA suite of integrated software that assists with the mass appraisal of values.
16) Work Management System DatabaseA suite of software that provides the recording and allocation of human resources across services.
17) Property/Valuation GISIntegrated spatial and textual data displayed via a customised suite of software.

DEPARTMENT OF LAND INFORMATIONNotes to the Financial StatementsFor the Year Ended 30 June 2005
2005 2004($'000) ($'000)
37. Events occurring after balance date
There have been no significant events occurring after 30 June 2005 that affect these financial statements.
38. Remuneration of auditor
Remuneration to the Auditor General for the financial year is as follows:
Auditing the accounts, financial statements and performance indicators 107 100
39. Affiliated body
The Land Surveyors' Licensing Board is an affiliated body in that it received administrative support and a grant of $10,000 from the Department. The Board is not subject to the operational control of the Department and reports to Parliament separately.
2005 2004 ($) ($)
40. Supplementary financial information (expressed in whole dollars)
(a) Write offsDuring the financial year $22,620 was written off by the Department:
Public and other property 4,036 3,656 Revenue and debts 18,584 5,540
22,620 9,196
These write-offs were under the authority of:
The Accountable Officer 22,620 9,196 The Minister 0 0 Executive Council 0 0
22,620 9,196
(b) Losses through theft, defaults and other causesLosses of public monies and public and other property through theft or default 17 9 Amount recovered 0 0
17 9
(c) Gifts of Public PropertyGifts of public property provided by the Department 341 579
41. Trust Accounts 2005 2004($'000) ($'000)
The trust accounts are reported on a cash basis.
Private Trust
(a) Payroll Deductions
The purpose of the trust account is to hold income tax instalments and Government Employees Housing Authority (GEHA) rent contributions, deducted from salaries and wages of employees of the Department of Land Information Group Payroll.
Opening balance 22 13 Receipts 11,989 10,248 Payments The Australian Taxation Office (12,011) (10,239) GEHA 0 0 Closing balance 0 22

DEPARTMENT OF LAND INFORMATIONNotes to the Financial StatementsFor the Year Ended 30 June 2005
(b) From 1 July 2003, Government transferred responsibility for Crown Land Services to the Department for Planning and Infrastructure. Consequently, all attendant assets and liabilities were transferred effective from that date. This included three trust accounts:
- Deposits: Land Applications - War Service Land Settlement - DBNGP Corridor Trust
During 2003-04 the only transactions against these trust accounts were the transfer of closing balancesas at 30 June 2003 to the Department for Planning and Infrastructure. No transactions were recorded against these trust accounts in 2004-05.
The balance of each trust account as at 30 June 2003 was as follows:($'000)
- Deposits: Land Applications 300 - War Service Land Settlement 2 - DBNGP Corridor Trust #########
42. Explanatory statement
The Summary of Consolidated Fund Appropriations and Revenue Estimates discloses appropriations and other statutes expenditure estimates, the actual expenditures made and revenue estimates and payments into the Consolidated Fund. Appropriations are now on an accrual basis.
The following explanations are provided in accordance with Treasurer's Instruction 945.Significant variations are considered to be those greater than 10%.
(i) Significant variances between estimates and actual - Total Appropriation to deliver services
2005Estimate Variance
$'000 $'000
1. Total revenues from Ordinary Activities 63,137 11,600
The $11.6m or 18.4% variance was mainly due to better than expected results in Land Titles Management caused by Western Australia's property market continuing to operate at record levels.
(ii) Significant variances between actual and prior year actual - Total Appropriation to deliver services
2005Actual Variance$'000 $'000
1. Total Appropriation to provided to deliver services 22,877 (2,606)
The $2.606m or 11.4% reduction was primarily due to cash flow adjustments totalling $4.9m that related to the revenue collection cycle of the Valuer General's triennial Metropolitan Revaluation Program, where the resultant revenue is only collected every third year. As 2004-05 was the final year of that triennium, the reduction in appropriation was offset by increased revenue from ordinary activities.
There were other reductions to the appropriation totalling $760,000 for Procurement Reform and the transfer of procurement staff to the Department of Treasury and Finance.
The above funding reductions were offset by funding increases totalling $3.1m for salary adjustments ($1.1m), capital user charge and depreciation adjustments ($0.9m), the Shared Land Information Platform initiative ($0.7m) and other costs ($0.4m).
2. Total Revenues from Ordinary Activities 8,741
The $8.741m or 13.2% increase on last year mainly comprised: (i) valuation services ($5.0m), due largely to the completion of the triennial Metropolitan Revaluation Program; and (ii) Land Titles Management ($3.5m), due to the property market continuing to operate at record levels.
Actual
2005
74,737
$'000
74,737
25,483
2004
$'000Actual
65,996

DEPARTMENT OF LAND INFORMATIONNotes to the Financial StatementsFor the Year Ended 30 June 2005
(iii) Significant variances between estimates and actual - Capital Contributions2005
Estimate Variance$'000 $'000
1. Capital Contribution 184 (94)
The $94,000 reduction was a funding adjustment arising from Government's Procurement Reform Harvest.
2. Capital Expenditure
Purchase of non-current physical assets 9,917 2,851
The $2.851m or 40.3% variance was due to expenditure that had been deferred from 2003-04.
(iv) Significant variances between actual and prior year actual - Capital Contribution:2005
Actual Variance$'000 $'000
1. Capital Contribution 9,471 (9,287)
The variance is mainly due to the increased funding provided in 2003-04 with respect to the Department's e-Business initiative. In 2004-05 the capital works program was mostly funded from internal funds and balances.
2. Capital Expenditure
Purchase of non-current physical assets 8,432 1,485 Transfer of leave entitlements 1,480 (1,480)
The increase in purchases of non-current physical assets is due to the increased investment in the Department's e-Business initiative and business infrastructure requirements to support the initiative and existing business arrangements.
The $1.480m transfer of leave entitlements in 2003-04 was in respect of staff transferred with Crown 'Land Services and was done in accordance with the requirements of Treasurer's Instruction 520, Transfer of Employees.
43. Indian Ocean Territories Service Delivery Arrangement
The provision of services to the Indian Ocean Territories (IOT) are recouped from the Commonwealth government.
2005 2004($'000) ($'000)
Opening balance 56 120 Receipts 0 99 Payments (24) (163)Closing balance 32 56
The balance in the account will be offset against IOT work that will be done during 2005-06.
44. Impact of adopting Australian Equivalents to IFRS
Australia is adopting Australian equivalents to International Financial Reporting Standards (AIFRS) for reporting periods beginning on or after 1 January 2005. The Department of Land Information will adopt these Standards for the first time for the year ended 30 June 2006.
AASB 1047 'Disclosing the Impacts of Adopting Australian Equivalents to International Financial Reporting Standards' requires disclosure of any known or reliably estimable information about the impacts on the financial statements had they been prepared using AIFRSs.
The impact of adopting AIFRS including the key differences in accounting policies are as follows-
(a) Reconciliation of total equity as reported under previous AGAAP to that under AIFRS:30 June 2005 1 July 2004
($'000) ($'000)
Total equity under previous AGAAP 56,675 49,747
De-recognition of capitalised research and development costs (i) (187) (521)
Reduce accumulated depreciation for assets de-recognised (ii) 43 0
Total equity under AIFRS 56,531 49,226
2005
09,917
184
$'000
Actual$'000
7,066
278
Actual2004

DEPARTMENT OF LAND INFORMATIONNotes to the Financial StatementsFor the Year Ended 30 June 2005
(b) Reconciliation of surplus/(deficit) for the period as presented under previous AGAAP to that under AIFRS:
30 June 2005($'000)
Surplus/deficit for the period under previous AGAAP 6,744
De-recognition of depreciation expense for research and development costs (iii) 43
Surplus/deficit for the period under AIFRS 6,787
The adjustments are explained as follows:
(i) AASB 138 requires that all research costs must be expensed and imposes stricter recognition for the capitalisation of development costs. As a consequence, certain research and development costs previously capitalised must be de-recognised.
(ii) Due to the above requirement, the accumulated depreciation applicable to research and development costs de-recognised must be eliminated.
(iii) De-recognition of depreciation expense for research and development costs as a consequence of the above.