department of infrastructure and regional … such as the combined effects of the boat ramp and...
TRANSCRIPT

Department of Infrastructure and Regional Development
Cocos Keeling Islands Sand Management Strategy Numerical Modelling Report
February 2017


GHD | Report for Department of Infrastructure and Regional Development - Cocos Keeling Islands Sand Management
Strategy, 61/34775 | i
Table of contents 1. Introduction ............................................................................................................................... 1
1.1 Background ..................................................................................................................... 1 1.2 Purpose of this report ...................................................................................................... 1 1.3 Scope of Modelling .......................................................................................................... 1 1.4 Methodology ................................................................................................................... 1 1.5 Scope and limitations ...................................................................................................... 2 1.6 Assumptions and Limitations ........................................................................................... 3
2. Physical Information .................................................................................................................. 4 2.1 Bathymetric Data ............................................................................................................. 4 2.2 Water Level ..................................................................................................................... 4 2.3 Metocean Data ................................................................................................................ 4 2.4 Sediment Data ................................................................................................................ 5 2.5 Seabed Features ............................................................................................................. 6
3. Numerical Model System ........................................................................................................... 7 3.1 Model Description ............................................................................................................ 7 3.2 Model Setup .................................................................................................................... 7 3.3 Model Calibration .......................................................................................................... 11
4. Results .................................................................................................................................... 13 4.1 Simulations ................................................................................................................... 13 4.2 Wave Patterns ............................................................................................................... 13 4.3 Ebb and Flood ............................................................................................................... 13 4.4 Induced Residual Currents ............................................................................................ 13 4.5 Maximum Currents ........................................................................................................ 15 4.6 Sediment Transport ....................................................................................................... 17
5. Summary and Conclusion ....................................................................................................... 18 5.1 Summary....................................................................................................................... 18 5.2 Sediment Transport Results .......................................................................................... 18
6. References ............................................................................................................................. 20
Table index Table 1 Tidal planes (Australian Hydrographic Service, 2011) ...................................................... 4
Table 2 PSD Analysis .................................................................................................................. 5
Figure index

ii | GHD | Report for Department of Infrastructure and Regional Development - Cocos Keeling Islands Sand Management
Strategy, 61/34775
Figure 1 Location of data extraction points .................................................................................... 5
Figure 2 Seafloor Classification – Habitats – Cocos Island (EOMAP 2016) .................................... 6
Figure 3 Mesh and Bathymetry for model ...................................................................................... 8
Figure 4 Selection of Study Periods ............................................................................................... 9
Figure 5 Wave Periods through July and August 2008 ................................................................. 10
Figure 6 Boundary Tidal Data for July and August 2008 .............................................................. 10
Figure 7 Variable Bed Roughness Map (Manning Number) ......................................................... 11
Figure 8 Water Level Calibration at Home Island tidal gauge ....................................................... 12
Figure 9 Ebb and Flood Currents ................................................................................................ 14
Figure 10 Residual Currents – Winter Simulation Period................................................................ 15
Figure 11 Residual Currents – Summer Simulation Period ............................................................ 16
Figure 12 Maximum Currents ........................................................................................................ 16
Figure 13 Erosion and Accretion Hot Spots (Based on assumed availability of sand) ..................... 17
Appendices Appendix A – Typical Wave Plots

GHD | Report for Department of Infrastructure and Regional Development - Cocos Keeling Islands Sand Management
Strategy, 61/34775 | 1
1. Introduction 1.1 Background
Sand management on the Cocos (Keeling) Islands (CKI) has been an ongoing issue with seasonal and storm erosion placing assets on the external coast of West Island in particular at risk. Coastal erosion risk on the island has been compounded by limited sand sources suitable for use in construction of foreshore protection measures. In addition, ongoing sand extraction has exacerbated shoreline movement and construction of structures changing longshore currents, such as the combined effects of the boat ramp and Rumah Baru Freight and Passenger facility, have altered local sediment transport pathways.
At the request of the Department of Infrastructure and Regional Development (DIRD), CKI Port has sought assistance from GHD to provide an update of the 2000 Coastal Management Plan. GHD had previously developed and calibrated a hydrodynamic model of the Cocos (K) Islands that was utilised as the basis for the dredge plume turbidity model used to assess the impacts from dredging at the Home Island Slipway.
As part of the current study, GHD have developed a new hydrodynamic model aimed at providing a better understanding of the sediment budget within the Cocos Islands lagoon area.
The purpose of the modelling study was to improve understanding of seasonal hydrodynamics, specifically current patterns, speeds and net currents within the lagoon and along the atoll beaches to inform potential sediment transport patterns and dynamics.
Improved quantification of hydrodynamics will allow assessment of potential sediment transport circulation and rates which will assist in identifying vulnerable sites and suitable sediment sources for future sand harvesting.
1.2 Purpose of this report
This report provides a summary of information used to setup the hydrodynamic model of the CKI atoll and describes the results and how they can be used to assess the sediment transport within the lagoon. It also provides recommendations on the use of the model results in the assessment of suitability of various areas for sand extraction.
1.3 Scope of Modelling
The modelling scope proposed is as follows:
1. Update the bathymetry in the existing model with most recent hydrographic survey, and update the model mesh to increase resolution in the lagoon and around the islands; and
2. Develop a coupled hydrodynamic and wave (Mike 21 HD/SW) model to establish the current patterns and magnitude in the lagoon and around the atoll for:
a typical winter;
a typical summer (storm influenced); and
a typical year.
1.4 Methodology
The aim of the modelling study was to establish the dynamics of the currents around the Cocos (K) Islands and within the lagoon. GHD have previously setup a model to evaluate currents around the island.
2 | GHD | Report for Department of Infrastructure and Regional Development - Cocos Keeling Islands Sand Management
Strategy, 61/34775
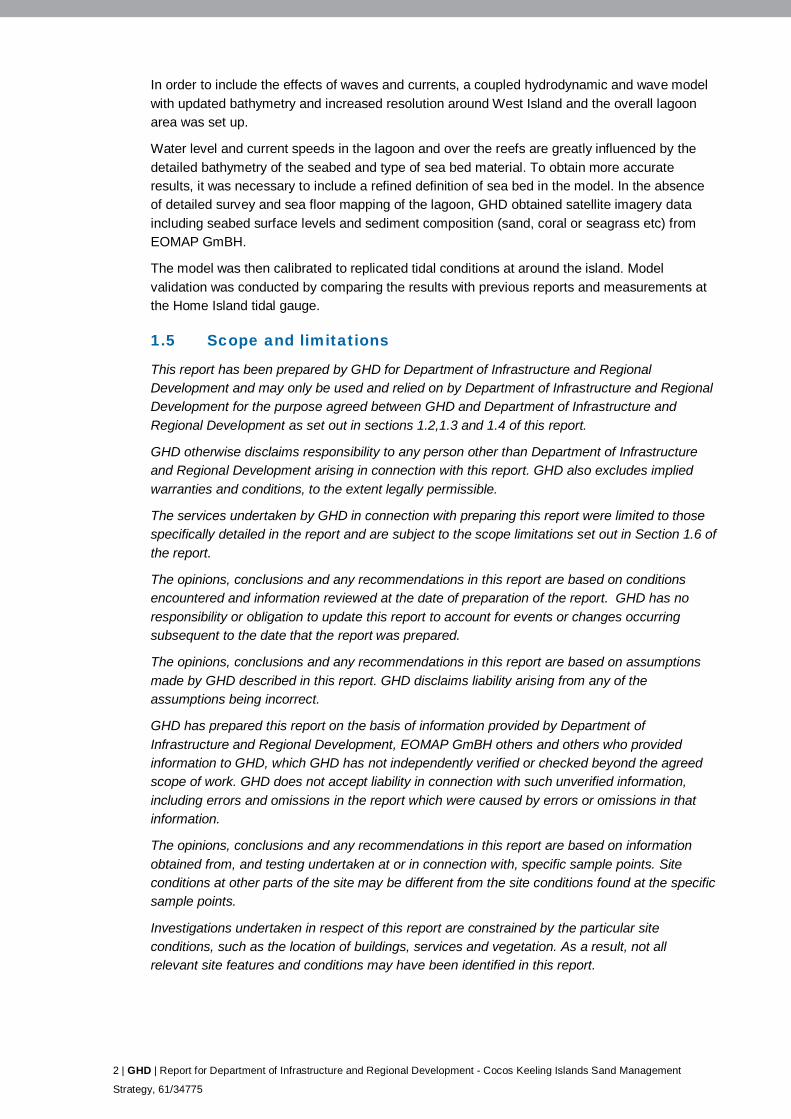
In order to include the effects of waves and currents, a coupled hydrodynamic and wave model with updated bathymetry and increased resolution around West Island and the overall lagoon area was set up.
Water level and current speeds in the lagoon and over the reefs are greatly influenced by the detailed bathymetry of the seabed and type of sea bed material. To obtain more accurate results, it was necessary to include a refined definition of sea bed in the model. In the absence of detailed survey and sea floor mapping of the lagoon, GHD obtained satellite imagery data including seabed surface levels and sediment composition (sand, coral or seagrass etc) from EOMAP GmBH.
The model was then calibrated to replicated tidal conditions at around the island. Model validation was conducted by comparing the results with previous reports and measurements at the Home Island tidal gauge.
1.5 Scope and limitations
This report has been prepared by GHD for Department of Infrastructure and Regional Development and may only be used and relied on by Department of Infrastructure and Regional Development for the purpose agreed between GHD and Department of Infrastructure and Regional Development as set out in sections 1.2,1.3 and 1.4 of this report.
GHD otherwise disclaims responsibility to any person other than Department of Infrastructure and Regional Development arising in connection with this report. GHD also excludes implied warranties and conditions, to the extent legally permissible.
The services undertaken by GHD in connection with preparing this report were limited to those specifically detailed in the report and are subject to the scope limitations set out in Section 1.6 of the report.
The opinions, conclusions and any recommendations in this report are based on conditions encountered and information reviewed at the date of preparation of the report. GHD has no responsibility or obligation to update this report to account for events or changes occurring subsequent to the date that the report was prepared.
The opinions, conclusions and any recommendations in this report are based on assumptions made by GHD described in this report. GHD disclaims liability arising from any of the assumptions being incorrect.
GHD has prepared this report on the basis of information provided by Department of Infrastructure and Regional Development, EOMAP GmBH others and others who provided information to GHD, which GHD has not independently verified or checked beyond the agreed scope of work. GHD does not accept liability in connection with such unverified information, including errors and omissions in the report which were caused by errors or omissions in that information.
The opinions, conclusions and any recommendations in this report are based on information obtained from, and testing undertaken at or in connection with, specific sample points. Site conditions at other parts of the site may be different from the site conditions found at the specific sample points.
Investigations undertaken in respect of this report are constrained by the particular site conditions, such as the location of buildings, services and vegetation. As a result, not all relevant site features and conditions may have been identified in this report.

GHD | Report for Department of Infrastructure and Regional Development - Cocos Keeling Islands Sand Management
Strategy, 61/34775 | 3
1.6 Assumptions and Limitations
The model was used to review current and sediment transport patterns during typical winter and summer periods. It is noted that the modelling study was focused on the sediment movement on the seafloor and within the lagoon. The modelling undertaken does not consider the onshore / offshore sediment transport nor the effect of short term wave storm induced sediment transport. The study also does not consider the impact of waves on the erosion or accretion of the lagoon facing or ocean facing beaches during cyclonic or other extreme storm conditions.
The calibration of the model was limited to verification of the water level predictions at Home Island Tide Gauge. No information was available to calibrate the wave model, current speeds or to validate the sediment transport.

4 | GHD | Report for Department of Infrastructure and Regional Development - Cocos Keeling Islands Sand Management
Strategy, 61/34775
2. Physical Information 2.1 Bathymetric Data
The bathymetry for this investigation was based on two datasets:
EOMAP Satellite Derived Bathymetry (23 May 2016) at a spatial resolution of 15 metres covering the lagoon waters within the Cocos Islands and to a minimum of 200 metres offshore.
Offshore bathymetry extracted from MIKE C-Map bathymetrical database. Mike C-Map is a Mike DHI product which uses the Global Electronic Chart database CM-93 Edition 3.0 provided by Jeppesen Norway
All datasets were converted to Mean Sea Level (MSL) at Home Island, also referred to as CKI Height Datum.
The horizontal datum in this study is UTM Zone 47 South.
2.2 Water Level
Tidal planes have been sourced from the Australian Hydrographic Service and are summarised in Table 1. Home Island is the only tidal station within the project area and its approximate location is presented in Figure 1.
Table 1 Tidal planes (Australian Hydrographic Service, 2011)
Tidal Plane Home Island (m)
(m CKIHD)
Highest Astronomical Tide (HAT) 1.5
Mean High Water Springs (MHWS) 1.2
Mean High Water Neaps (MHWN) 0.7
Mean Sea Level (MSL) 0.65
Mean Low Water Neaps (MLWN) 0.6
Mean Low Water Springs (MLWS) 0.1
Lowest Astronomical Tide (LAT) 0.0
Conversion of data from MSL to the tidal gauge at Home Island was based on the following assumptions. The conversion is also reported on BODC tidal station info.1
MSL is 0.65m above LAT
LAT is 0.13m above TGZ
Hence there is a +0.78m shift from MSL to TGZ
2.3 Metocean Data
2.3.1 Waves
GHD sourced offshore wave hindcast data using the NOAA WAVEWATCH III model and GFS analysis winds at the four locations identified in Figure 1. The hindcast data included significant
1 https://www.bodc.ac.uk/data/documents/nodb/57638/

GHD | Report for Department of Infrastructure and Regional Development - Cocos Keeling Islands Sand Management
Strategy, 61/34775 | 5
wave height, peak wave period and average wave direction at the peak period. This dataset covered the period from 02/01/2005 to 01/08/2015 at three hourly time steps.
2.3.2 Wind
Wind speed and direction were available from the NOAA wave hindcast data (02/01/2005 to 01/08/2015) at three hourly time steps. The data was extracted and used as the driving force for the wave and hydrodynamic model. Wind data at the following four points were extracted:
Point SW – E096.5° S12.5°
Point SE – E097.0° S12.5°
Point NE – E097.0° S12.0°
Point NW – E096.5° S12.0°
The location of wind points and Home Island tidal gauge are shown in Figure 1 below.
Figure 1 Location of data extraction points
2.4 Sediment Data
GHD has previously undertaken geotechnical works at Cocos Islands (GHD, 2014). Of particular interest for the purposes of this modelling study are the results of the particle size distribution (PSD) analysis. This will be used in the sediment transport modelling component to provide a description of the sediment properties that will inform the model input parameters.
Results of the PSD analysis are presented below in Table 2. The required parameters for the model input are the mean grain diameter (D50), and the grading coefficient which specifies the shape of the grain curve and is based upon the values of D84 and D16.
Table 2 PSD Analysis
Location D16 (mm) D50 (mm) D84 (mm) Grading
coefficient
Sample 1 0.16 0.36 0.87 2.30

6 | GHD | Report for Department of Infrastructure and Regional Development - Cocos Keeling Islands Sand Management
Strategy, 61/34775
Sample 2 0.19 0.43 0.94 2.25
Sample 3 0.18 0.41 0.93 2.25
Sample 4 0.16 0.34 0.83 2.28
SGS 0.17 0.39 0.97 2.38
Average 0.17 0.39 0.91 2.29
2.5 Seabed Features
Seabed features maps were required to define the bed friction and material type (susceptibility to erosion). The information was based on the processed satellite imagery data received from EOMAP.
The composition and classification of seafloor is shown in Figure 2.
Figure 2 Seafloor Classification – Habitats – Cocos Island (EOMAP 2016)

GHD | Report for Department of Infrastructure and Regional Development - Cocos Keeling Islands Sand Management
Strategy, 61/34775 | 7
3. Numerical Model System 3.1 Model Description
DHI MIKE 21/3 is a multi-dimensional hydrodynamic and transport simulation program which simulates non-steady flows in relatively shallow water. It incorporates the effects of tides, winds, air pressure, density differences (due to salinity and temperature), waves, turbulence, drying and flooding.
The following models have been utilised in this study:
MIKE 21 Flow Model (MIKE 21 FM), a hydrodynamic model based on a flexible mesh system.
MIKE 21 Spectral Waves (MIKE 21 SW), a state of the art numerical tool for prediction and analysis of wave climates in offshore and coastal areas.
MIKE 21 Sand Transport (MIKE 21 ST) that describes the erosion, transport and deposition of sand under the action of waves and currents.
The models were utilised in “coupled mode” via MIKE 21 Coupled FM. The module considers feedback between Flow, Wave and Sand Transport model where wave radiation computed by the spectral wave model is input into the hydrodynamic model and the surface elevation and current velocities computed by the hydrodynamic model is input into the spectral wave model throughout the simulation. The output hydrodynamics are then used to inform the sand transport model and estimate sediment transport.
3.2 Model Setup
3.2.1 Domain
The domain used in this modelling study extends approximately 70 km offshore of the project site and is constructed using the bathymetric data listed in Section 2.1. The model mesh and interpolated bathymetry is shown in Figure 3. The model extent was selected in consideration of available offshore wind and wave information.
Resolution at the project site is in the order of 150 m. This increases to 4 km at a distance of 10 km from the project site. This allows for the optimisation of computational time, whilst maintaining the necessary degree of accuracy in the nearshore area of the project site.
3.2.2 Selection of Seasons and Modelling Periods
Given the size of the model and level of computational power required to process the coupled wave, current and sediment transport models, it is not practical to run the simulations for representative periods of more than approximately 2 months. It is therefore necessary to select months that best represent each study period. The scope of study was to recognise the differences between Winter and Summer times. It was also noted that the study was to focus on typical ambient conditions in each season and not extreme or unusual patterns.
In order to select these representative periods, data from NOAA points were evaluated. It was noted that yearly variations among the reviewed period were not significant, however, conditions vary seasonally and from month to month. Two periods were nominally selected to represent summer and winter. This included July and August 2008 as representative of winter time and January and February 2009 to represent summer time. These periods and the variability of wind and wave parameters in comparison with data from 2006 to 2009 are shown in Figure 4.

8 | GHD | Report for Department of Infrastructure and Regional Development - Cocos Keeling Islands Sand Management
Strategy, 61/34775
a) Full domain
b) Near Island
Figure 3 Mesh and Bathymetry for model

GHD | Report for Department of Infrastructure and Regional Development - Cocos Keeling Islands Sand Management
Strategy, 61/34775 | 9
a) Wind variability
b) Wave variability
Figure 4 Selection of Study Periods
3.2.3 Wave Field
Wave information was extracted at the four boundary points and was used to force the boundary in the studied scenarios. The variations of wave height and period through the simulated period of July 2008 and August 2008 are shown in Figure 5.
3.2.4 Water Level
Simulations were forced at the model boundaries with tidal water levels extracted from the DHI MIKE 21 Global Tide Model. This model is available in 0.125º x 0.125º resolution and predicts water levels based on 10 tidal constituents.
The model information for the period of July and August 2008 is shown in Figure 6.

10 | GHD | Report for Department of Infrastructure and Regional Development - Cocos Keeling Islands Sand Management
Strategy, 61/34775
Figure 5 Wave Periods through July and August 2008
Figure 6 Boundary Tidal Data for July and August 2008
3.2.5 Bed Roughness
The lagoon area is made up of a variety of seabed features including unconsolidated sand, seagrass, corals and hard bottomed surfaces. Consequently, a variable bed resistance has been adopted to better simulate real life conditions. The resistance type is based on the Manning number (represented as m1/3/s) and varies based on the seabed features. The adopted values for bed roughness have been defined based on the DHI Mike model recommendation and following calibration of the hydrodynamic model phase using measured data, as detailed in the following section 3.3. Corals and seagrasses have been set with higher friction levels than hard bottomed surfaces and unconsolidated sediments. A map of the variable bed roughness, based on the seabed feature maps provided by EOMAP, is shown below in Figure 7.

GHD | Report for Department of Infrastructure and Regional Development - Cocos Keeling Islands Sand Management
Strategy, 61/34775 | 11
3.2.6 Sediment Bed Depth
As described in Section 3.2.5, the seabed features within the lagoon vary significantly such that there is a combination of non-erodible surfaces such as coral and hard-bottom as well as erodible surfaces such as unconsolidated sediments and seagrass. A map of the variable bed thickness was determined as model input data, based on the seabed feature maps provided by EOMAP. Where sandy beds were identified within the lagoon, sediment thickness of 2.0m was applied. Modelling investigations showed that this depth to be sufficient to avoid exposure of underlying layers. No sediment was considered outside the lagoon and deep water areas given that the focus on bed change was on the inside of the lagoon and there was no information on the volume of sediment available from outside the atoll. It was considered that minimal to no sediment thickness exists on the reef flats on the exterior of the atoll.
Offshore Area (40)
Shallow Sediments (32)
Hard Corals (24)
Figure 7 Variable Bed Roughness Map (Manning Number)
3.2.7 Sediment Properties
Sediment input parameters have been derived from the information presented in Section 2.4. The median grain size (D50) has been conservatively set to 0.35 mm while the geometrical spreading has been set at 2.3. These parameters have been assumed to be constant over the project domain.
3.3 Model Calibration
3.3.1 Calibration of Hydrodynamic Model
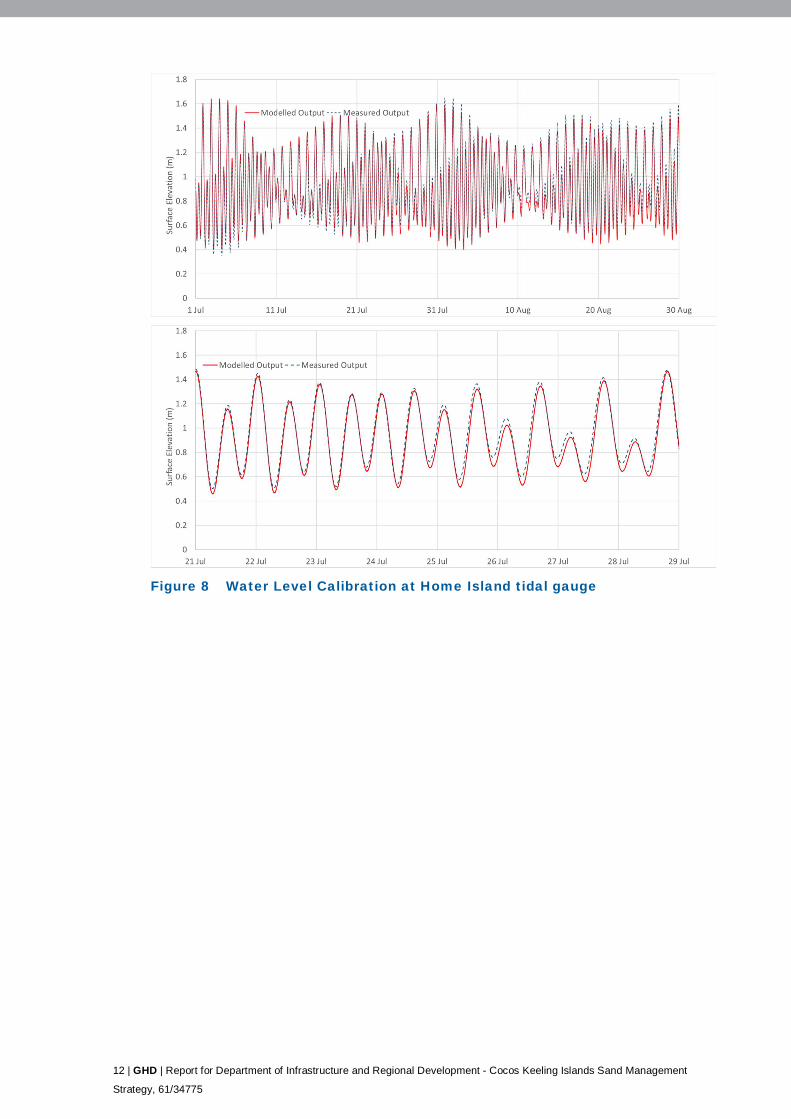
In order to confirm the validity of the hydrodynamic model, validation of the model was undertaken. This was conducted by simulating a time period in which measured water level data was made available from the Home Island tidal gauge, and comparing the model output with the measured data. Ideally, measured current data would have been used to further increase confidence in the model’s ability to represent real conditions, however such data was not available.
Figure 8 presents the water level calibration results with the model output accurately replicating the measured data. This validation demonstrates that the overall tidal amplitude and semi-diurnal inequality is well described in the model which gives good confidence in the ability of the model to describe the local hydrodynamic processes.
12 | GHD | Report for Department of Infrastructure and Regional Development - Cocos Keeling Islands Sand Management
Strategy, 61/34775
Figure 8 Water Level Calibration at Home Island tidal gauge

GHD | Report for Department of Infrastructure and Regional Development - Cocos Keeling Islands Sand Management
Strategy, 61/34775 | 13
4. Results 4.1 Simulations
A series of model simulations was undertaken so as to represent both tidal flows and typical winter and summer period wind effects. During the modelling, it was established that while the magnitude of the current and wave events varies from month to month, the typical flow patterns remain generally unchanged and are more influenced by tidal forces than wind or waves.
The results have been reviewed and discussed in the following sections.
4.2 Wave Patterns
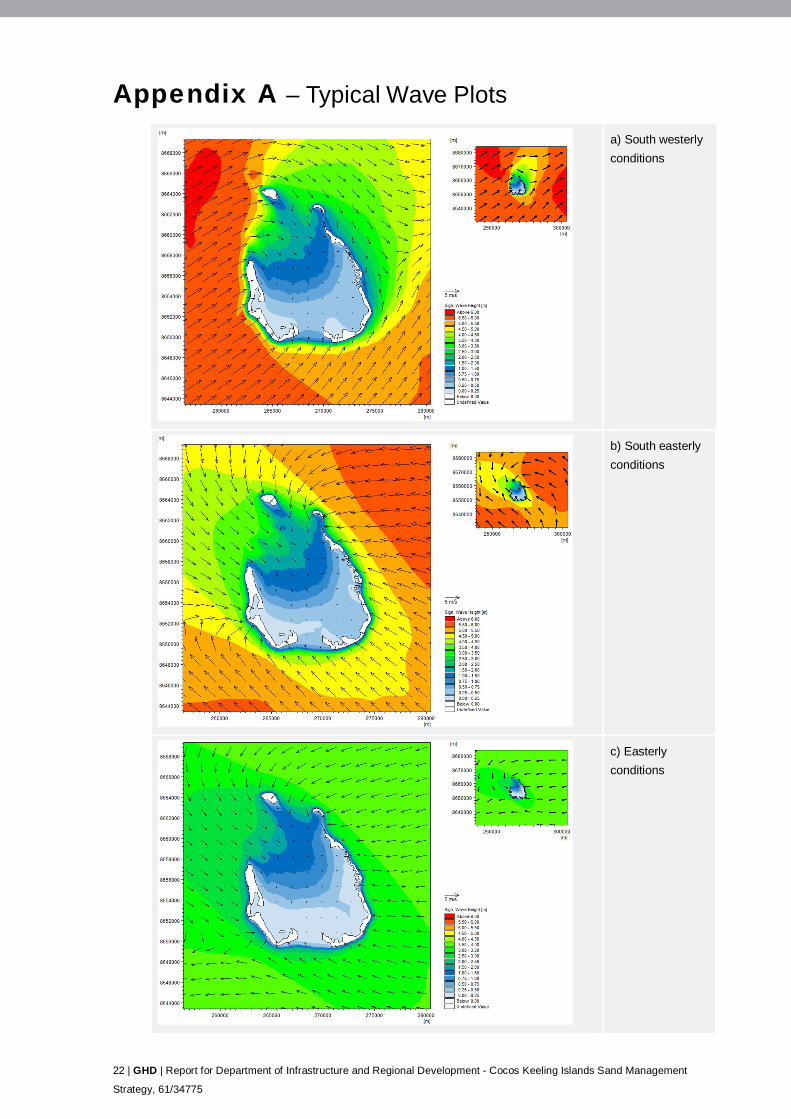
The simulated period of July and August 2008 included a number of storm events approaching the island from various offshore directions. These are described to evaluate potential sediment transport patterns associated with each storm event. Different scenarios were selected from the simulated period of July/August 2008 and are shown in Appendix A. Notwithstanding the offshore condition, wave diffraction and shallow reefs will create an almost identical pattern within the lagoon with majority of wave energy entering the lagoon from the north west area.
During storm conditions, the system of shallow reefs limits the wave energy approaching the lagoon where wave heights stay within 0.5m to 0.75m most of the time.
4.3 Ebb and Flood
Given that the atoll is surrounded by the deep water, the gradient of water level variation outside the islands is very mild. The variation inside the lagoon is more pronounced with a usual phase difference induced by higher shallow sediment and coral areas.
Typical ebb and flood plots are shown in Figure 9. During the flood tide, water enters into the lagoon from the Northwest and South passages. During the ebb tide, water leaves primarily through the northern passages. The southern half of the lagoon is generally shallower and usually retains a slightly higher water level than the northern side. This leads to a global northerly flow through the shallow passage of the South Entrance which persists during both ebb and flood tides.
The currents are generally very small and less than 0.4m/s inside the lagoon. The currents are higher through the gaps, around the outer face of islands and around the tips of islands, especially around Horsburgh Island, North Point and along the outer face of South Island. The maximum currents reach 1 m/s in some areas.
4.4 Induced Residual Currents
Residual currents are the currents remaining in a basin after taking into account the current directions and demonstrate the long-term pattern of water circulation. They are also a good indicator of bed sediment transport pathways. The residual currents for the simulated winter and summer periods are shown in Figure 10 and Figure 11.
The residual currents confirm the overall patterns observed in the review of Ebb and Flood tidal patterns. The largest flows are observed across the North Point and north of Horsburgh Island in an easterly direction. Currents near North Park and along the eastern face of the South Island are strong and northerly. The circulation shows an overall pattern of water moving inward through the Southern Passage and around the North Point and exiting the lagoon through the gap between Direction Island and Horsburgh Island.

14 | GHD | Report for Department of Infrastructure and Regional Development - Cocos Keeling Islands Sand Management
Strategy, 61/34775
The current patterns of the simulated Winter and Summer periods are similar with differences visible in the magnitude of the currents and not the directions or circulation regime. In both plots, it can be seen that any sediment transport by the currents is likely to settle in the more stagnant areas near Rumah Baru and Southern Lagoon and along the western side of the South Island and the western island groups.
a) Flood
b) Ebb
Figure 9 Ebb and Flood Currents

GHD | Report for Department of Infrastructure and Regional Development - Cocos Keeling Islands Sand Management
Strategy, 61/34775 | 15
4.5 Maximum Currents
Maximum current speeds recorded at each modelling node is compiled into a maximum current contour map and is shown. As can be seen, currents inside the lagoon are generally less than 0.2m/s in most areas except through or near the passages. Currents around the island are as much as 1.2m/s. Note that these currents are derived from the combined wave and tidally induced currents and show the depth average value.
Figure 10 Residual Currents – Winter Simulation Period
Direction Island
Horsburgh
Home Island
South Island
Rumah Baru West Island
South Lagoon
Airport
North Park
Southern
North Point

16 | GHD | Report for Department of Infrastructure and Regional Development - Cocos Keeling Islands Sand Management
Strategy, 61/34775
Figure 11 Residual Currents – Summer Simulation Period
Figure 12 Maximum Currents

GHD | Report for Department of Infrastructure and Regional Development - Cocos Keeling Islands Sand Management
Strategy, 61/34775 | 17
4.6 Sediment Transport
Given the benign nature of currents within the lagoon, sediment transport rates are generally very small. This is understandable considering the balanced state of sediment within the island group over a long geological time period. Short term sediment transport patterns can be expected in response to passing storms or abnormal inter annual weather seasons. This is expected to return to balance in the following months or years. Evaluation of sediment transport has been based on the assumption of availability of sediment to move within the lagoon and across the upper reef area. A detailed geological assessment of thickness of sediment deposits at various locations across the island groups is not available and therefore the estimated sediment transport patterns would be representative of the potential for sediment transport.
The overall bed transport potential pattern is expected to be similar to residual flow patterns. A typical accretion and erosion pattern is shown in Figure 13.
The plot shows the hot spots for erosion or accretions within the island group. The red areas are indicators of regions in which sediment deposition will occur on the seabed and blue is representative of areas where sediment is likely to be mobile. The rates of bed level change shown are based on an assumption regarding the availability of sand in the area and should be treated with caution (ie, not absolute values, more indicators of sediment patterns).
Figure 13 Erosion and Accretion Hot Spots (Based on assumed availability of sand)

18 | GHD | Report for Department of Infrastructure and Regional Development - Cocos Keeling Islands Sand Management
Strategy, 61/34775
5. Summary and Conclusion 5.1 Summary
The modelling study was conducted to review tide and wave induced current patterns within the Cocos (K) Island system. The aim of this study was to apply the information on current patterns to provide a better understanding of sediment movement patterns. As part of the study, GHD developed a new hydrodynamic model of the island group and reviewed the seasonal hydrodynamic patterns around the island. The new model has utilised new satellite imagery data including seabed surface levels and sediment composition (sand, coral or seagrass etc) obtained from EOMAP GmBH.
The modelling was undertaken utilising DHI’s MIKE 21 hydrodynamic and transport simulation program.
In order to select representative simulation periods, extracted wind and wave data from NOAA was evaluated. A series of model simulations were undertaken representing both tidal flows and typical winter and summer period wind effects.
In absence of other information, the modelling calibration was based on comparison of modelled surface elevations with measured water level data at the Home Island tidal gauge.
The simulated period of July and August 2008 included a number of storm events approaching the island from various offshore directions. Notwithstanding the offshore condition, the effects of wave diffraction across shallow reefs will result in an almost identical current pattern within the lagoon with the majority of wave energy entering the lagoon from the north west area.
The model results demonstrate the pattern of ebb and flood in the lagoon. Given that the island system is surrounded by the deep water, the gradient of water level variation outside the Island is very mild. The variation inside the lagoon is more pronounced with a usual phase difference induced by higher areas of shallow sediment and coral.
The currents are generally very small and less than 0.4m/s inside the lagoon. The currents are higher through the gaps, around the outer face of islands and around the tips of islands, especially to the north of Horsburgh Island, at North Point and along the outer face of South Island. The maximum currents reach 1 m/s in some areas.
The residual currents confirm the overall patterns observed in the review of ebb and flood tidal patterns. The largest flows are observed on the northern sides of North Point and Horsburgh Island in an easterly direction. Currents near North Park and along the eastern face of the South Island are strong and northerly. The circulation shows an overall pattern of water moving inward through the Southern Passage and around North Point and existing the lagoon through the gap between Direction Island and Horsburgh Island.
5.2 Sediment Transport Results
Given the benign nature of currents within the lagoon, sediment transport rates are generally very small. This is understandable considering the balanced state of sediment within the island group over a long geological time period. Short term sediment transport patterns can be expected in response to passing storms or abnormal inter annual weather seasons. This is expected to return to balance in the following months or years.
Evaluation of sediment transport has been based on an assumption of availability of sediment to move within the lagoon and across the upper reef area. A detailed geological assessment of thickness of sediment deposits at various locations across the island groups is not available and

GHD | Report for Department of Infrastructure and Regional Development - Cocos Keeling Islands Sand Management
Strategy, 61/34775 | 19
therefore the estimated sediment transport patterns would be representative of sediment transport potential rather than actual transport.
Overall bed transport potential patterns are similar to residual flow patterns. Sediment variation inside the lagoon is very small and transport rates are generally low. The majority of sediment movements are observed in the northern half of the lagoon. The most pronounced accretions are likely to occur to the east of North Point and west of Direction Island.

20 | GHD | Report for Department of Infrastructure and Regional Development - Cocos Keeling Islands Sand Management
Strategy, 61/34775
6. References Australian Hydrographic Service (2011). Australian National Tide Tables. Commonwealth of Australia.
DHI Mike 21 HD (2014) MIKE 21, Hydrodynamic Module Scientific Documentation.
DHI Mike 21 SW (2014) MIKE 21, Spectral Wave Module, Scientific Documentation.
DHI Mike 21 ST (2014) MIKE 21, Sand Transport Module, Scientific Documentation.
GHD, (2014) Erosion Engineering Assessment and Scoping Study – West Island, Cocos (Keeling) Islands. Preliminary Design Report. September 2014. Document number 61/30863/143224

GHD | Report for Department of Infrastructure and Regional Development - Cocos Keeling Islands Sand Management Strategy,
61/34775
22 | GHD | Report for Department of Infrastructure and Regional Development - Cocos Keeling Islands Sand Management
Strategy, 61/34775
Appendix A – Typical Wave Plots
a) South westerly conditions
b) South easterly conditions
c) Easterly conditions

GHD | Report for Department of Infrastructure and Regional Development - Cocos Keeling Islands Sand Management
Strategy, 61/34775 | 23
d) Southerly conditions
e) Northerly conditions


www.ghd.com