department of electronic engineering final year project...
TRANSCRIPT

I
Department of Electronic Engineering
FINAL YEAR PROJECT REPORT
BEngIE-2006/07-<QTZ-01>
Multiple Access Capability of DS-UWB
and Multi-band OFDM Schemes for IEEE
802.15.3a
Student Name: Cheuk Chun Fung
Student ID:
Supervisor: Prof. ZHANG, Kieth Q T
Assessor: Dr. Wong, W K
Bachelor of Engineering (Honours) in
Information Engineering

II
Student Final Year Project Declaration
I have read the student handbook and I understand the meaning of academic
dishonesty, in particular plagiarism and collusion. I declare that the work submitted
for the final year project does not involve academic dishonesty. I give permission for
my final year project work to be electronically scanned and if found to involve
academic dishonesty, I am aware of the consequences as stated in the Student
Handbook.
Project Title: Multiple-Access Capability of DS-UWB and Multi-band OFDM Schemes for
IEEE802.15.3a
Student Name: Cheuk Chun Fung
Student ID:
Signature
Date: 18/04/07

i
No part of this report may be reproduced, stored in a retrieval system, or transcribed in
any form or by any means – electronic, mechanical, photocopying, recording or
otherwise – without the prior written permission of City University of Hong Kong.
Contents
Abstract 1
Introduction 2
Section 1
Section 1.1 Basic concept of CDMA 3
Section 1.2 Slow fading mobile radio channel 4-5
Section 1.3 Channel Model 6-7
Section 2
Section 2.1 DS-CDMA Basic principles 8
Section 2.2 Rake Receiver Structure 9
Section 2.3 DS-CDMA Transmitter Model 10
Section 2.4 DS-CDMA Receiver Model 11
Section 3
Section 3.1 OFDM basic principles 12
Section 3.2 IFFT/FFT pairs 13-14
Section 3.3 Cyclic Prefix 15-16

ii
Section 3.4 OFDM-CDMA Basic Principles 17
Section 3.5 OFDM-CDMA Transmitter Model 18
Section 3.6 OFDM-CDMA Receiver Model 19
Section 4 Performance Analysis 20-22
Section 5 Analytical Result 23-24
Section 6 Comparisons of simulation results
Section 6.1 Performance comparison for single user 25-26
Section 6.2 Performance comparison for different
processing gain
27-28
Section 6.3 Performance comparison for multi user with
fixed Processing Gain and Diversity for type A
delay profile
29-34
Section 6.4 Performance comparison for multi user with
fixed Processing Gain and Diversity for type B
delay profile
35-38
Section 7 Conclusion 39
References 40
Appendix
iii
List of figures
Figure 1 The multi-path environment with multiple reception 6
Figure 2 The delay profile with unequal path gain 7
Figure 3 The delay profile with equal path gain 7
Figure 4 The chipped process in time domain 8
Figure 5 Structure of Rake Receiver 9
Figure 6 OFDM system structure 12
Figure 7 Multi-carrier modulation 13
Figure 8 Effects of Channel Response when no CP introduced 15
Figure 9 Effects of Channel Response when CP introduced 15
Figure 10 The spreading on frequency domain in OFDM-CDMA system 17
Figure 11 The despreading on frequency domain in OFDM-CDMA system 17
Figure 12 Block diagram for OFDM-CDMA transmitter 18
Figure 13 The probability density function for MRC and with no diversity 20
Figure 14 The comparison between the analytical results and the simulation
results for DS-CDMA
23
Figure 15 The comparison between the analytical results and the simulation
results for OFDM-CDMA
23
Figure 16 The comparison between the performance of DS-CDMA and
OFDM-CDMA
25
Figure 17 The comparison between G=64 and G=128 for DS-CDMA 27
Figure 18 The comparison between G=64 and G=128 for OFDM-CDMA for
type A delay profile
28
Figure 19 comparison between DS-CDMA and OFDM-CDMA for type A
delay profile with G=64 and D=2
29
Figure 20 comparison between DS-CDMA and OFDM-CDMA for type A
delay profile with G=64 and D=4
31
Figure 21 comparison between DS-CDMA and OFDM-CDMA for type A
delay profile with G=128 and D=2
32
Figure 22 comparison between DS-CDMA and OFDM-CDMA for type A
delay profile with G=128 and D=4
34
Figure 23 comparison between DS-CDMA and OFDM-CDMA for type B
delay profile with G=64 and D=2
35
Figure 24 comparison between DS-CDMA and OFDM-CDMA for type B
delay profile with G=64 and D=2
36
iv
Figure 25 comparison between DS-CDMA and OFDM-CDMA for type B
delay profile with G=128 and D=2
37
Figure 26 comparison between DS-CDMA and OFDM-CDMA for type B
delay profile with G=128 and D=4
38

1
Abstract
The demand for high data rate transmission in mobile wireless communications is
growing rapidly. Apart from the traditional DS-UWB (Direct Sequence Ultra Wide
Band), Multi-band Orthogonal Frequency Division Multiplexing (OFDM) has
attracted diverse interest as a modulation technique for short range wireless data
communications described in the IEEE 802.15.3a physical layer proposal. In this
paper, two multiple access schemes for uplink system in a multi user environment are
studied with respect to their error performance. Investigation covers two schemes,
namely an uncoded orthogonal frequency division multiplexing (OFDM) based code
division multiple access scheme (OFDM-CDMA), and an uncoded direct sequence
code division multiple access (DS-CDMA) scheme. In both schemes, Maximum Ratio
Combining is applied at the receiver. The performance of the two schemes is
compared considering different channel modes which is important for the later system
design. The analytical results are confirmed by the simulation results which suggest
OFDM-CDMA outperforms DS-CDMA under slow fading multi-path environment.
2
Introduction
The popularity of mobile personal devices has created a demand for wireless
communications system which can accommodate many users simultaneously. The
promising key concept is the Code Division Multiple Access (CDMA) scheme.
Another challenging task for the transmission of data through a wireless channel is the
multipath propagation. Maximum Ratio Combining (MRC) is applied at the receiver
so as to take advantage of channel diversity to combat the multipath fading.
The objective of the study is to carry out comparison between DSCDMA and
OFDMCDMA under the uplink synchronous environment. Both schemes would be
applied MRC at the receiver and the processing gain is assumed to be the same at both
systems.
This paper is organized as follows: In Section 1 the basic concept of the CDMA, slow
fading mobile radio channel and the channel model is presented. In Section 2 the
Basic Concept of DS-CDMA is investigated. In Section 3 OFDM-CDMA system is
discussed. In Section 4 the performance analysis is shown. In Section 5 the analytical
results is investigated and the performance for single user is presented. In Section 6
the simulation results are presented to compare the performance of the two systems.
In Section 7 the conclusion is made.

3
Section 1
Section 1.1
Basic Concept of CDMA [1]
The Users are assigned unique signatures. Each transmitter sends its data streams by
modulating its own signature waveform. In order to recover the original information,
the receiver then correlates the synchronized signature sequence with the received
signal. The transmitted signal can be written as
)()()()()()()()( 332211 tctstctstctstcts NN++++ L
where si is the i-th user signal and ci is the i-th user’s signature sequence.
The Basic concept of CDMA is to choose the spreading sequence with the cross
correlation which is equal to zero, that is:
∫ =>=<T
dttctccc0
2121 0)()(,
It can be seen that if the above condition is satisfied, the desired user’s signal can be
perfectly recovered from the received signal. Since 1, 11 >=< cc and
><><>< Ncccccc ,,,,, 13121 L are all equal to zero.
The ability to combat multiple access interference (MAI) is determined by the
cross-correlation characteristics of the spreading codes. In this paper, pseudo-noise
sequences are chosen to be the signature of the users. Pseudo-Noise (PN) sequences
are binary sequences, which exhibit noise-like properties.

4
Section 1.2
Slow fading mobile radio channel [2]
For most mobile radio communication, a direct line-of-sight (LOS) does not exist
between the transmitter and the receiver. Due to multiple reflections from various
objects, the electromagnetic wave travels along different paths. Fading is caused by
interference between two or more versions of the transmitted signal which arrive at
the receiver at slightly different times.
Slow fading belongs to small scale fading which is used to describe the rapid
fluctuations of the amplitudes, phases, or multipath delays of a radio signal over a
short period of time or travel distance. In a slow fading channel, the channel impulse
response (CIR) changes at a rate much slower than the transmitted baseband signal. In
this case, the channel may be assumed to be static over one or several reciprocal
bandwidth intervals. From the point of views of frequency domain, this means that the
Doppler spread of the channel is much less than the bandwidth of the baseband signal.
That is cs TT < where sT represents the Doppler spread time and cT represents the
coherence time.
5
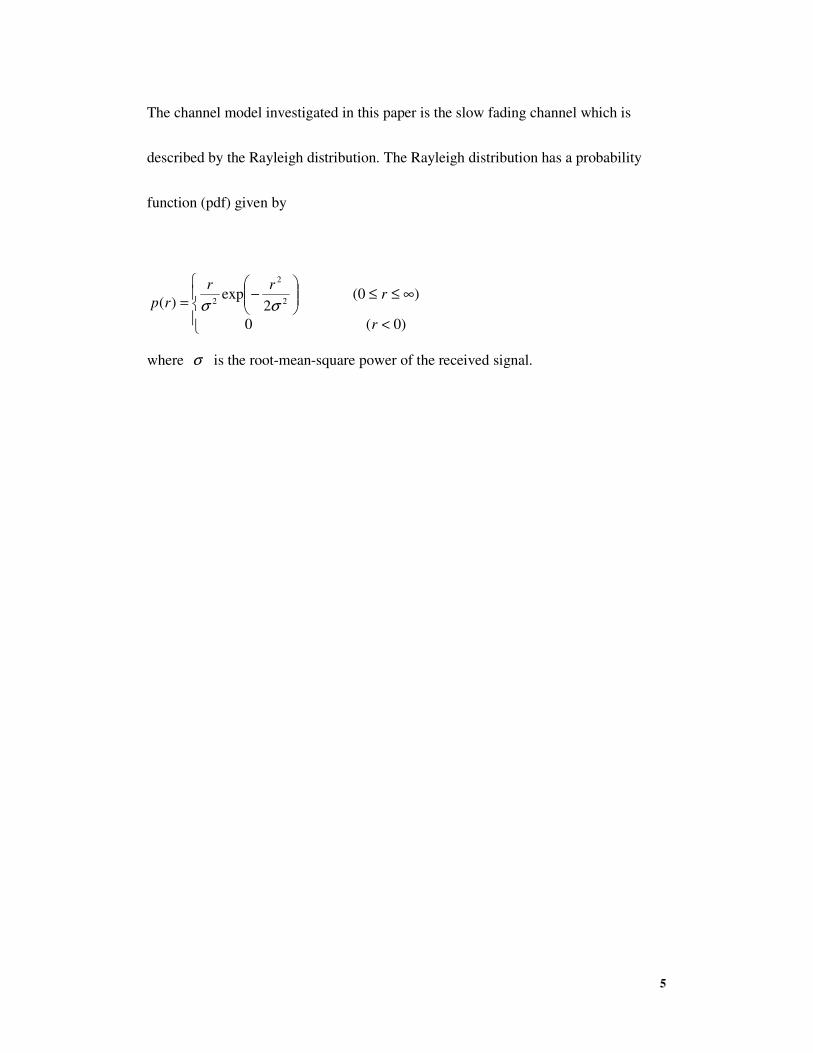
The channel model investigated in this paper is the slow fading channel which is
described by the Rayleigh distribution. The Rayleigh distribution has a probability
function (pdf) given by
<
∞≤≤
−
=
)0(0
)0(2
exp)( 2
2
2
r
rrr
rp σσ
where σ is the root-mean-square power of the received signal.

6
Section 1.3
Channel Model
Due to the reflection and scattering of obstacles, the transmitted signal is propagated
through a noisy fading multipath channel. The multipath and noise are assumed to be
statically independent and the path components are assumed to be independent
identically distributed (iid). Figure x is best to describe the channel model.
Figure 1 The multi-path environment with multiple reception
The channel impulse response is modeled as a time pulse train represented by
∑−
=
−=1
0
)()(L
l
ll tth τδα
where L is the number of multipath components, lα is the real attenuation of the l-th
multipath component which follows an independent identically distributed Rayleigh
distribution, lτ is the delay from the transmitter to the receiver for the l-th multipath
component, and δ is the delta function of the impulse.
LOS

7
We define the following delay profile model as Type A with unequal path gain:
Figure 2 The delay profile with unequal path gain
We define the following delay profile model as Type B with equal path gain:
Figure 3 The delay profile with equal path gain
In this paper, the time delay τ would be assumed to be 1 chip duration. The total
power conveyed by the channel would be normalized such that the expectation power
would be given to be 11
0
2=
∑
−
=
L
l
iE α .
τ
T 2T 3T 4T
τ
T 2T 3T 4T
Power
Power
8
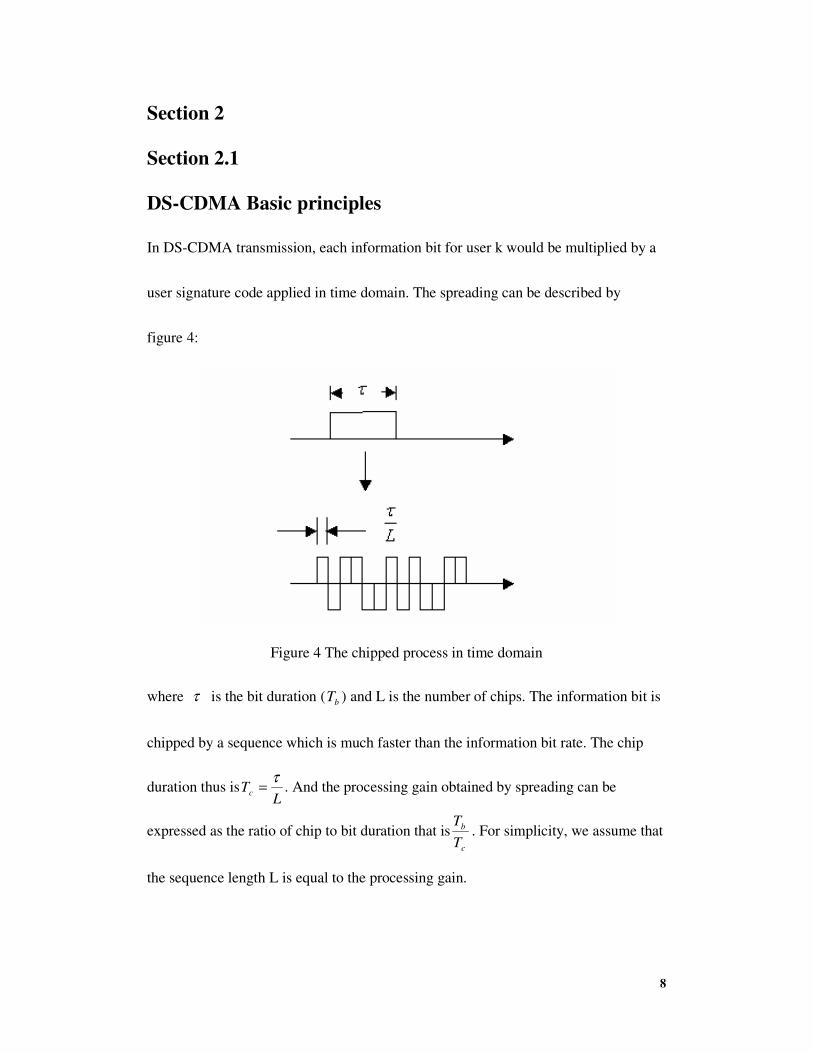
Section 2
Section 2.1
DS-CDMA Basic principles
In DS-CDMA transmission, each information bit for user k would be multiplied by a
user signature code applied in time domain. The spreading can be described by
figure 4:
Figure 4 The chipped process in time domain
where τ is the bit duration ( bT ) and L is the number of chips. The information bit is
chipped by a sequence which is much faster than the information bit rate. The chip
duration thus isL
Tc
τ= . And the processing gain obtained by spreading can be
expressed as the ratio of chip to bit duration that isc
b
T
T. For simplicity, we assume that
the sequence length L is equal to the processing gain.

9
Section 2.2
Rake Receiver Structure [3]
Rake Receiver would be exploited to combat the multipath fading. It can be shown by
figure 5 :
Figure 5 Structure of Rake Receiver
As we can see, Rake Receiver consists of a bank of correlators. We call these
correlators fingers. After transmission over a Rayleigh multi-path fading channel, the
received signal is the superposition of several copies of the original signals each
arriving with different delays. We assume that there are L paths and there are M
fingers at the Rake Receivers which can obtain Mth
order of diversity. In the following
discussion, we assume that ML ≥ and no selection at the receiver would be provided.
All copies would be caught by the fingers at the receiver and combined together.

10
Section 2.3
DS-CDMA Transmitter model
Due to the simplicity, we make assumption that all carrier phases are equal to zero. As
a result, the real part of the baseband signal would be considered in the following
discussion. The data modulation is binary phase shift keying (BPSK). The transmitted
signal can be represented as:
∑∑∑−
=
−
=
−
=
−−=1
0
1
0
1
0
)(2)(U
u
M
i
N
j
cbT
u
j
u
i jTiTtpcbEtsc
where U is the total number of users
M is the total number of bits
N is the total number of chips
u
ib is the i-th information bit of u-th user
u
jc is the j-th chips of the u-th user
p(t) represents the pulse
bT is the bit duration
cT is the chip duration

11
Section 2.4
DS-CDMA Receiver Model
The receiver model for uplink synchronized DS-CDMA system can be represented
by:
)()()(11
tnlTtsAtrU
u
cu
L
l
l +−= ∑∑==
where L is the number of path
Al is the attenuation of the l-th path
U is the total number of users
Tc is 1 chip length duration
n(t) is the zero-mean additive white Gaussian noise(AWGN) with variance
2
nσ

12
Section 3
Section 3.1
OFDM basic principles [4]
Orthogonal Frequency Division Multiplexing (OFDM) provides a means of
counteracting the channel-induced linear distortions especially the inter symbol
interference (ISI) encountered when transmitting over a dispersive radio channel.
The basic principle of OFDM is that the serial data stream of a traffic channel is
passed through a serial-to-parallel (S/P) converter which splits the data into a number
of parallel channels. The data in each sub channel is then modulated by Inverse Fast
Fourier Transform (IFFT). The transmitted signal is then passed through the
parallel-to-serial (P/S) converter. It is then followed by the Cyclic Prefix (CP)
padding. At the receiver, the inverse operations would be applied. The CP in the
received signal would first be removed and then passed through the (S/P) converter.
The Fast Fourier Transform (FFT) would then be exploited to demodulate the
received signal and finally passed through the (P/S) converter.
Figure 6 OFDM system structure

13
Section 3.2
IFFT/FFT pairs [5]
The Basic concept of OFDM is based on the multi-carrier transmission. Each
transmitted signal is modulated by a specific carrier frequency denoted by nf . The
transmission scenario is described by figure 7
Figure 7 Multi-carrier modulation
In OFDM, the orthogonal properties is maintained by the sub-carrier spacing T
1
which can be expressed as
( ) ( )∫T
tfjtfjdtee
T 0
2*2 211 ππ
= dteT
Ttffj
∫−
0
)(2 121 π
≠
=
21
21
0
,1
ff
ff
Discrete Fourier Transform (DFT) and Inverse Discrete Fourier Transform are two
critical components in the implementation of OFDM system especially reduce the
complexity of sub-channel modem. It can be shown mathematically that taking the

14
DFT of the original signal and then transmitting the DFT coefficients serially is
exactly equivalent to apply the data directly to the modulator transmitting at a
carrier frequency positioned at the centre of the transmission band 0f ,……, Nf .[]
That is:
1 0
2
Nf f− +
The modulated signal m(t) is given by
{ }02( ) Re ( )
j f tm t b t e
π= where b(t) is the equivalent baseband signal and f0 is the
carrier frequency.

15
Section 3.3
Cyclic Prefix [6]
After the IFFT modulation, the OFDM time domain samples would then be guard
padded by enough samples to eliminate the ISI between the OFDM symbols due to
the delay spread of the multi-path channel. The method is best explained with
reference to figure 8 and figure 9.
Without CP,
Figure 8 Effects of Channel Response when no CP introduced
With CP,
Figure 9 Effects of Channel Response when CP introduced
Each block of length T modulated signal segment is extended by a length of Tg the
guard time interval that repeating Ng samples of the original information symbol. The
total sequence length would be N+ Ng which corresponds to duration T+ Tg. The
extended parts would be corrupted by the channel impulse response. The first Ng
samples of the received block would be ignored by the receiver. Only the central
OFDM1 OFDM2 channel OFDM1 OFDM2
OFDM1 channel OFDM2 CP CP
OFDM1 OFDM2

16
useful information block would be demodulated by the FFT.
The number of Ng samples depends on the channel’s impulse response. It is required
that the guard time interval must be greater than the delay time spread of the channel.
Tg >> Tdelay. It is assumed that the GI Note that the method of adding cyclic prefix
would actually waste the channel capacity as well as the transmitted power. In order
to minimize the effects, the block size is usually set greater or equal to 128. As a
result, the extended length would only be 10% of the useful information block length.

17
Section 3.4
OFDM-CDMA Basic Principles [7]
In OFDMCDMA, instead of applying spreading sequences in the time domain, the
spreading sequences would be applied in the frequency domain, mapping a different
chip of spreading sequence to an individual OFDM subcarrier. Hence each OFDM
subcarrier has a data rate identical to the original input data. The processing gain is
due to the spreading in a wider frequency band.
The additional component would be shown in figure 10
At transmitter,
Figure 10 The spreading on frequency domain in OFDM-CDMA system
At receiver,
Figure 11 The despreading on frequency domain in OFDM-CDMA system

18
Section 3.5
OFDM-CDMA Transmitter model
After the investigation of the OFDMCDMA system, in the following section the
OFDMCDMA uplink transmission applying MRC would be shown. In this paper,
BPSK would be chose to be the modulation technique. The transmitted signal can be
expressed as:
11 1 12 ( )
0 0 0
( )U M G
j gM m tu u T
c m g
u m g
s t E b c eπ− − − +
= = =
=∑∑∑
where U is the number of users, which has a maximum of G.
M is the number of bits transmitted per user.
The processing gain G is given as N/M, where N is the number of carriers.
Ec is the energy per subcarrier, and Ec = Eb/N, where Eb is the energy per bit
before spreading.
T is the signaling interval in which M numbers of bits per user are
transmitted and 1/T is equal to the spacing between adjacent subcarriers.
For BPSK signal,
{ }1±∈u
mb is the m-th bit of user u
{ }1±∈u
mc is the g-th chip of the u-th user’s spreading sequence.
Figure 12 Block diagram for OFDM-CDMA transmitter

19
Section 3.6
OFDM-CDMA Receiver model
Assume there is no inter-subcarrier interference. At the receiver the received signal
can be represented by
∑∑−
=
−
=
+=1
0
1
0
G
g
U
u
gg
u
g
u
c nHcbEr
where Hg is the frequency domain channel transfer factor
G is the processing gain
U is the total number of users
Ec is the energy per sub-carrier
bu is the u-th user information
cu is the u-th user spreading sequence
ng is a discrete AWGN process having zero mean and a one-sided
power spectral density N0
20
Section 4
Performance Analysis
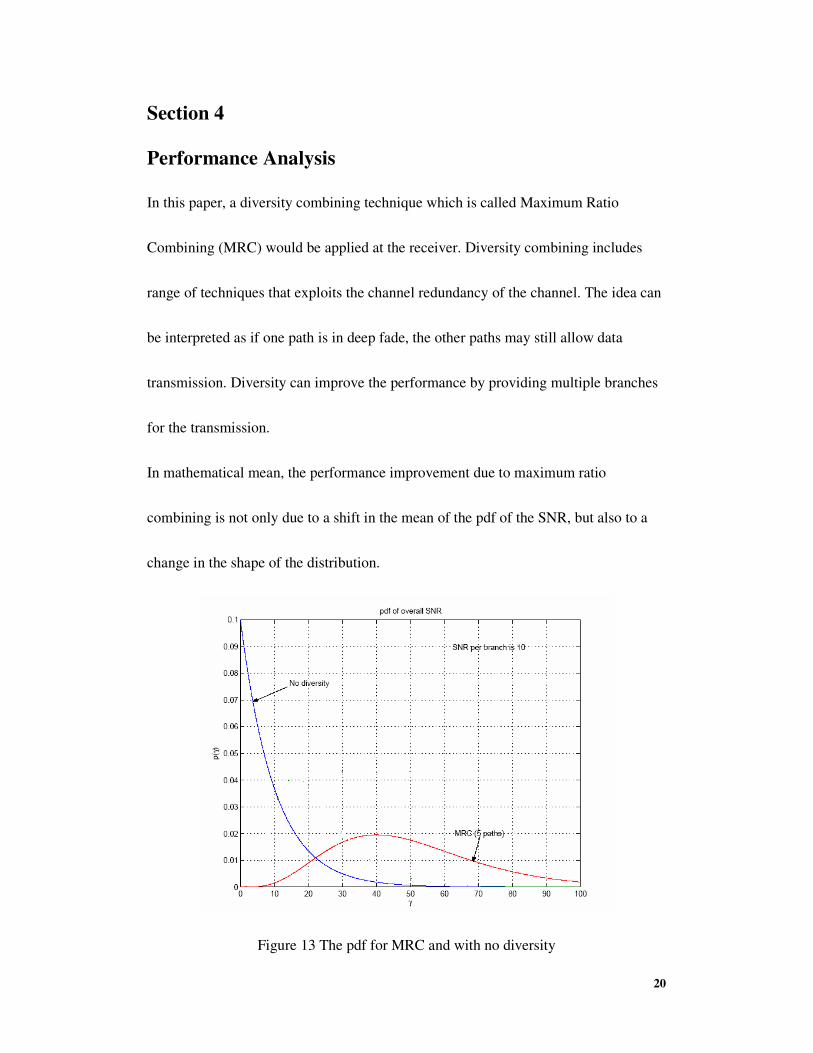
In this paper, a diversity combining technique which is called Maximum Ratio
Combining (MRC) would be applied at the receiver. Diversity combining includes
range of techniques that exploits the channel redundancy of the channel. The idea can
be interpreted as if one path is in deep fade, the other paths may still allow data
transmission. Diversity can improve the performance by providing multiple branches
for the transmission.
In mathematical mean, the performance improvement due to maximum ratio
combining is not only due to a shift in the mean of the pdf of the SNR, but also to a
change in the shape of the distribution.
Figure 13 The pdf for MRC and with no diversity
21
It can be seen that MRC is succeed to combat deep fades as it provides more
realization of the SNR. MRC combines each diversity branch to provide the largest
possible performance improvement.
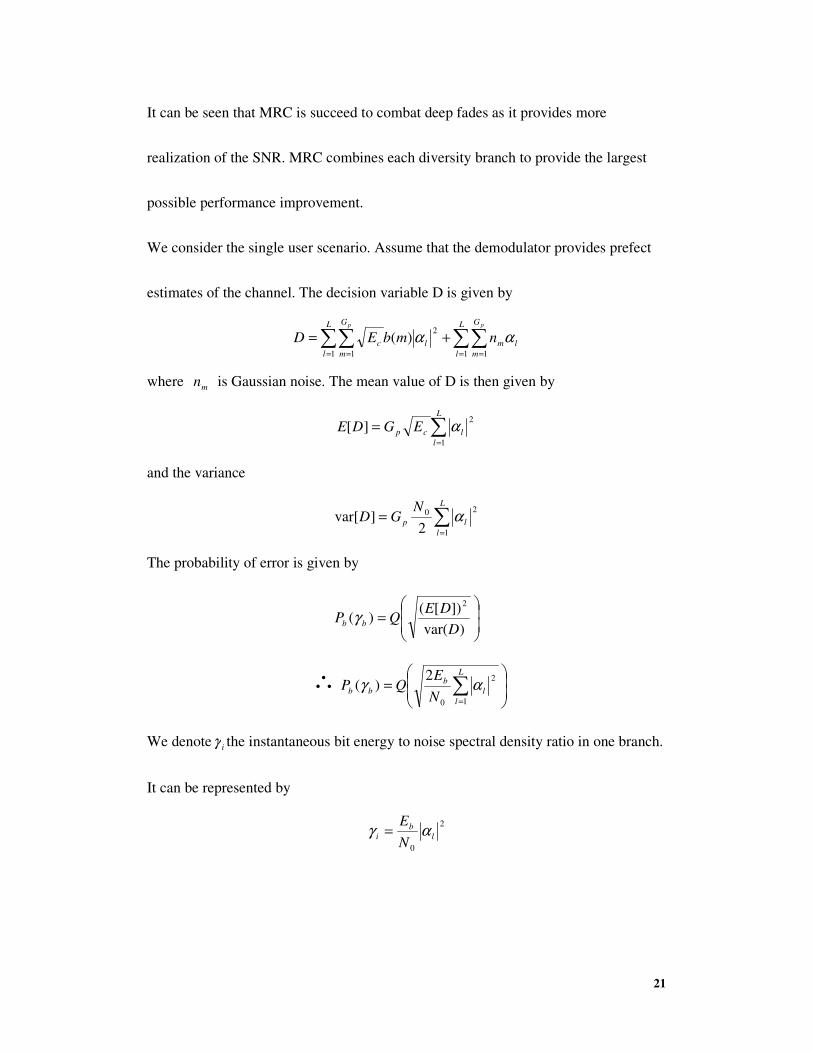
We consider the single user scenario. Assume that the demodulator provides prefect
estimates of the channel. The decision variable D is given by
∑∑ ∑∑= = = =
+=L
l
G
m
L
l
G
m
lmlc
p p
nmbED1 1 1 1
2)( αα
where mn is Gaussian noise. The mean value of D is then given by
∑=
=L
l
lcp EGDE1
2][ α
and the variance
∑=
=L
l
lp
NGD
1
20
2]var[ α
The probability of error is given by
=
)var(
])[()(
2
D
DEQP bb γ
∴
= ∑
=
L
l
l
b
bbN
EQP
1
2
0
2)( αγ
We denote iγ the instantaneous bit energy to noise spectral density ratio in one branch.
It can be represented by
2
0
l
b
iN
Eαγ =

22
The total instantaneous bit energy to noise spectral density ratio, denoted by bγ is
given by
∑ ∑= =
==L
l
L
l
ll
b
bN
E
1 1
2
0
γαγ
If lα is Rayleigh distributed then lγ has a chi square distribution with two degrees
of freedom. The pdf can be represented as
01
)( ≥=−
l
l
ll
l
ep γγ
γ γ
γ
where lγ is the average bit to noise spectral density ratio defined as
][2
0
l
b
l EN
Eαγ =
where ][2
lE α is the average value of 2
lα
The probability density function of bγ can be represented by
l
b
eL
p L
bL
l
b
γ
γ
γγ
γ−
−
−= 1
)!1(
1)(
The average bit error probability is obtained by averaging the conditional error
probability over all bγ that is
∫∞
⋅=0
)()( bbb dpPbPb γγγ
which get the closed form solution
∑−
=
+
−
−=
1
0 2
11
2
1 L
l
lL
l
LPb
µµ where
l
l
γ
γµ
+=
1[8]

23
Section 5
Analytical results
Figure 14 The comparison between the analytical results and the simulation results for
DS-CDMA
Figure 15 The comparison between the analytical results and the simulation results for
OFDM-CDMA
24
Figure 14 shows the BER for the analytical results for single user scenario discussed
above. The simulation results for DS-CDMA are close to the analytical results for
diversity order equal to 1, 2 and 4. The BER is decreased when the diversity order
increased. DS-CDMA exploits the diversity combining technique to obtain the
diversity gain. The comparison between the simulation results for OFDM-CDMA and
the theoretical results would be shown in Fig 15. The trend is similar to DS-CDMA
and the simulation results are also agreed to the analytical results.
Figure 14 and Figure 15 can be divided into three regions in order to perform the
comparison:
1st region:
0N
Eb ranging from 0 to 4 dB
2nd
region: 0N
Eb ranging from 4 to 12 dB
3rd
region: 0N
Eb ranging from 12 to 20 dB
In the 1st region, when the diversity order is doubled there would be 2 to 3 db
performance improvement.
In the 2nd
region, when the diversity order is doubled there would be 4 to 5 db
performance improvement.
In the 3rd
region, when the diversity order is doubled there would be 5 to 6 db
performance improvement.

25
Section 6 Comparisons of simulation results
Section 6.1 Performance comparison for single user
Figure 16 The comparison between the performance of DS-CDMA and
OFDM-CDMA
Figure 16 shows the simulation results for DS-CDMA and OFDM-CDMA in which
the processing gain pG of both system is equal to 64 and the utilization of the system is
1 that means only one user is active.
When diversity order is equal to four, OFDM-CDMA perform about 1 db better than
DS-CDMA for 0N
Eb ranging from 4 dB to 10 dB. The performance improvement by
OFDM-CDMA is mainly due to absence of ISI and no cross correlation between the
information signal and the delay copies of the original information i.e.

26
∫ −T
dttctc0
11 )()( τ ( >−< )(),( 11 τtctc )
where )(1 tc is the spreading sequence and τ is the delay with 1 chip length.
When diversity order is equal to two, the three curves are slightly moved upward due
to the less diversity gain. In addition, OFDM-CDMA outperforms DS-CDMA only by
about 0.5 dB. It is because the cross correlation >−< )(),( 11 τtctc is small when
compared to that of diversity order 4 and the ISI effect is also reduced.
At last, it can be seen that the performance for both system is nearly the same when
the diversity order is equal to one. Since in this situation the ISI effects is minimized
and there is no cross correlation between the information signal and its delay. That is
no other paths would provide the copies of the original signal. The trade off is no
diversity gain would be obtained. As a result, even 0N
Eb archives 16 dB. The BER
would only stand at between 10-2
and 10-3
.

27
Section 6.2 Performance comparison for different processing
gain
Figure 17 The comparison between G=64 and G=128 for DS-CDMA
From figure 17, we can see that in DS-CDMA when then processing gain is doubled
the BER performance is improved.
In two users scenario, when processing gain of 128 is employed corresponding to 64,
the improvement would maintain at about 1 dB, 2 dB and 4 dB for 0N
Eb <10 dB, 10
dB<0N
Eb <14 dB and 0N
Eb >16 dB respectively.
In four users and eight users scenario, the performance would further be improved in
which maximum 6 dB improvement can be archived for 0N
Eb >10 dB.
The performance improvement mainly due to the low cross correlation between

28
different users spreading sequences when the spreading factor is increased. And the
increment in processing gain can also spread the interferer power.
The similar results can be found in OFDM-CDMA which is shown by figure 18.
Figure 18 The comparison between G=64 and G=128 for OFDM-CDMA for type A
delay profile
As we can see from figure 18, the spreading factor is critical in OFDM-CDMA
system. Even in two users scenario, spreading factor of 128 would perform 6 dB
better than the spreading factor of 64 for 0N
Eb >10 dB. The improvement would be
more obvious in four users and eight users scenario. We can see that the cross
correlation between different users sequences would be a critical factor.

29
Section 6.3 Performance comparison for multi user with
fixed Processing Gain and Diversity for type A delay profile
Comparison for G=64, D=2
Figure 19 comparison between DS-CDMA and OFDM-CDMA for type A delay
profile with G=64 and D=2
Figure 19 shows the simulation results for DS-CDMA and OFDM-CDMA in which
the processing gain pG of both systems is equal to 64. The diversity order is equal to 2.
The system with utilization for 2, 4 and 8 users would be investigated.
In two user scenario, OFDM-CDMA outperforms DS-CDMA by about 2 dB. There
was no ISI in OFDM-CDMA. In addition, there was no cross correlation between the
information signal and the delay copies of itself. The only factor affects the
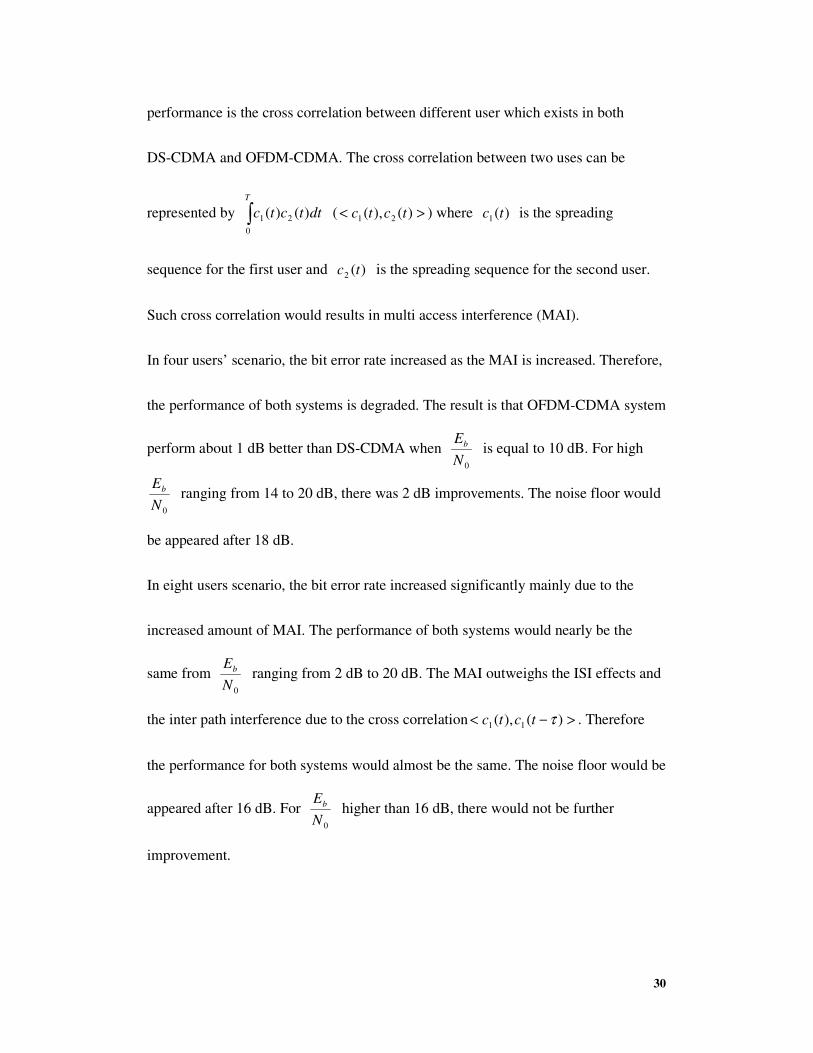
30
performance is the cross correlation between different user which exists in both
DS-CDMA and OFDM-CDMA. The cross correlation between two uses can be
represented by ∫T
dttctc0
21 )()( ( >< )(),( 21 tctc ) where )(1 tc is the spreading
sequence for the first user and )(2 tc is the spreading sequence for the second user.
Such cross correlation would results in multi access interference (MAI).
In four users’ scenario, the bit error rate increased as the MAI is increased. Therefore,
the performance of both systems is degraded. The result is that OFDM-CDMA system
perform about 1 dB better than DS-CDMA when 0N
Eb is equal to 10 dB. For high
0N
Eb ranging from 14 to 20 dB, there was 2 dB improvements. The noise floor would
be appeared after 18 dB.
In eight users scenario, the bit error rate increased significantly mainly due to the
increased amount of MAI. The performance of both systems would nearly be the
same from 0N
Eb ranging from 2 dB to 20 dB. The MAI outweighs the ISI effects and
the inter path interference due to the cross correlation >−< )(),( 11 τtctc . Therefore
the performance for both systems would almost be the same. The noise floor would be
appeared after 16 dB. For 0N
Eb higher than 16 dB, there would not be further
improvement.

31
Comparison for G=64, D=4
Figure 20 comparison between DS-CDMA and OFDM-CDMA for type A delay
profile with G=64 and D=4
Figure 20 shows the simulation results for DS-CDMA and OFDM-CDMA in which
the processing gain pG of both systems is equal to 64. The diversity order is equal to 4.
The system with utilization for 2, 4 and 8 users would be investigated.
In two users’ scenario, both OFDM-CDMA and DS-CDMA exploit the diversity
combining to obtain performance improvement. For 0N
Eb ranging from 2 dB to 20
dB OFDM-CDMA perform about 1 dB better than DS-CDMA.
In four users’ scenario, OFDM-CDMA outperforms DS-CDMA by 1 dB for 0N
Eb
ranging from 2 dB to 14 dB. The noise floor would be appeared after 0N
Eb =16 dB.
In eight users’ scenario, the performance for both system is similar due to the
increased amount of MAI. And the noise floor would be started at 14 dB.

32
Comparison for G=128, D=2
Figure 21 comparison between DS-CDMA and OFDM-CDMA for type A delay
profile with G=128 and D=2
Figure 21 shows the simulation results for DS-CDMA and OFDM-CDMA in which
the processing gain pG of both systems is equal to 128. The diversity order is equal
to 2. The system with utilization for 2, 4 and 8 users would be investigated.
In two users scenario, as discussed before the performance for both system would be
improved when compared to 64=pG with same diversity order. For 0N
Eb <10 dB,
OFDM-CDMA outperforms DS-CDMA by about 1 dB. For 0N
Eb >10 dB,
OFDM-CDMA outperforms DS-CDMA by about 2 dB. There is no ISI effects and
inter path interference in OFDM-CDMA, therefore the performance is improved.

33
In four users’ scenario, the similar results would be found. The 1 dB performance
improvement can be found for 0N
Eb <10 dB and 2 dB performance improvement for
0N
Eb >10 dB. Notice that no noise floor would be found for 0N
Eb <20 dB.
In eight users’ scenario, it can be seen that the results are agreed to the two users and
four users scenario. The effects of MAI can not totally outweigh the effects of ISI and
the inter path interference.

34
Comparison for G=128, D=4
Figure 22 comparison between DS-CDMA and OFDM-CDMA for type A delay
profile with G=128 and D=4
Figure 22 shows the simulation results for DS-CDMA and OFDM-CDMA in which
the processing gain pG of both systems is equal to 128. The diversity order is equal to
4. The system with utilization for 2, 4 and 8 users would be investigated.
In two users’ scenario, the results are similar to that when the diversity order is equal
to two with the same number of active users.
In four users scenario, OFDM-CDMA perform 1 dB better than DS-CDMA system
for 0N
Eb <12 dB and 2 dB improvement for 0N
Eb >12 dB.
In eight users scenario, the performance for both system is very similar to each other
for 0N
Eb <10 dB. The noise floor would be appeared at about 16 dB at which the BER
= 10-3
.

35
Section 6.4 Performance comparison for multi user with
fixed Processing Gain and Diversity for type B delay profile
Comparison for G=64, D=2
Figure 23 comparison between DS-CDMA and OFDM-CDMA for type B delay
profile with G=64 and D=2
From figure 23, we can see that OFDM-CDMA perform better than DS-CDMA after
v>6 dB with diversity order equal to 2 and the processing gain is fixed to 64.
When c is small, the performance is affected by the Gaussian Noise and the
performance of both systems would be close to each other.
After 6 dB, the performance is affected by the inter path interference and the ISI. As a
result, for two users and four users scenario, OFDM-CDMA outperforms DS-CDMA

36
by about 1 dB for 0N
Eb >10 dB.
The MAI effects would become dominant when the number of active users increased,
therefore for eight users scenario the performance of both systems would be similar.
The noise floor for both systems would be appeared at 16 dB.
Comparison for G=64, D=4
Figure 24 comparison between DS-CDMA and OFDM-CDMA for type B delay
profile with G=64 and D=2
The general trend of the performance for both systems would follow to those results
when the delay profile A is applied except that the performance would be even better.
It can be verified by the two users’ scenario. The BER can archive 10-4
when 0N
Eb =11
dB for OFDM-CDMA system. The case is also valid for DS-CDMA system in which

37
the BER can archive 10-4
when 0N
Eb is almost 12 dB.
Comparison for G=128, D=2
Figure 25 comparison between DS-CDMA and OFDM-CDMA for type B delay
profile with G=128 and D=2
From figure 25, OFDM-CDMA performs 2 dB better than DS-CDMA for high SNR
for using type B delay profile. The results hold for when the diversity order is
increased to 4. It can be shown by figure 26

38
Figure 26 comparison between DS-CDMA and OFDM-CDMA for type B delay
profile with G=128 and D=4
From figure 26, we can see OFDM-CDMA perform about 2 dB better than
DS-CDMA when the SNR is high. At the eight users scenario, even the MAI effects
cannot totally outweighs the effect of ISI and the inter path interference. The
performance for both systems would be improved for using type B delay profile rather
than using type A.
39
Section 7
Conclusions
Two multiple access schemes DS-CDMA and OFDM-CDMA have been compared
for the uplink synchronized communication over slow Rayleigh fading channel. Both
systems will apply MRC. The analytical results are confirmed by simulation results. A
performance comparison of the DS-CDMA system and the OFDM-CDMA system
shows that for a low number of active users OFDM-CDMA outperforms DS-CDMA
by about 2 dB. However, with an increasing number of active users both systems
perform similarly due to the increased amount of MAI.

40
References
[1] Thomas Wharton., “Multiuser detection,” Cambridge University
Press., pp. 4-10, 1998.
[2] Theodore S. Rappaport., “Wireless Communications Principles and
Practice,” Prentice Hall., p. 209.
[3] Savo Glisic, Branka Vucetic., “Spread Spectrum CDMA Systems for
Wireless Communications,” Artech House Publishers., p. 237.
[4] L Hanzo, M. Munster, B. J. Choi, T. Keller, “OFDM and MC-CDMA
for Broadband Multi-User Communications, Wlans and Broadcasting,”
Wiley., p. 33.
[5] L Hanzo, M. Munster, B. J. Choi, T. Keller, “OFDM and MC-CDMA
for Broadband Multi-User Communications, Wlans and Broadcasting,”
Wiley., pp. 27-29.
[6] L Hanzo, M. Munster, B. J. Choi, T. Keller, “OFDM and MC-CDMA
for Broadband Multi-User Communications, Wlans and Broadcasting,”
Wiley., p. 41.
[7] L Hanzo, M. Munster, B. J. Choi, T. Keller, “OFDM and MC-CDMA
for Broadband Multi-User Communications, Wlans and Broadcasting,”
Wiley., pp. 250-251.
[8] Savo Glisic, Branka Vucetic., “Spread Spectrum CDMA Systems for
Wireless Communications,” Artech House Publishers., pp. 237-239.